The uploaded PowerPoint file, **"Part I - ch-1 GIS Lesson.pptx,"** is an **introduction to geographic information systems (GIS)** presentation. It covers:
### **Key Topics:**
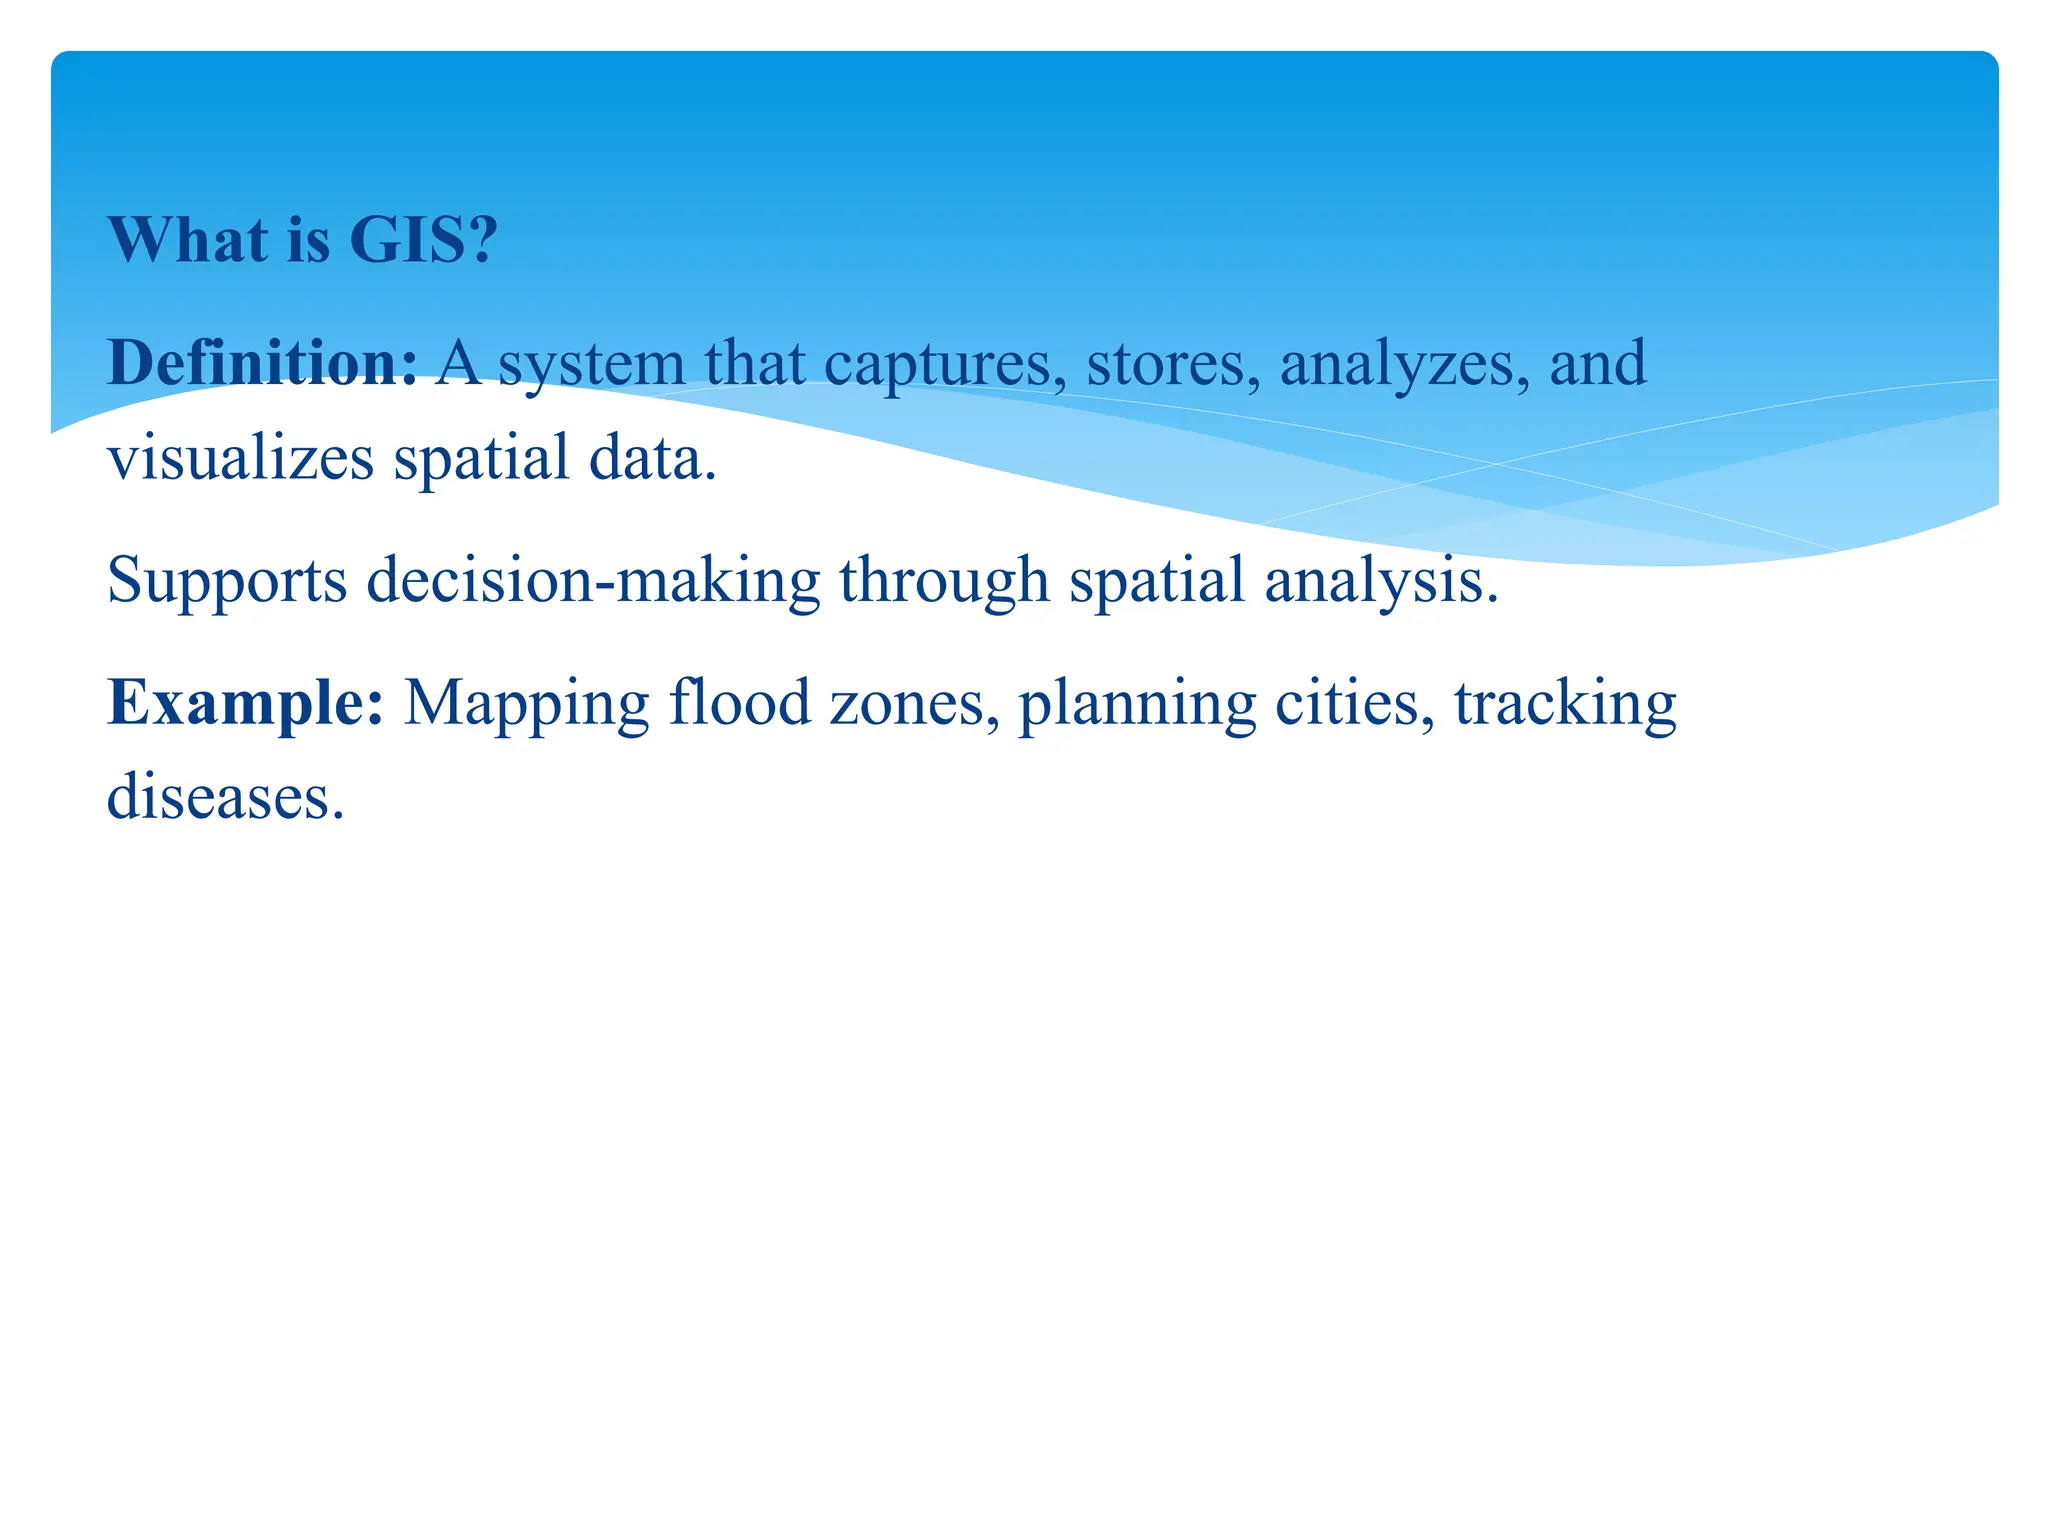
1. **Definition of GIS**
- A system that captures, stores, analyzes, and visualizes spatial data for decision-making.
- Example: Mapping flood zones, urban planning, disease tracking.
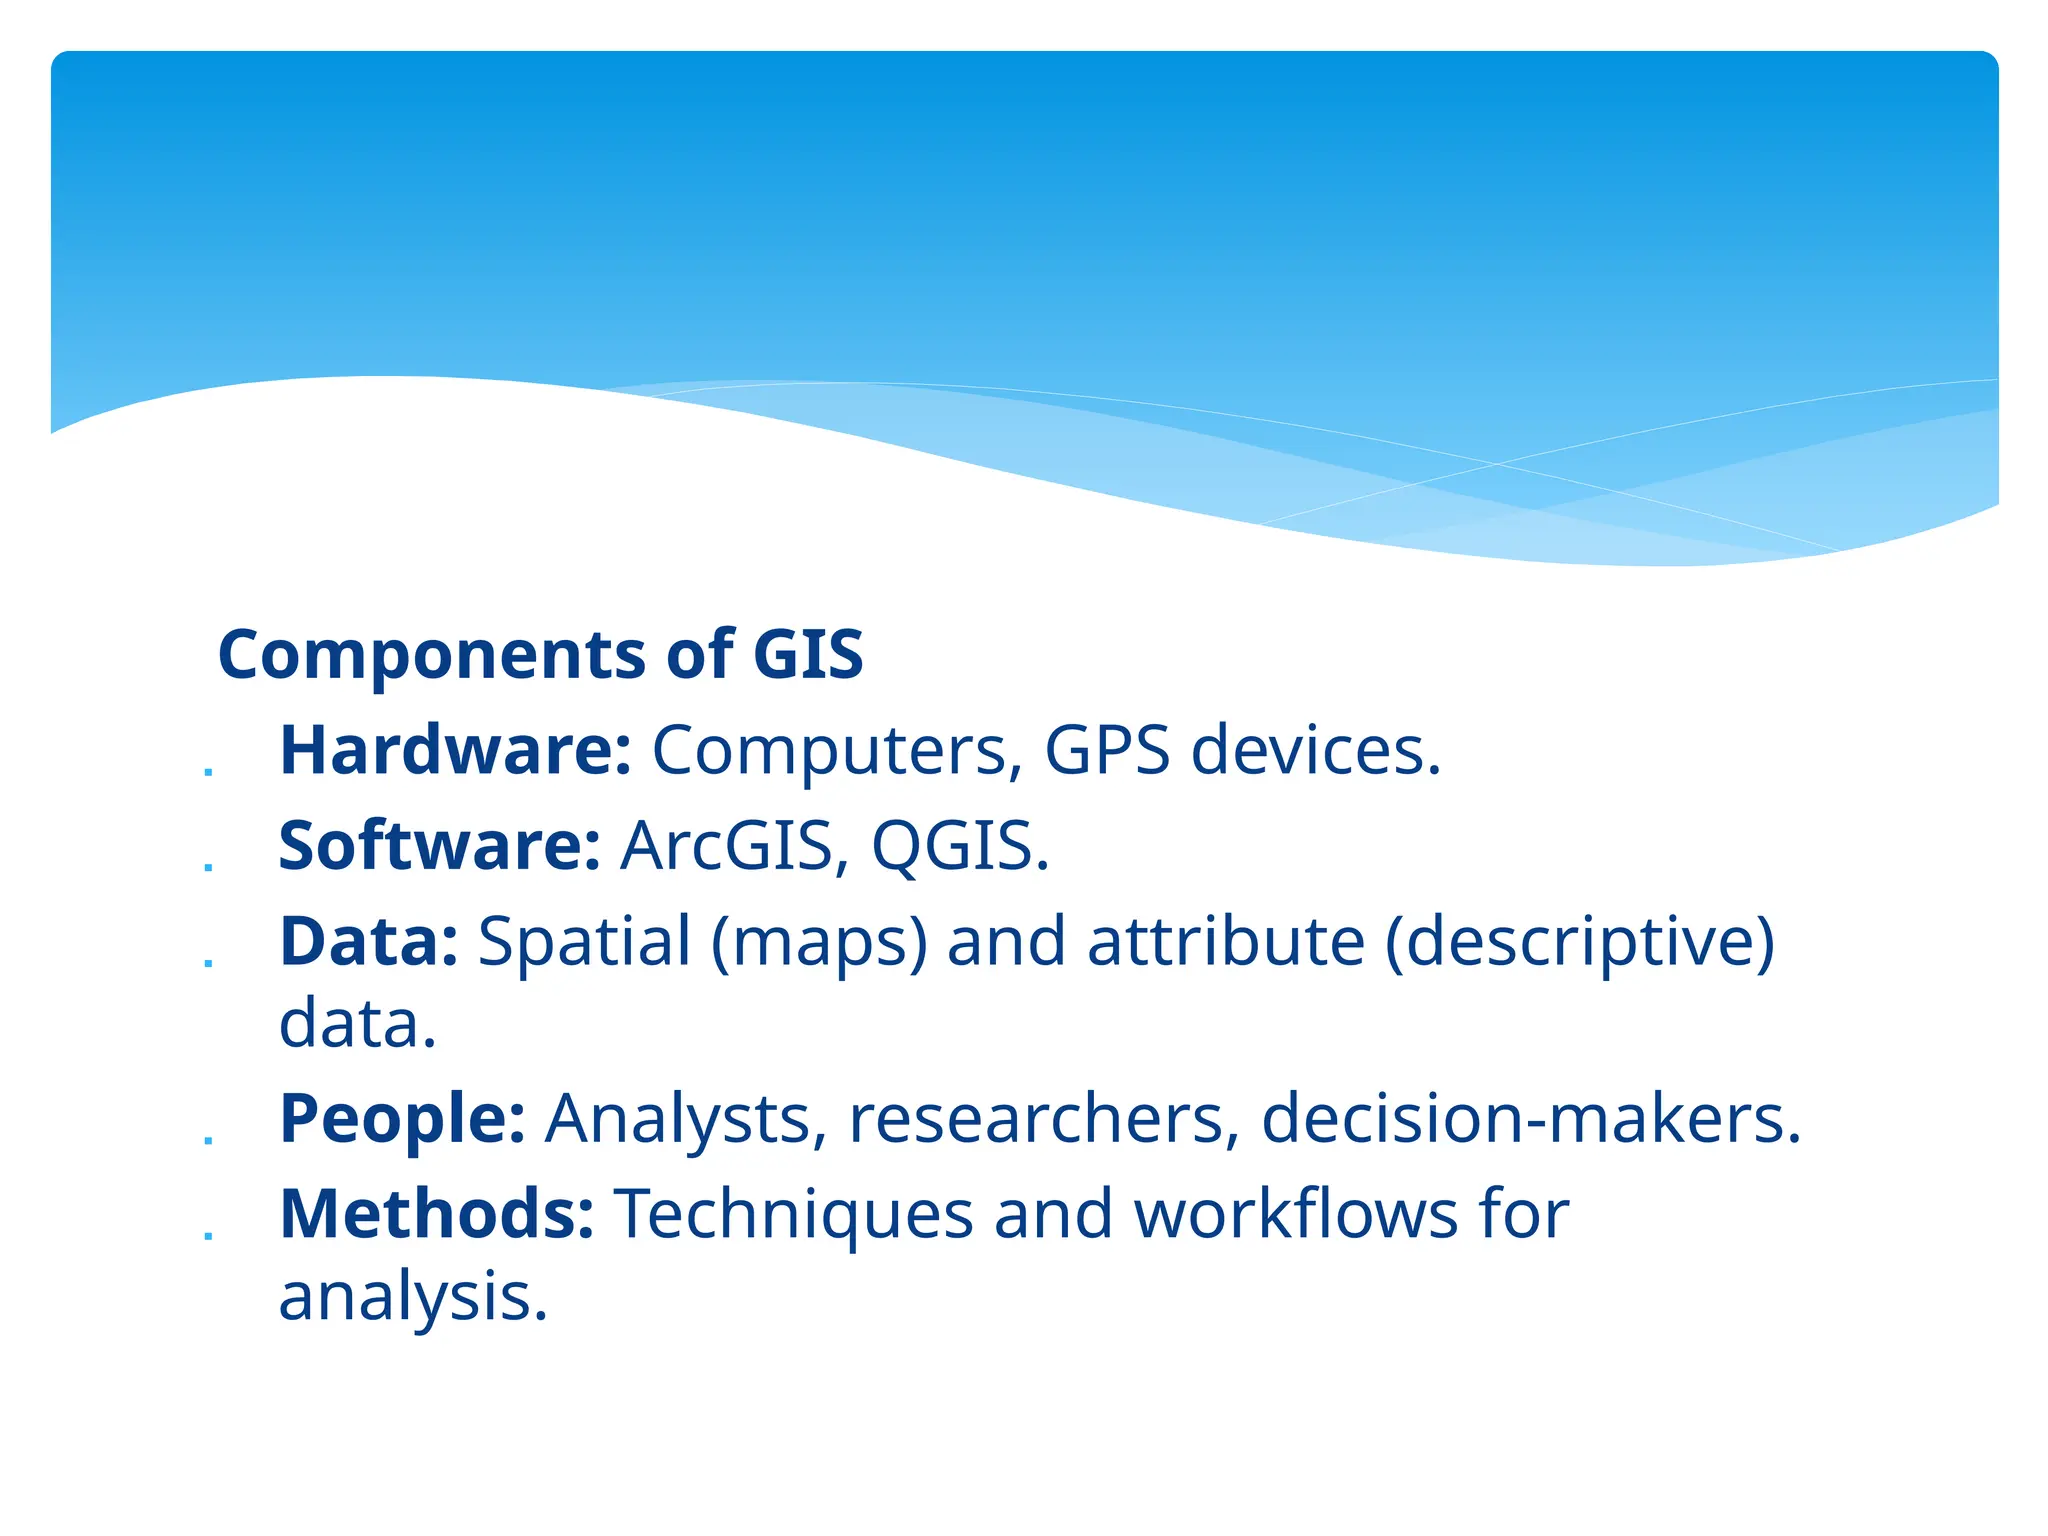
2. **Components of GIS**
- **Hardware**: Computers, GPS devices
- **Software**: ArcGIS, QGIS
- **Data**: Spatial (maps) and attribute (descriptive) data
- **People**: GIS analysts, researchers, decision-makers
- **Methods**: Techniques for spatial analysis
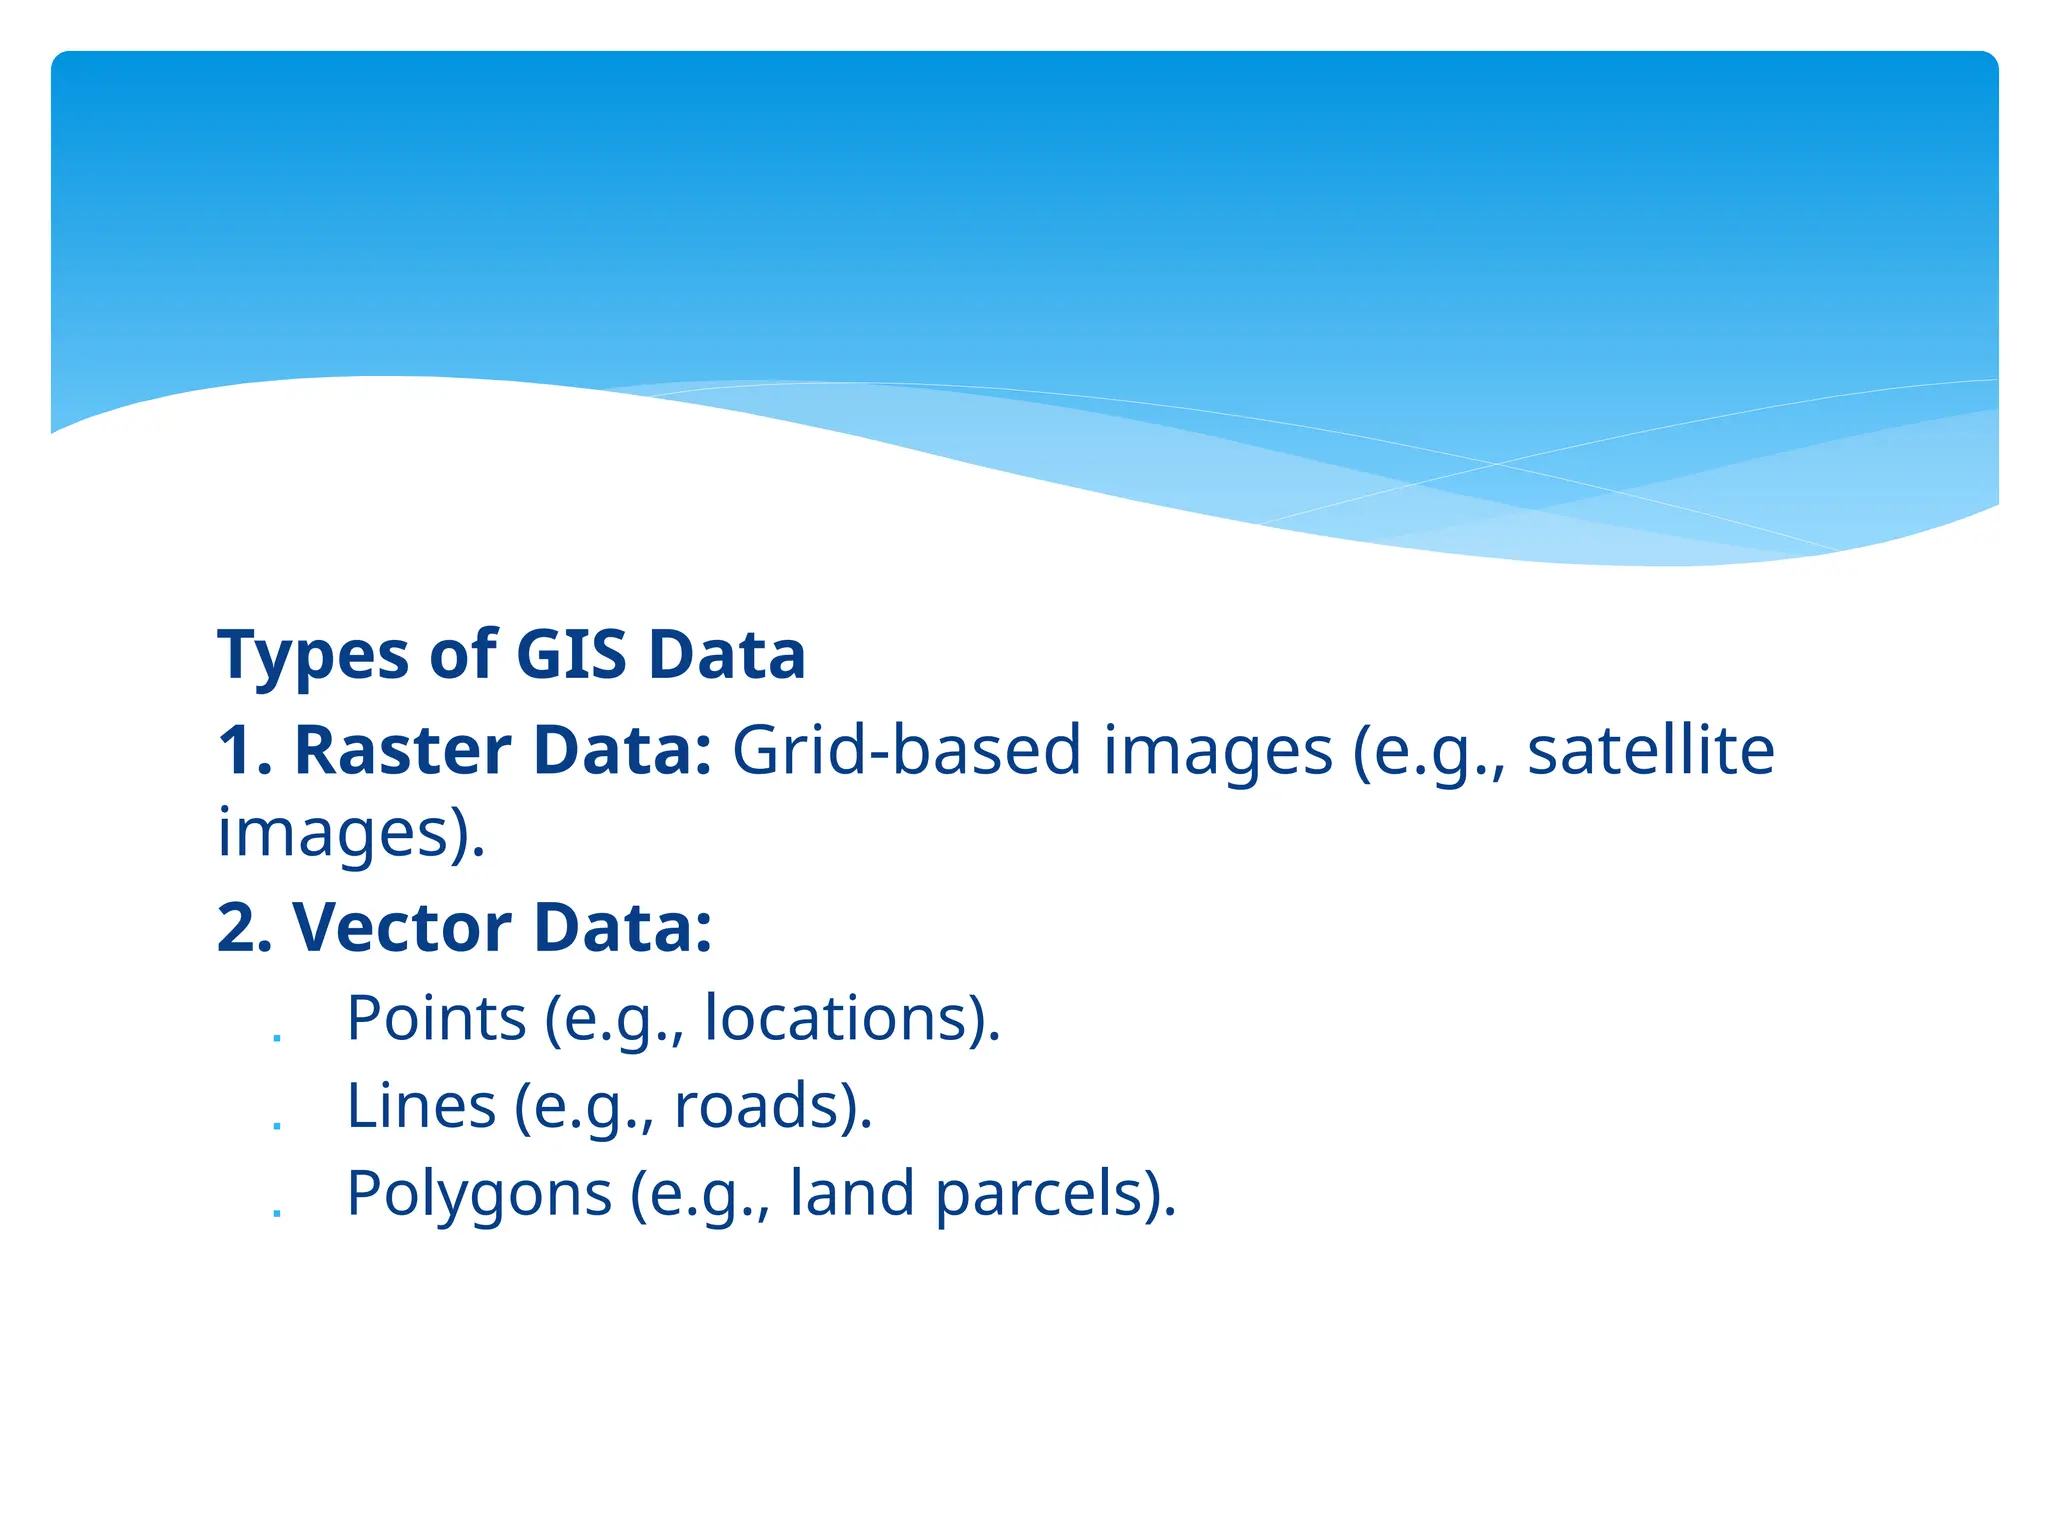
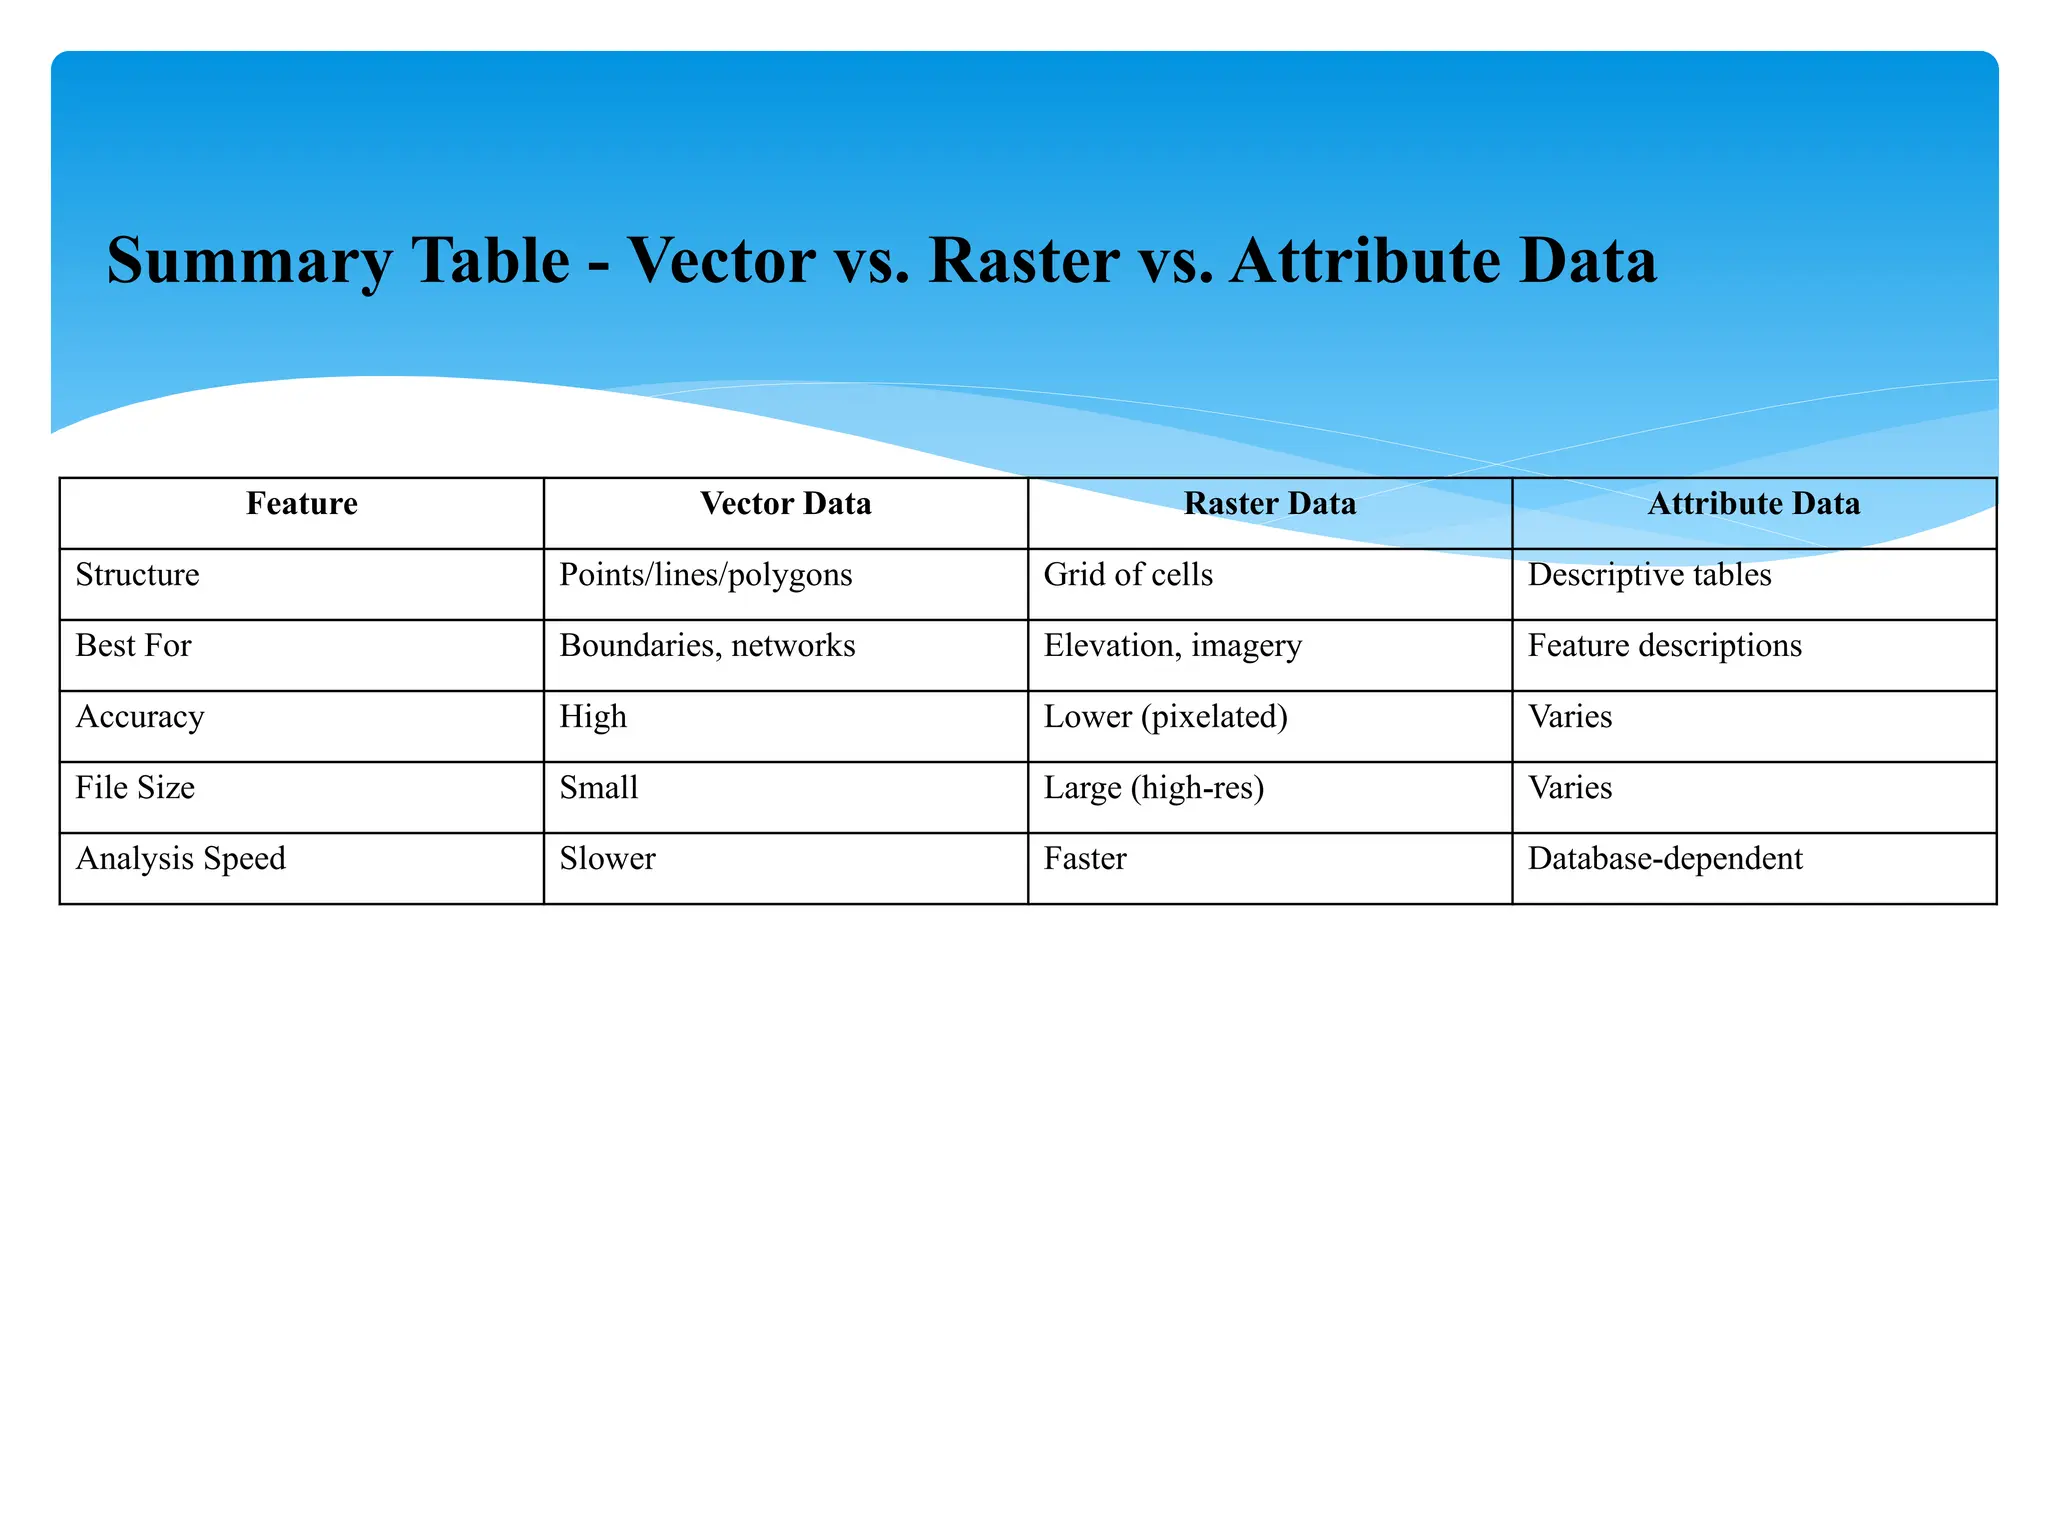
3. **Types of GIS Data**
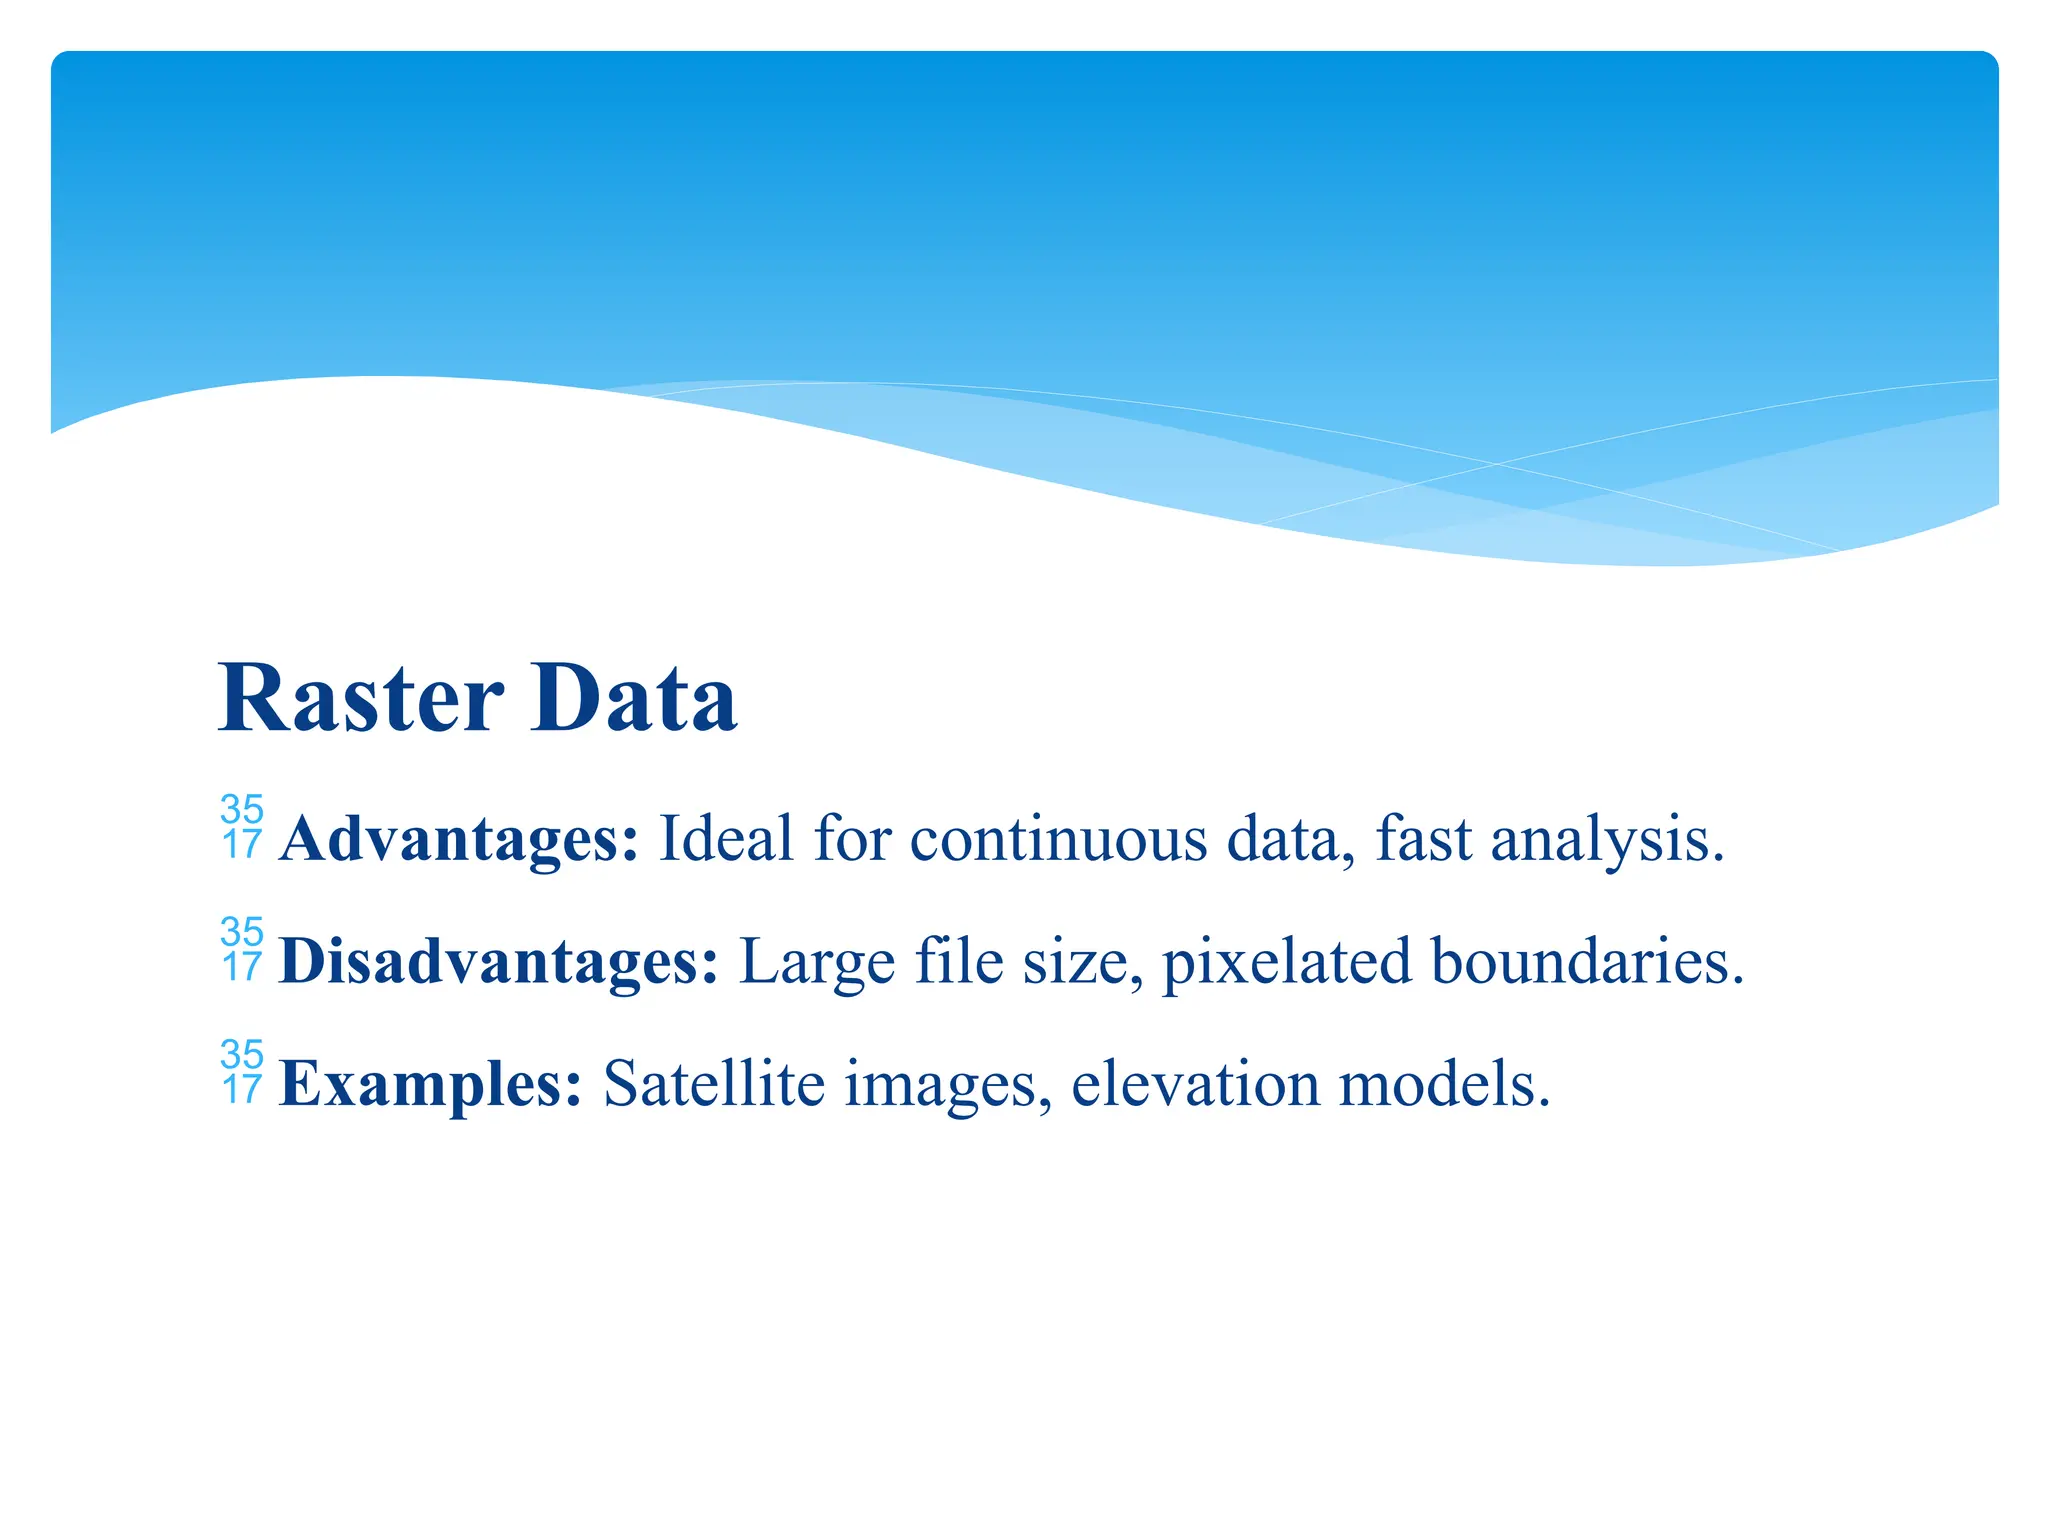
- **Raster Data**: Grid-based images (e.g., satellite images)
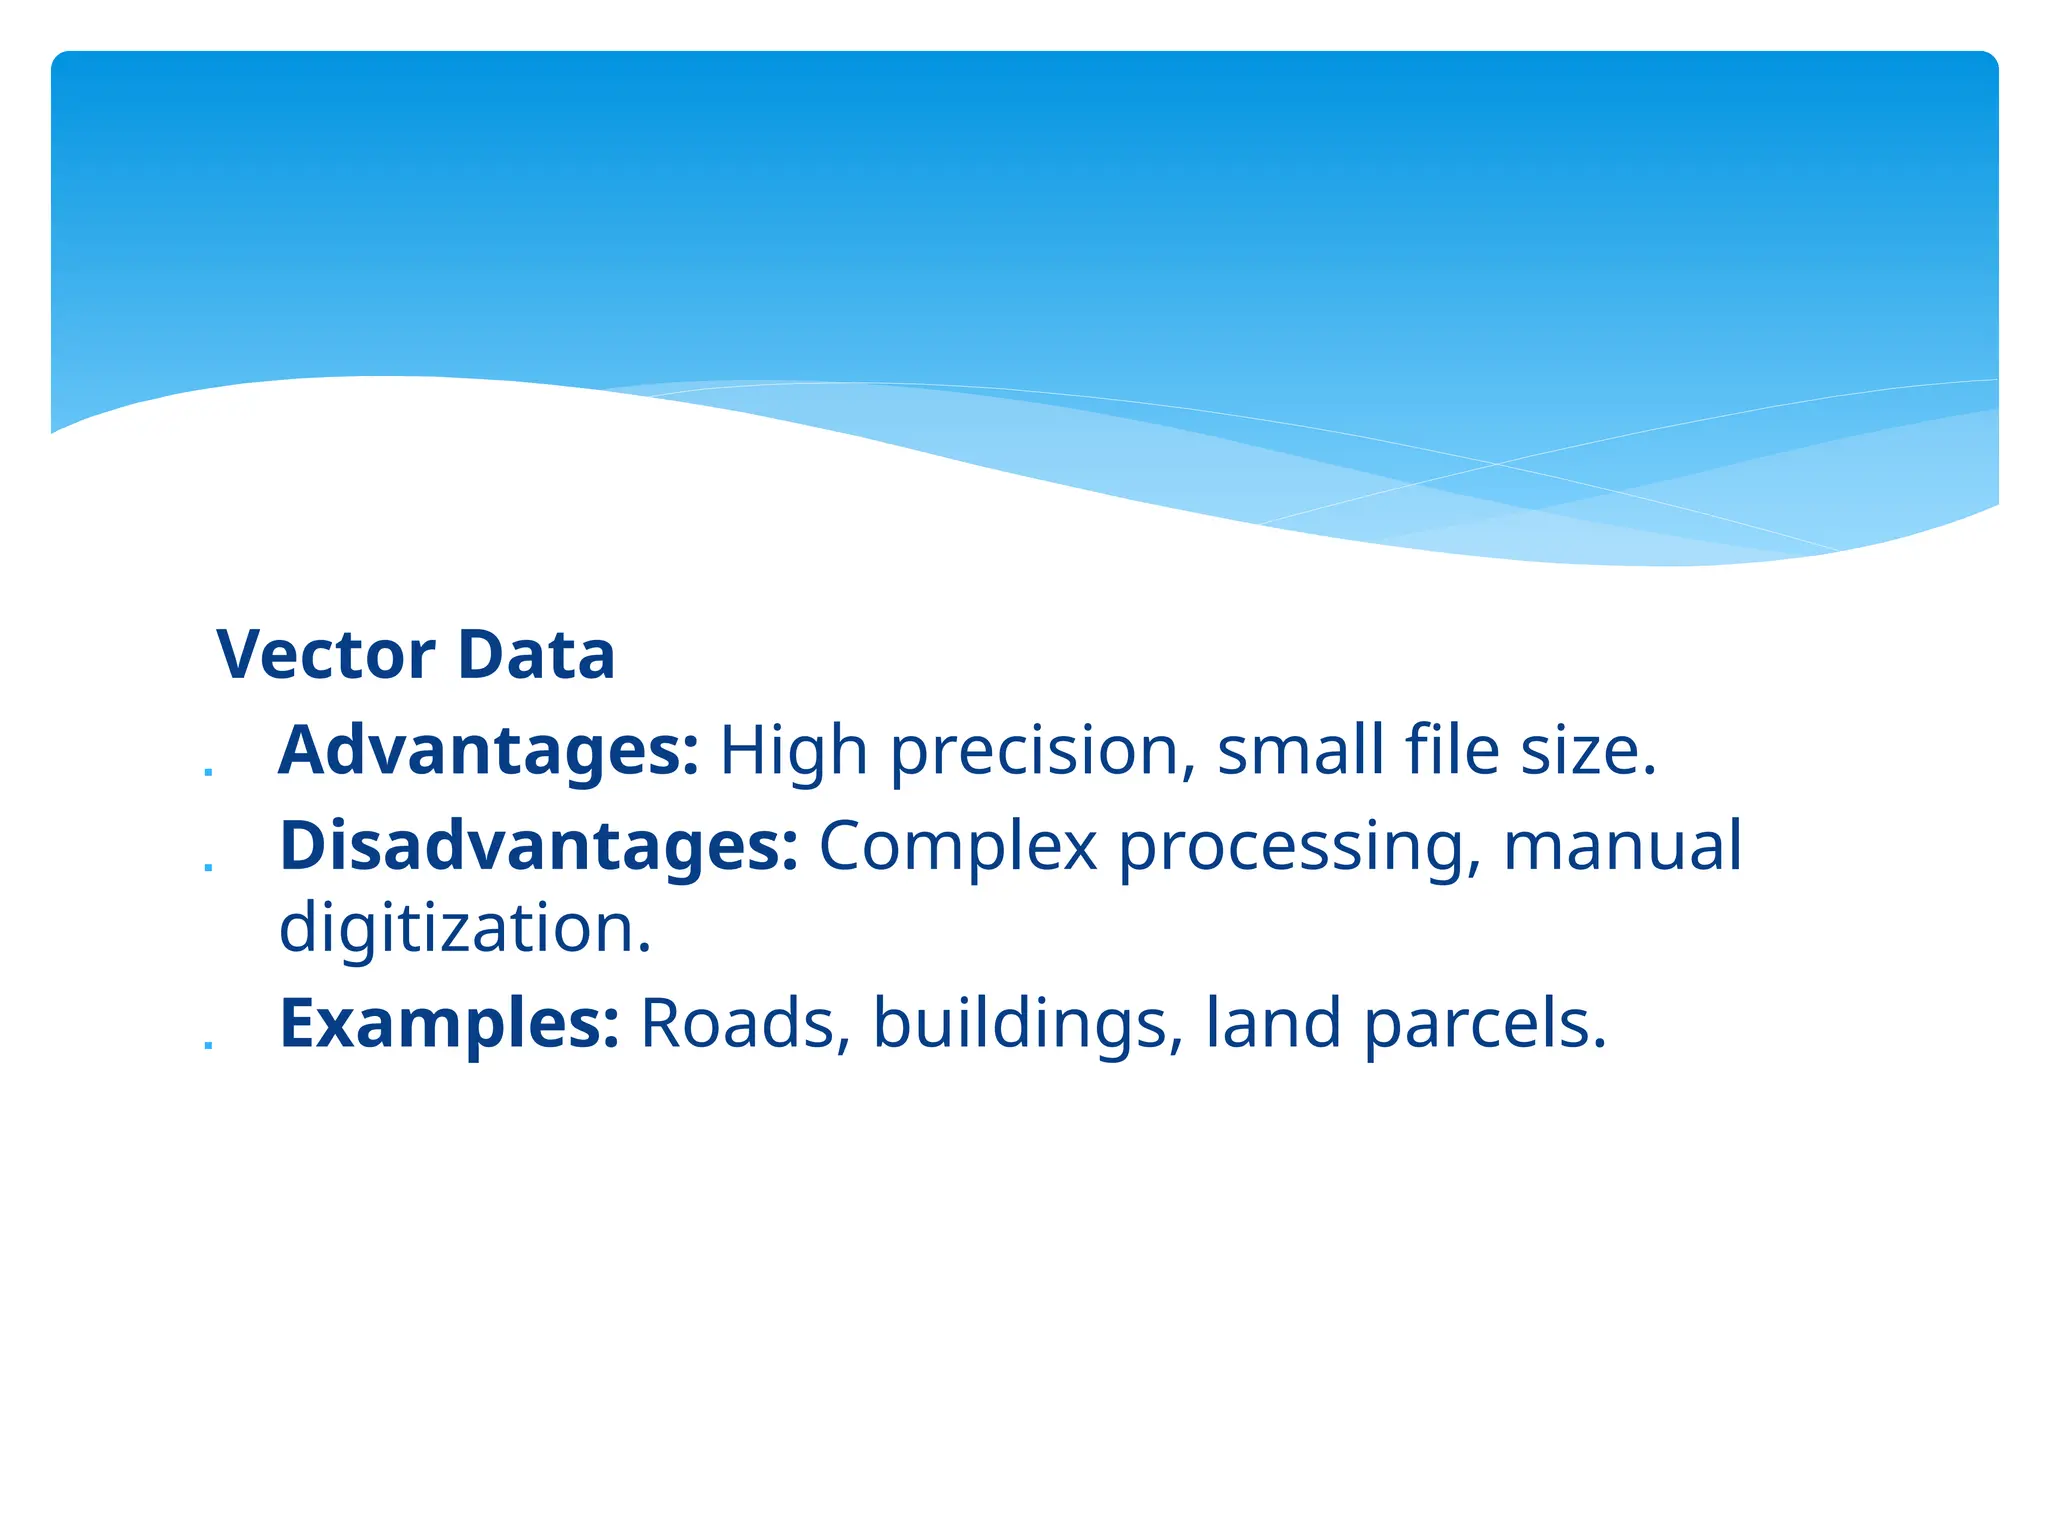
- **Vector Data**: Points (e.g., locations), Lines (e.g., roads), Polygons (e.g., land parcels)
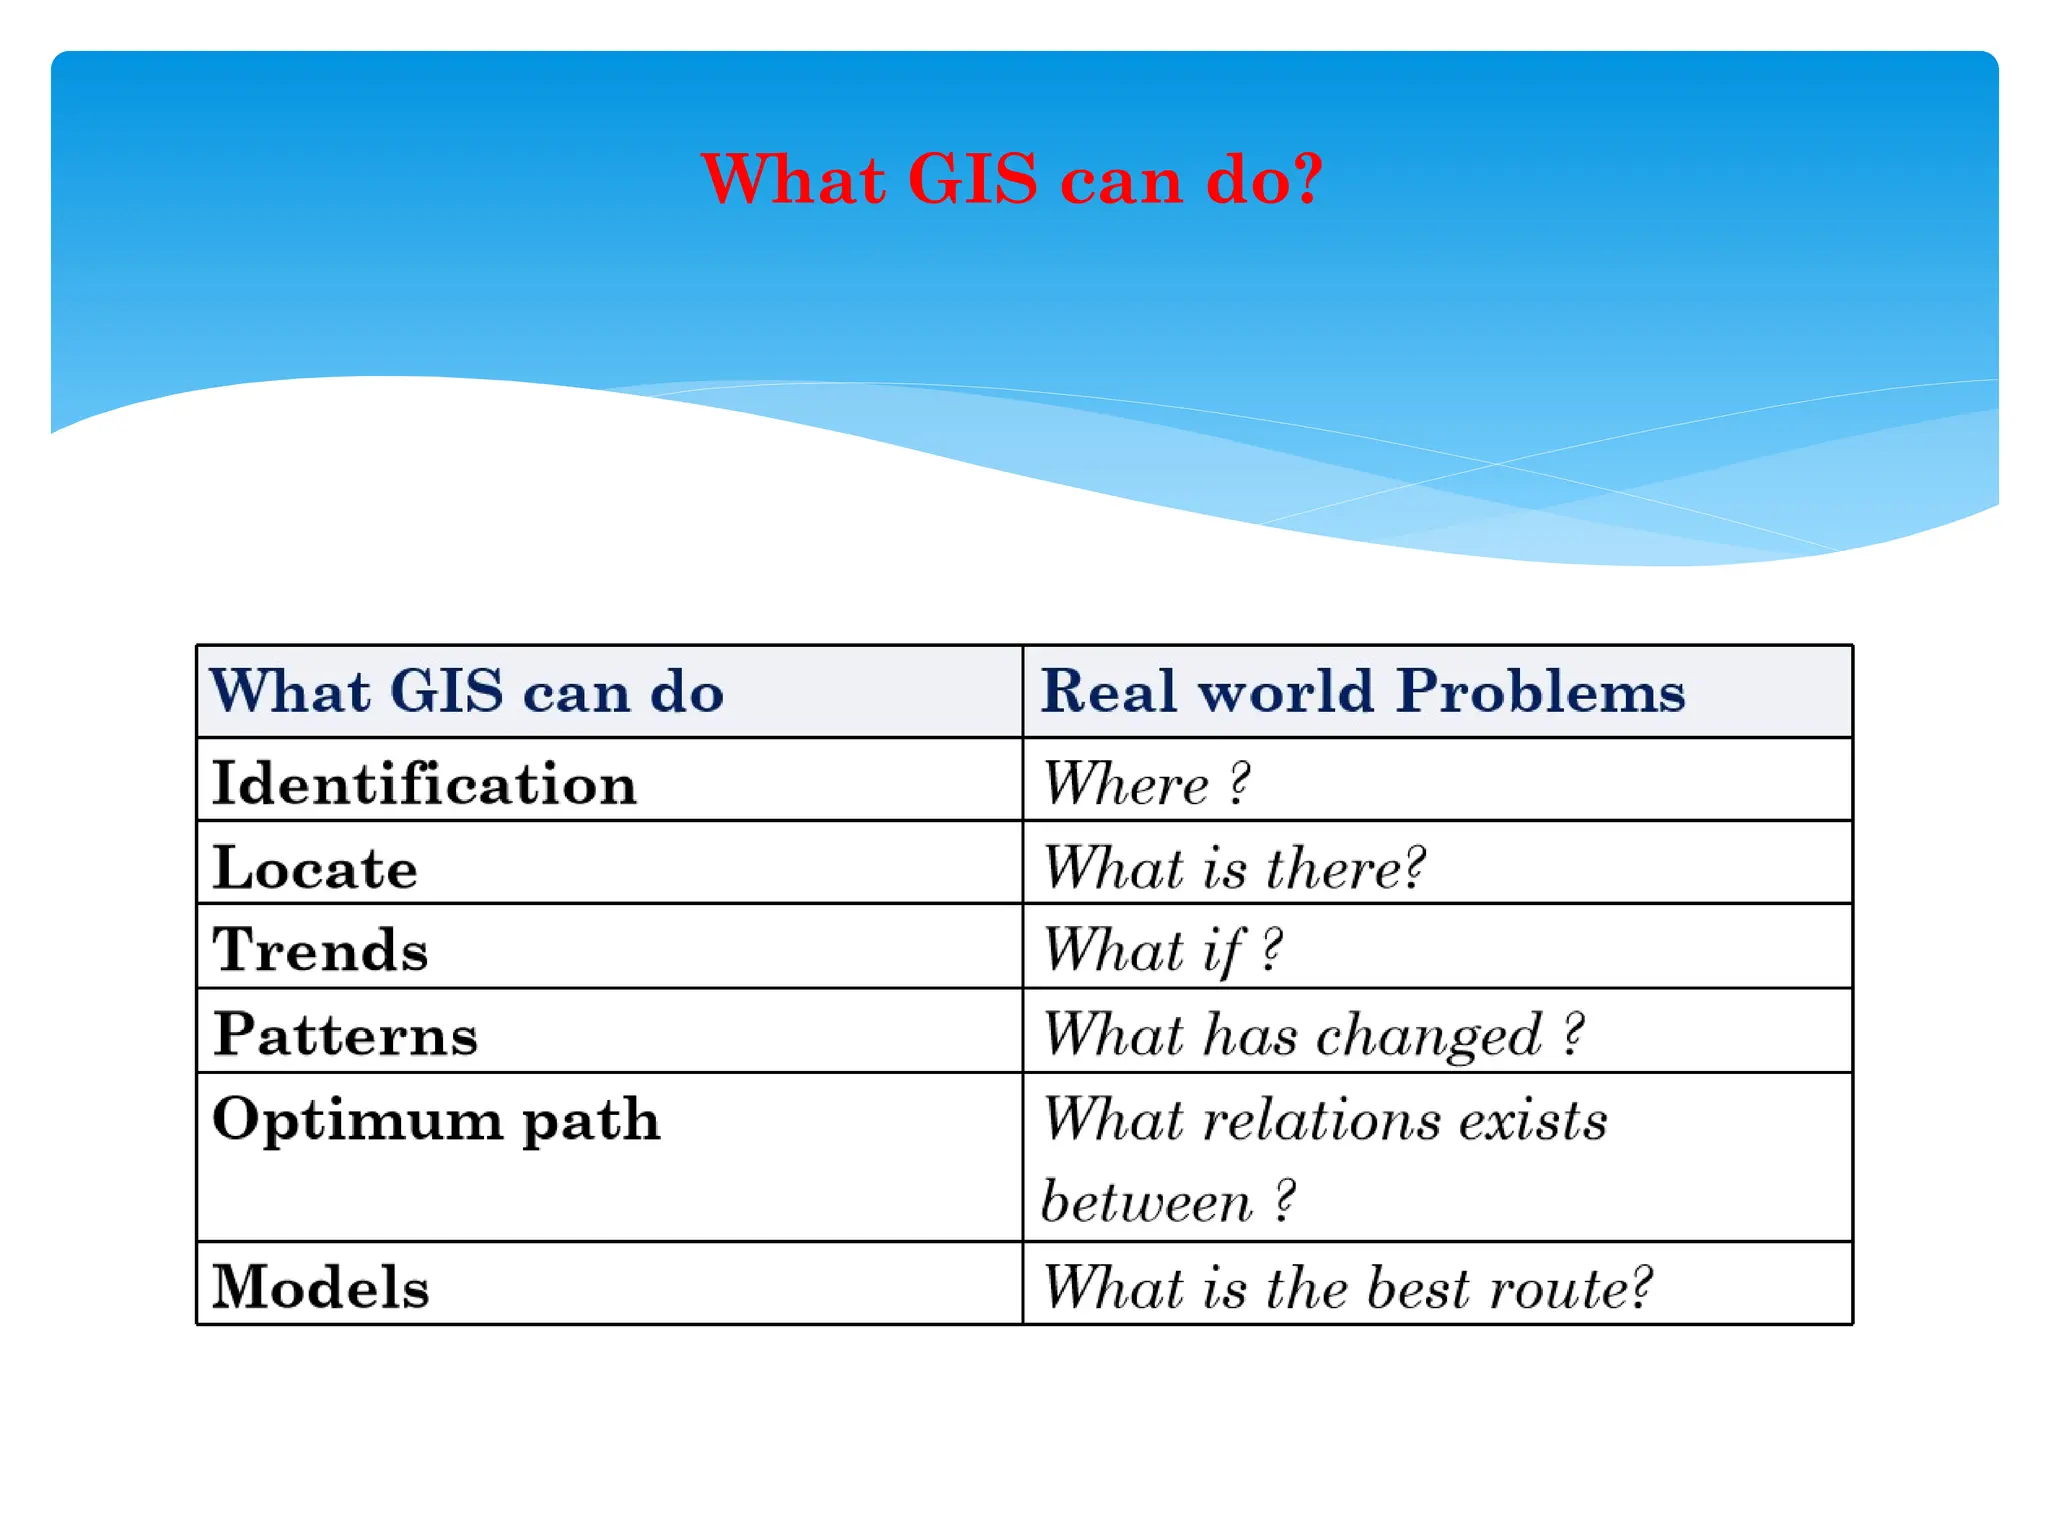
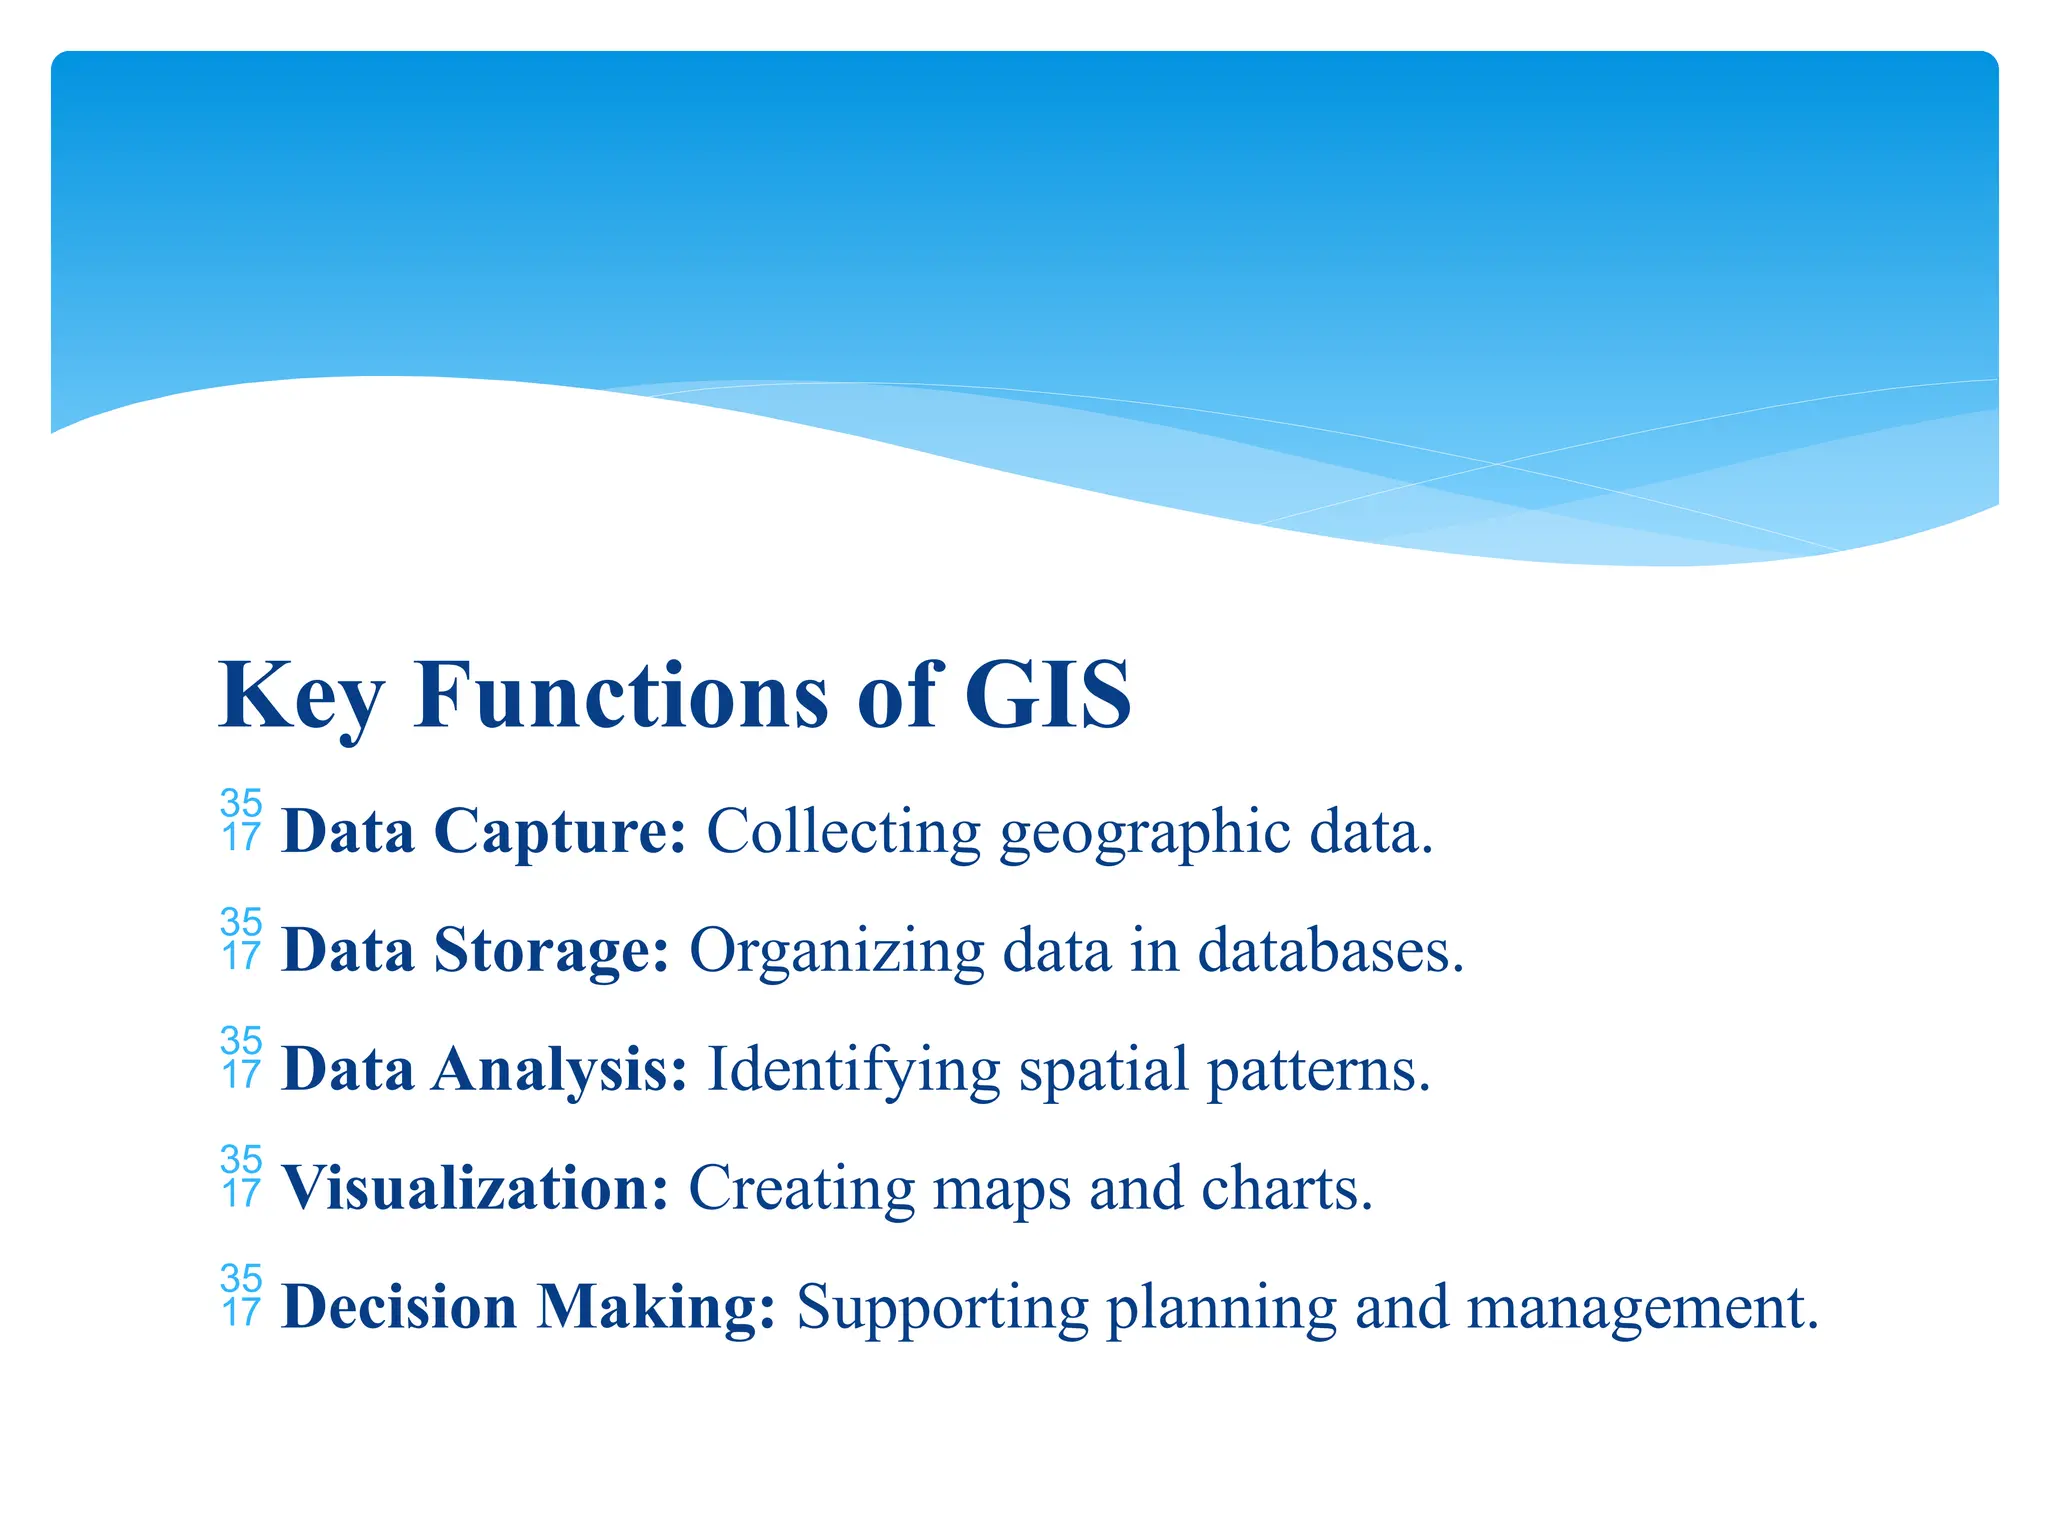
4. **Key GIS Functions**
- **Data Capture**: Collecting geographic data
- **Data Storage**: Organizing data in databases
- **Data Analysis**: Identifying spatial patterns
- **Visualization**: Creating maps and charts
- **Decision-Making**: Supporting urban planning and resource management
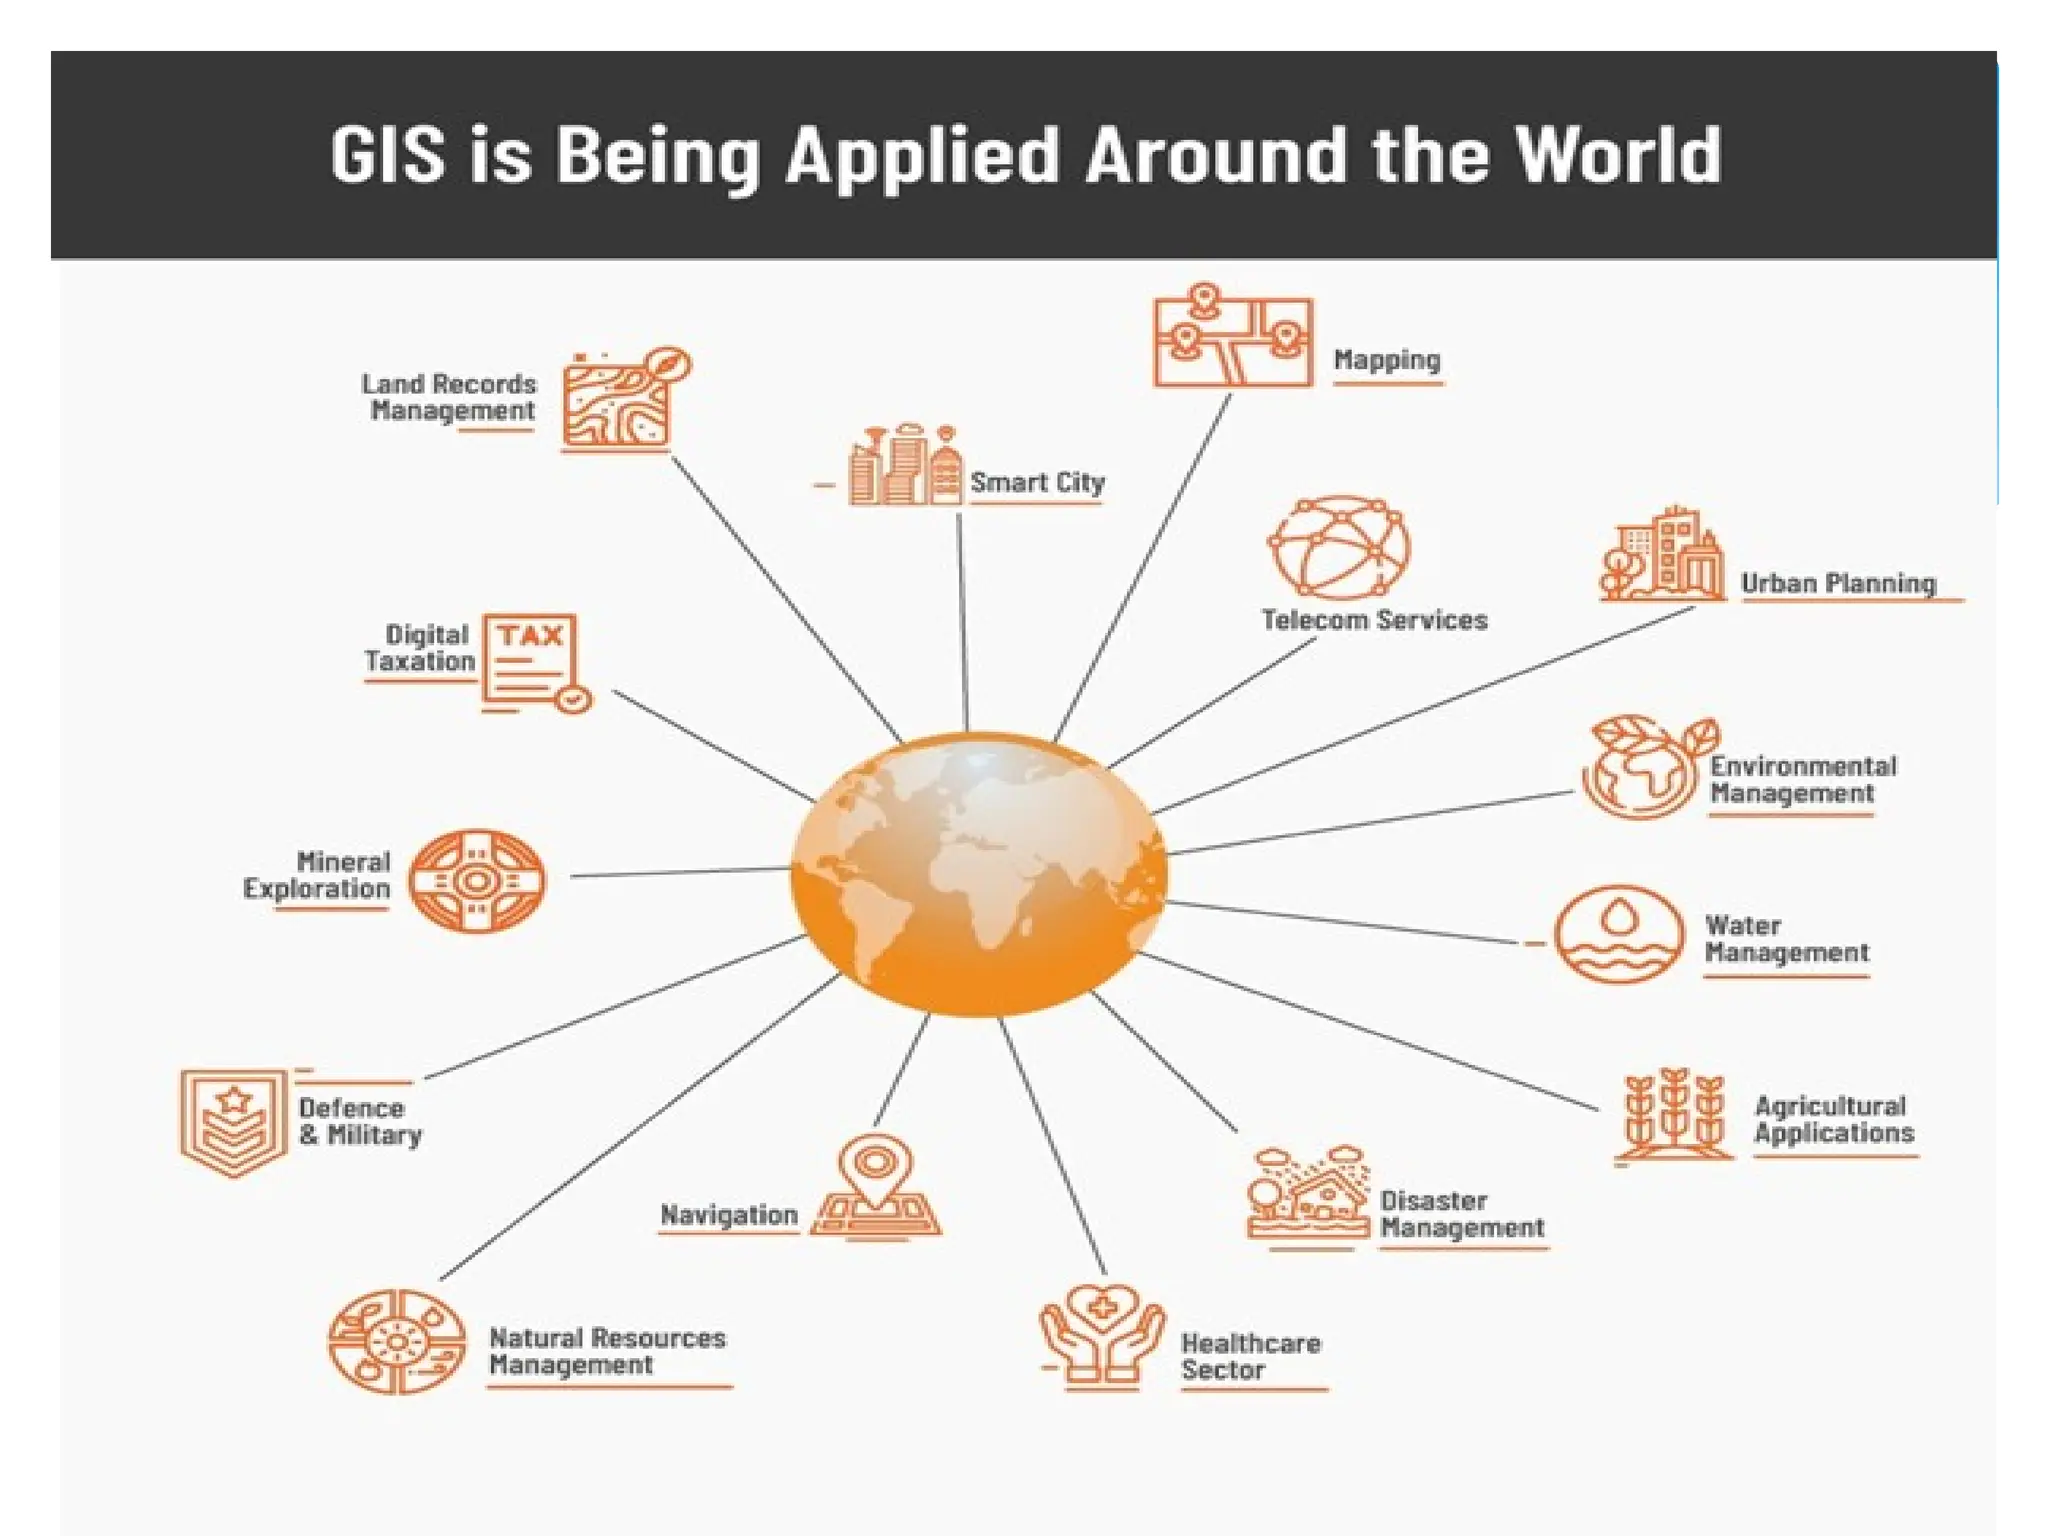
5. **GIS Applications**
- **Urban Planning**: Infrastructure management
- **Environmental Management**: Ecosystem monitoring
- **Disaster Management**: Flood and earthquake mapping
- **Agriculture**: Precision farming, crop monitoring
- **Health**: Disease tracking and healthcare accessibility
6. **Key GIS Concepts**
- **Spatial Data**: Geographic data with coordinates
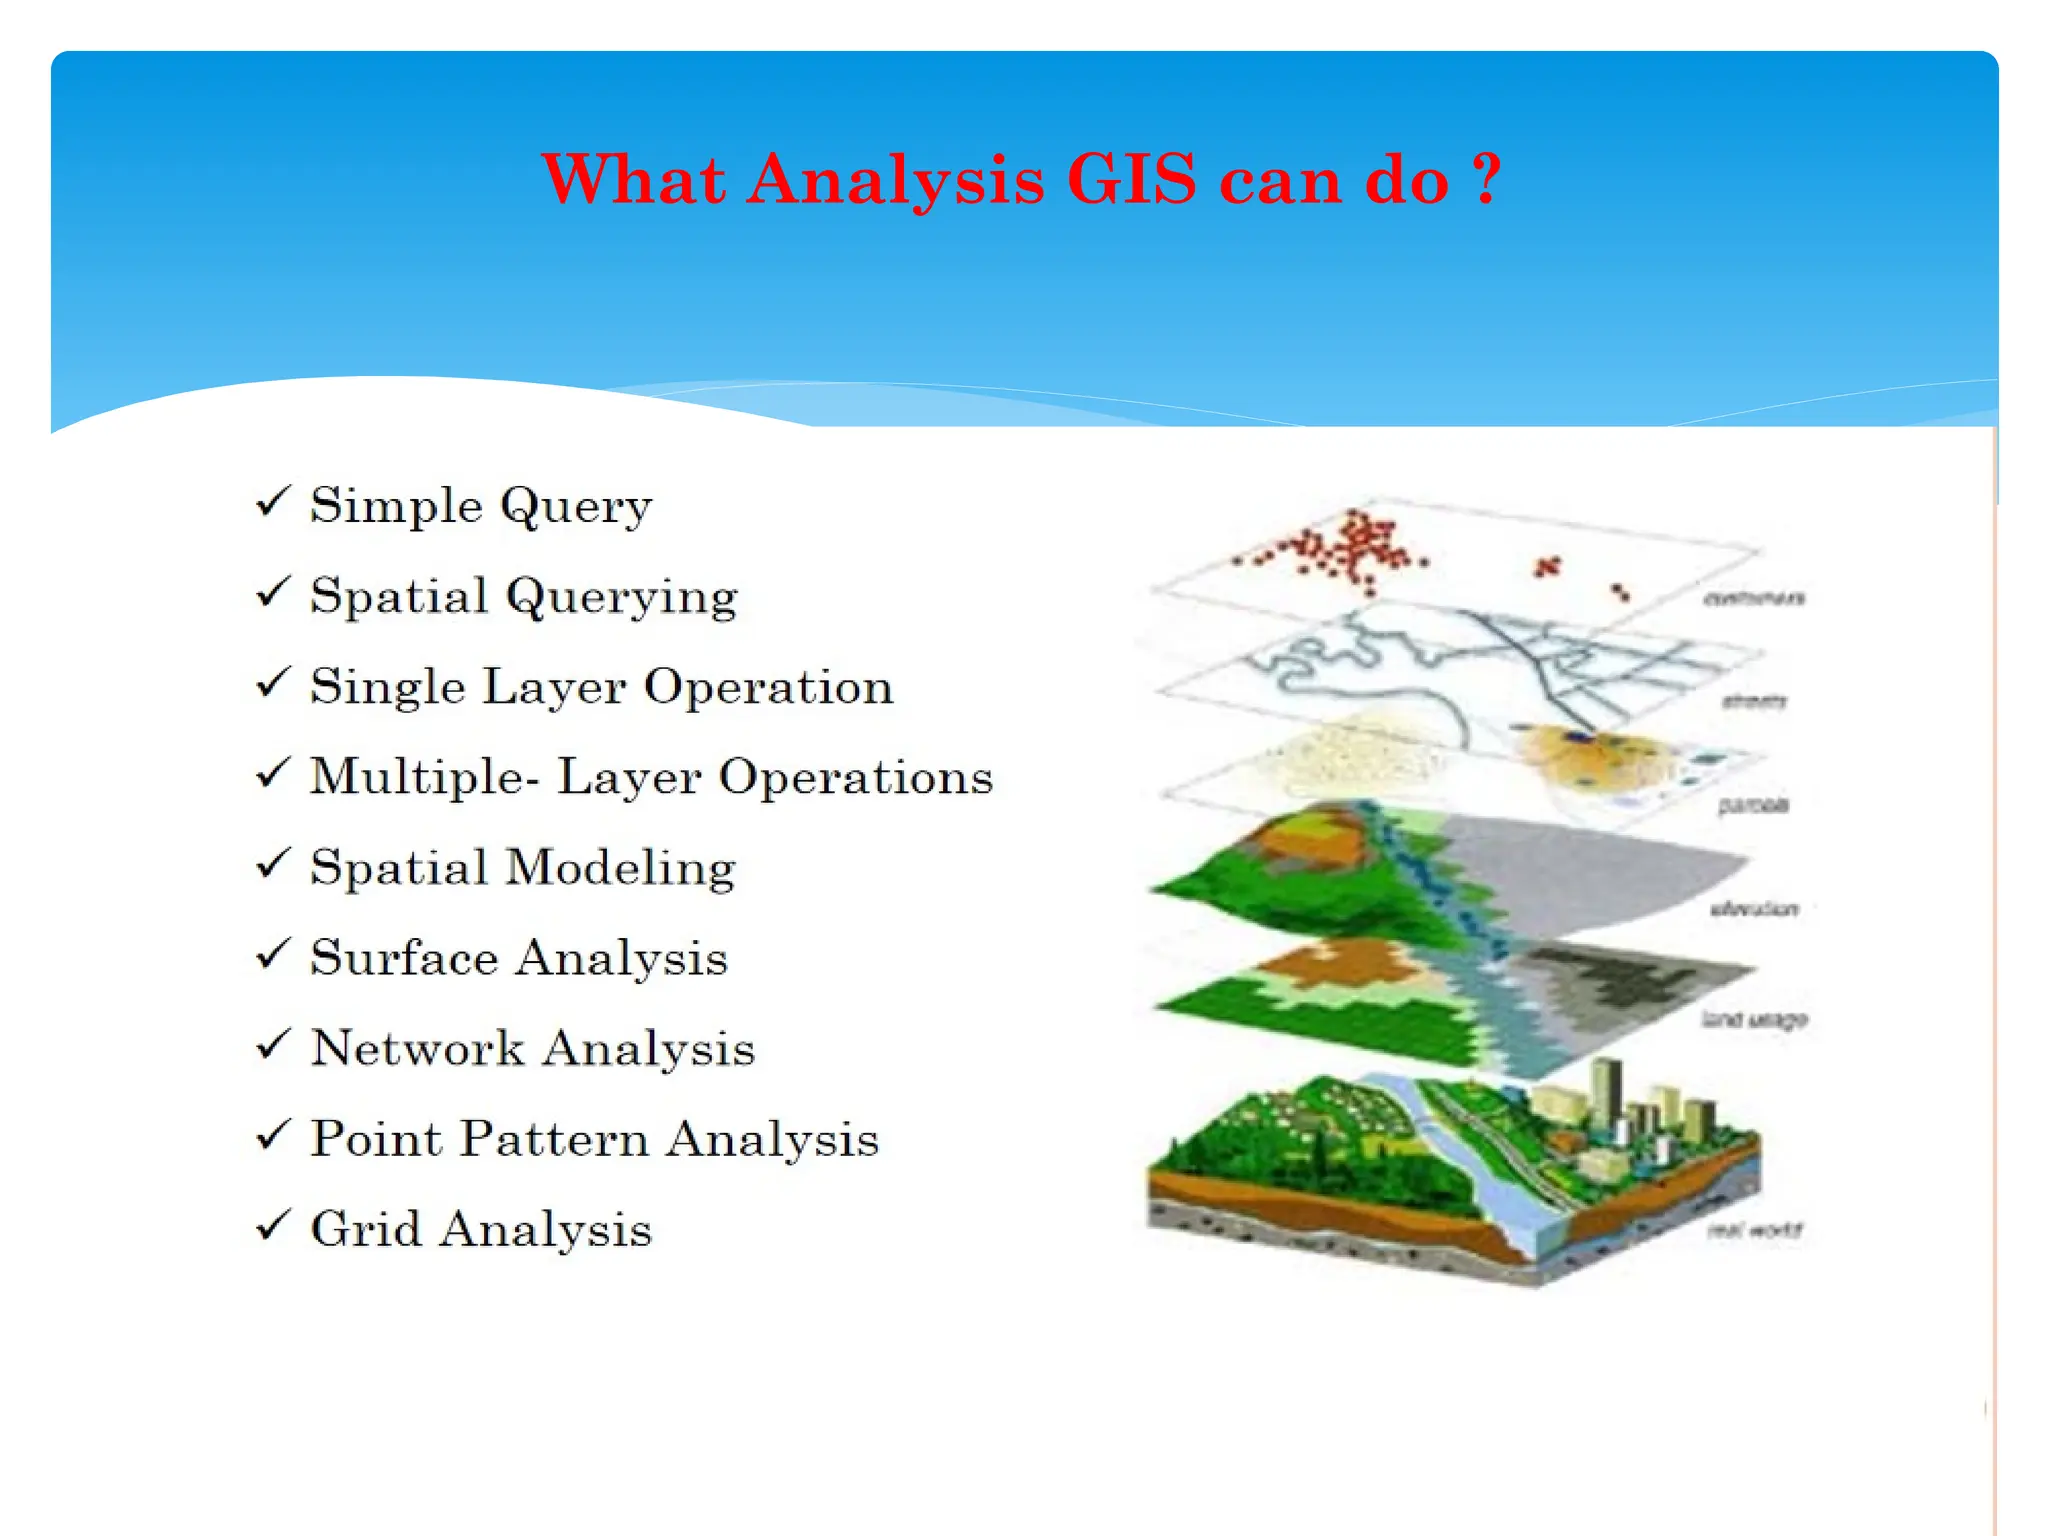
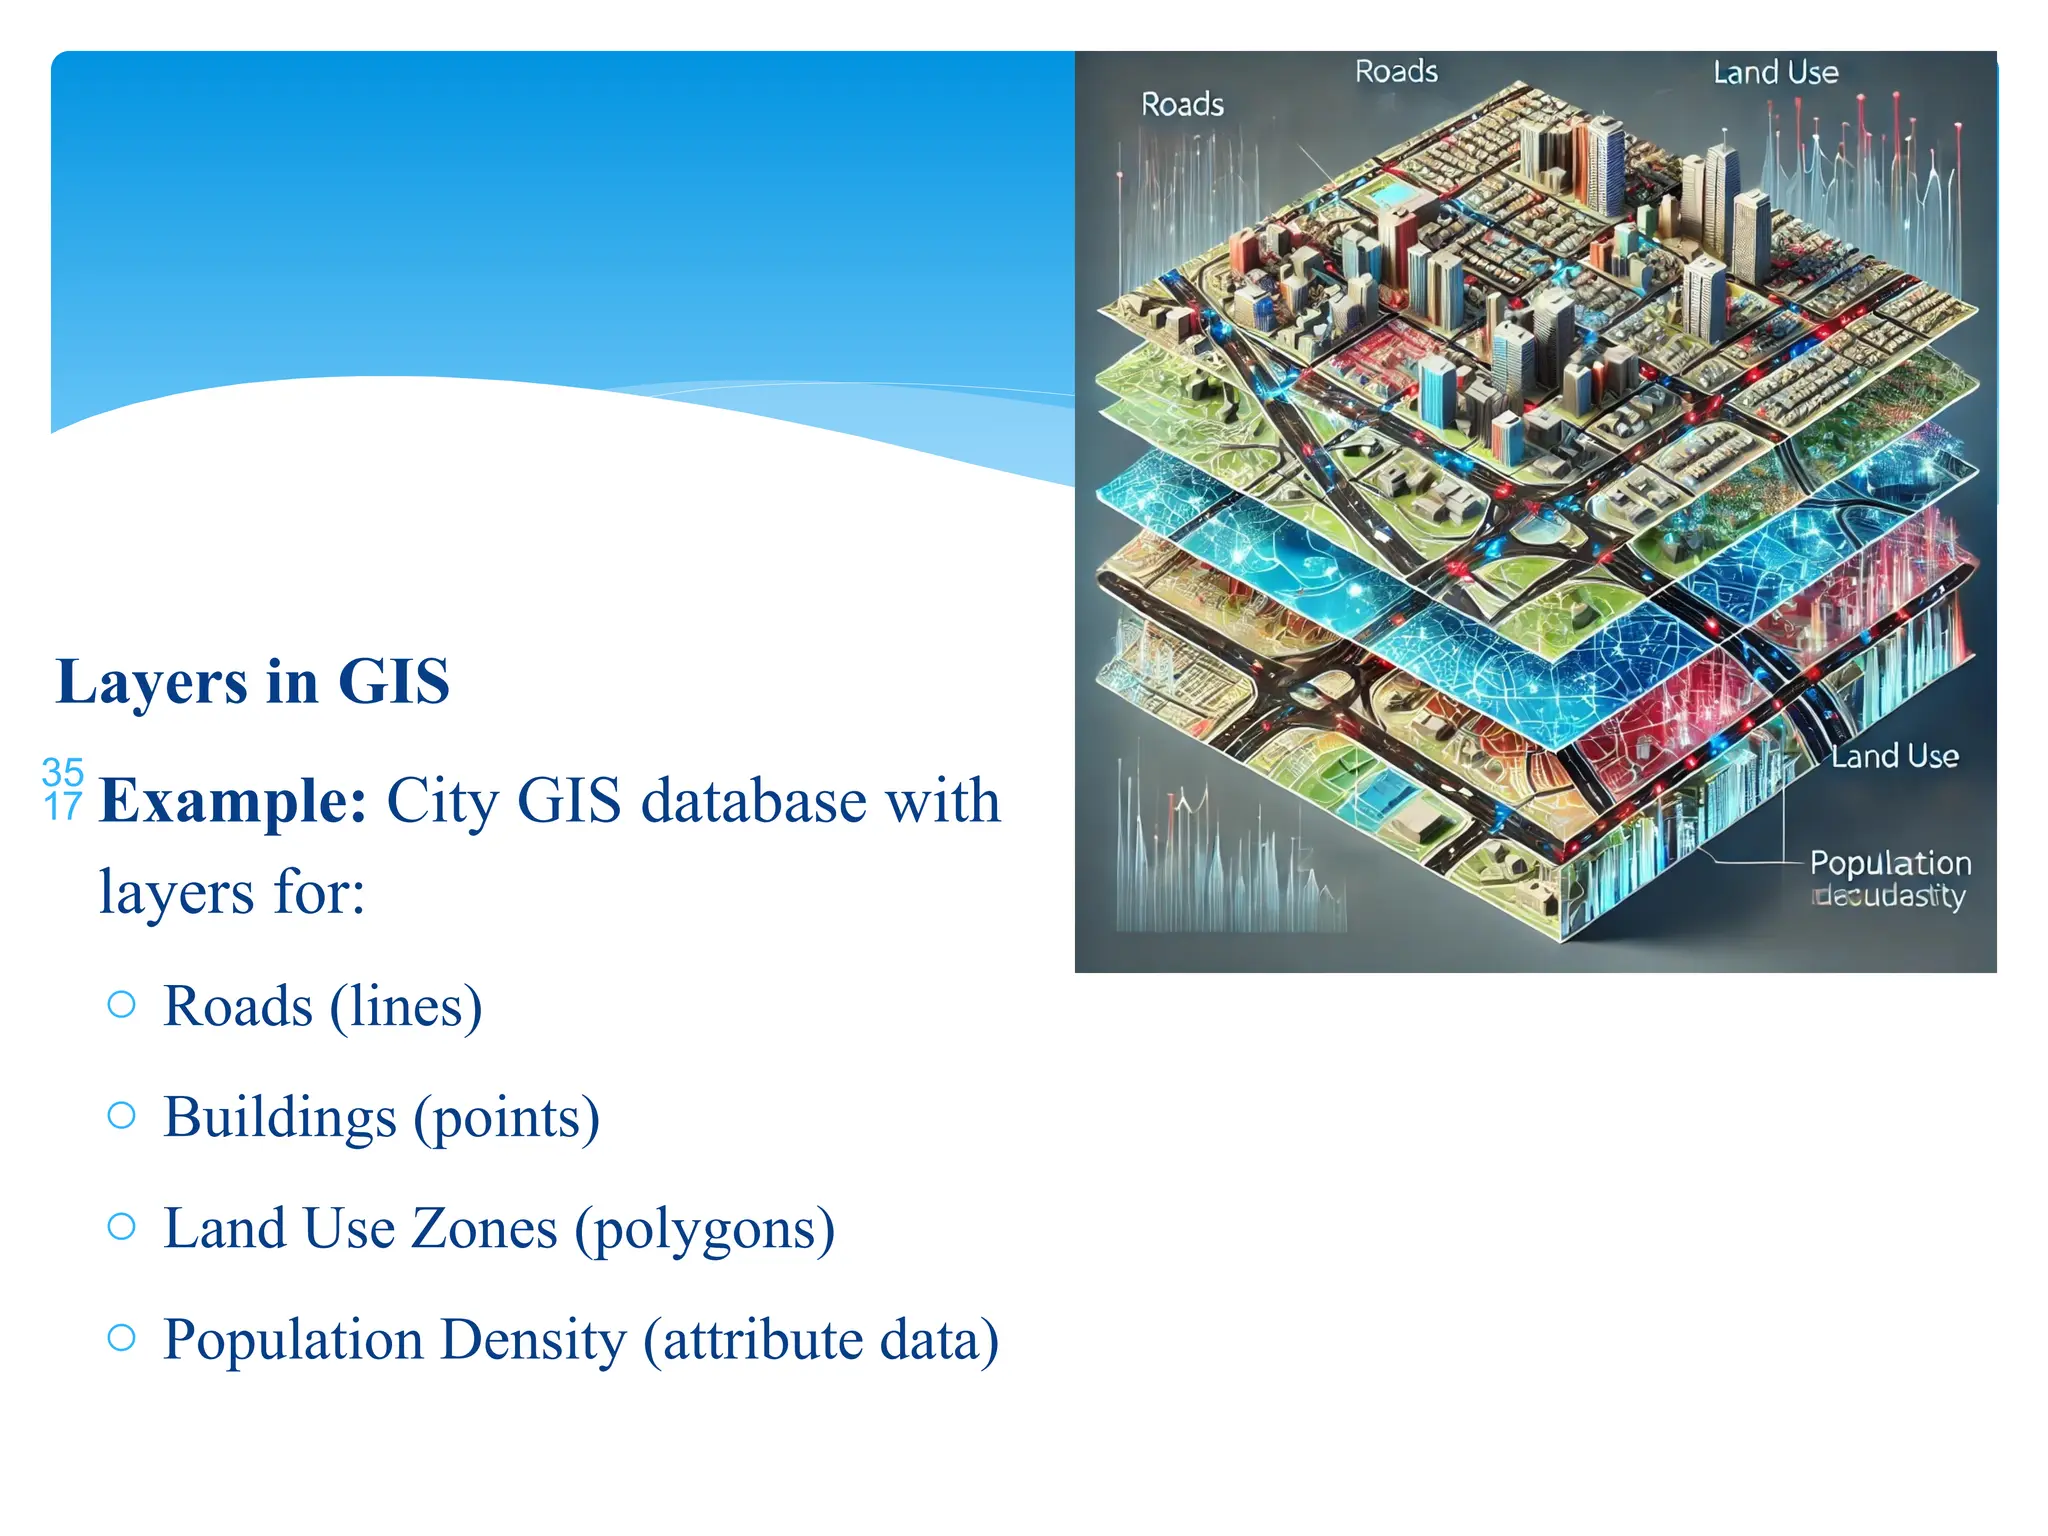
- **Layers & Overlay**: Stacking data layers for analysis
- **Georeferencing**: Assigning coordinates to data
- **Spatial Analysis**: Advanced techniques like route selection
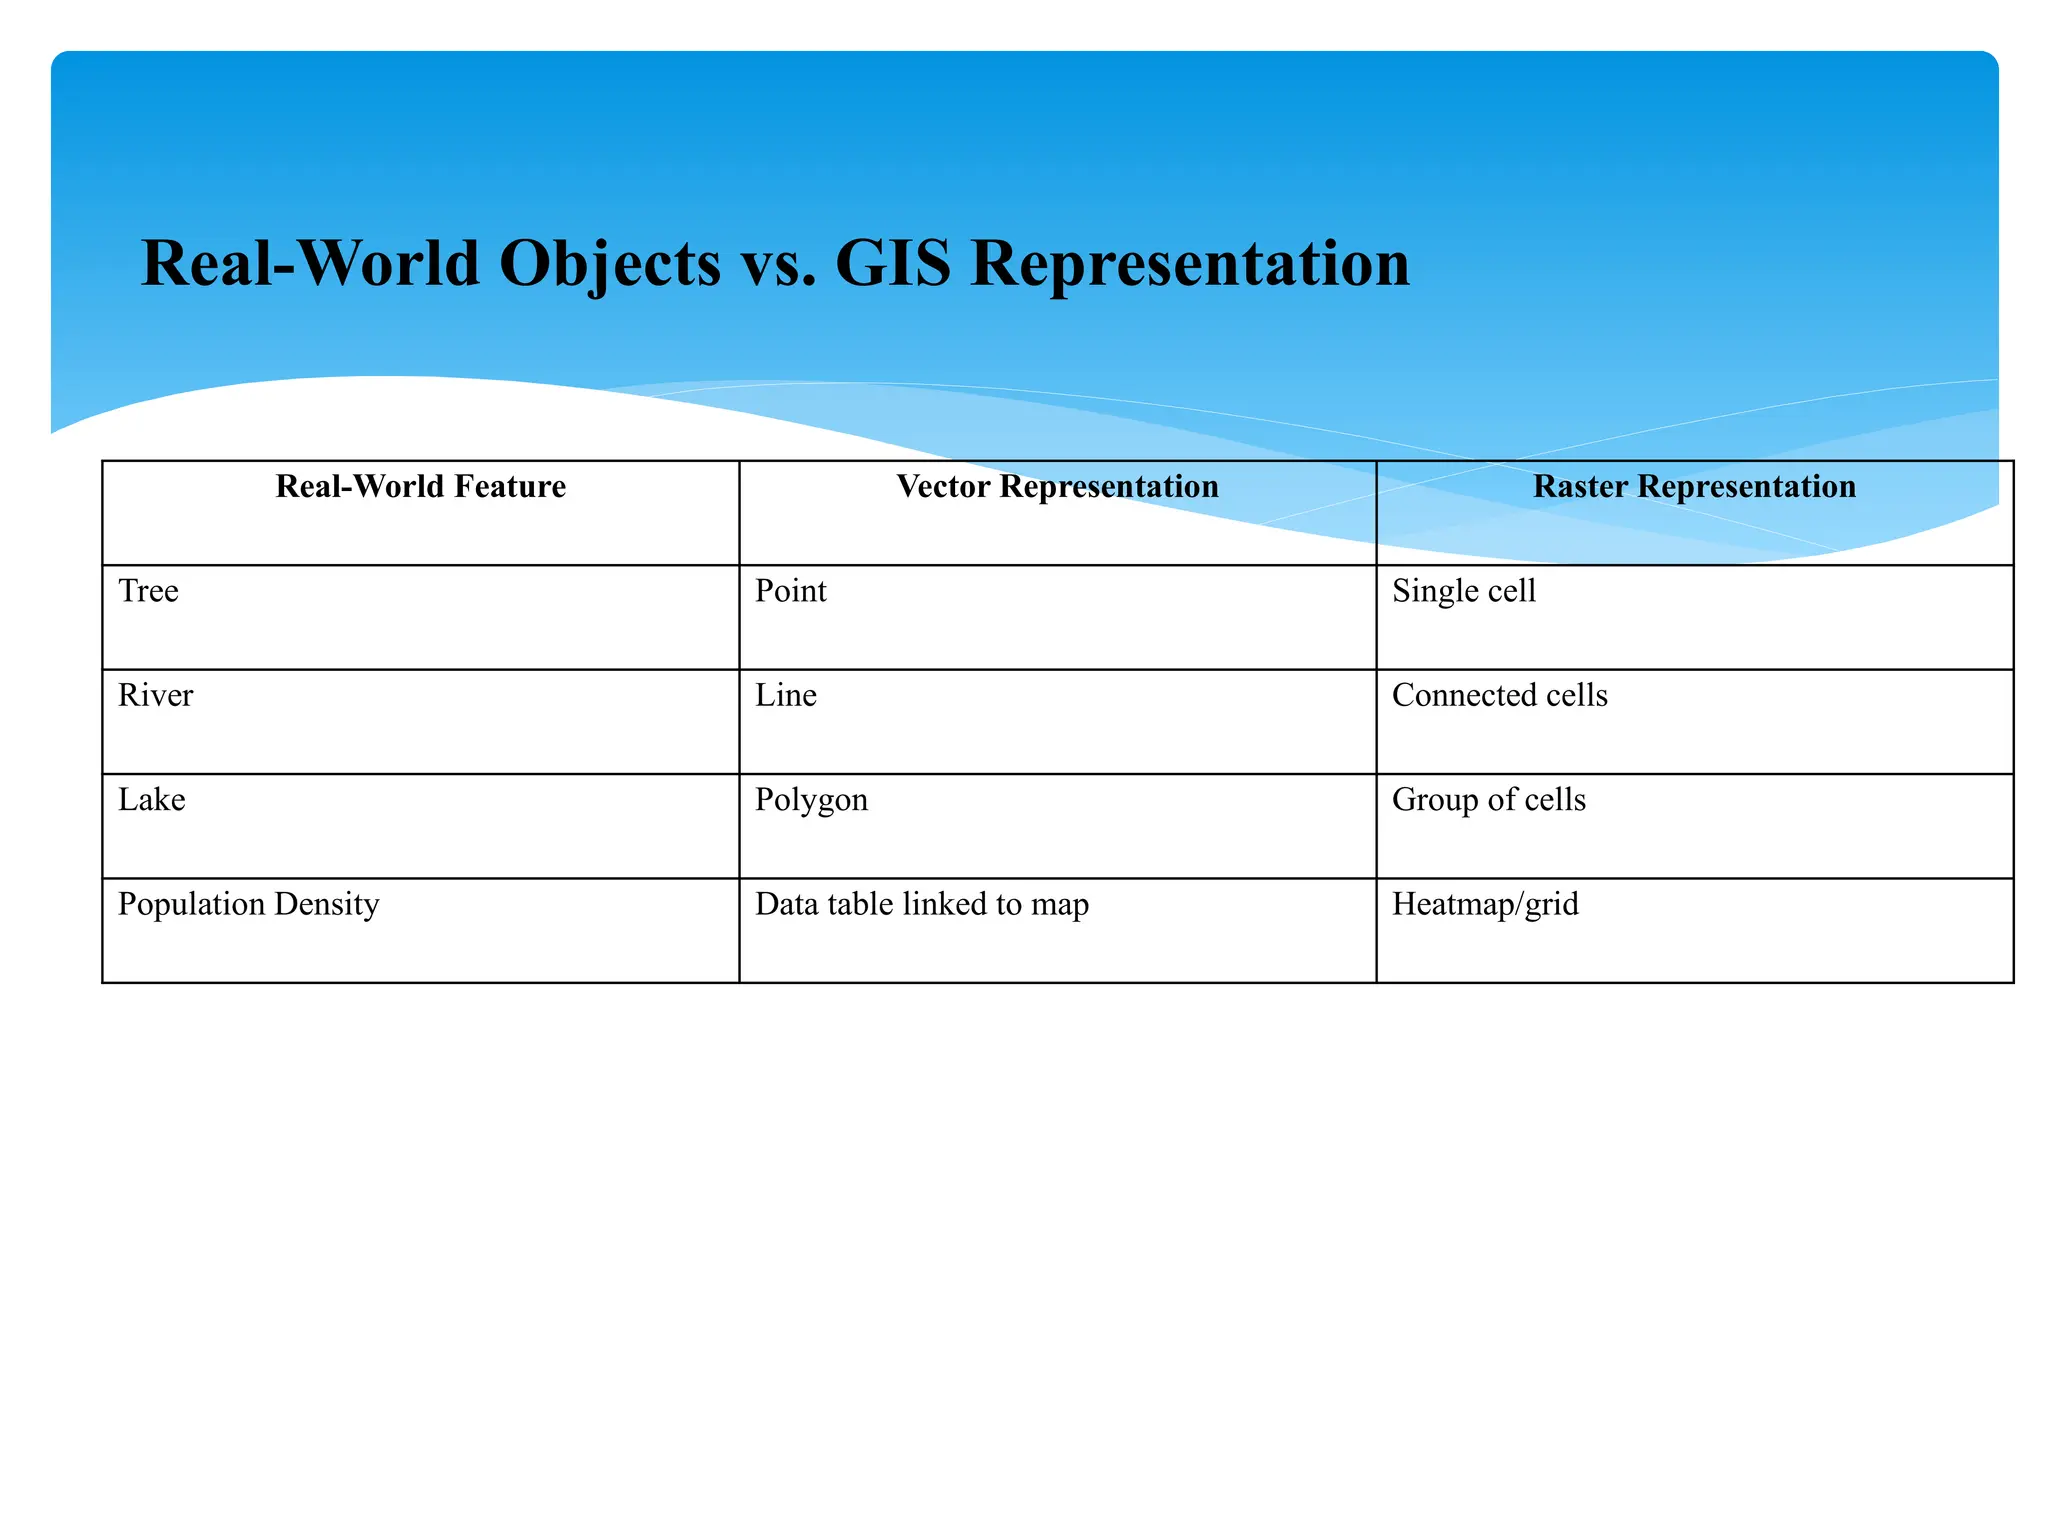
7. **Real-World Representation in GIS**
- **Vector Model**: Points, lines, polygons
- **Raster Model**: Pixel grids with values
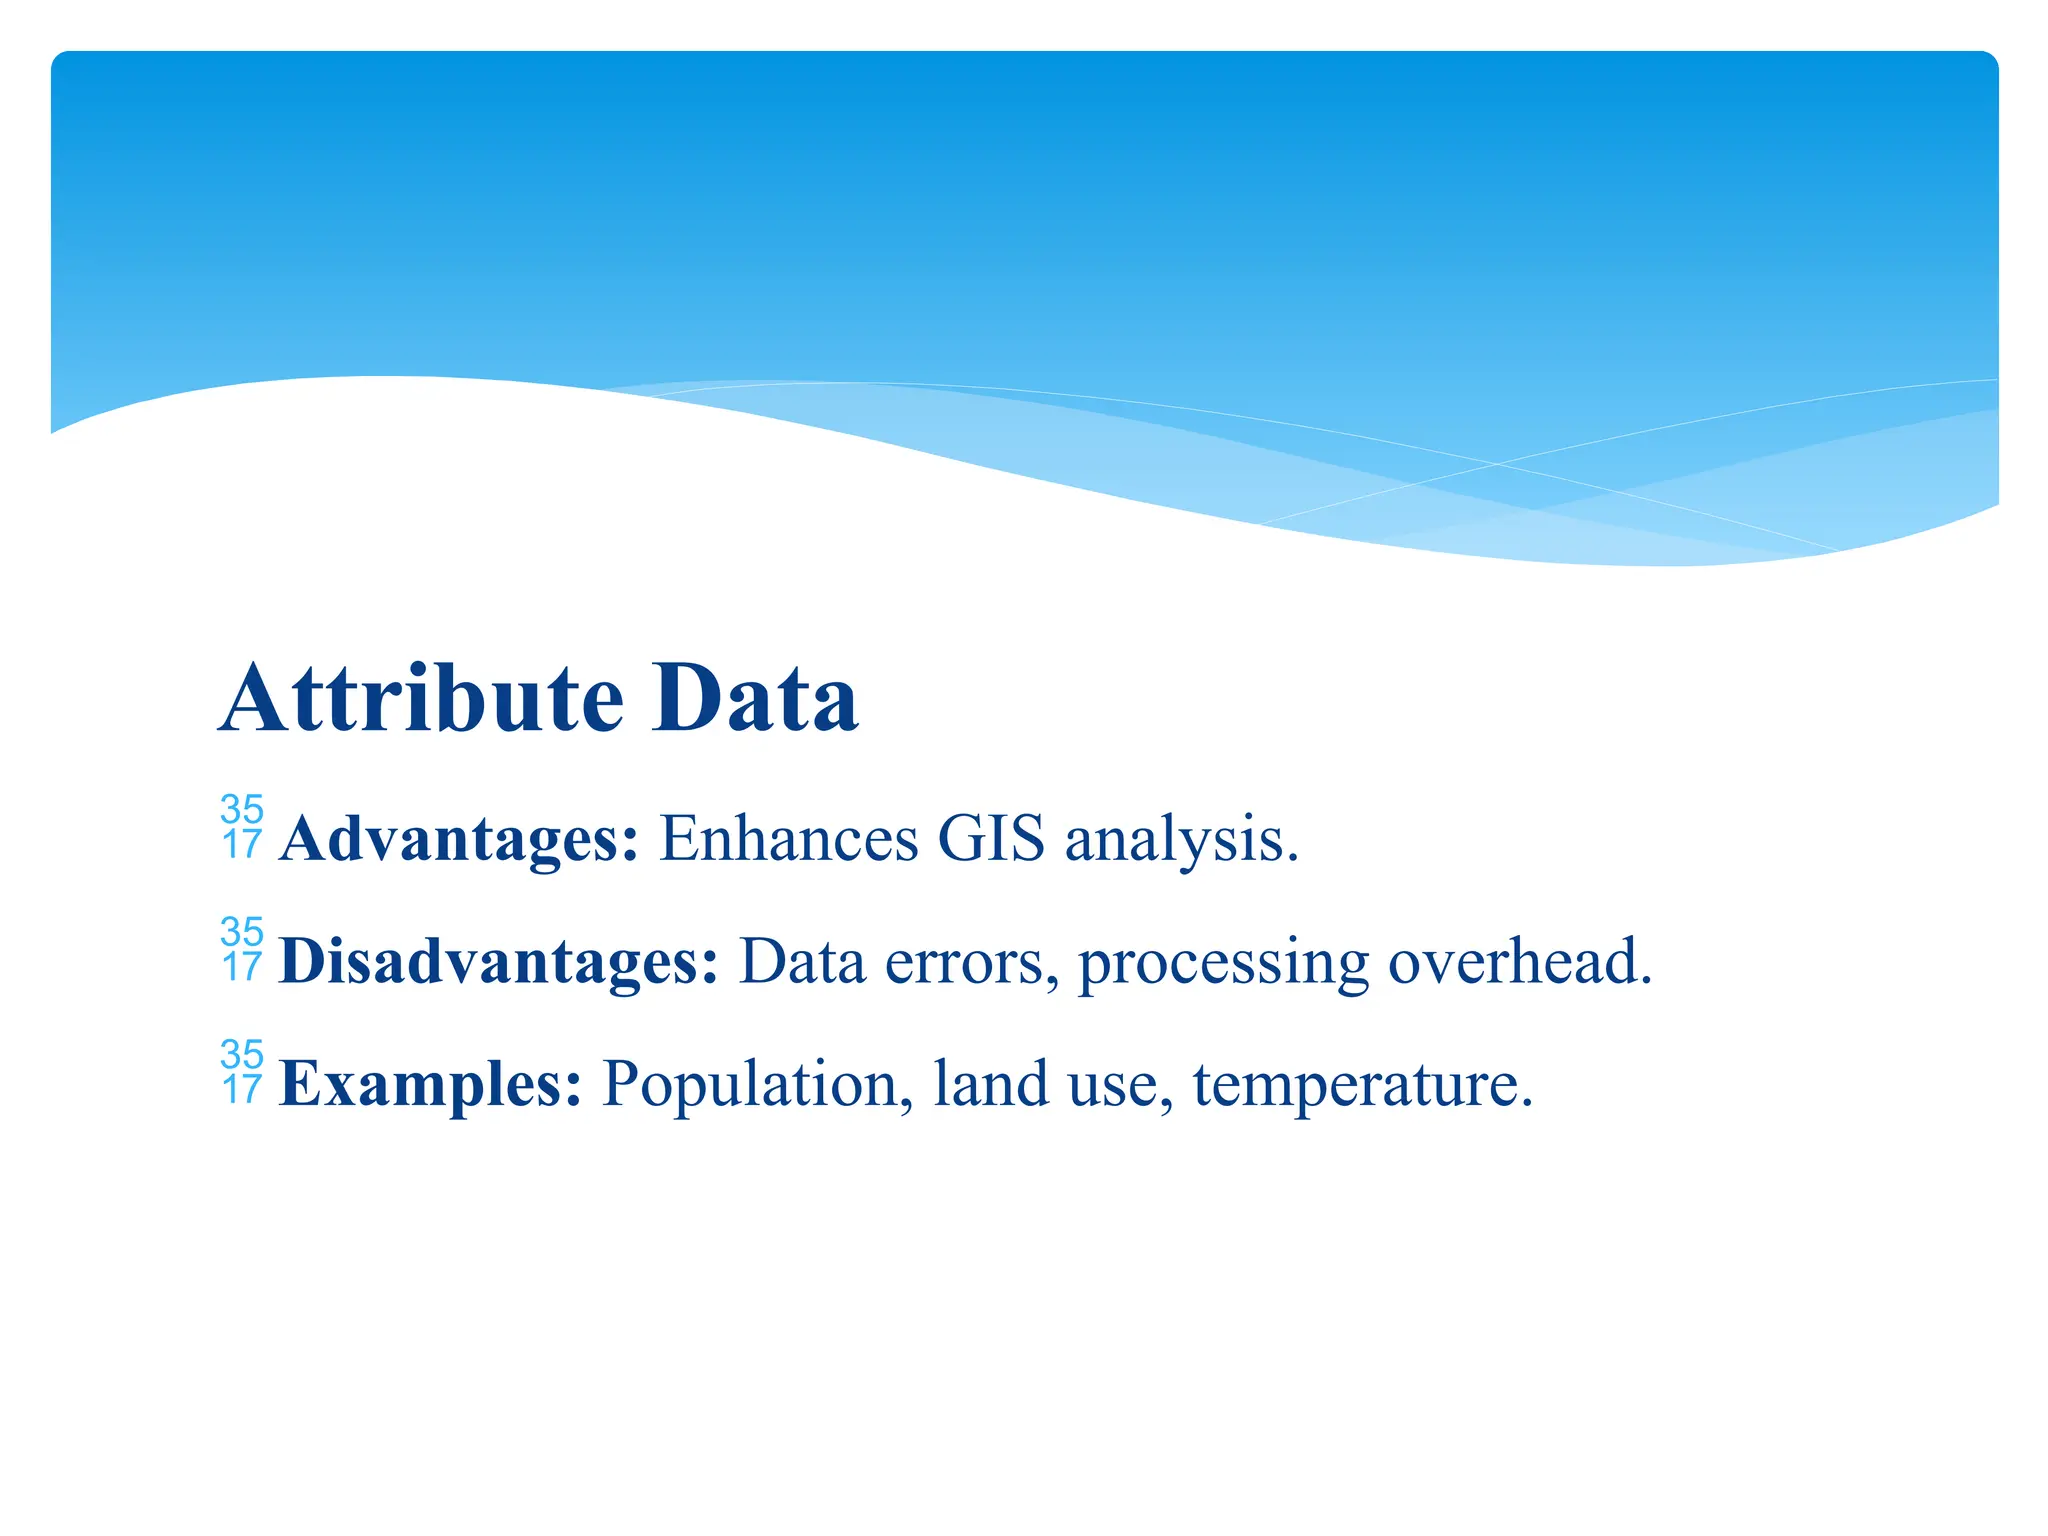
- **Attribute Data**: Descriptive information tied to features
8. **Case Study: Flood Risk Mapping**
- Goal: Identify flood-prone areas.
- Data Layers: DEM (elevation), river networks, land use
- Process: Slope and flow maps, buffering rivers, overlaying land-use data
- Output: Flood risk map showing high/medium/low-risk zones
### **Conclusion**
GIS is a powerful tool for spatial data analysis, planning, and decision-making. It integrates different data types and techniques to provide real-world solutions in various fields.
Let me know if you need edits, explanations, or improvements for your PowerPoint slides!