Download to read offline
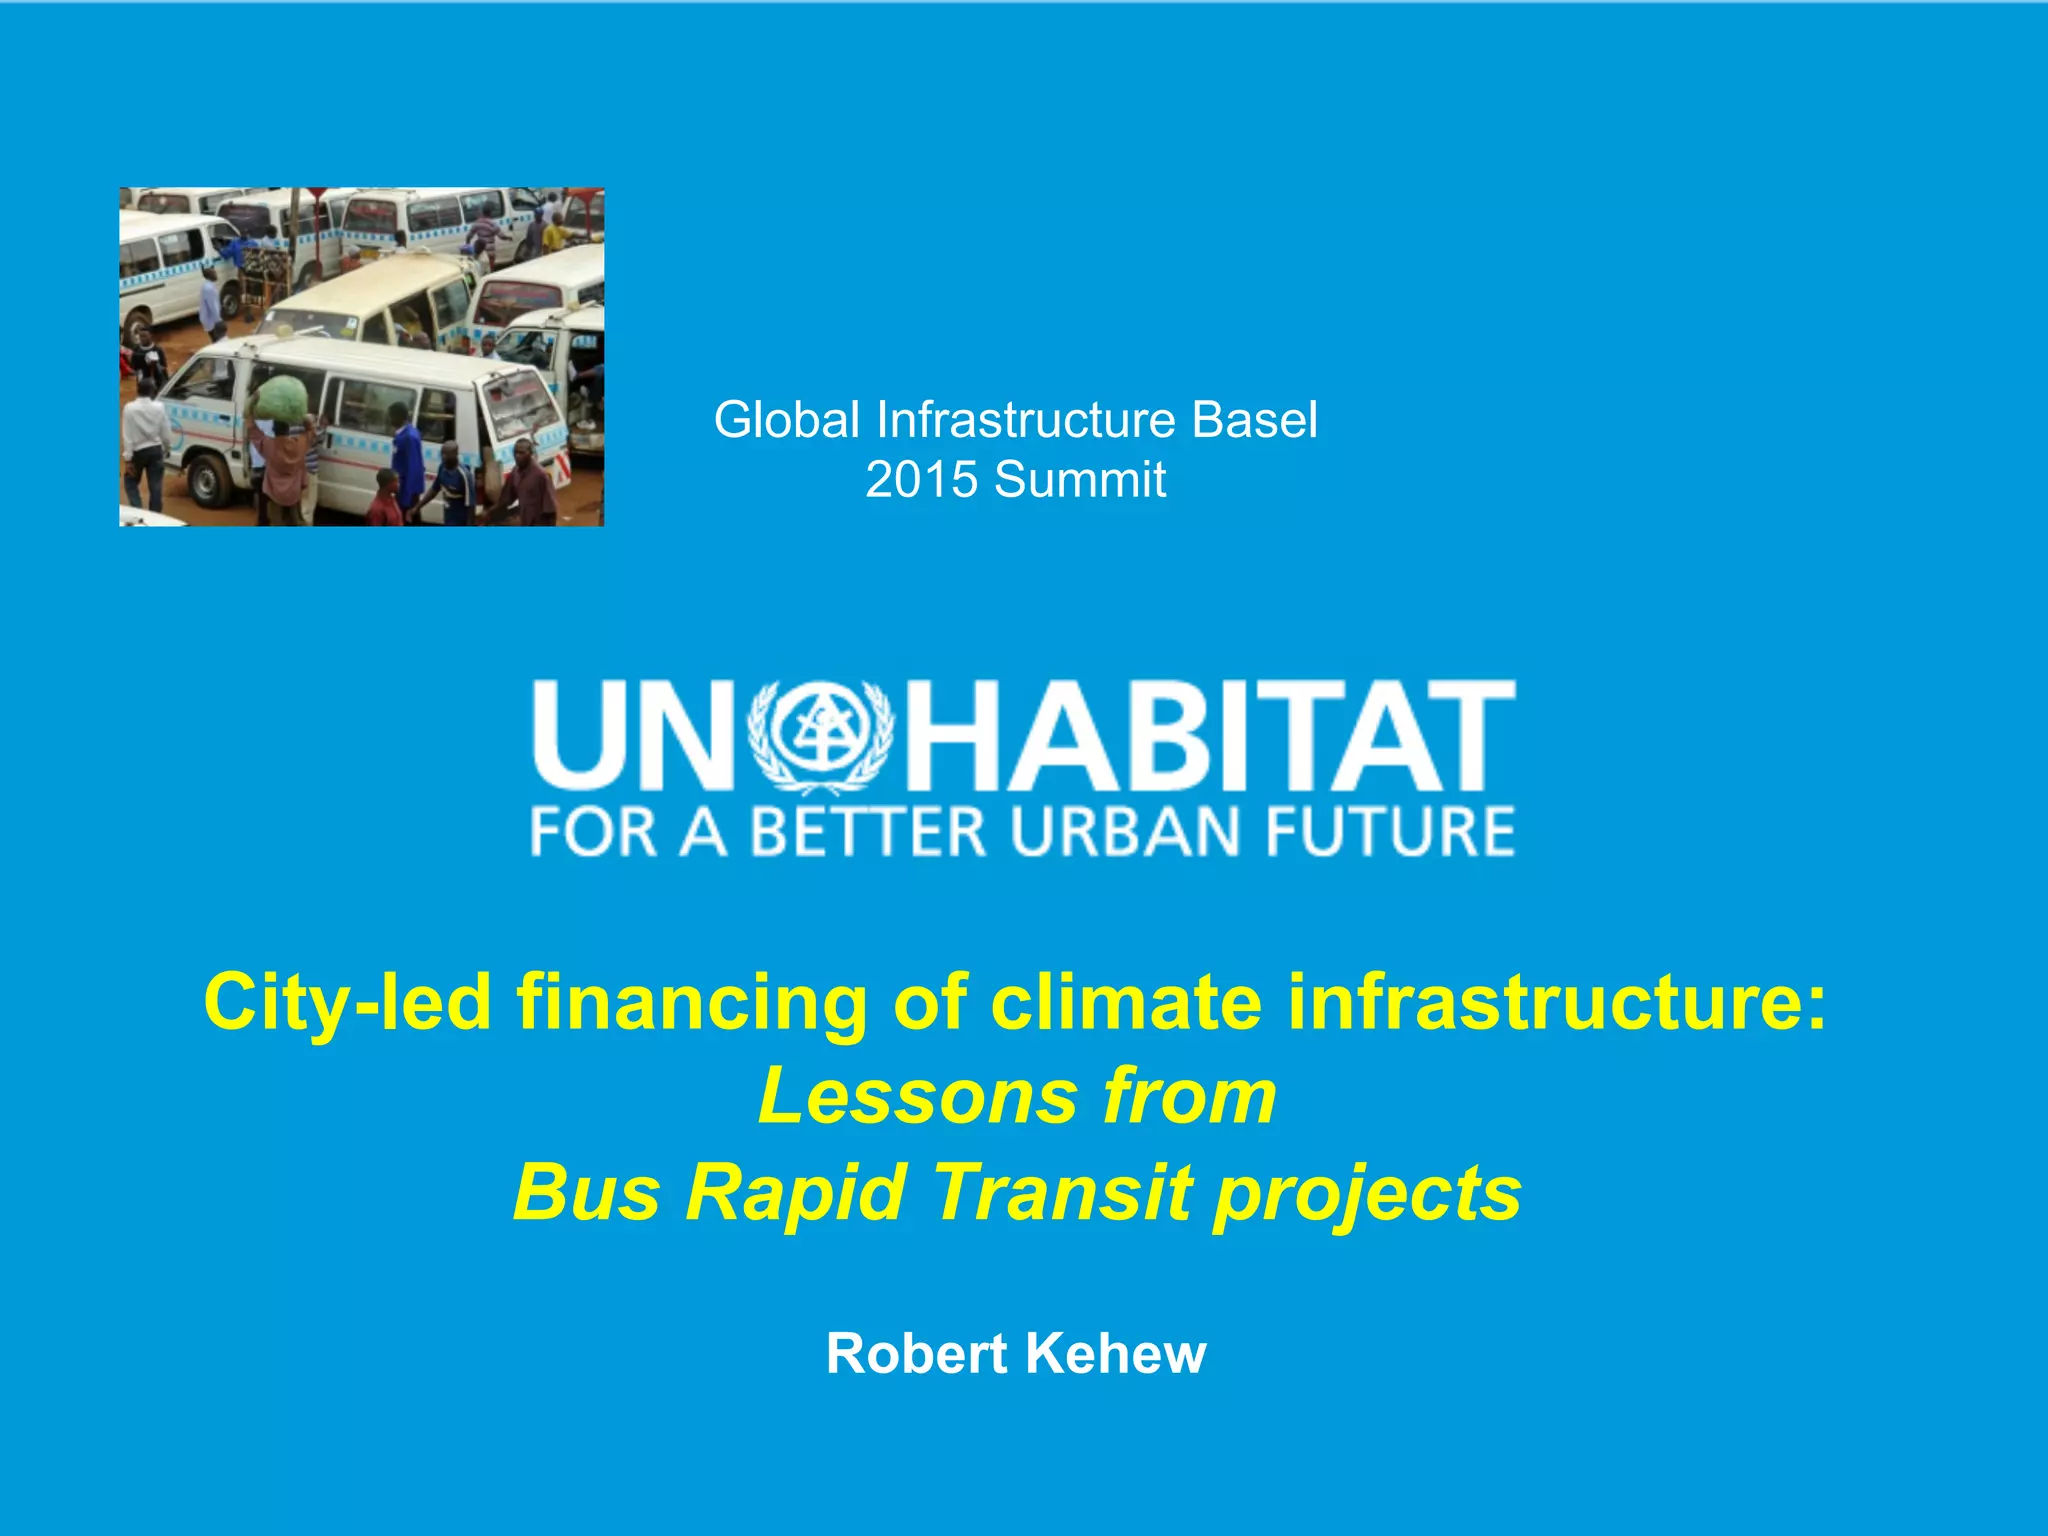
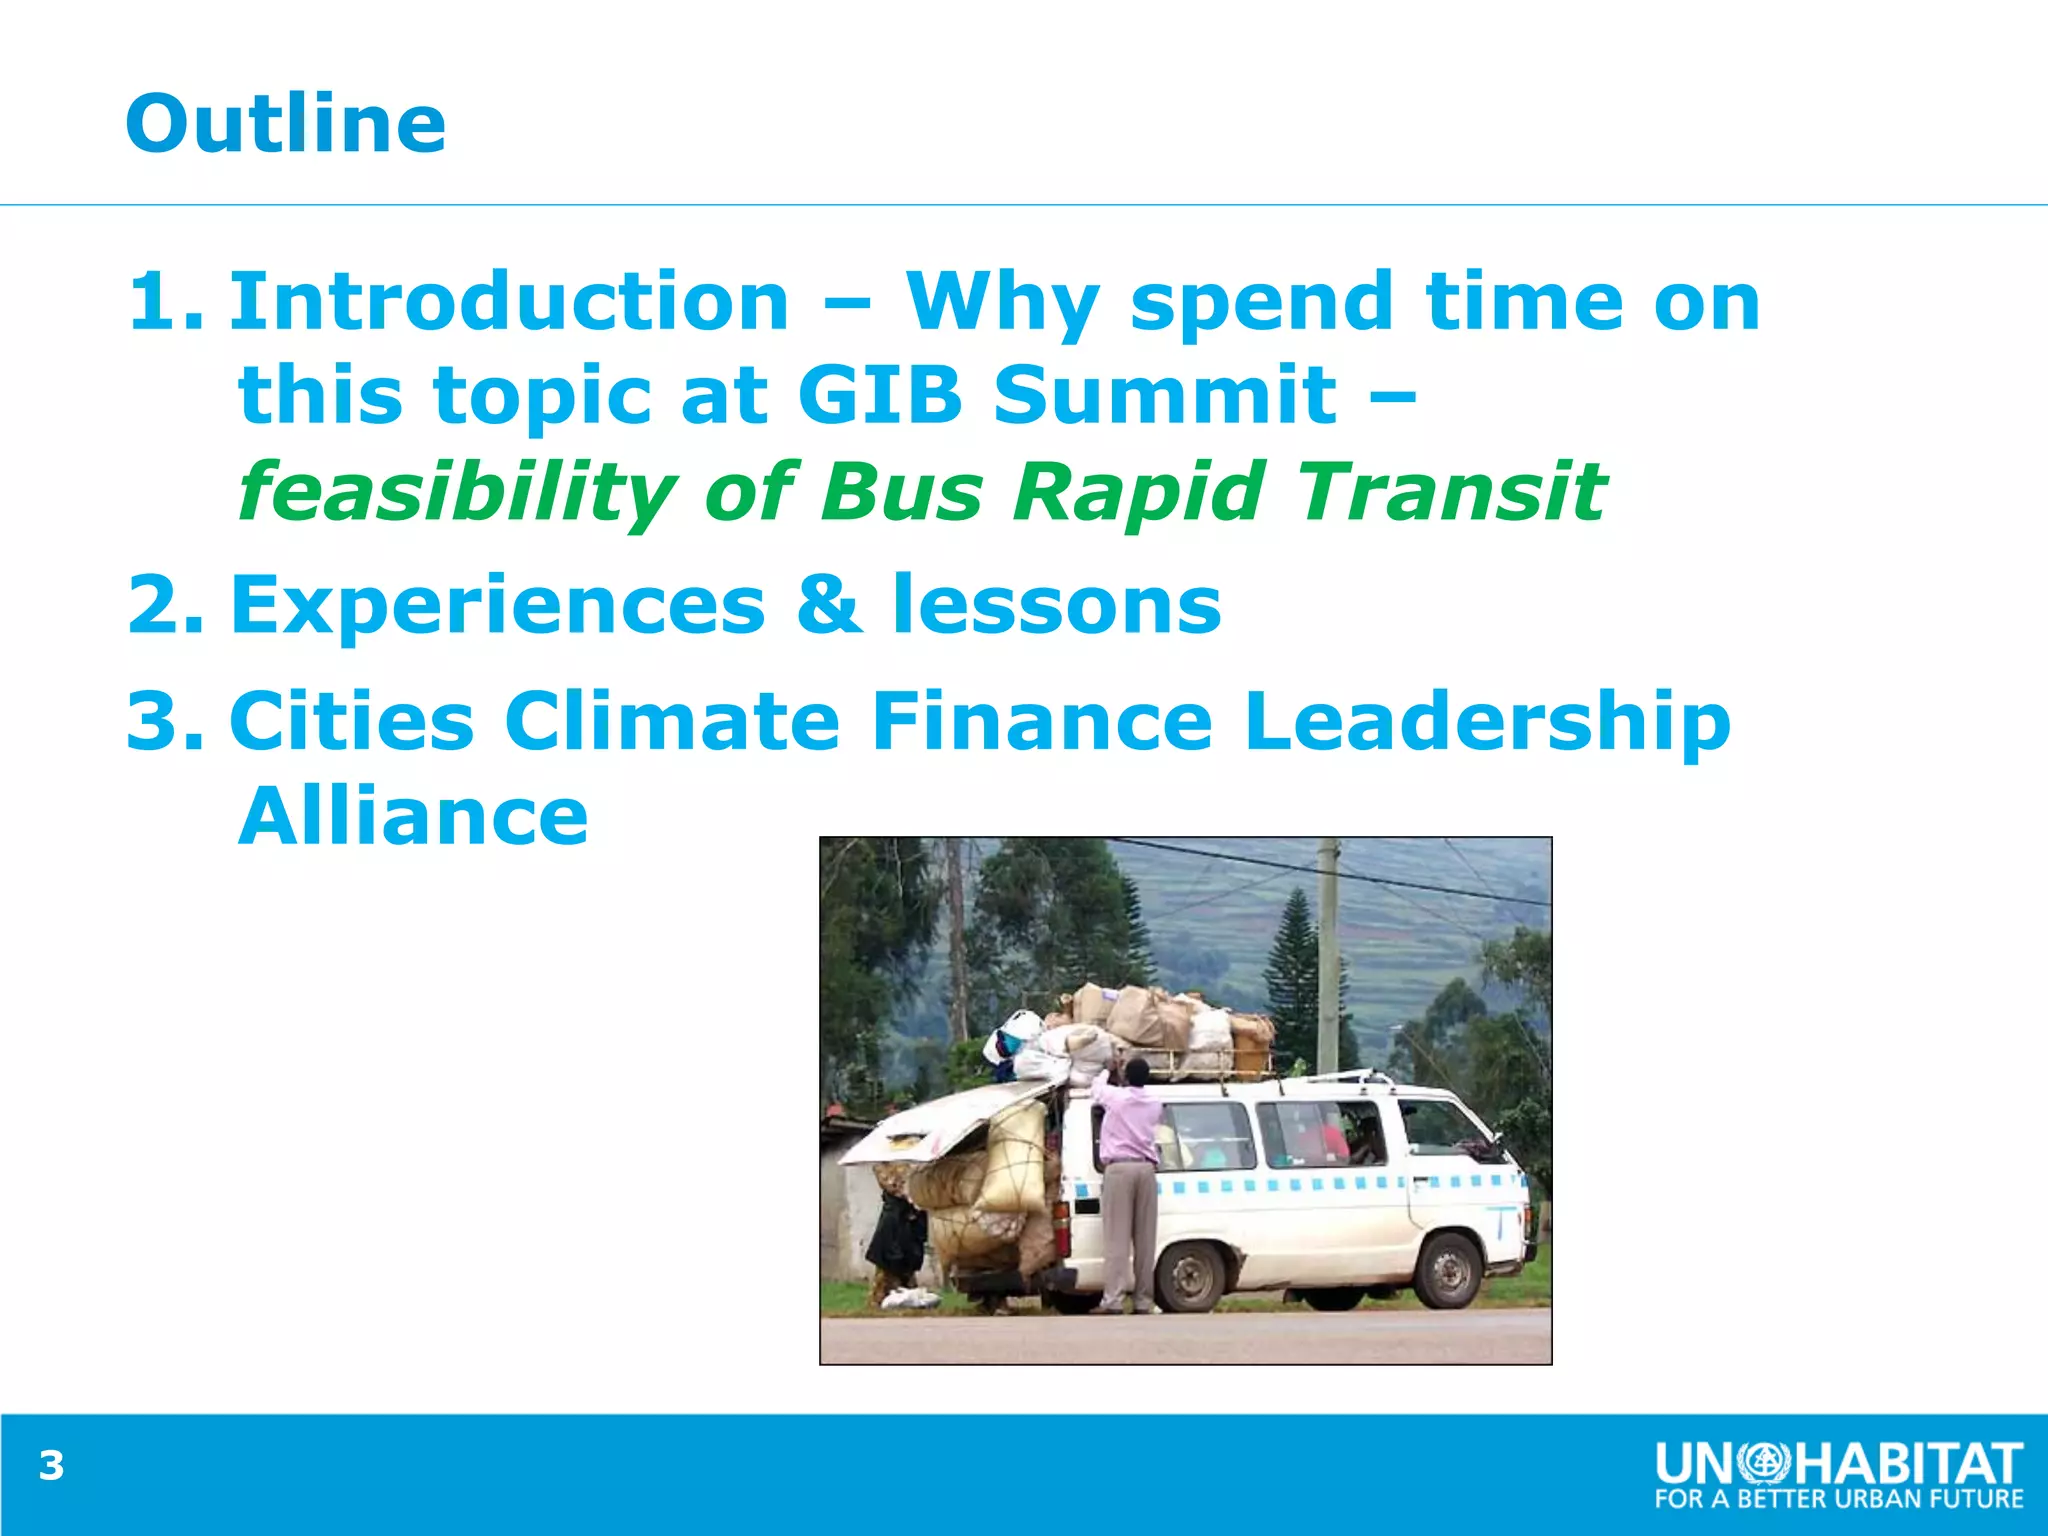
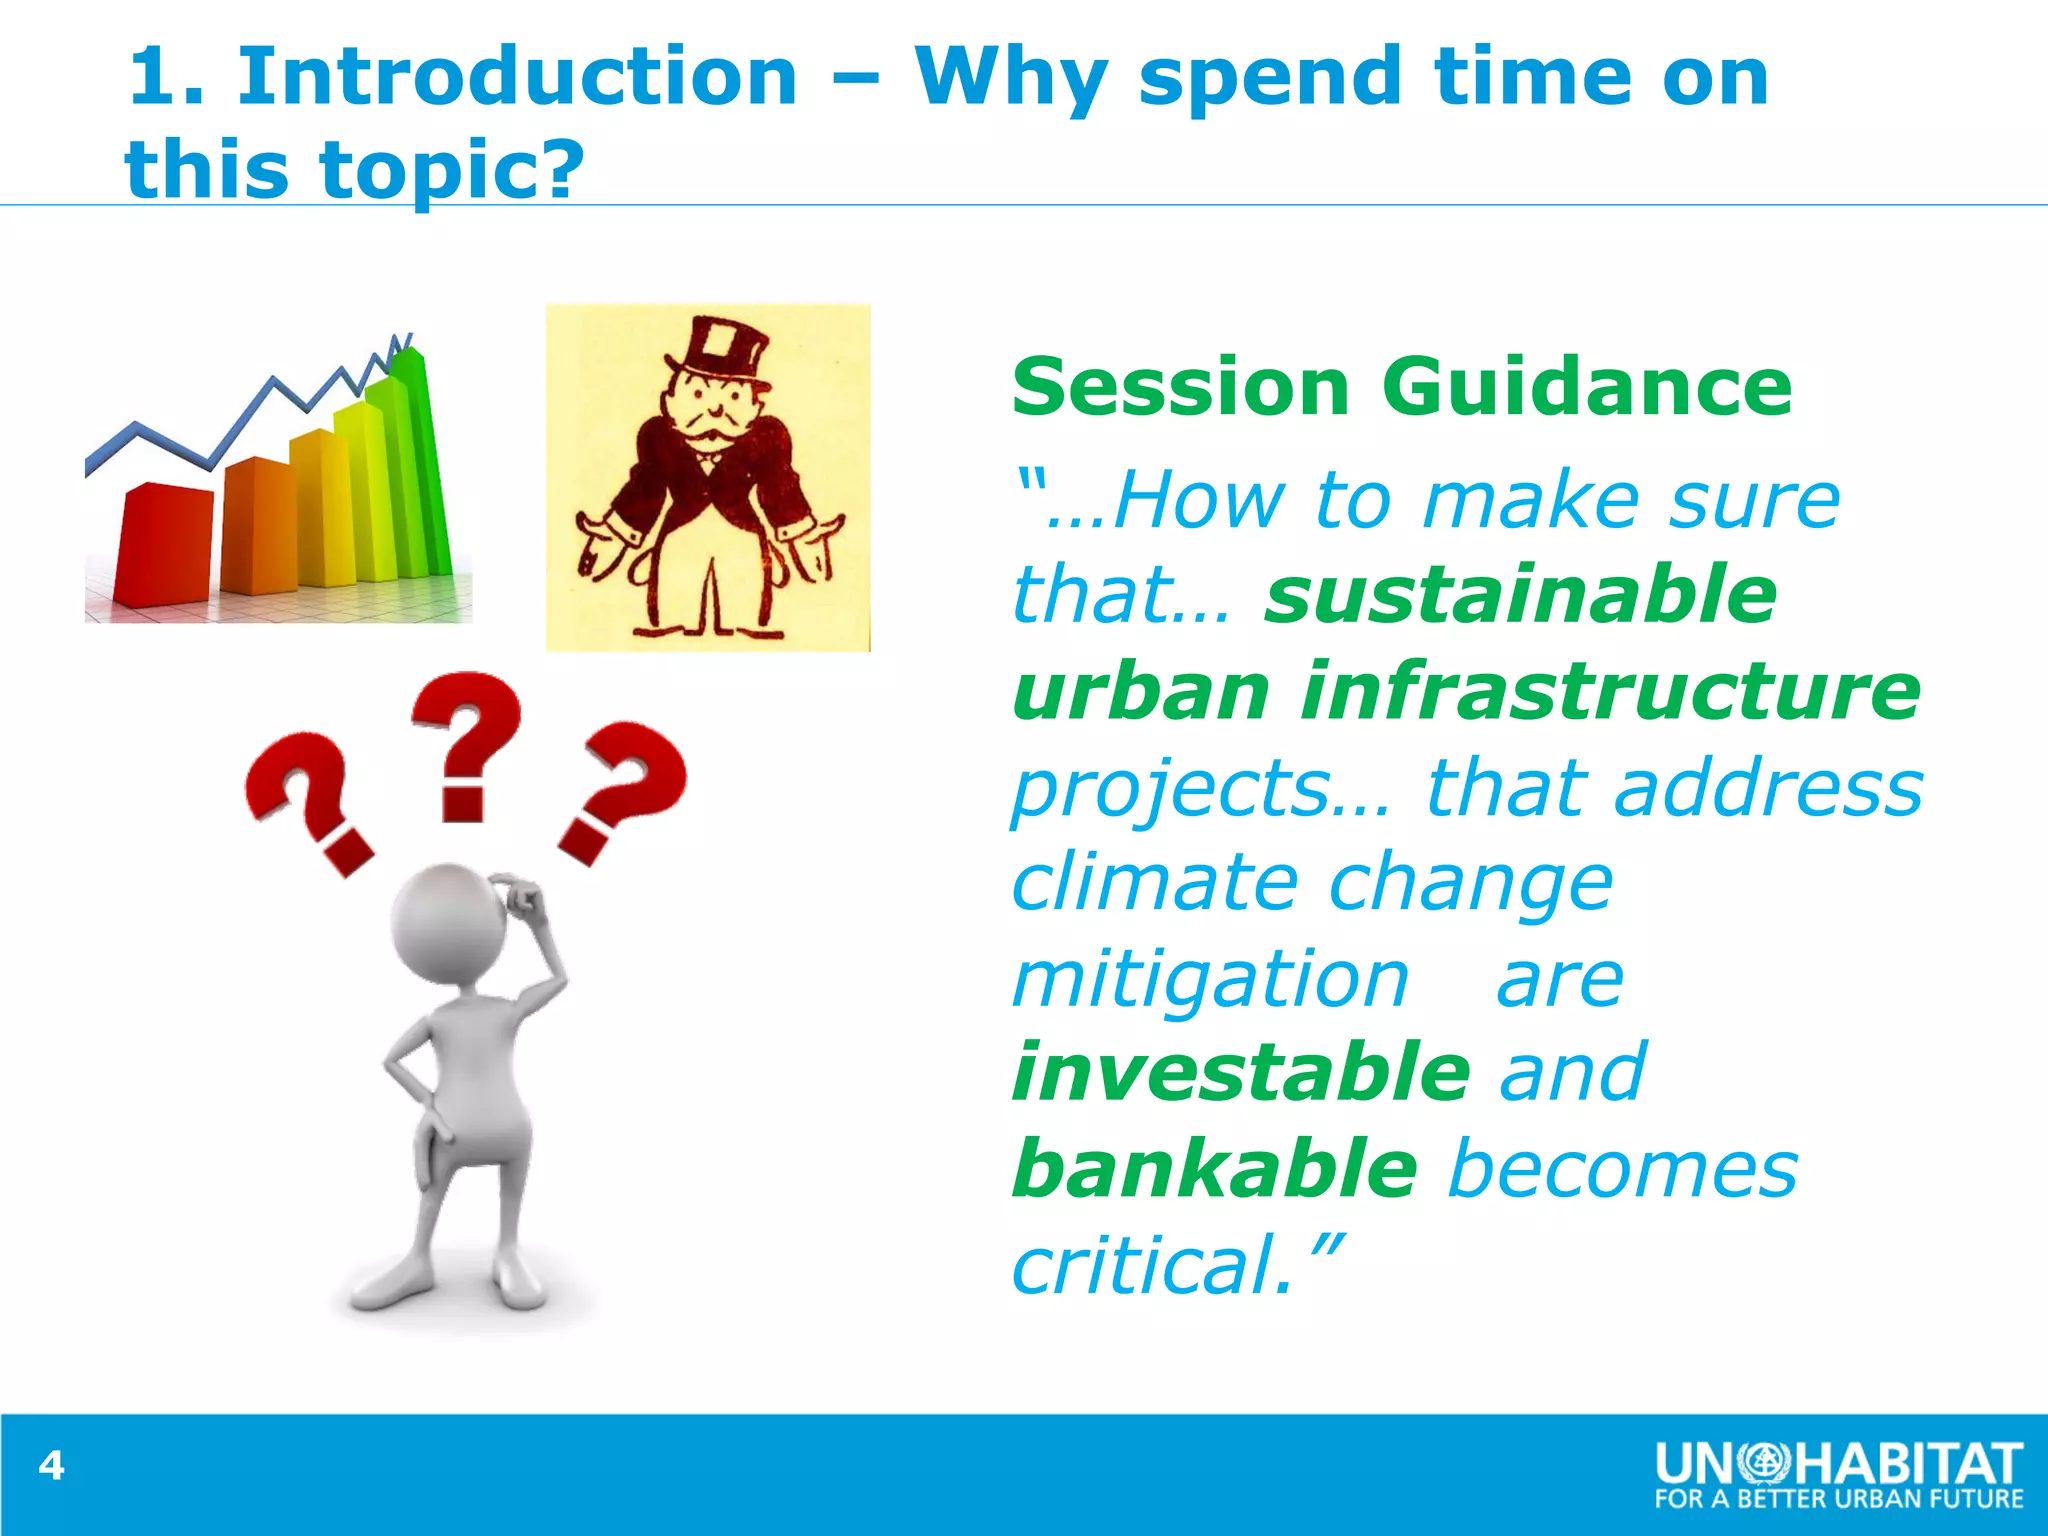
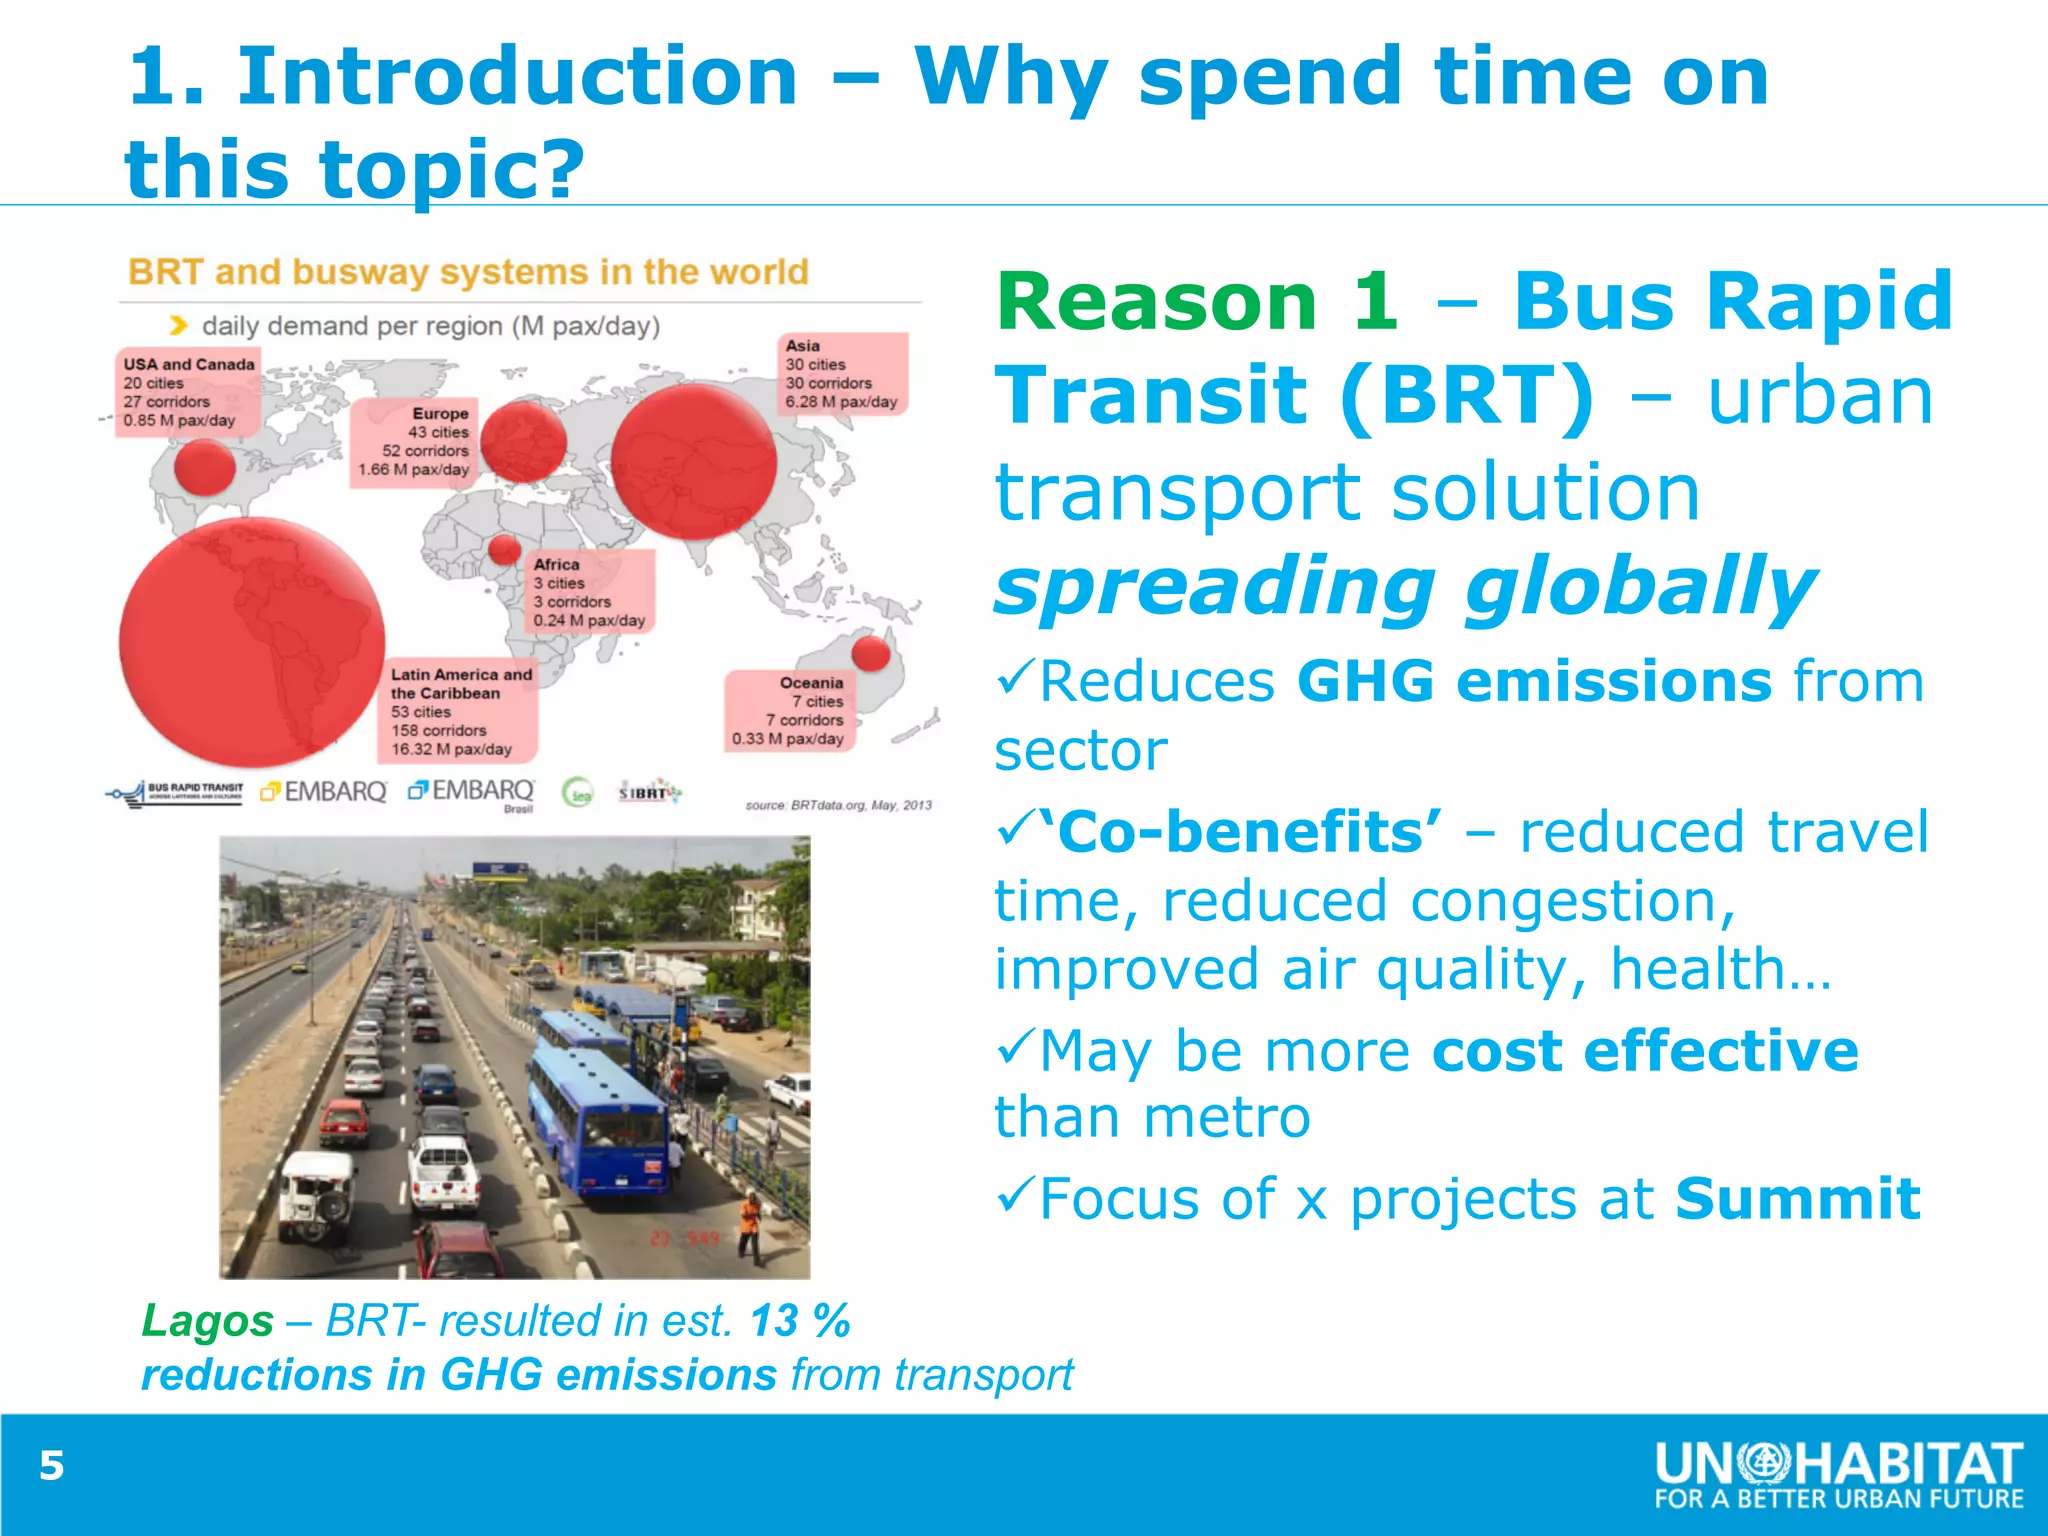
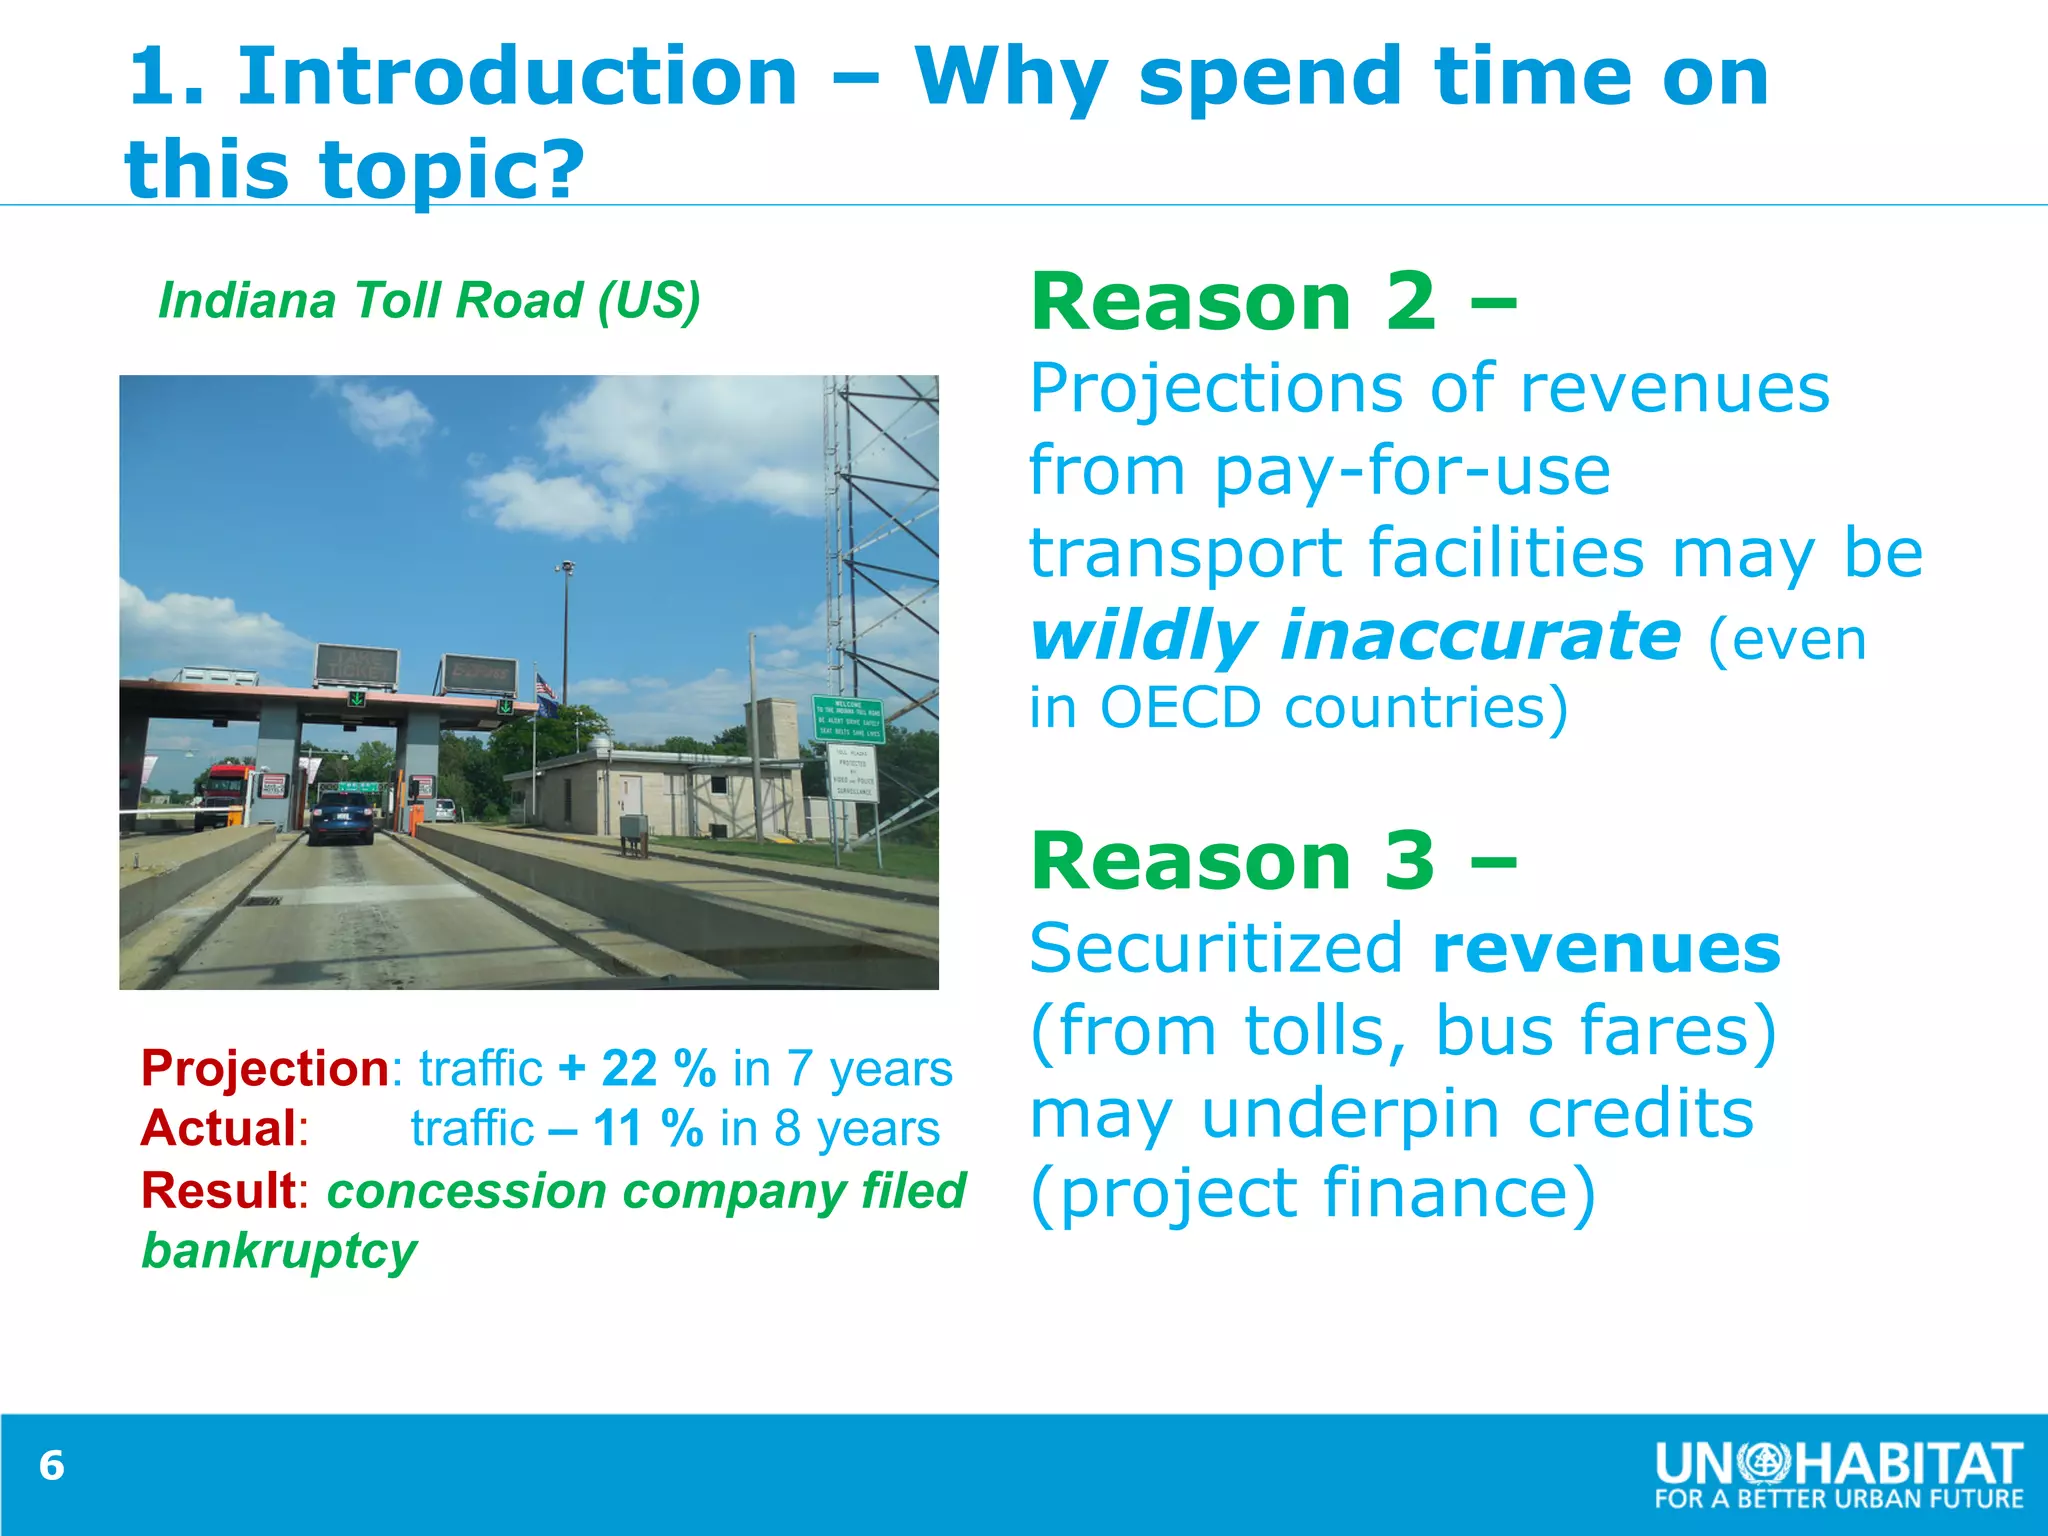
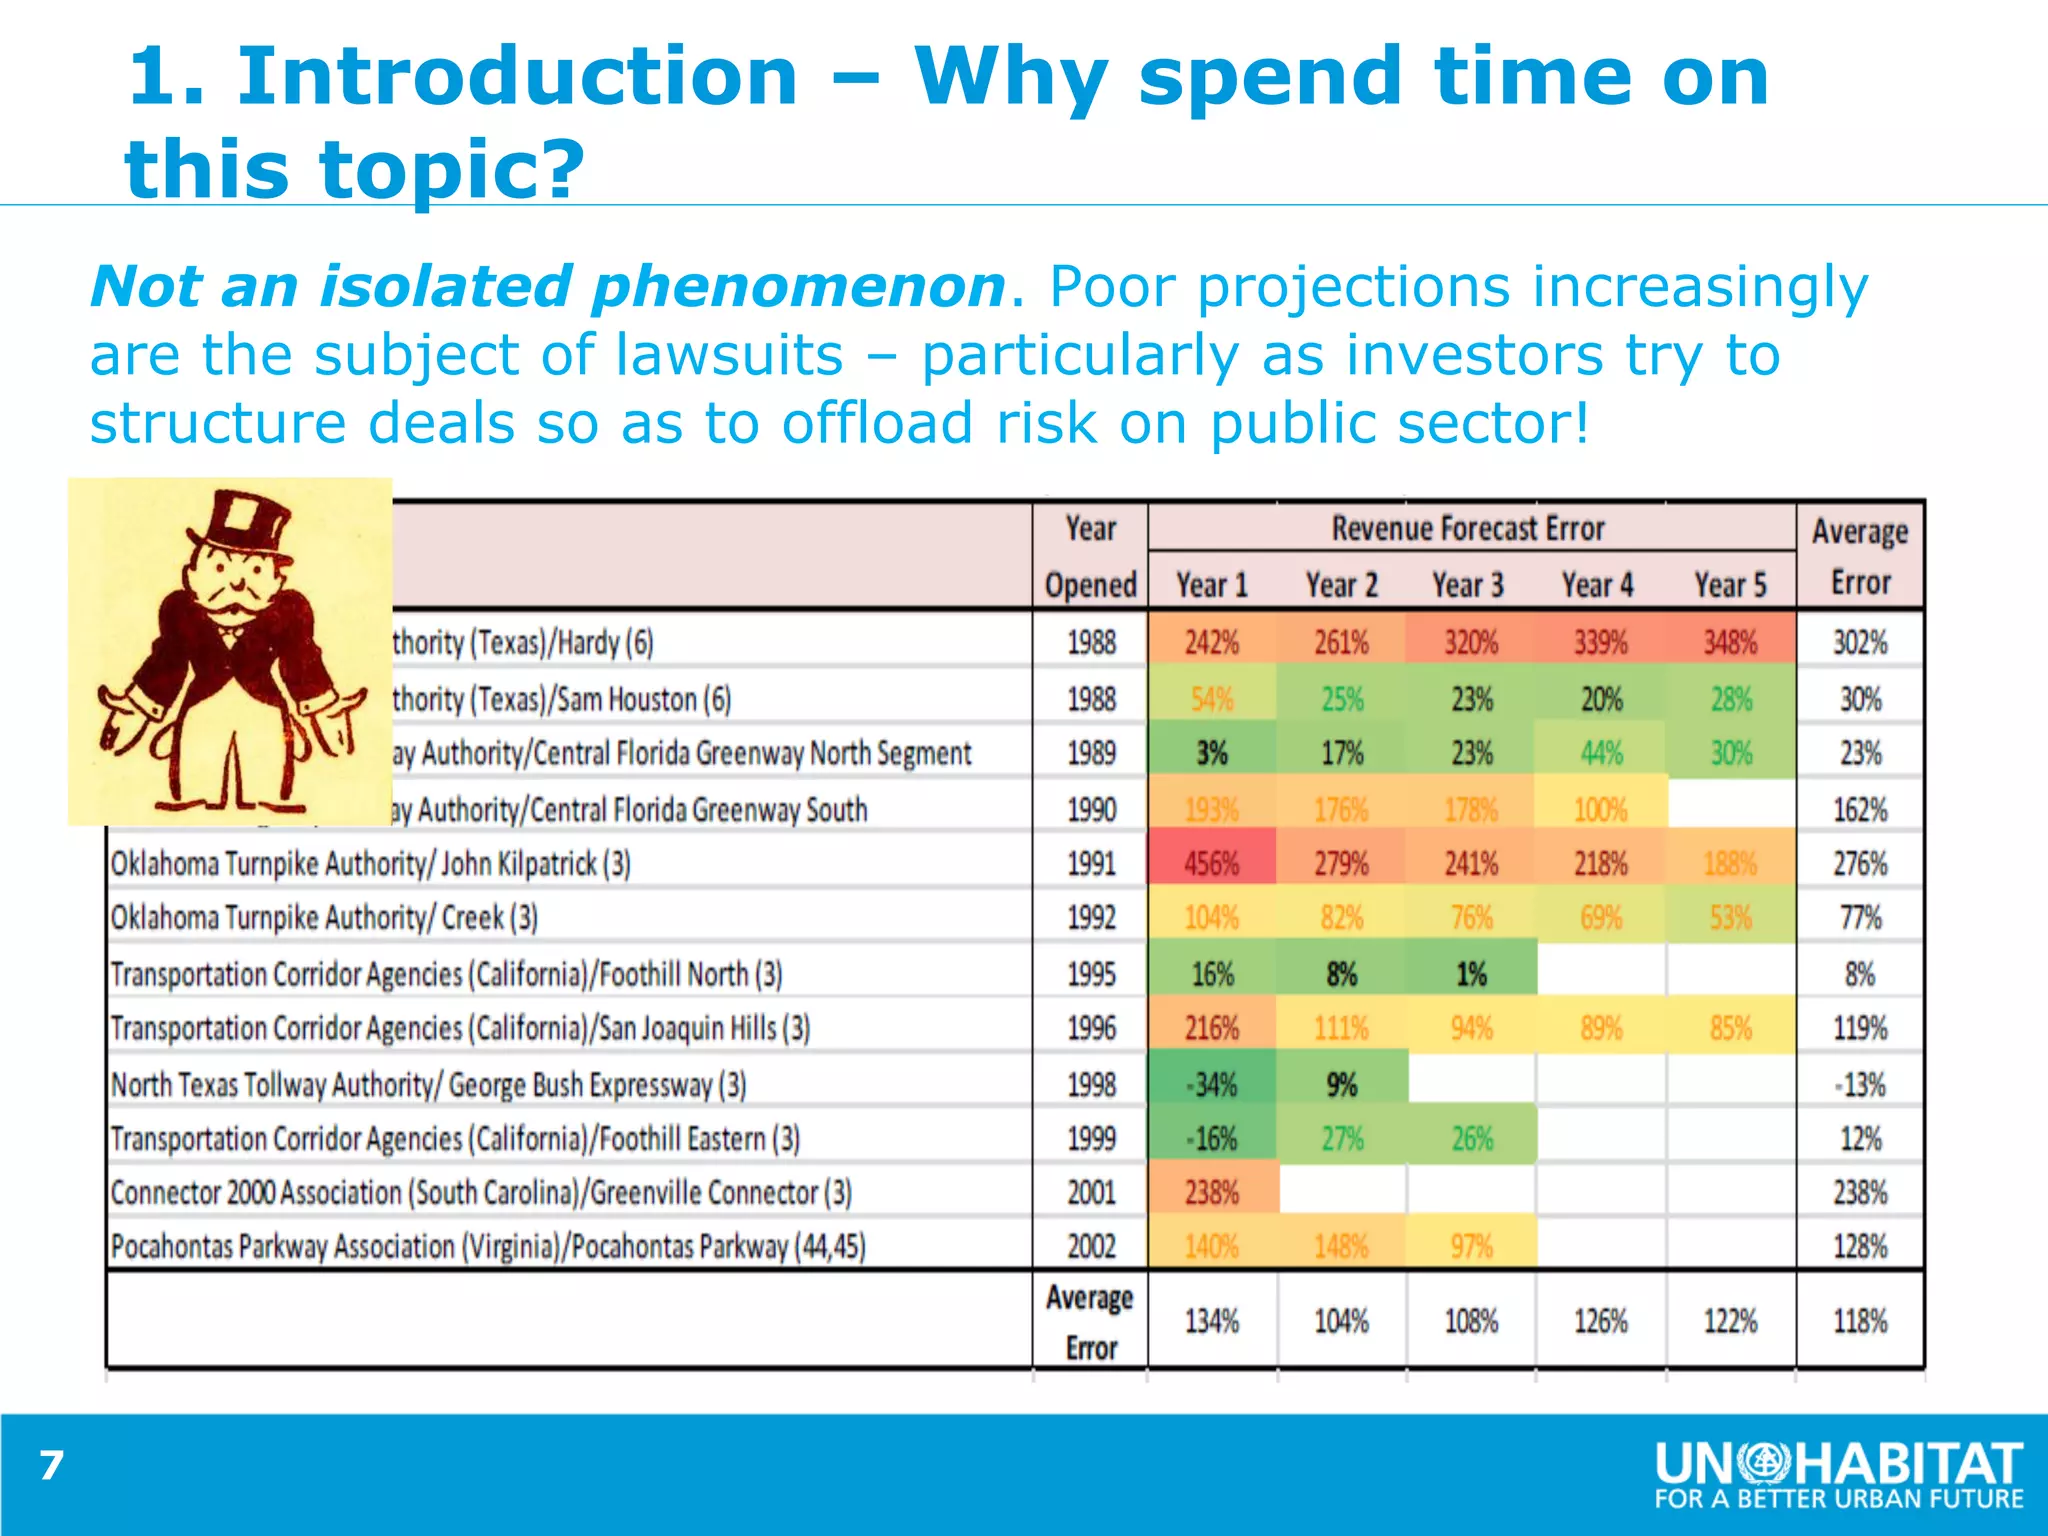
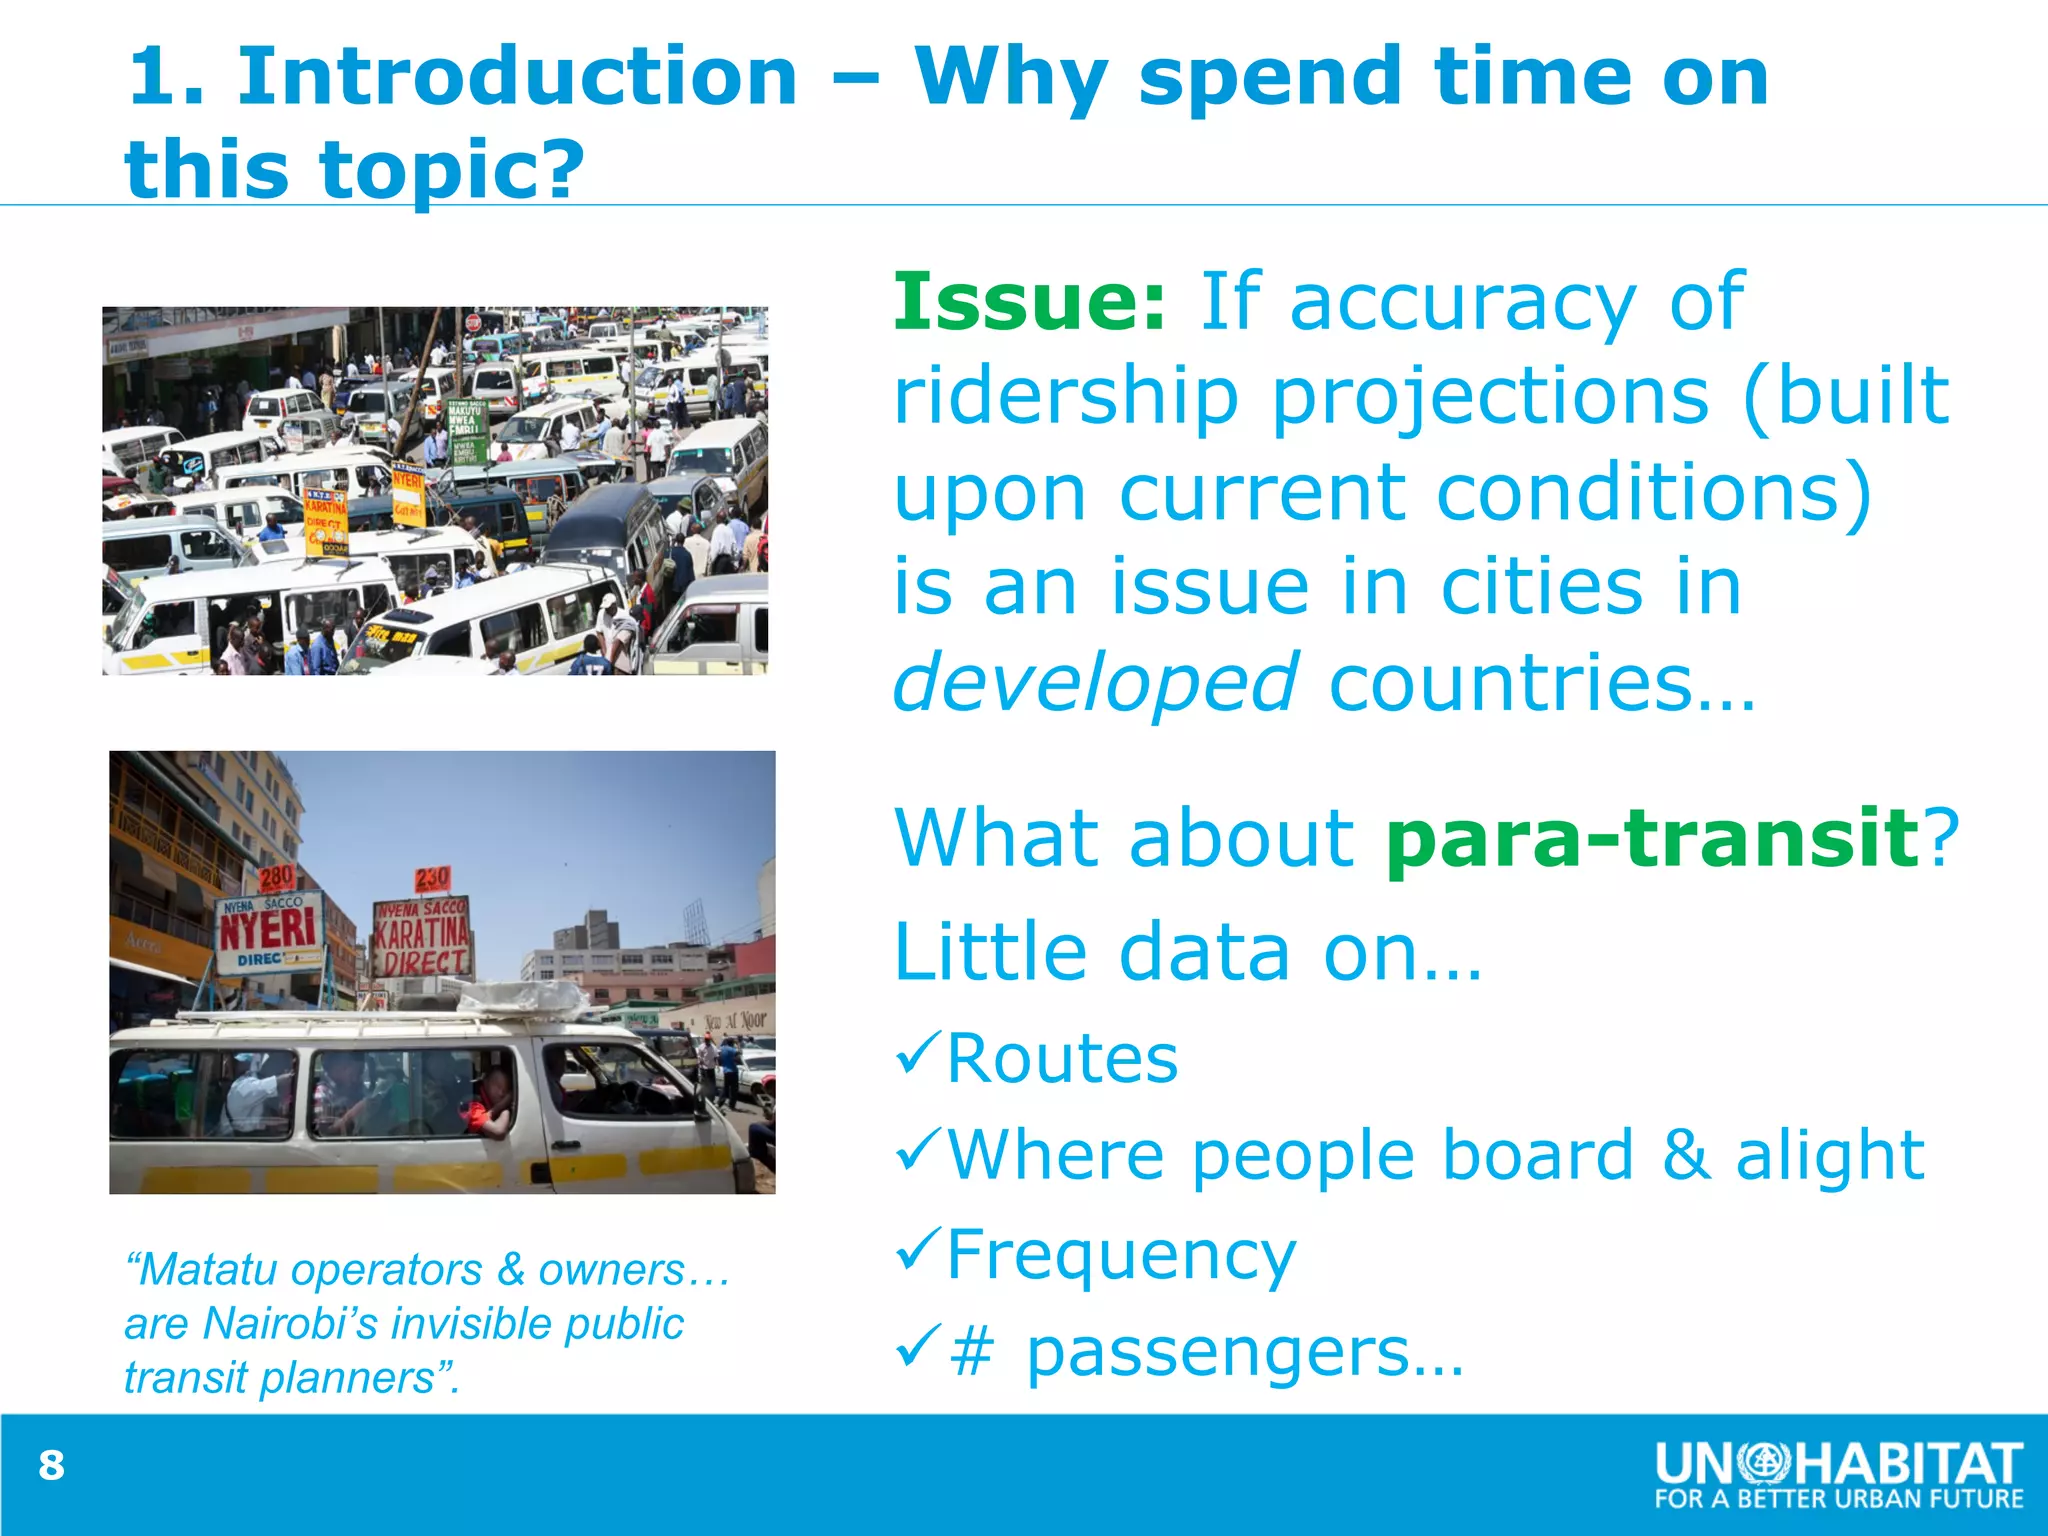
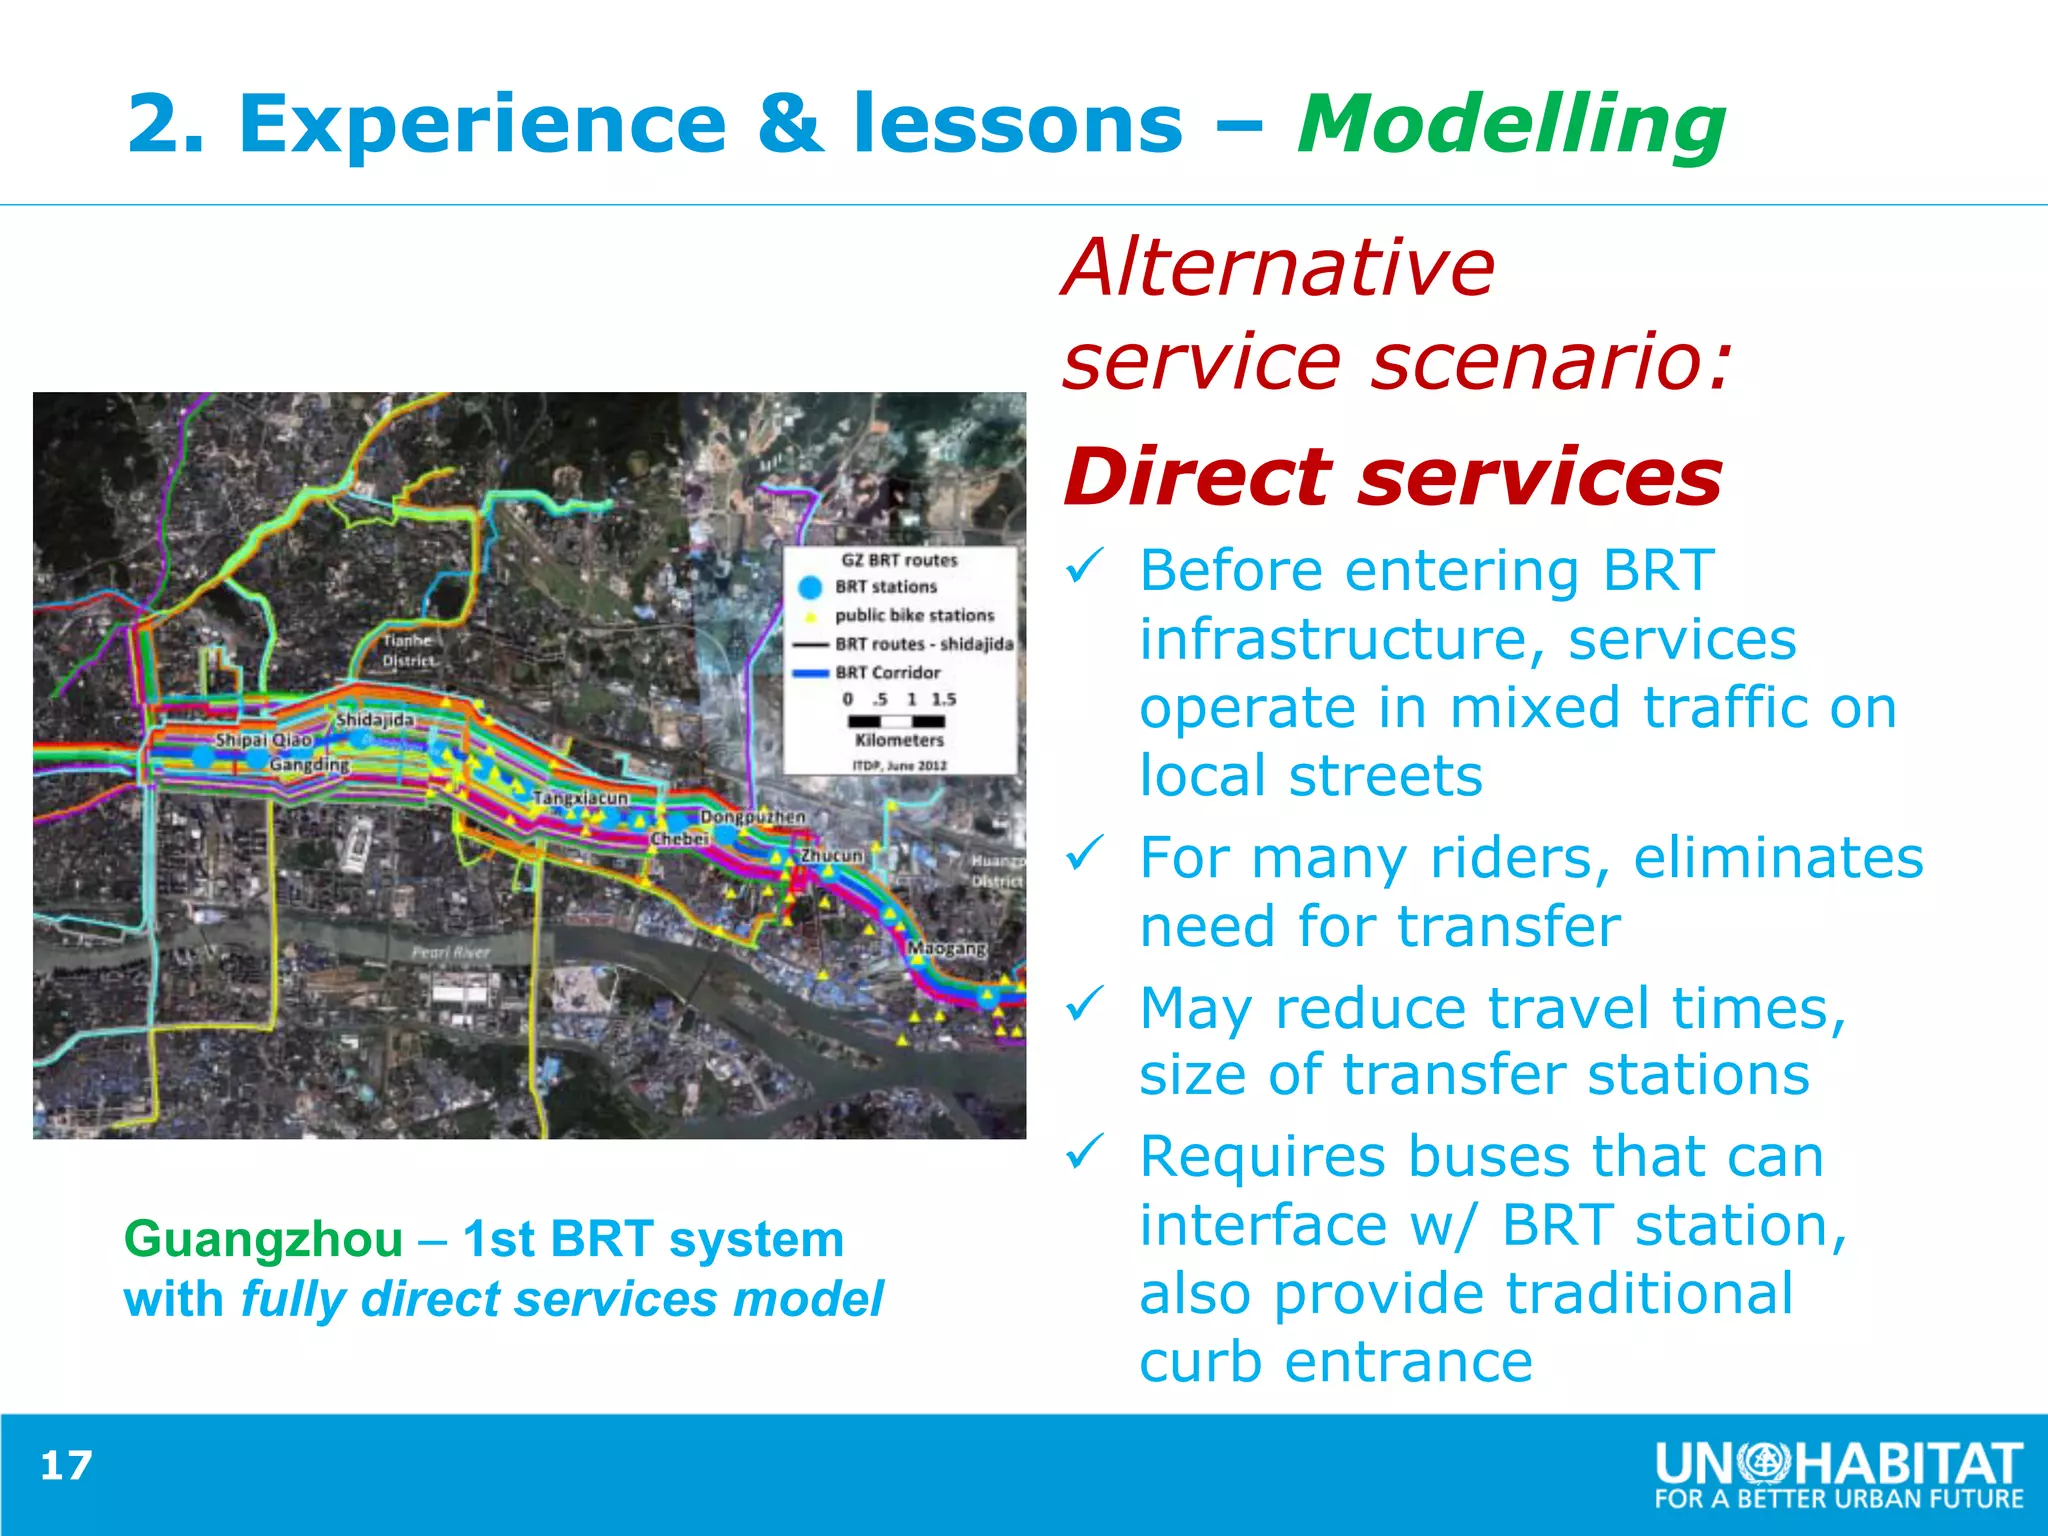
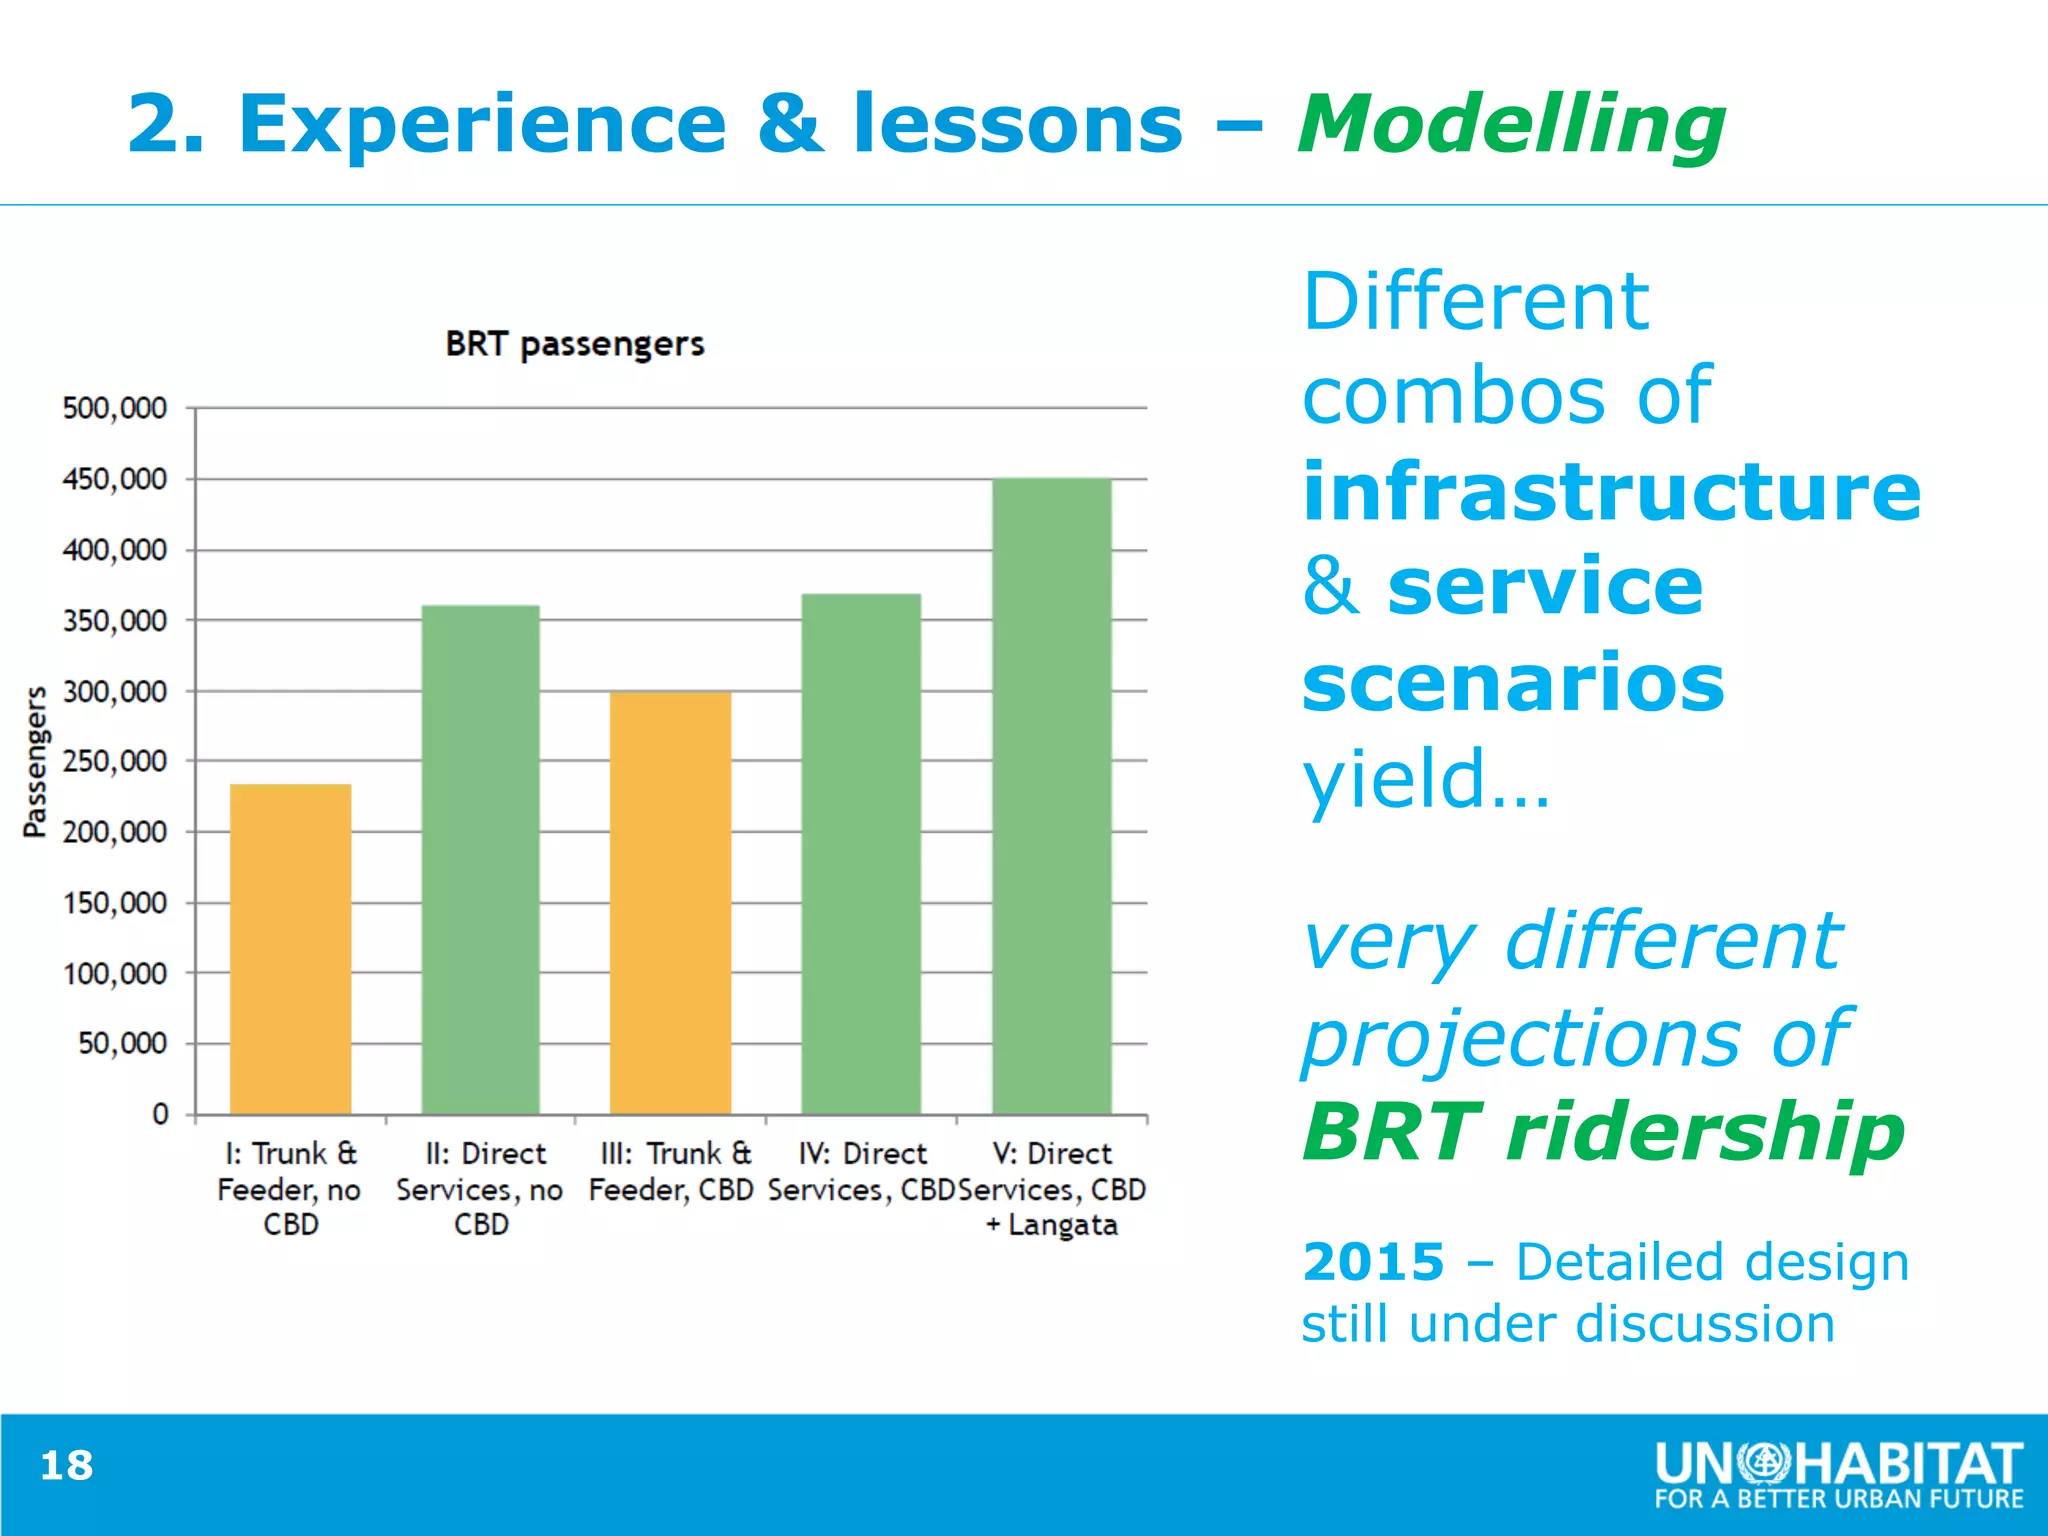
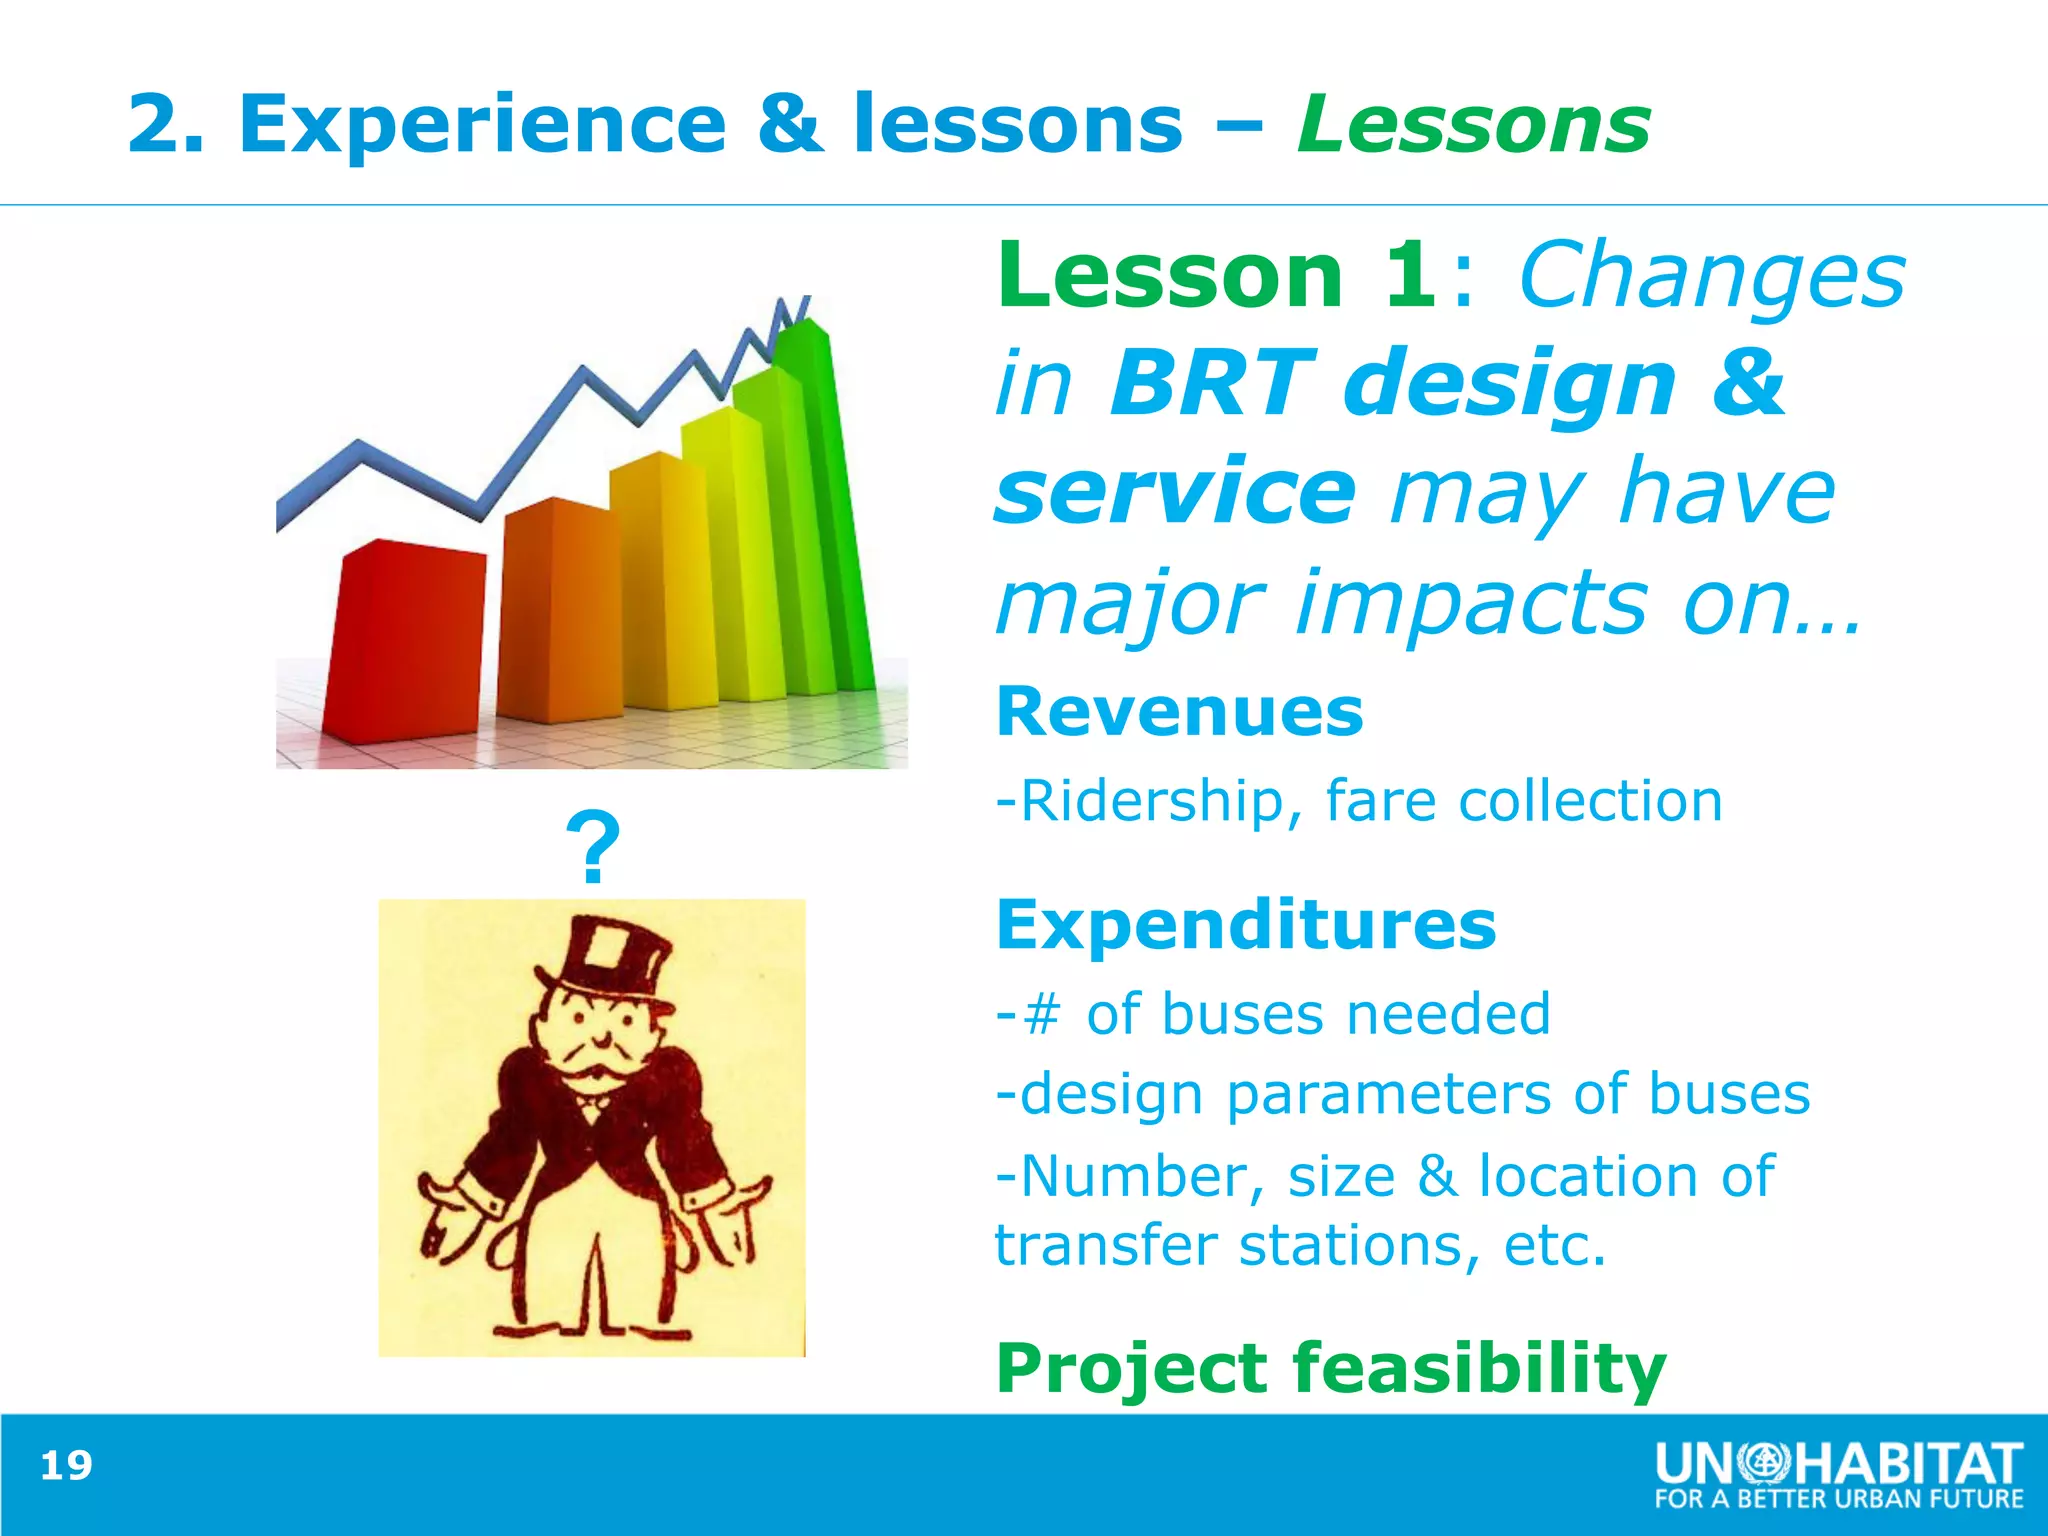
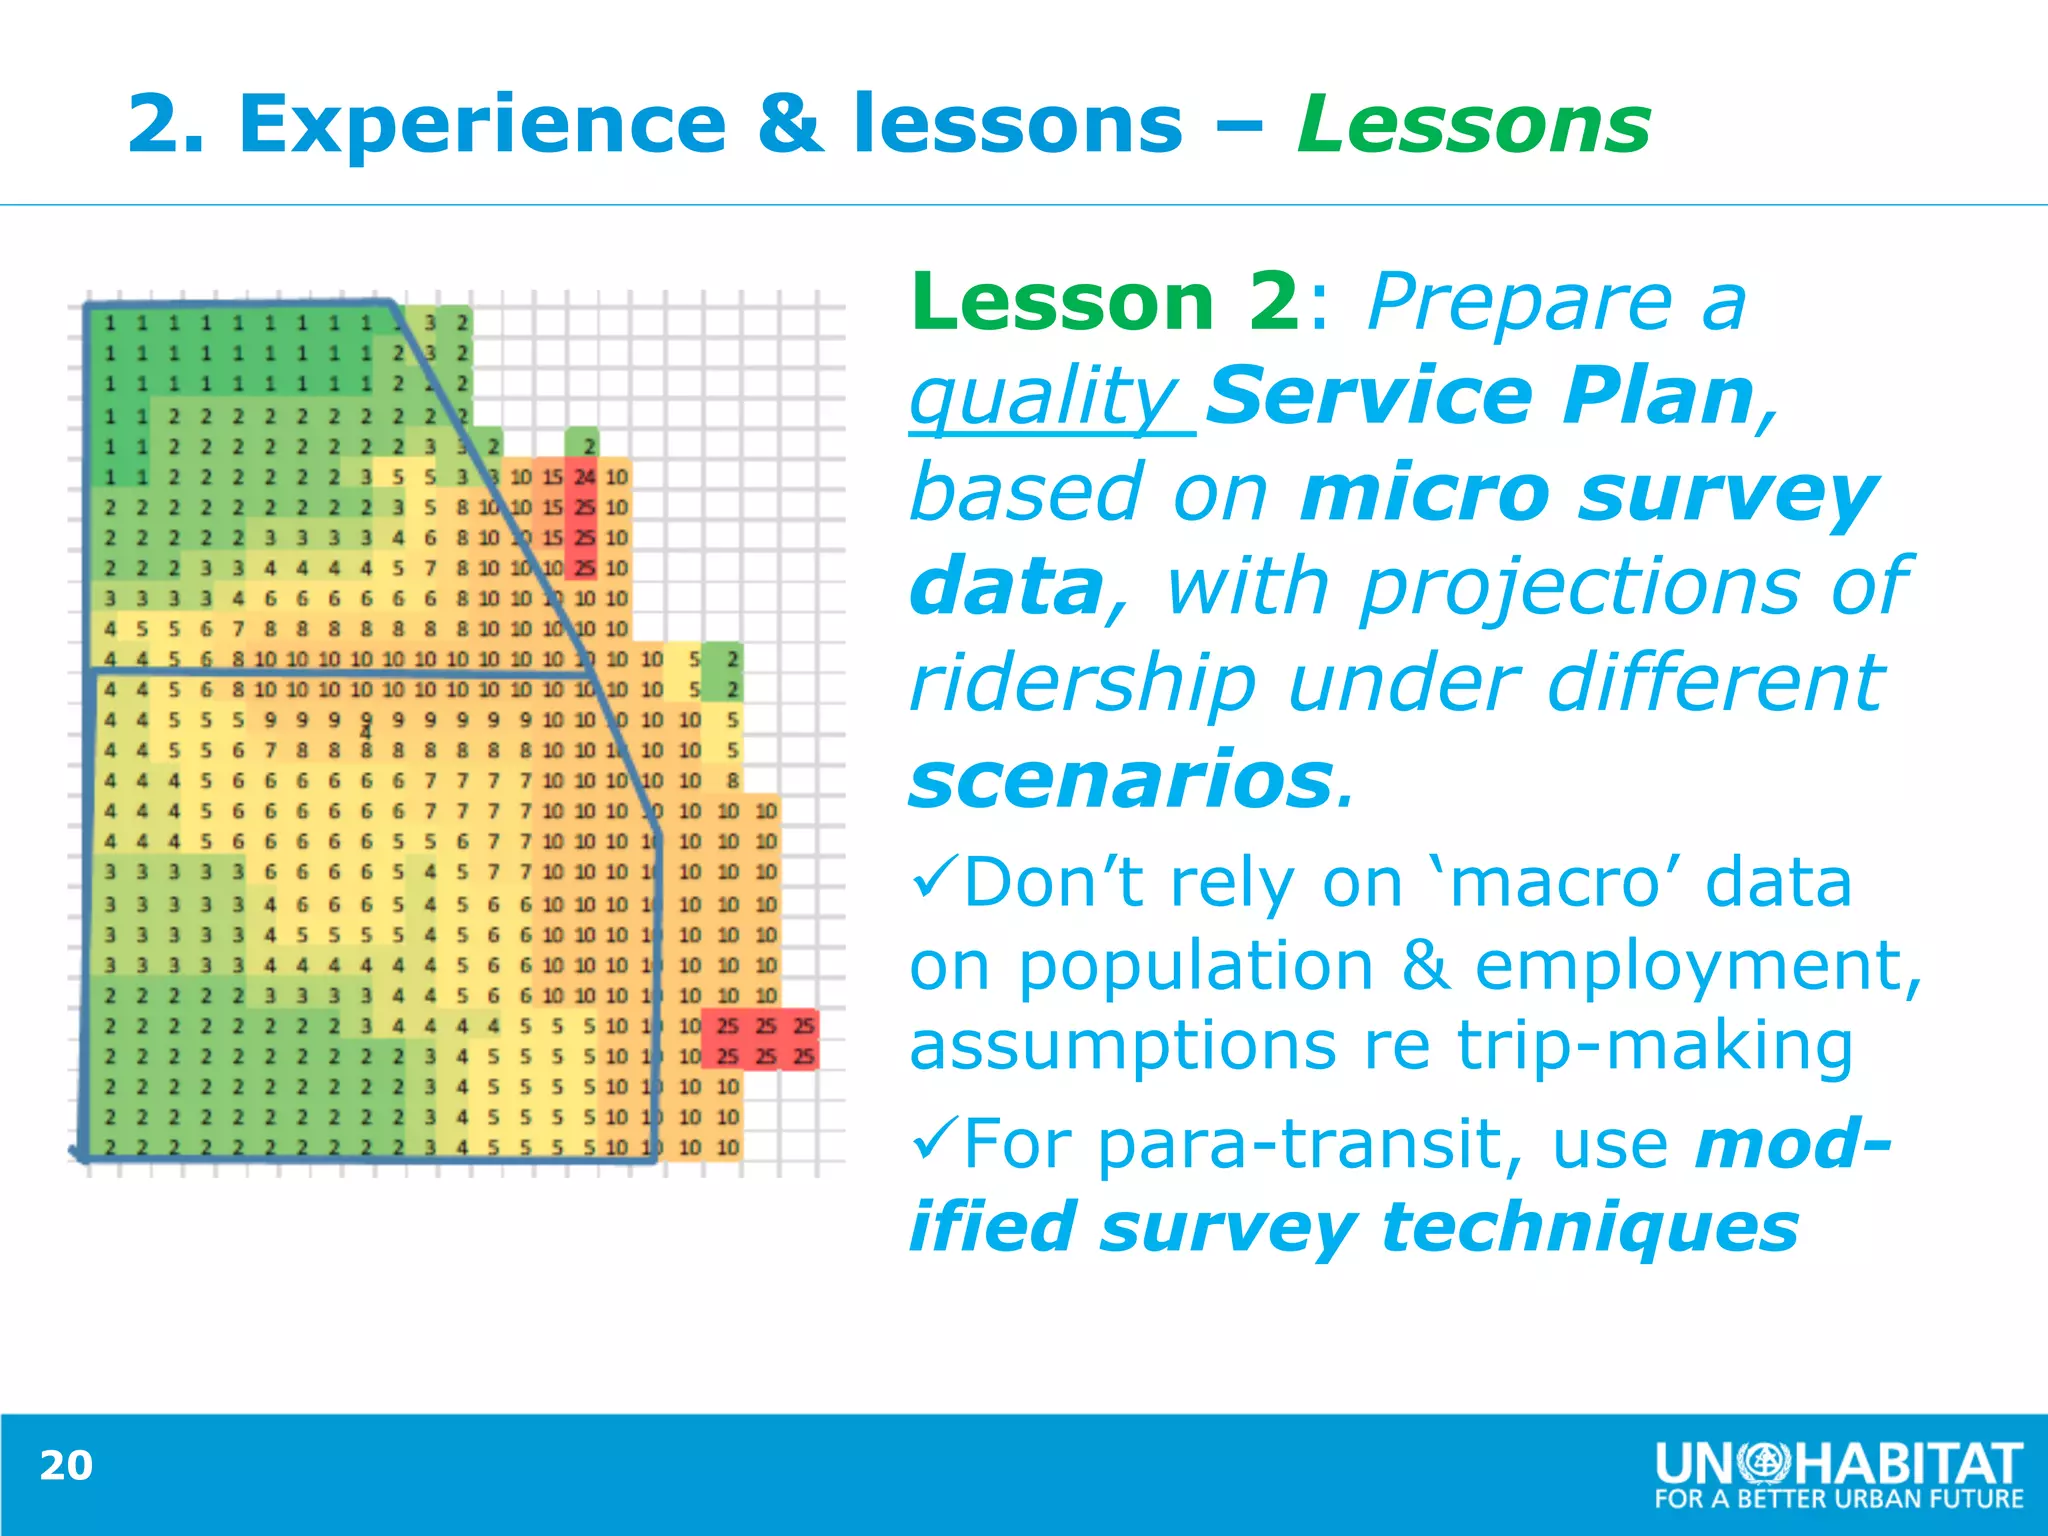
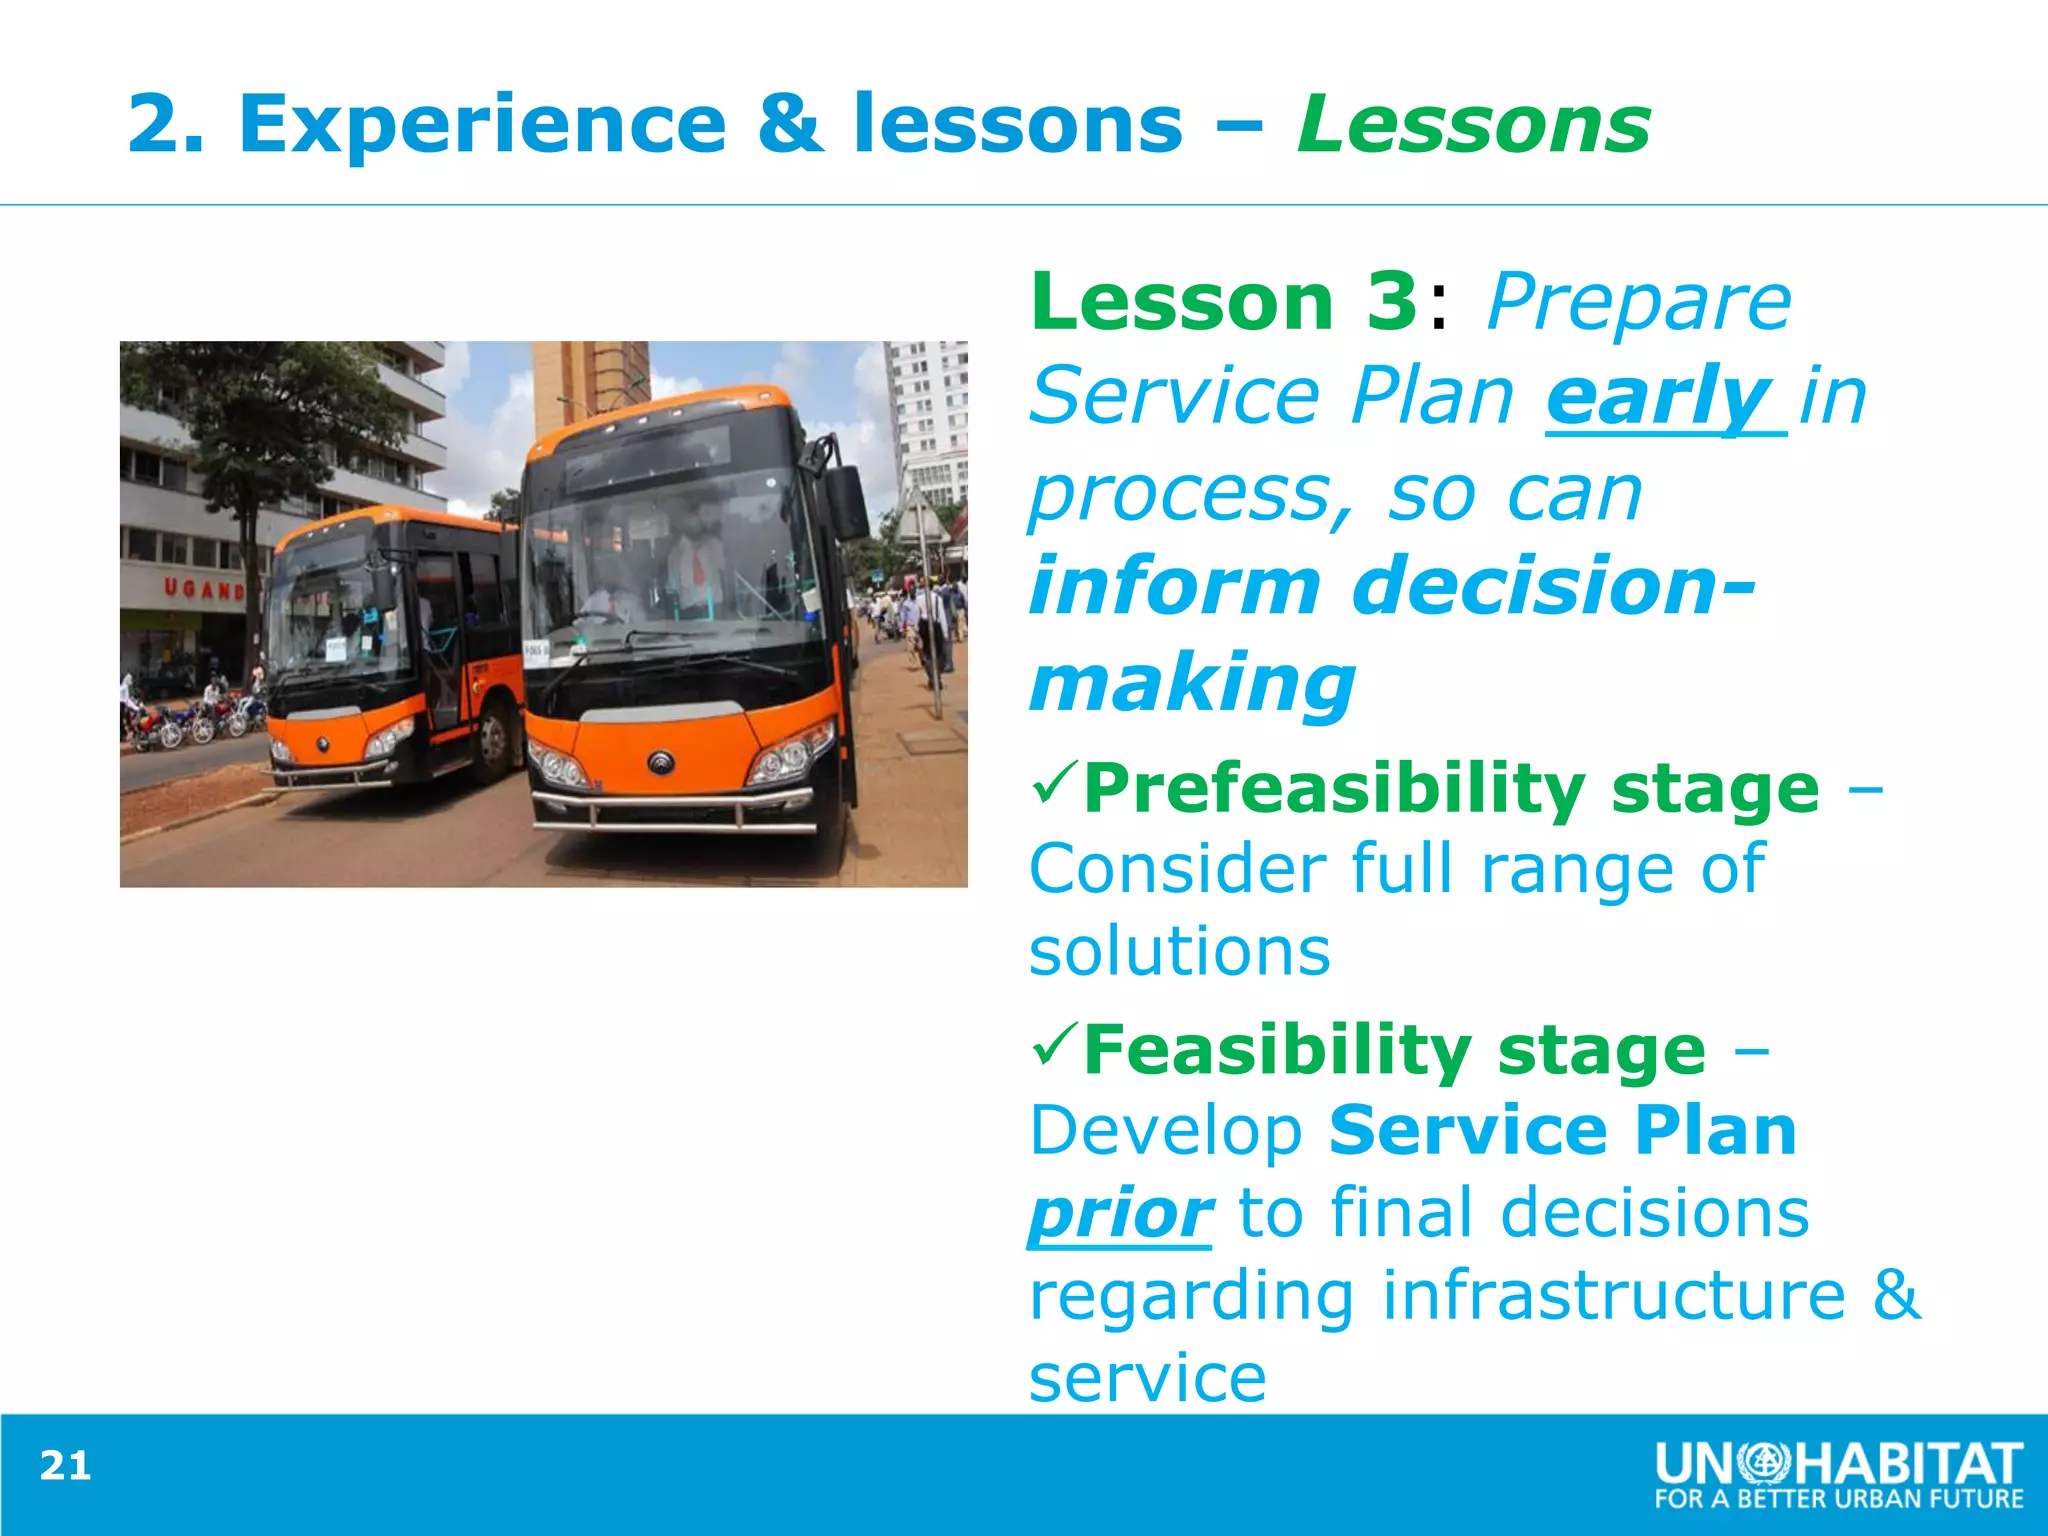
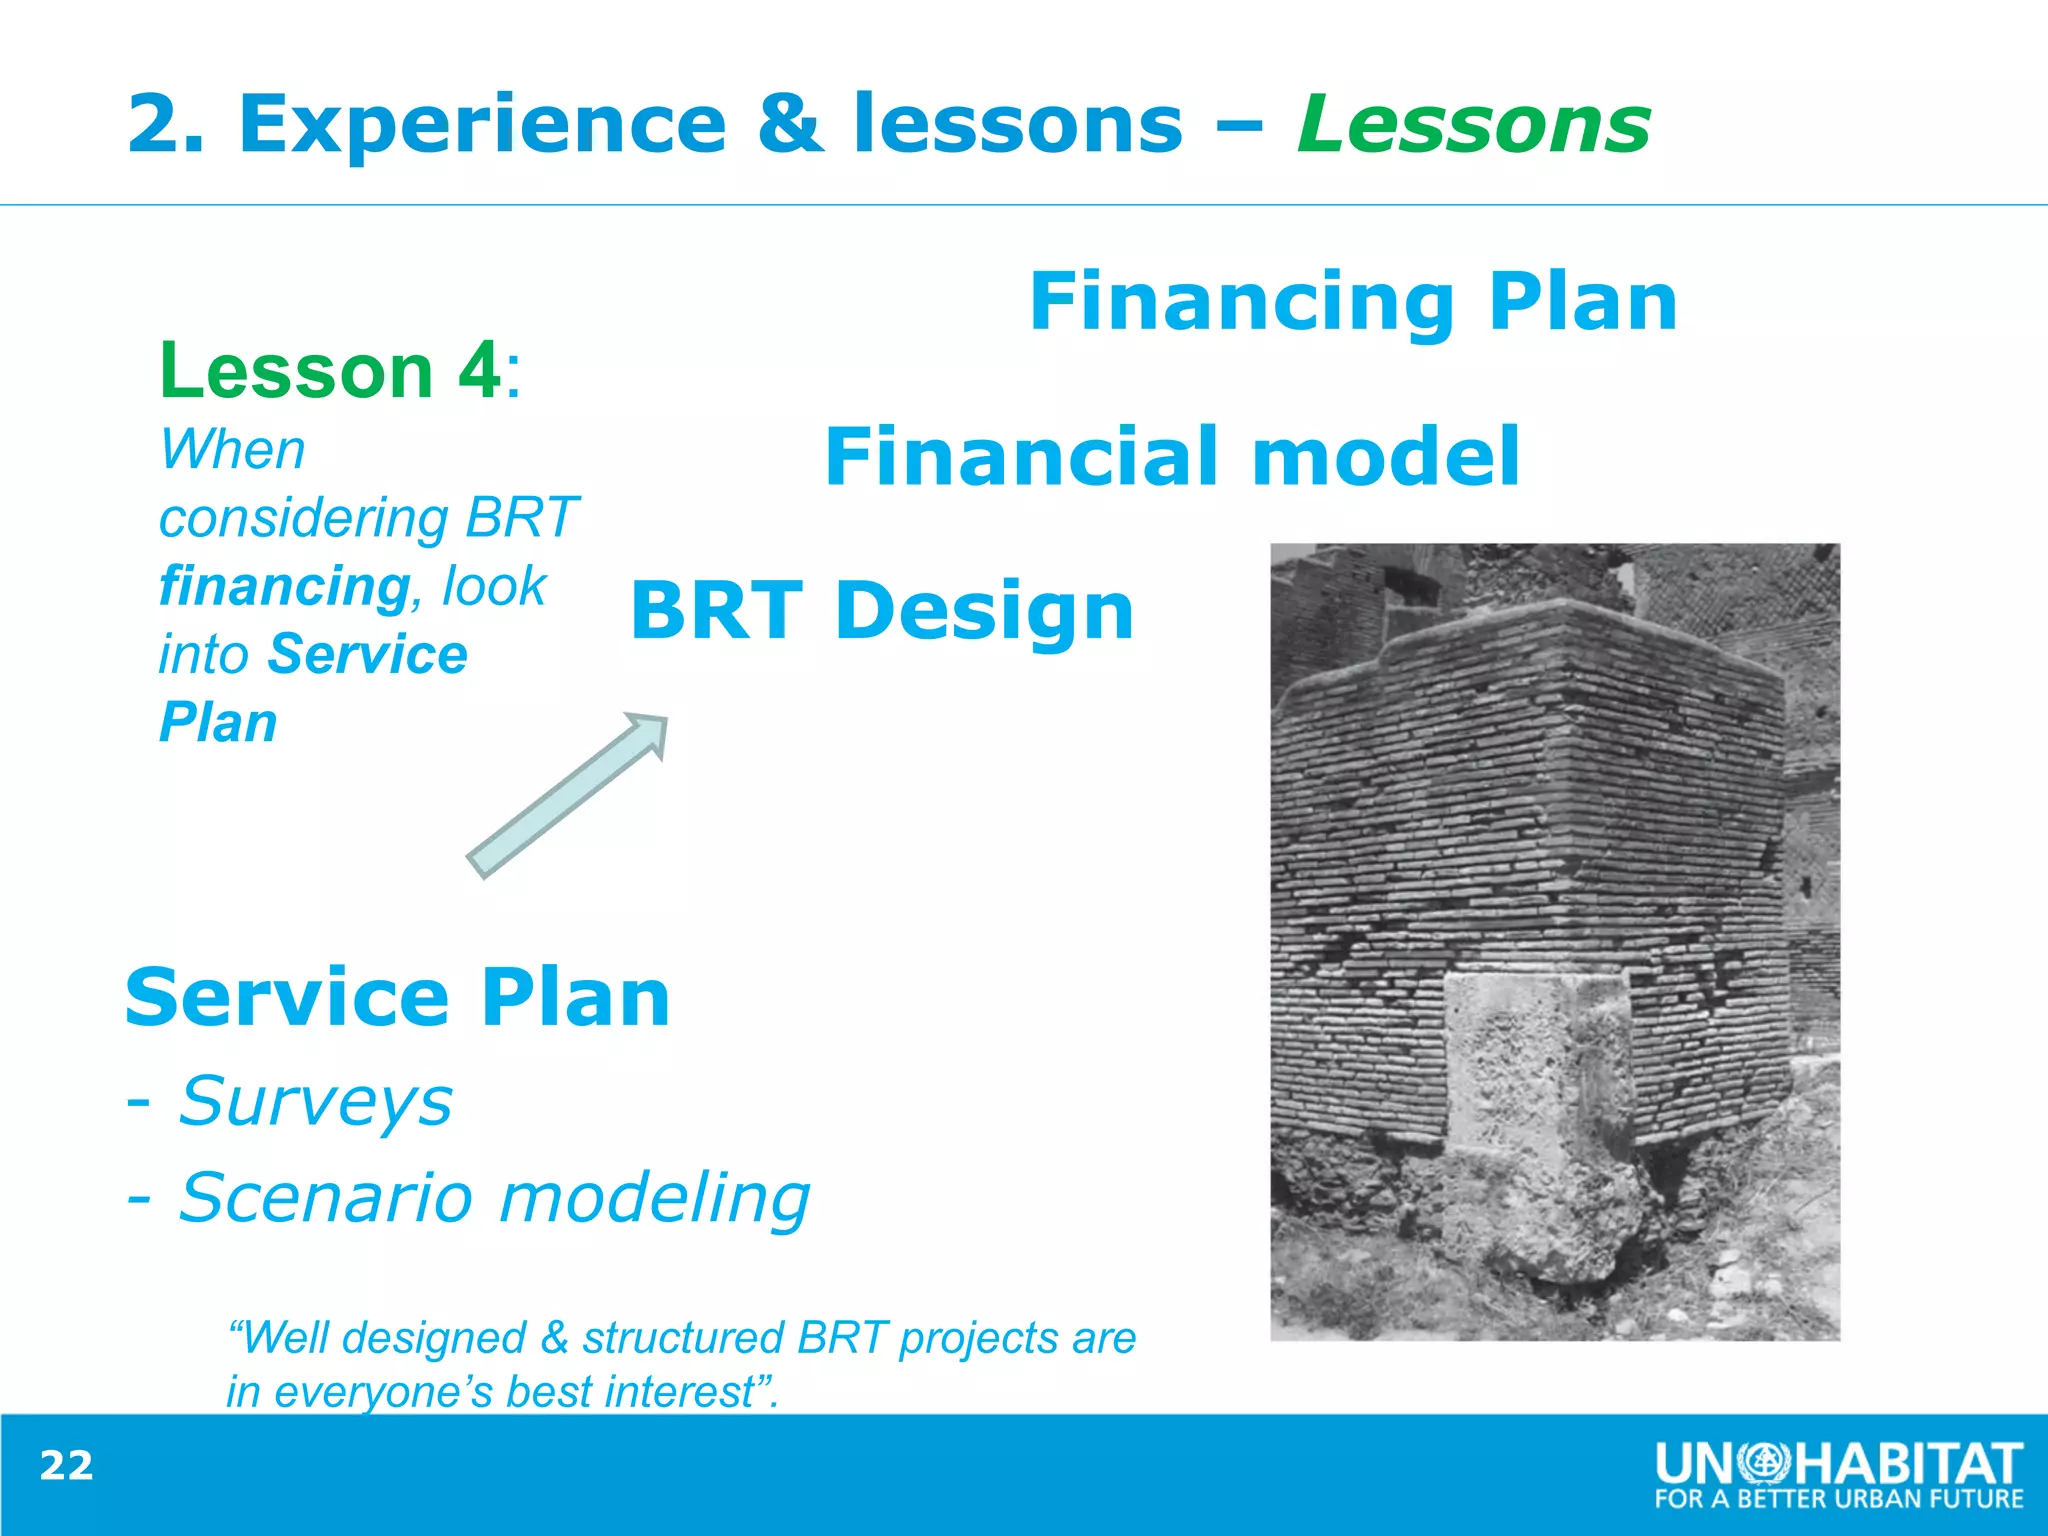
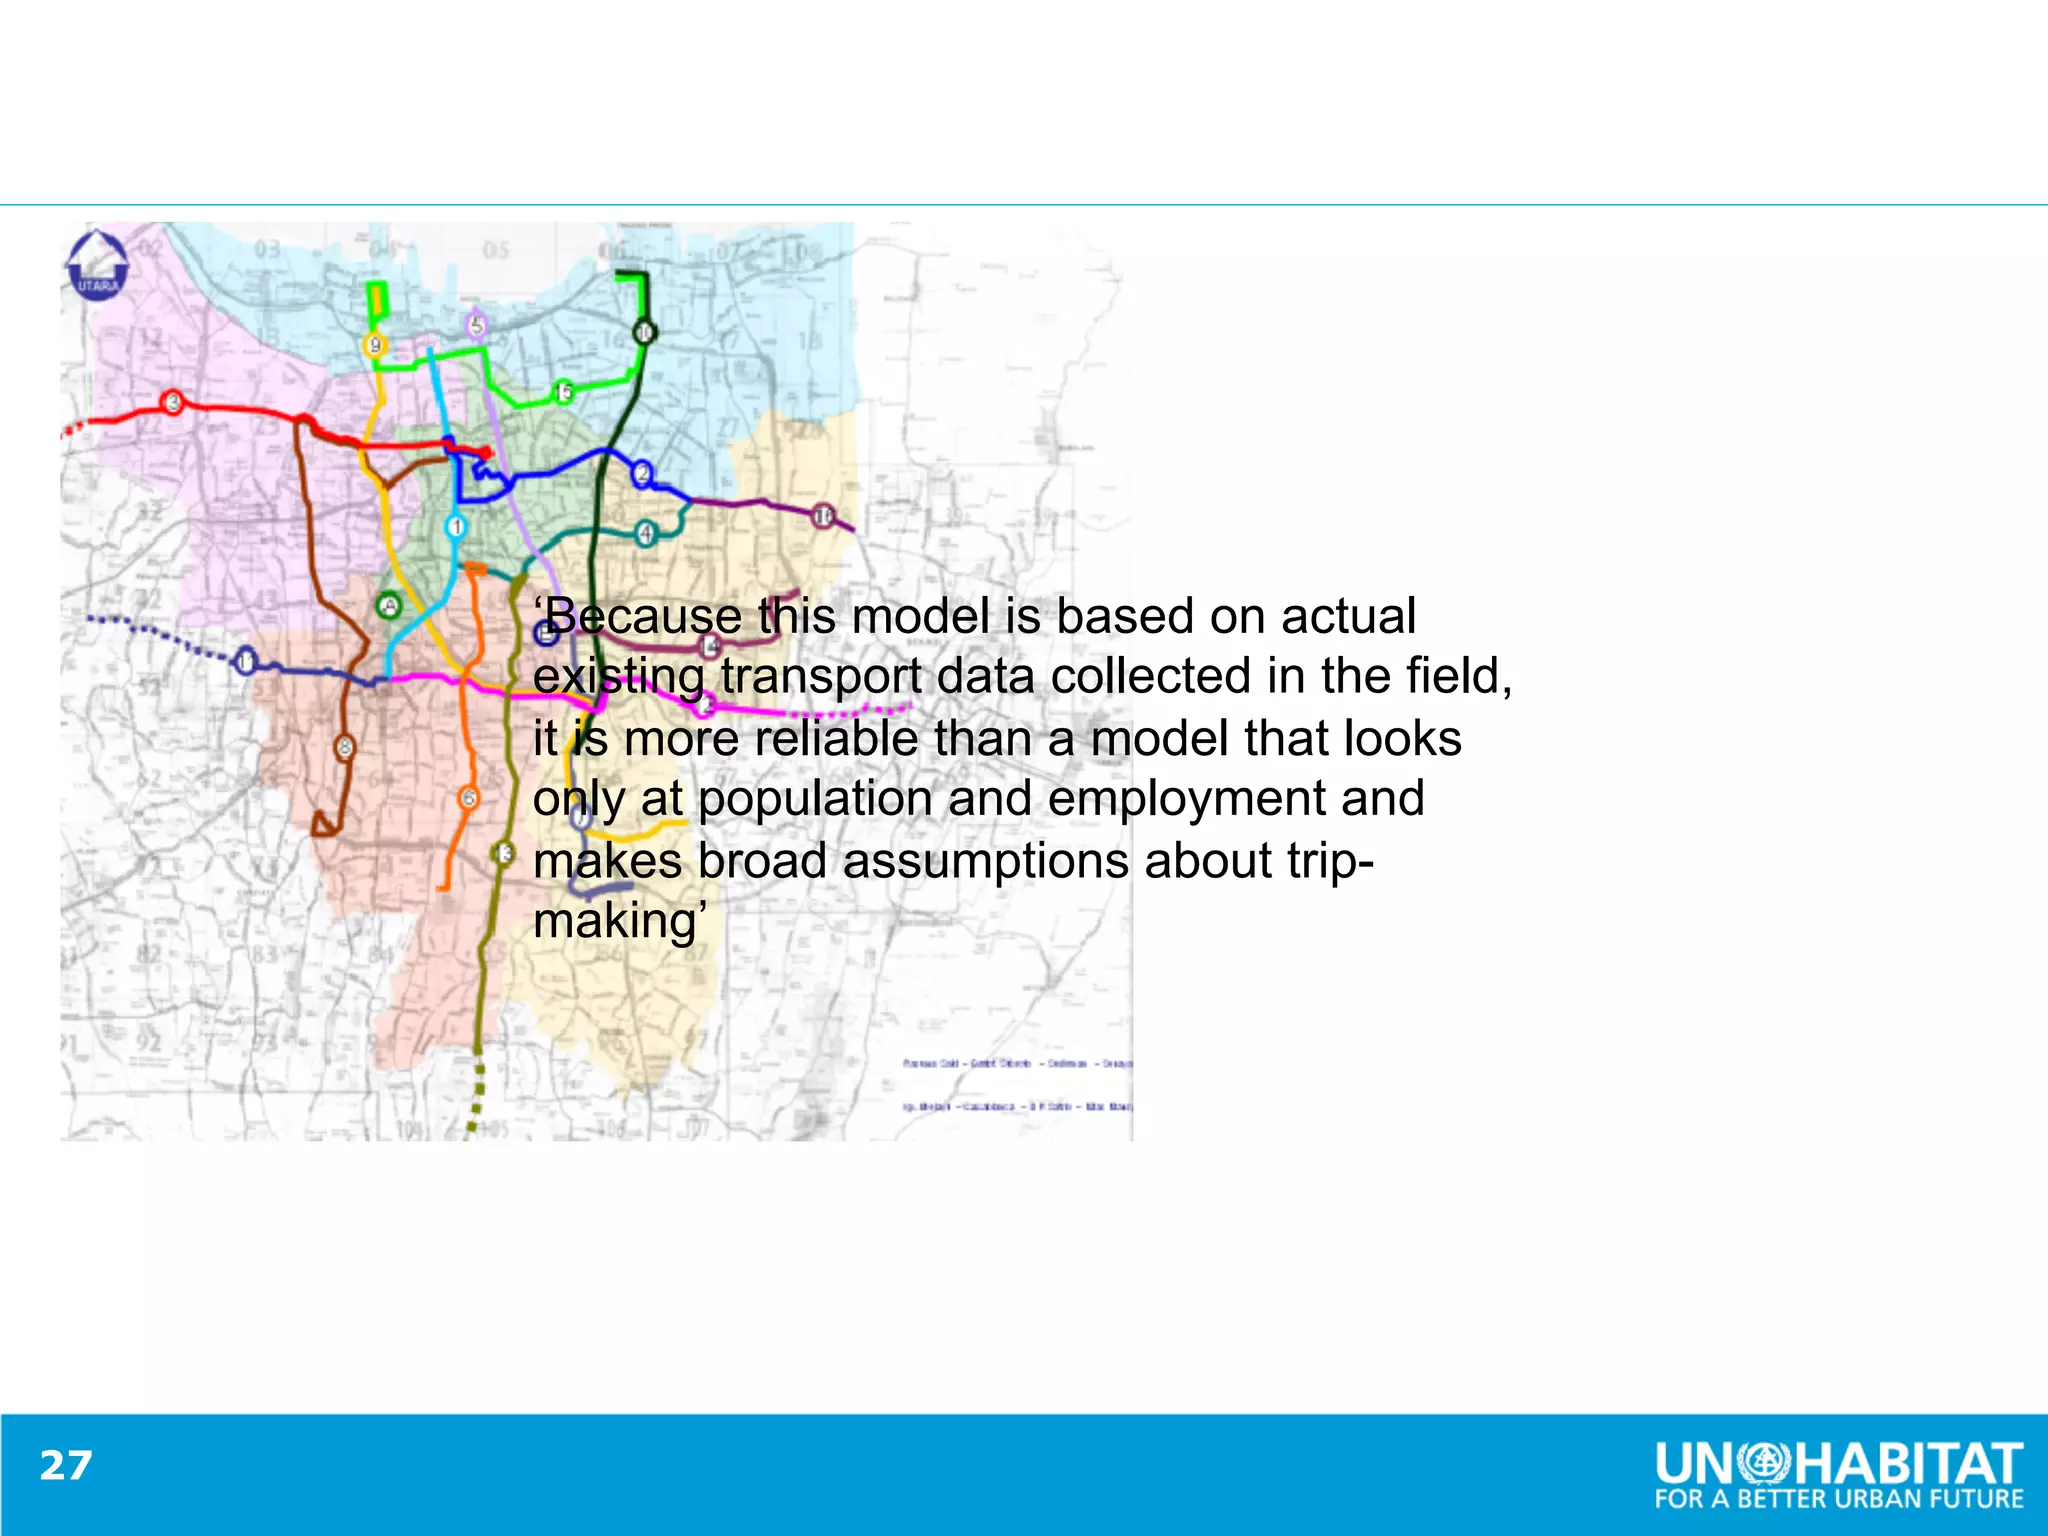

The presentation, delivered during the 5th GIB Summit, focuses on city-led financing for climate infrastructure, specifically examining Bus Rapid Transit (BRT) projects. It highlights the importance of accurate ridership projections and innovative service planning to ensure sustainable urban infrastructure that addresses climate change impacts. The document underscores lessons learned from various case studies, advocating for quality service plans and early preparation to maximize investment in low-carbon, climate-resilient infrastructure.


