The document provides a step-by-step guide for importing tab-separated value (TSV) files of earthquake data into QGIS, a geographic information system. It describes how to download earthquake data, examine the tabular format, and utilize the QGIS data source manager to import the data as a point layer. The tutorial highlights key settings to adjust during the import process, such as specifying field delimiters and coordinate definitions.
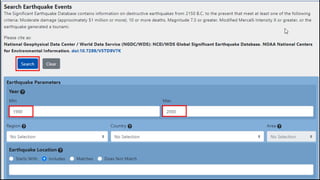
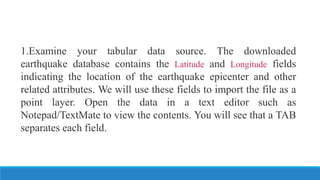
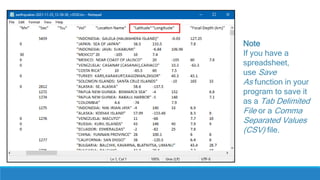
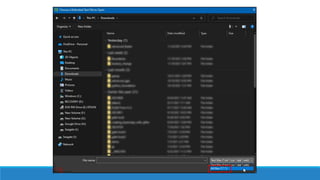
![For convenience, you may directly download a copy of the
above datasets from the link below:
earthquakes-2023-09-12_17-19-15_+0530.tsv
Data Source [NCEI]](https://image.slidesharecdn.com/gis8-240621133514-e2aef636/85/Geographic-Information-Systems-GIS-for-BSIT-8-320.jpg)