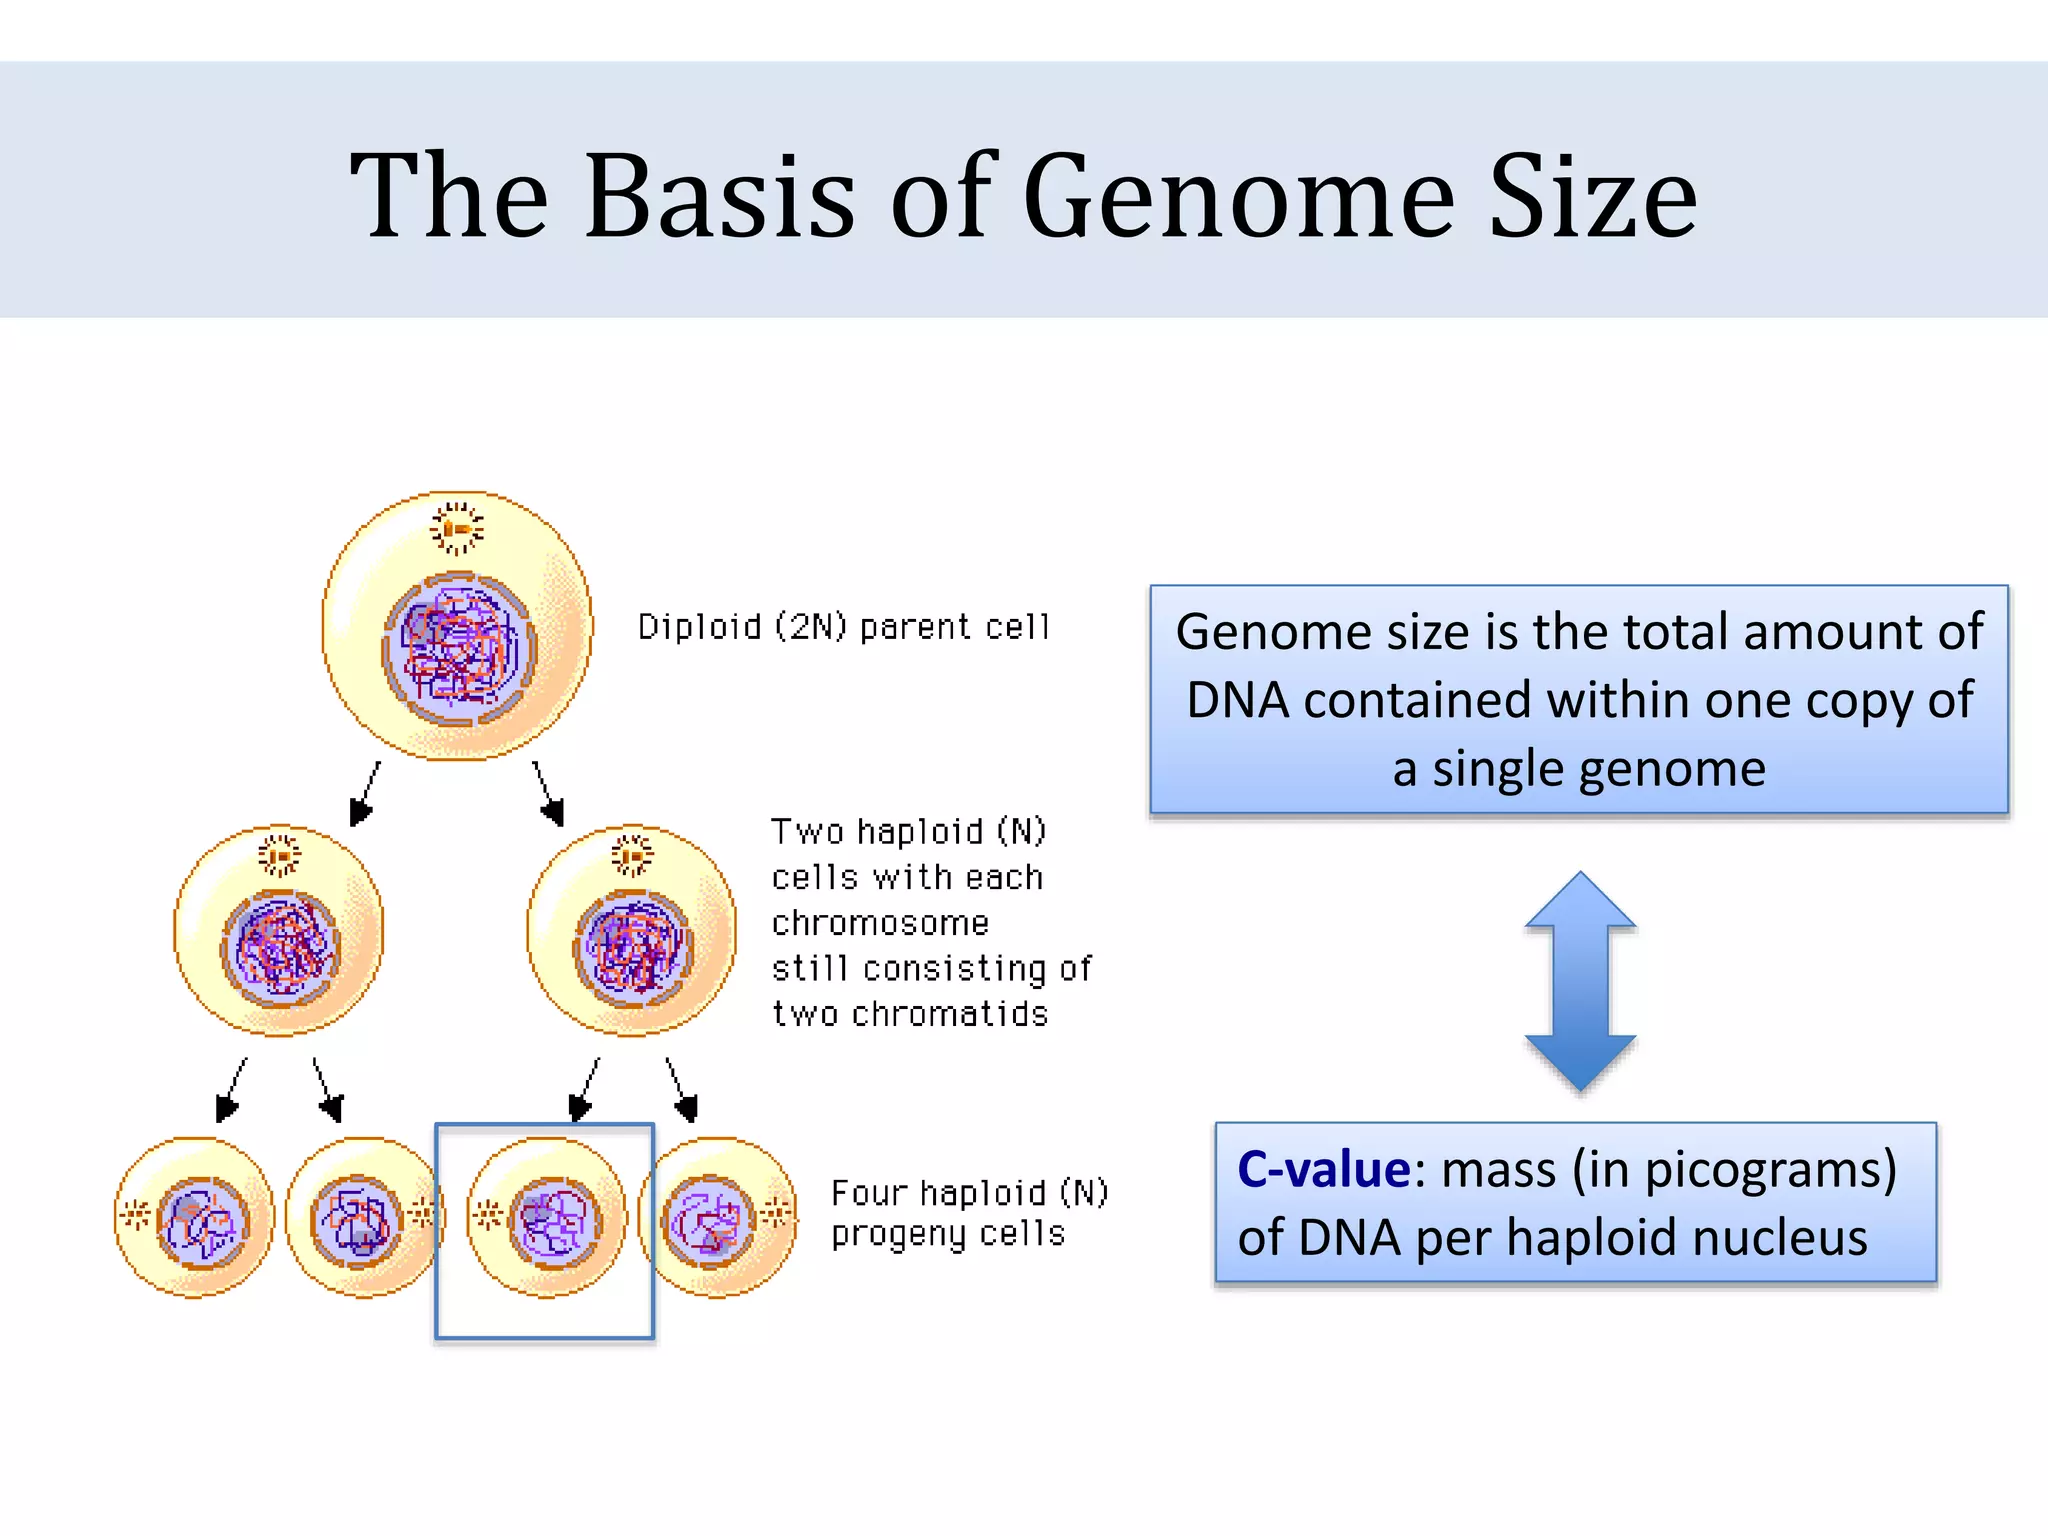
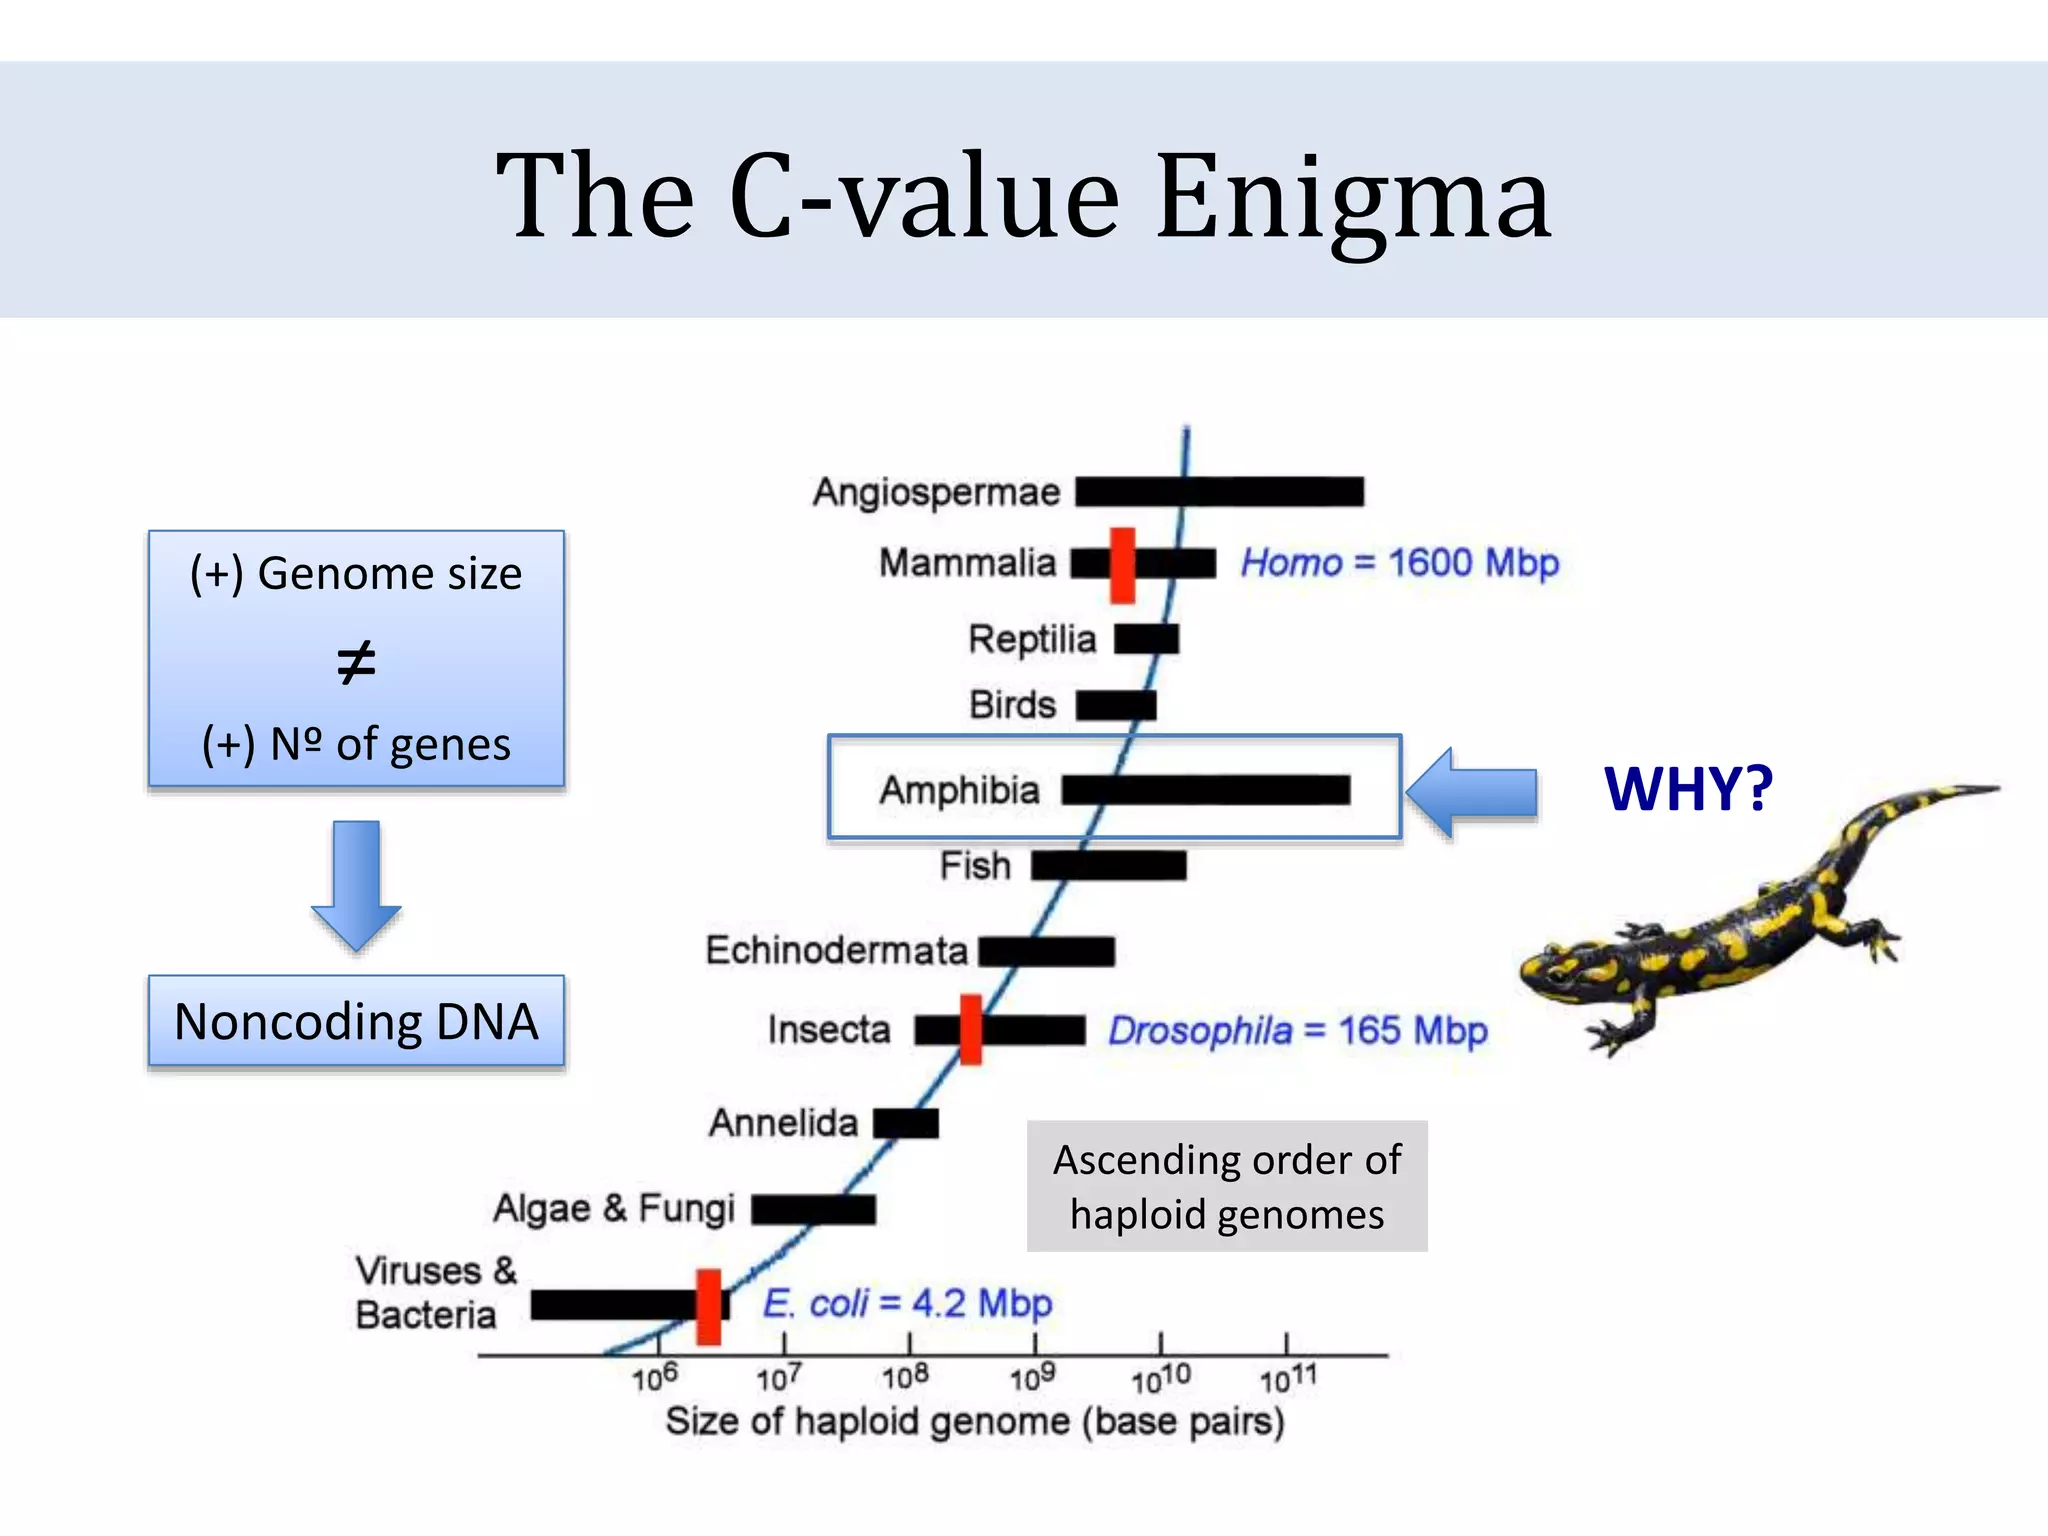
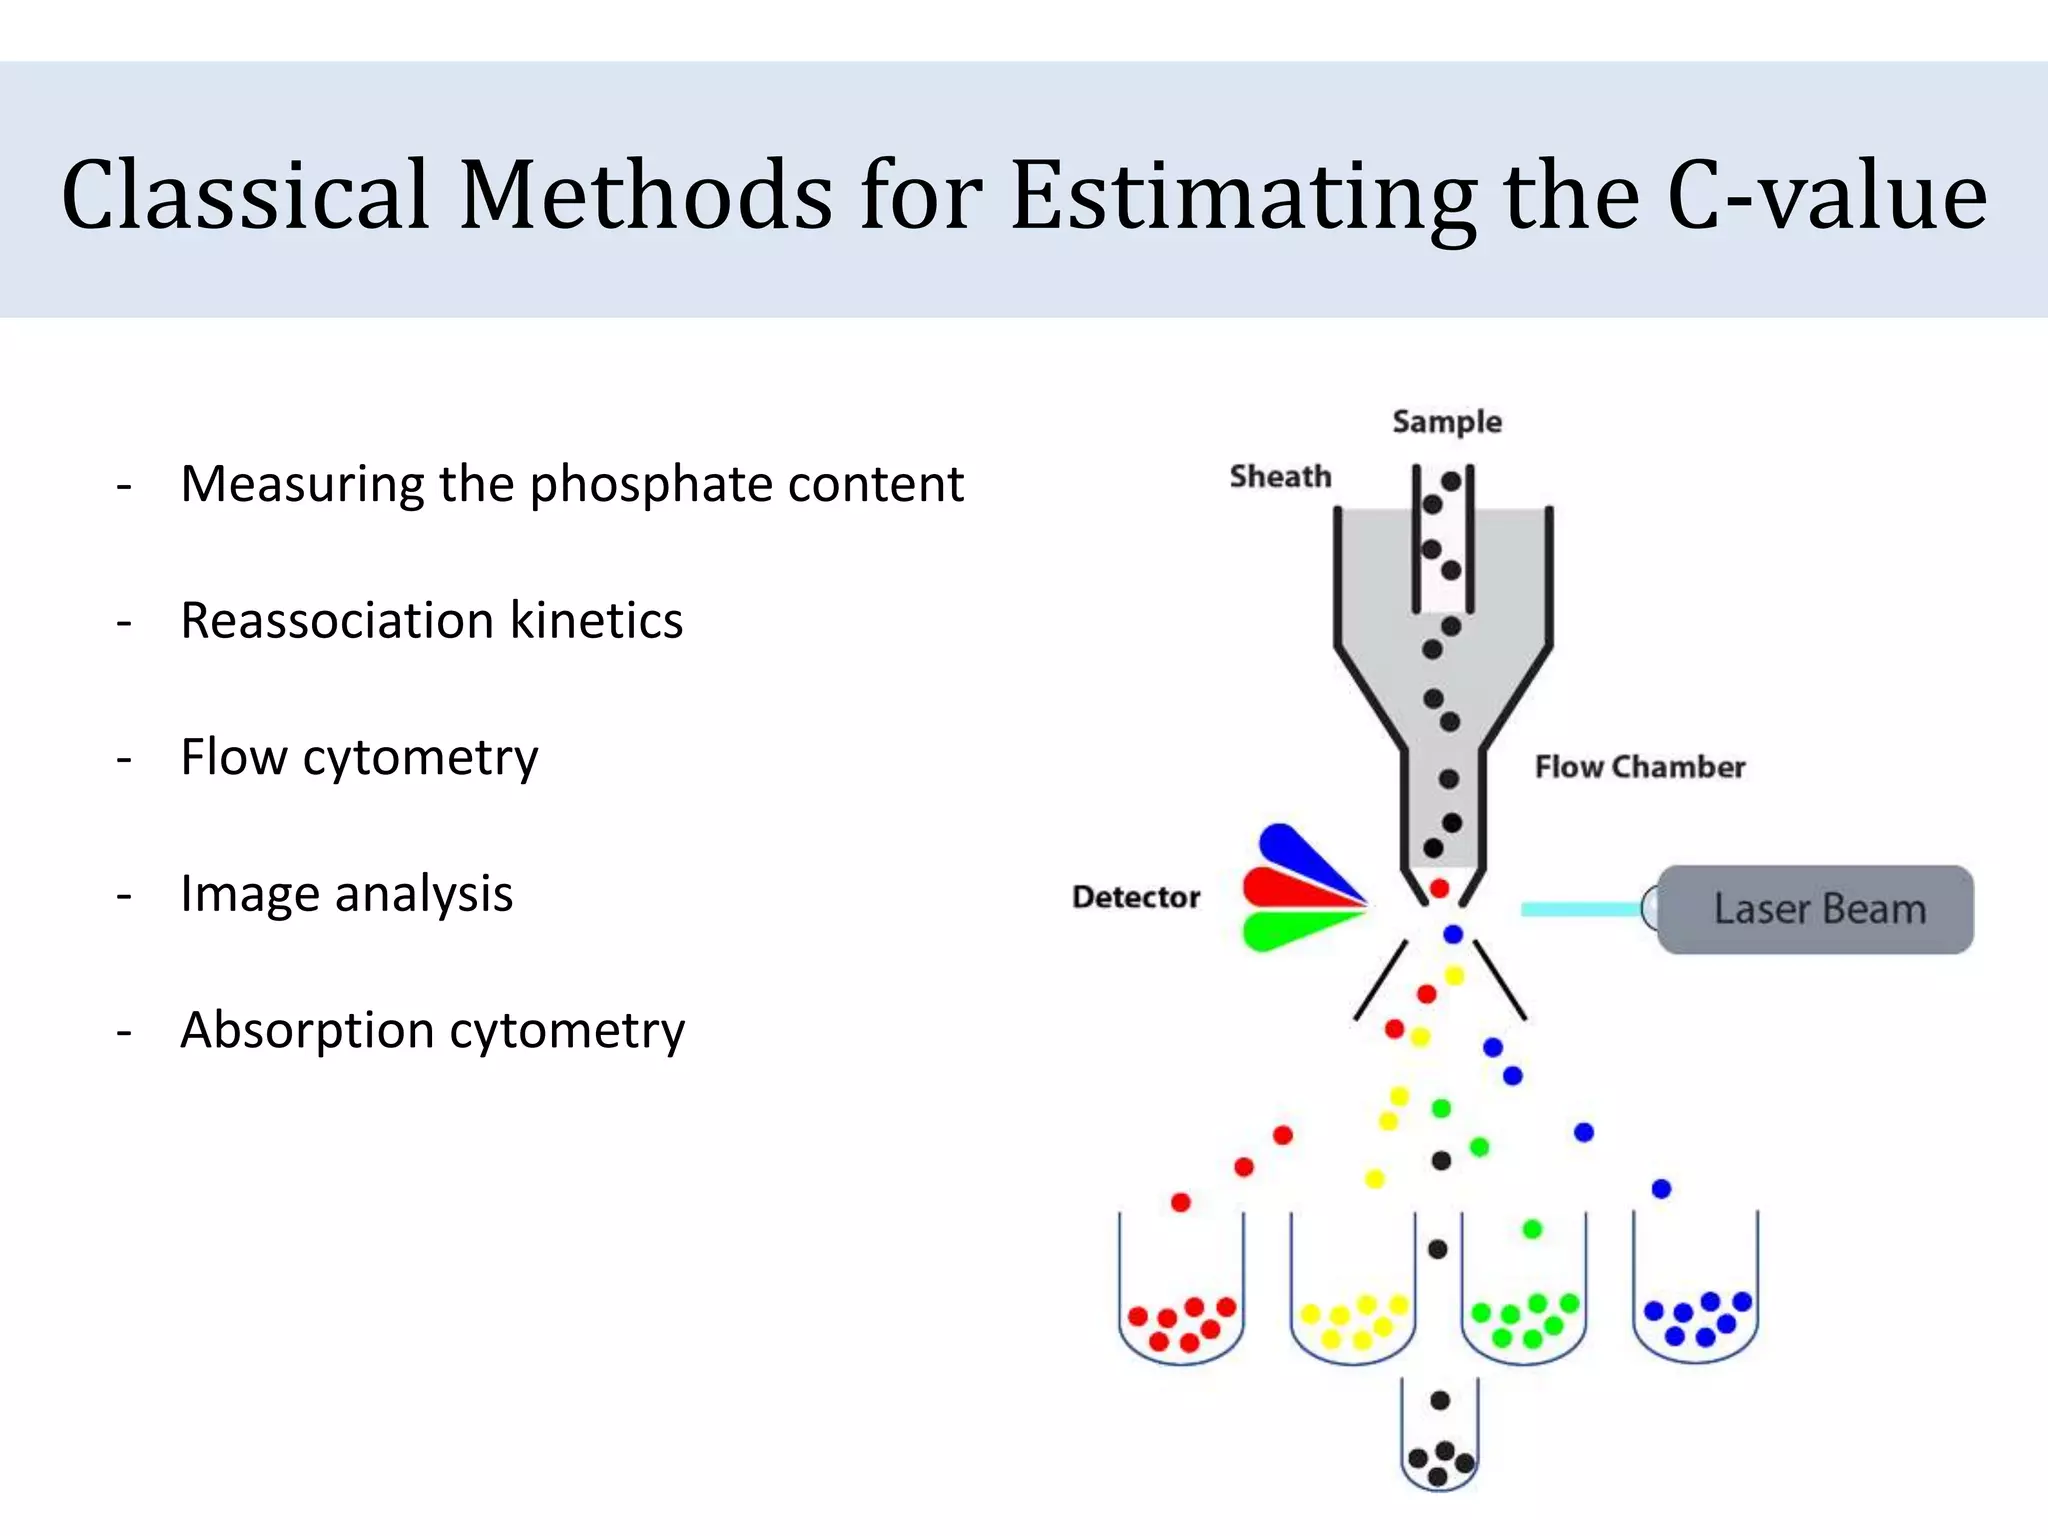
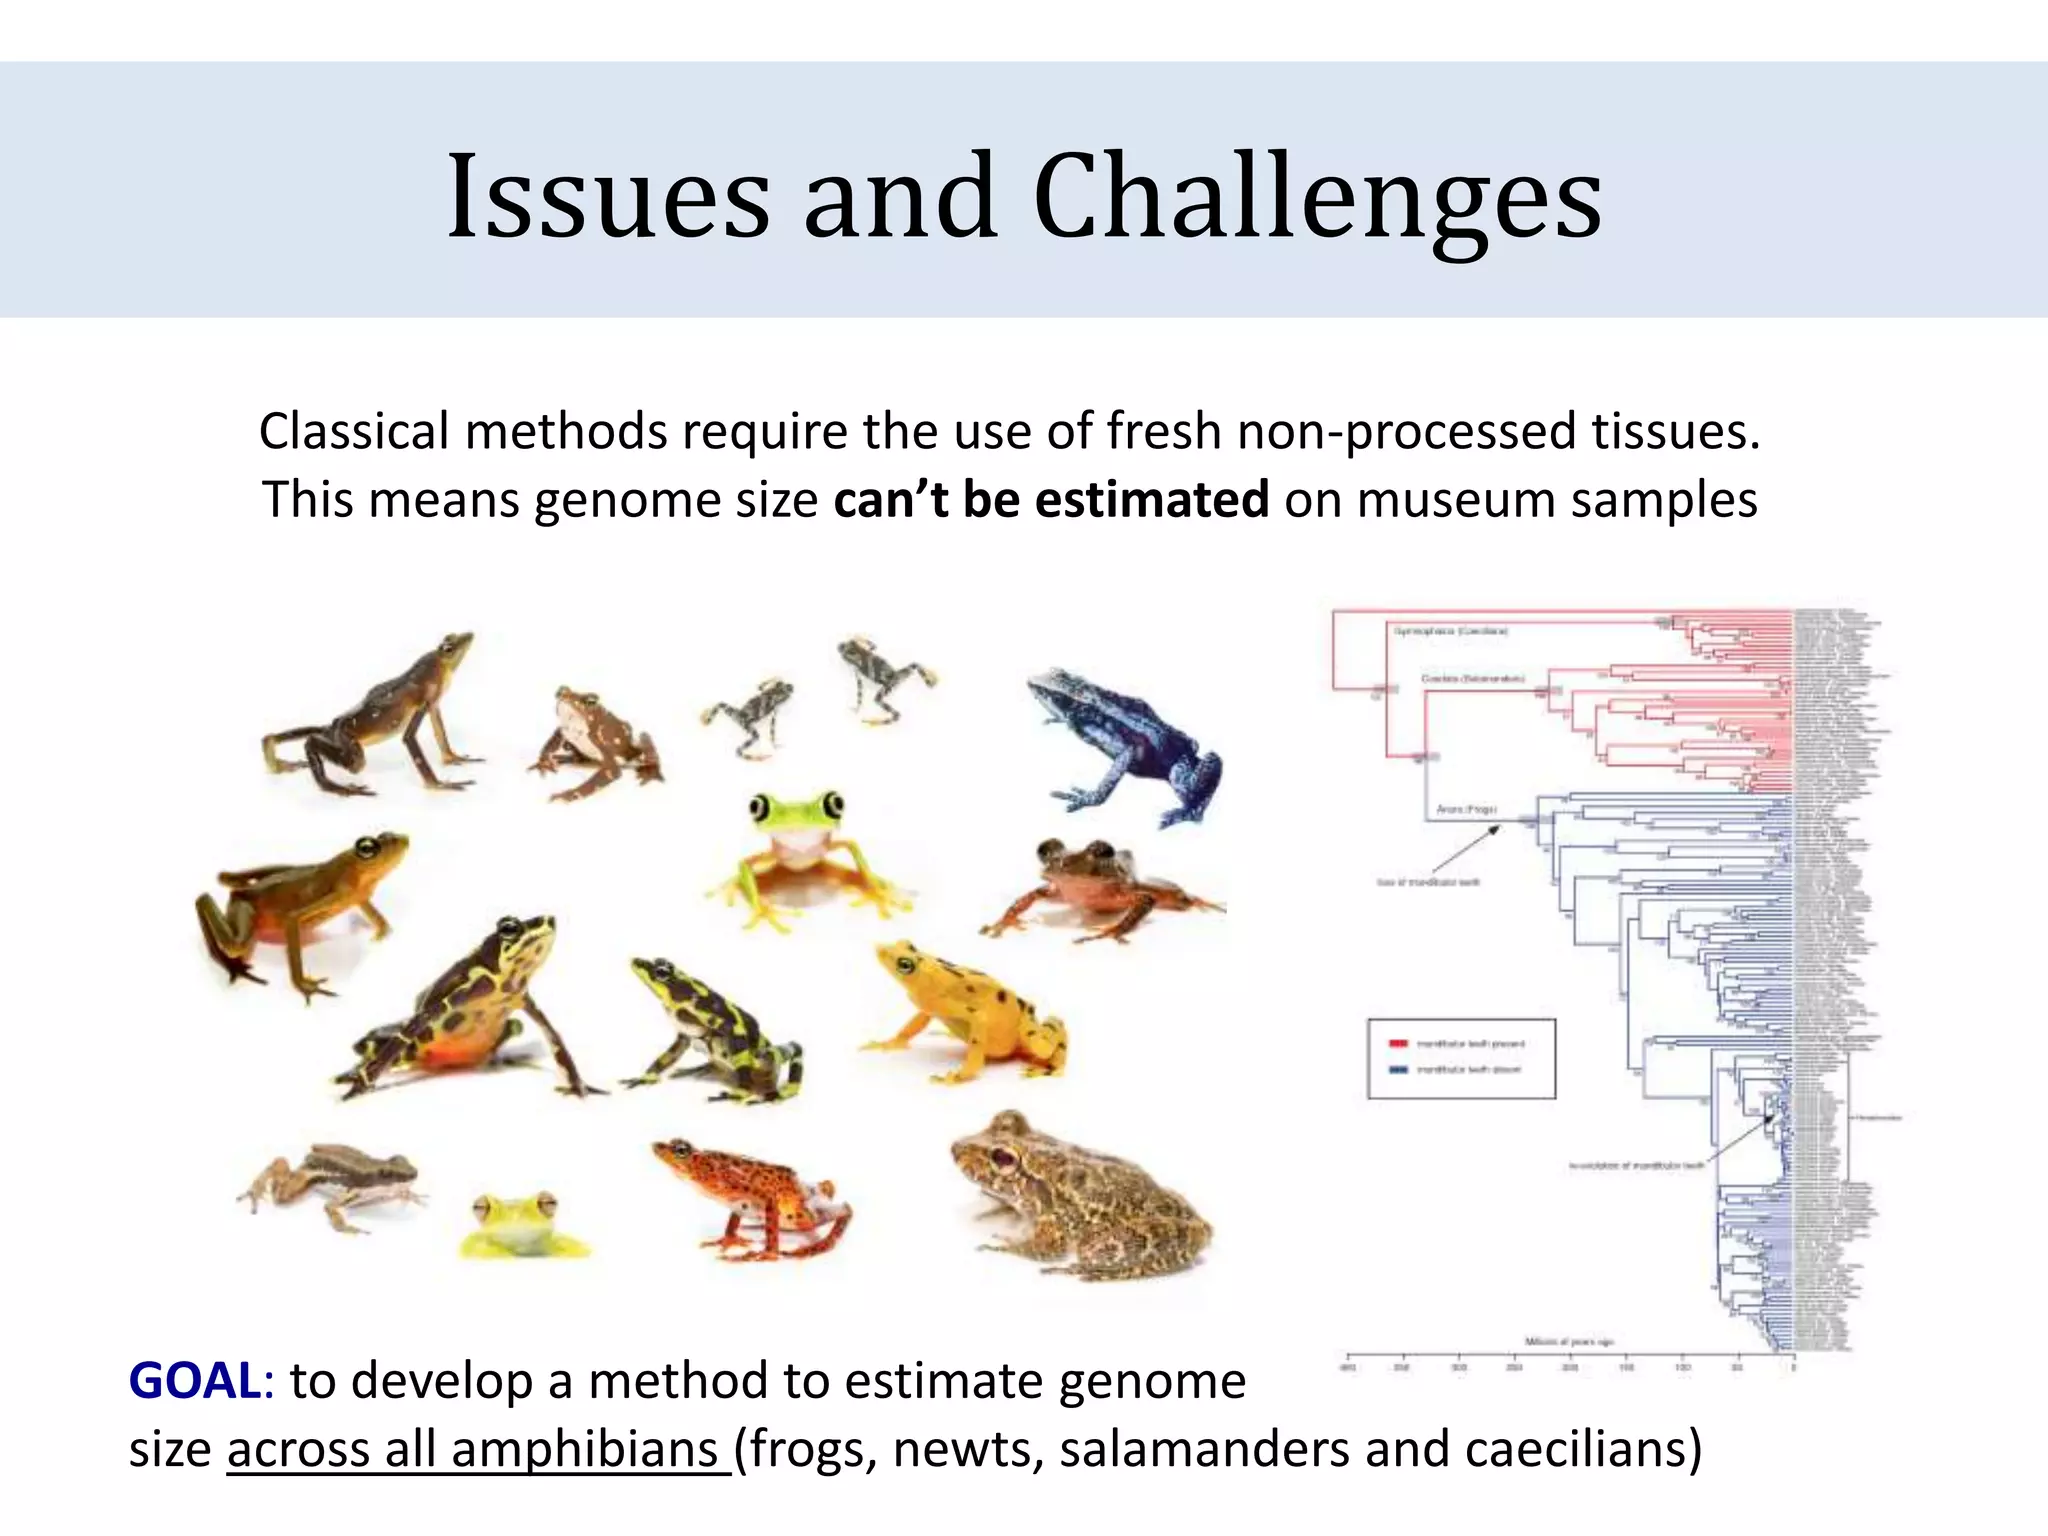
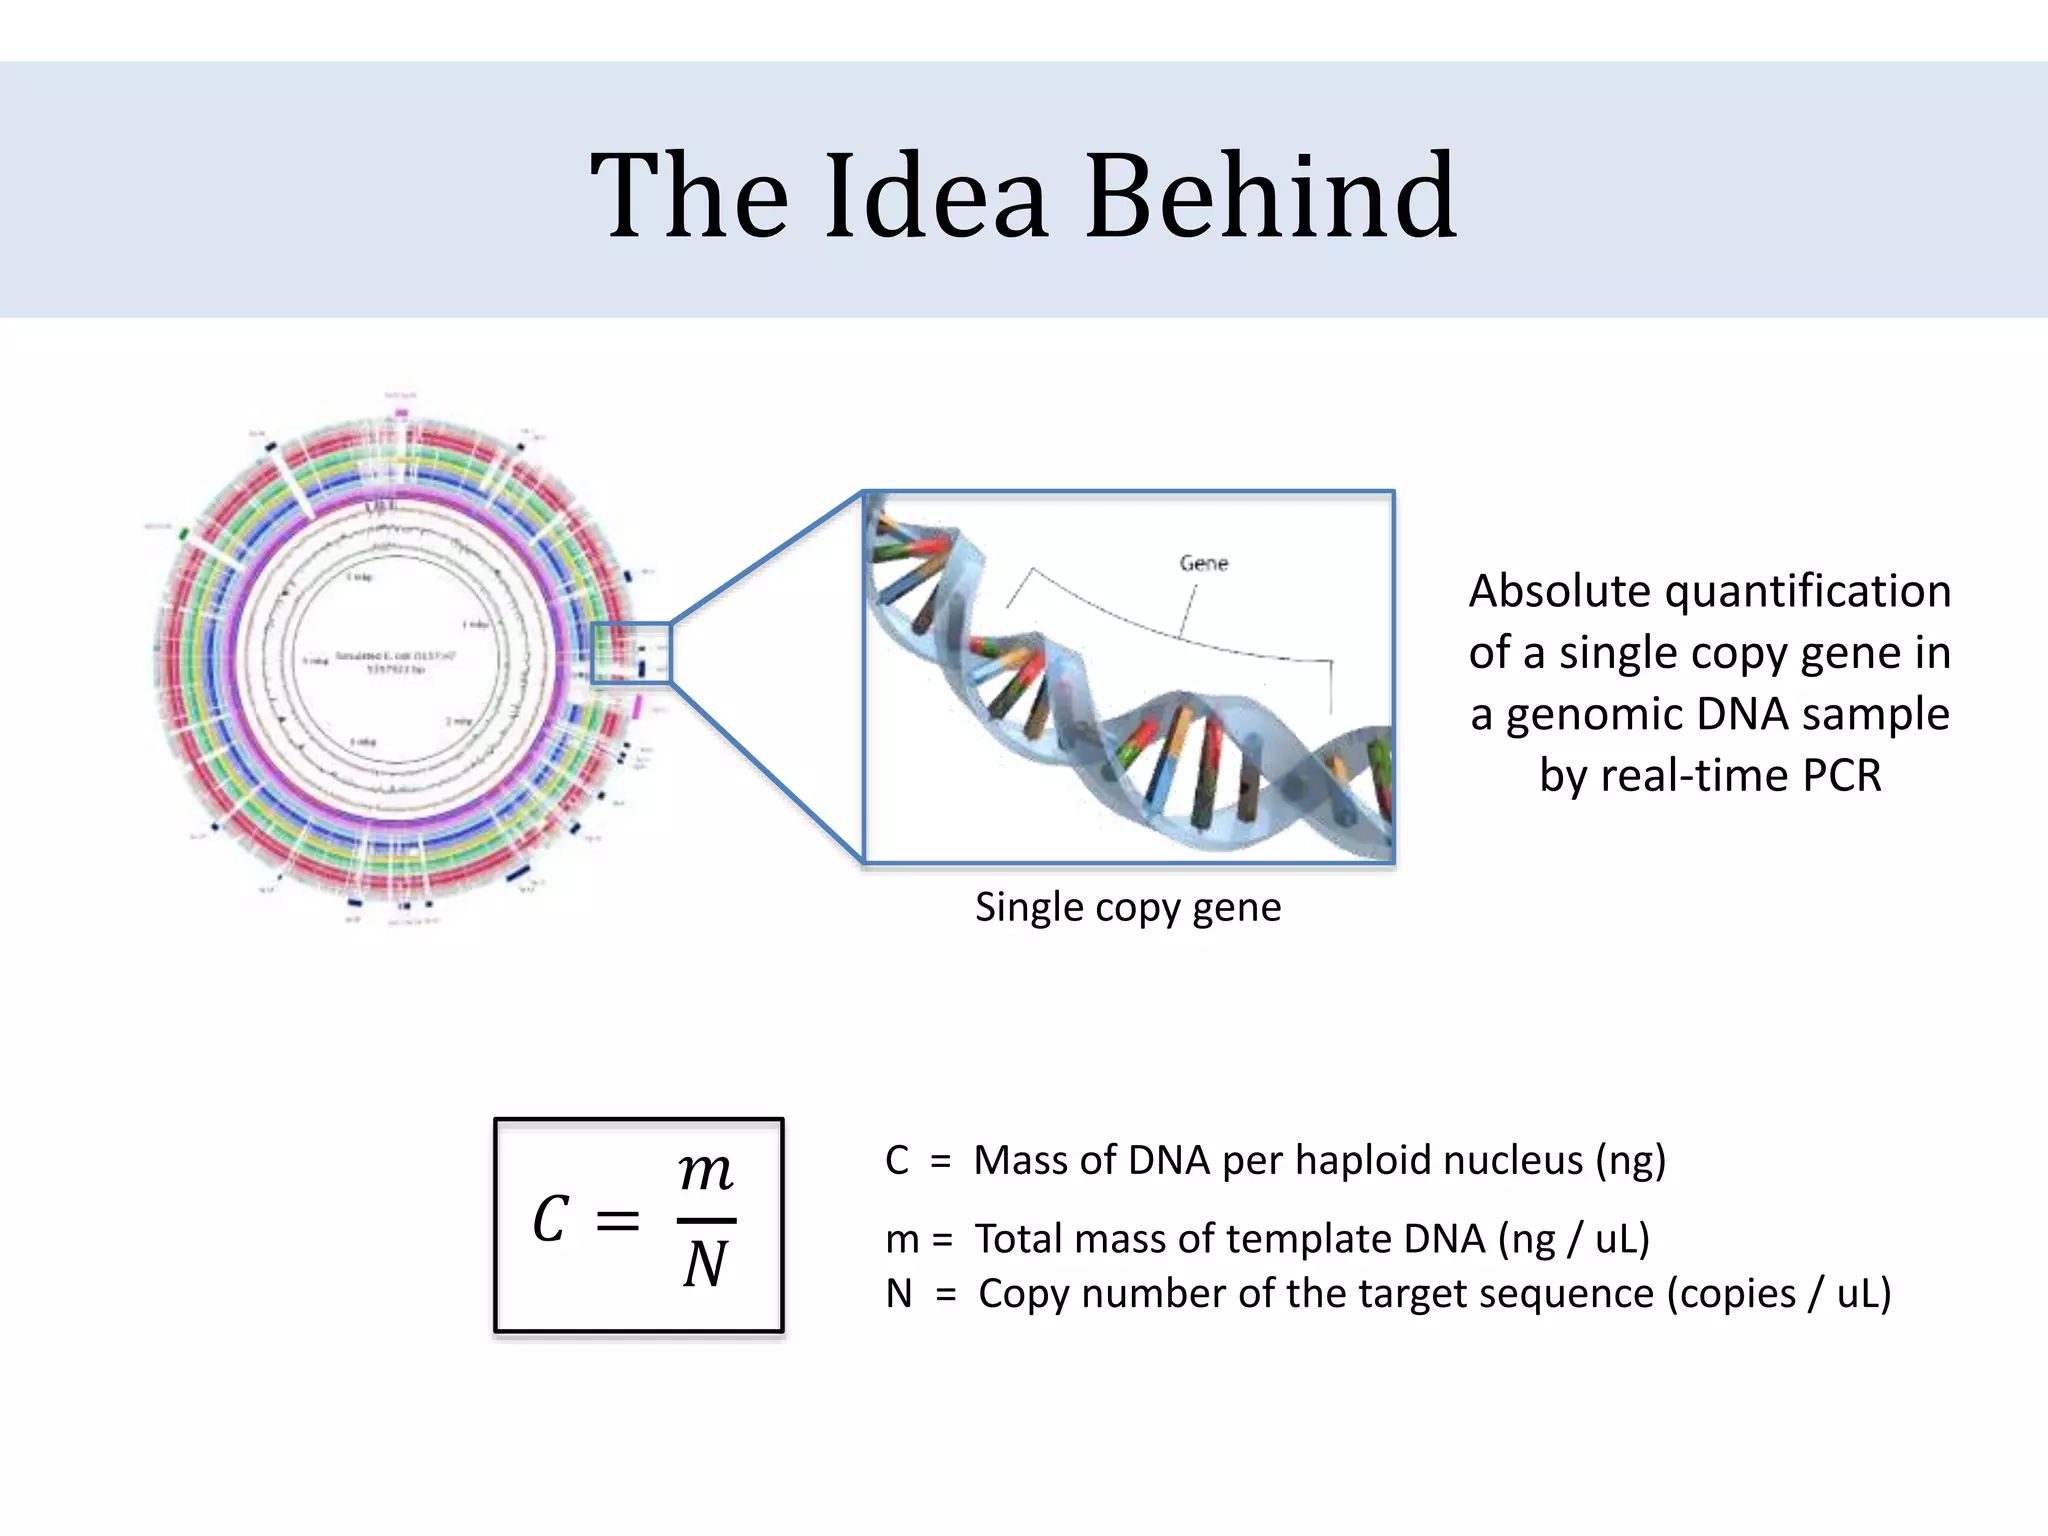
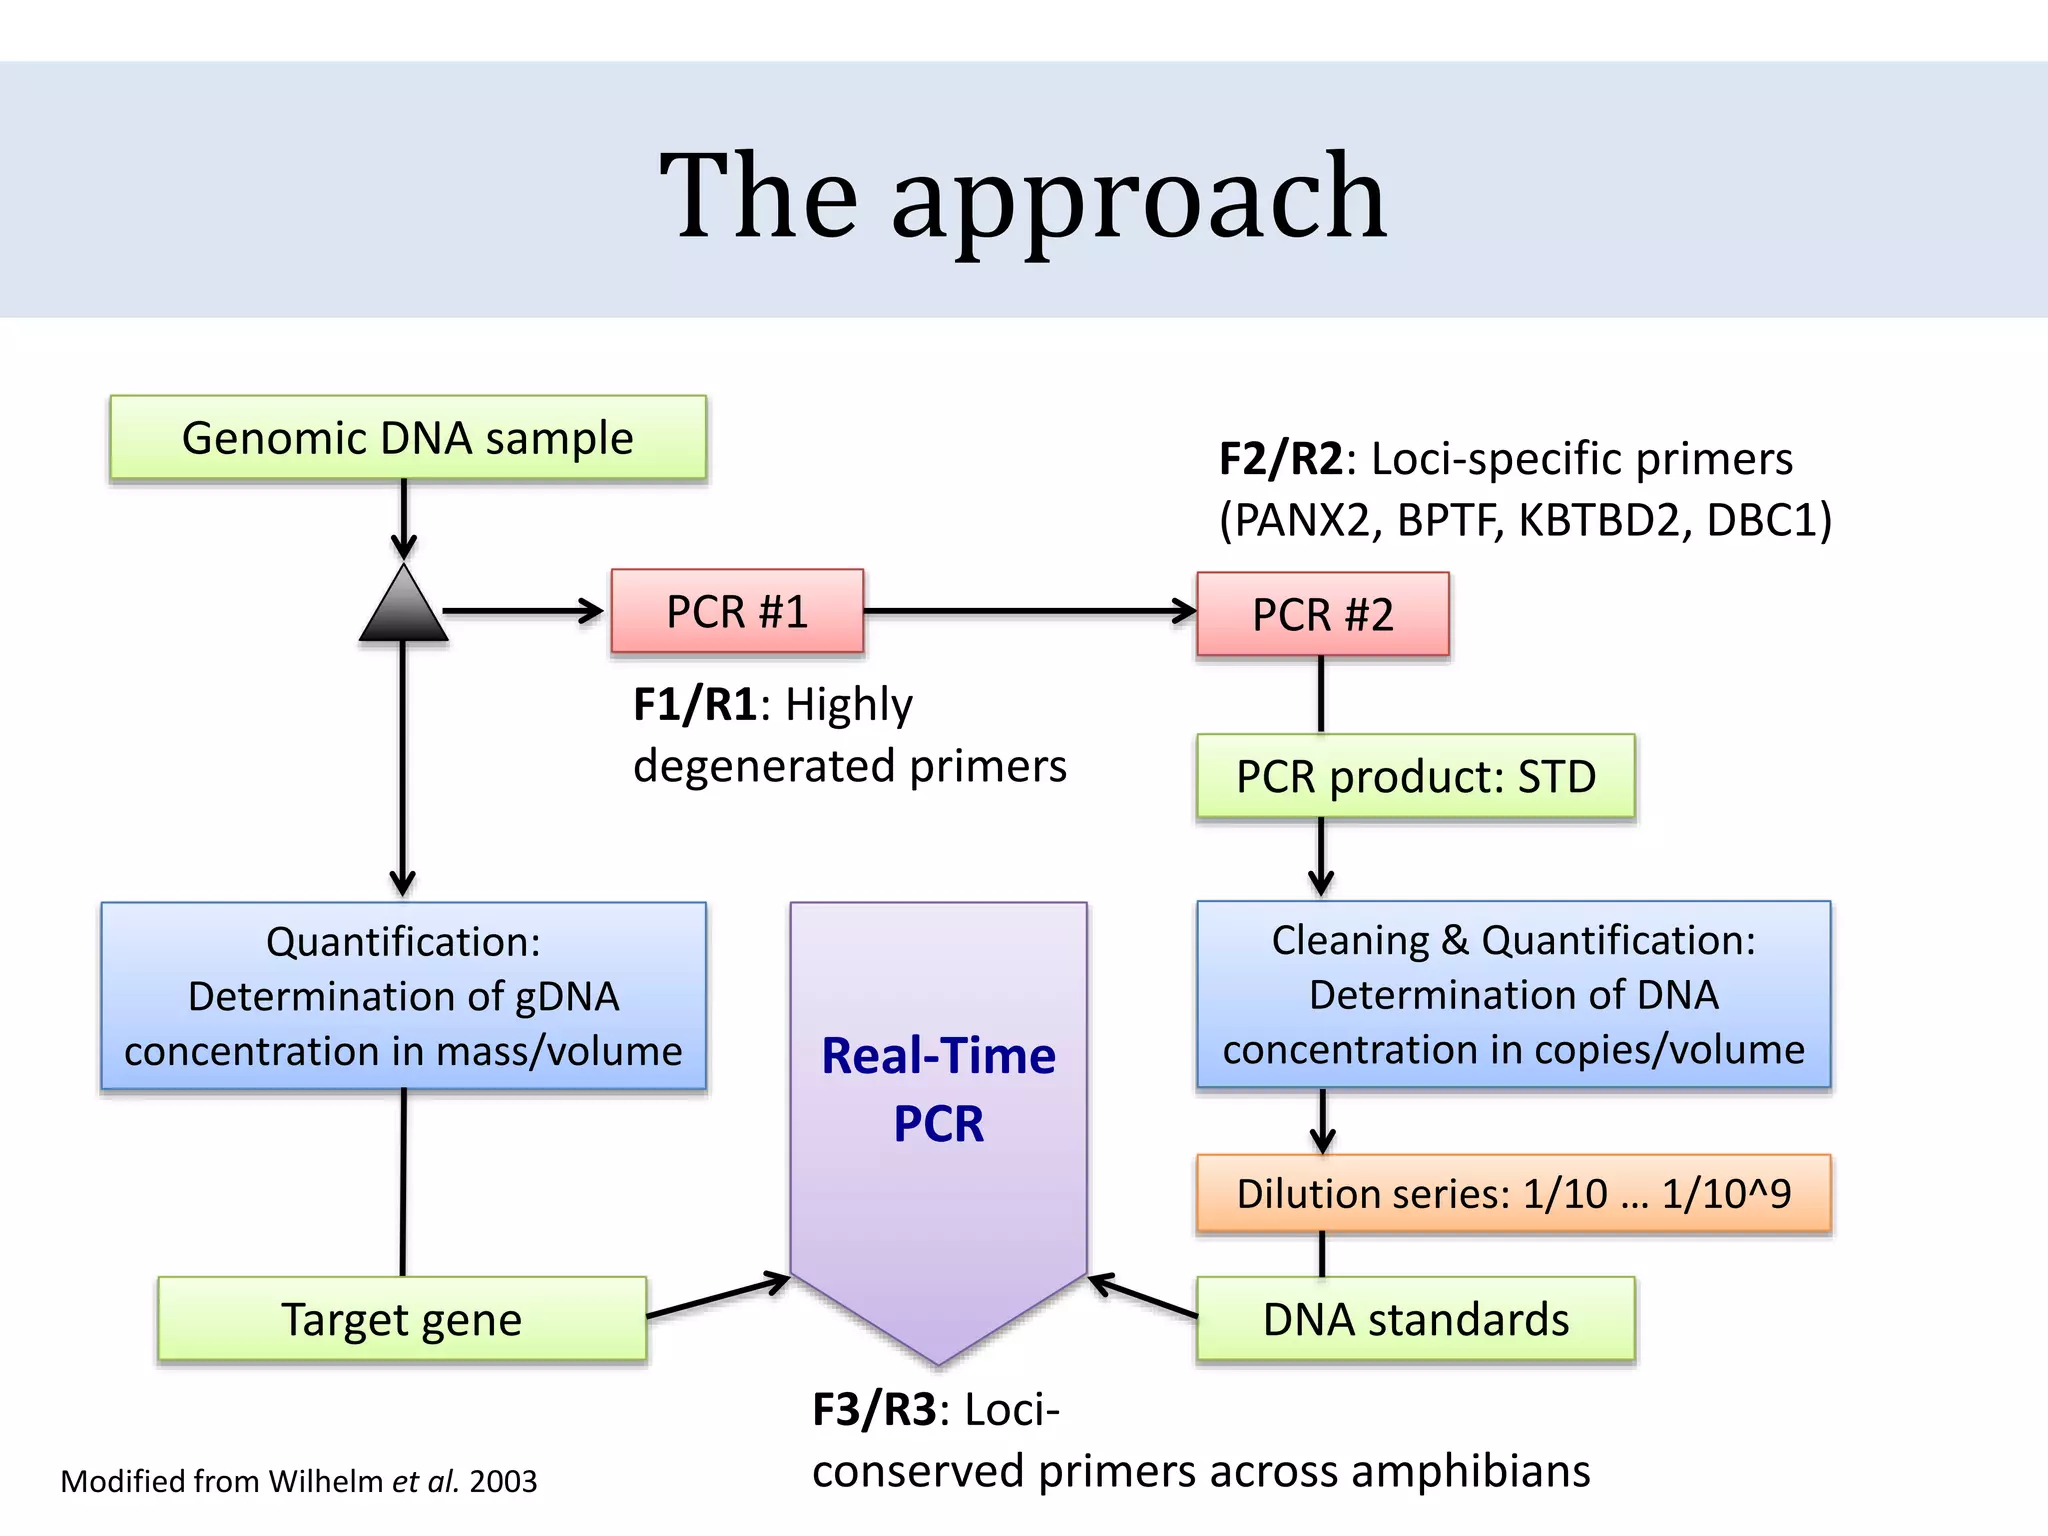
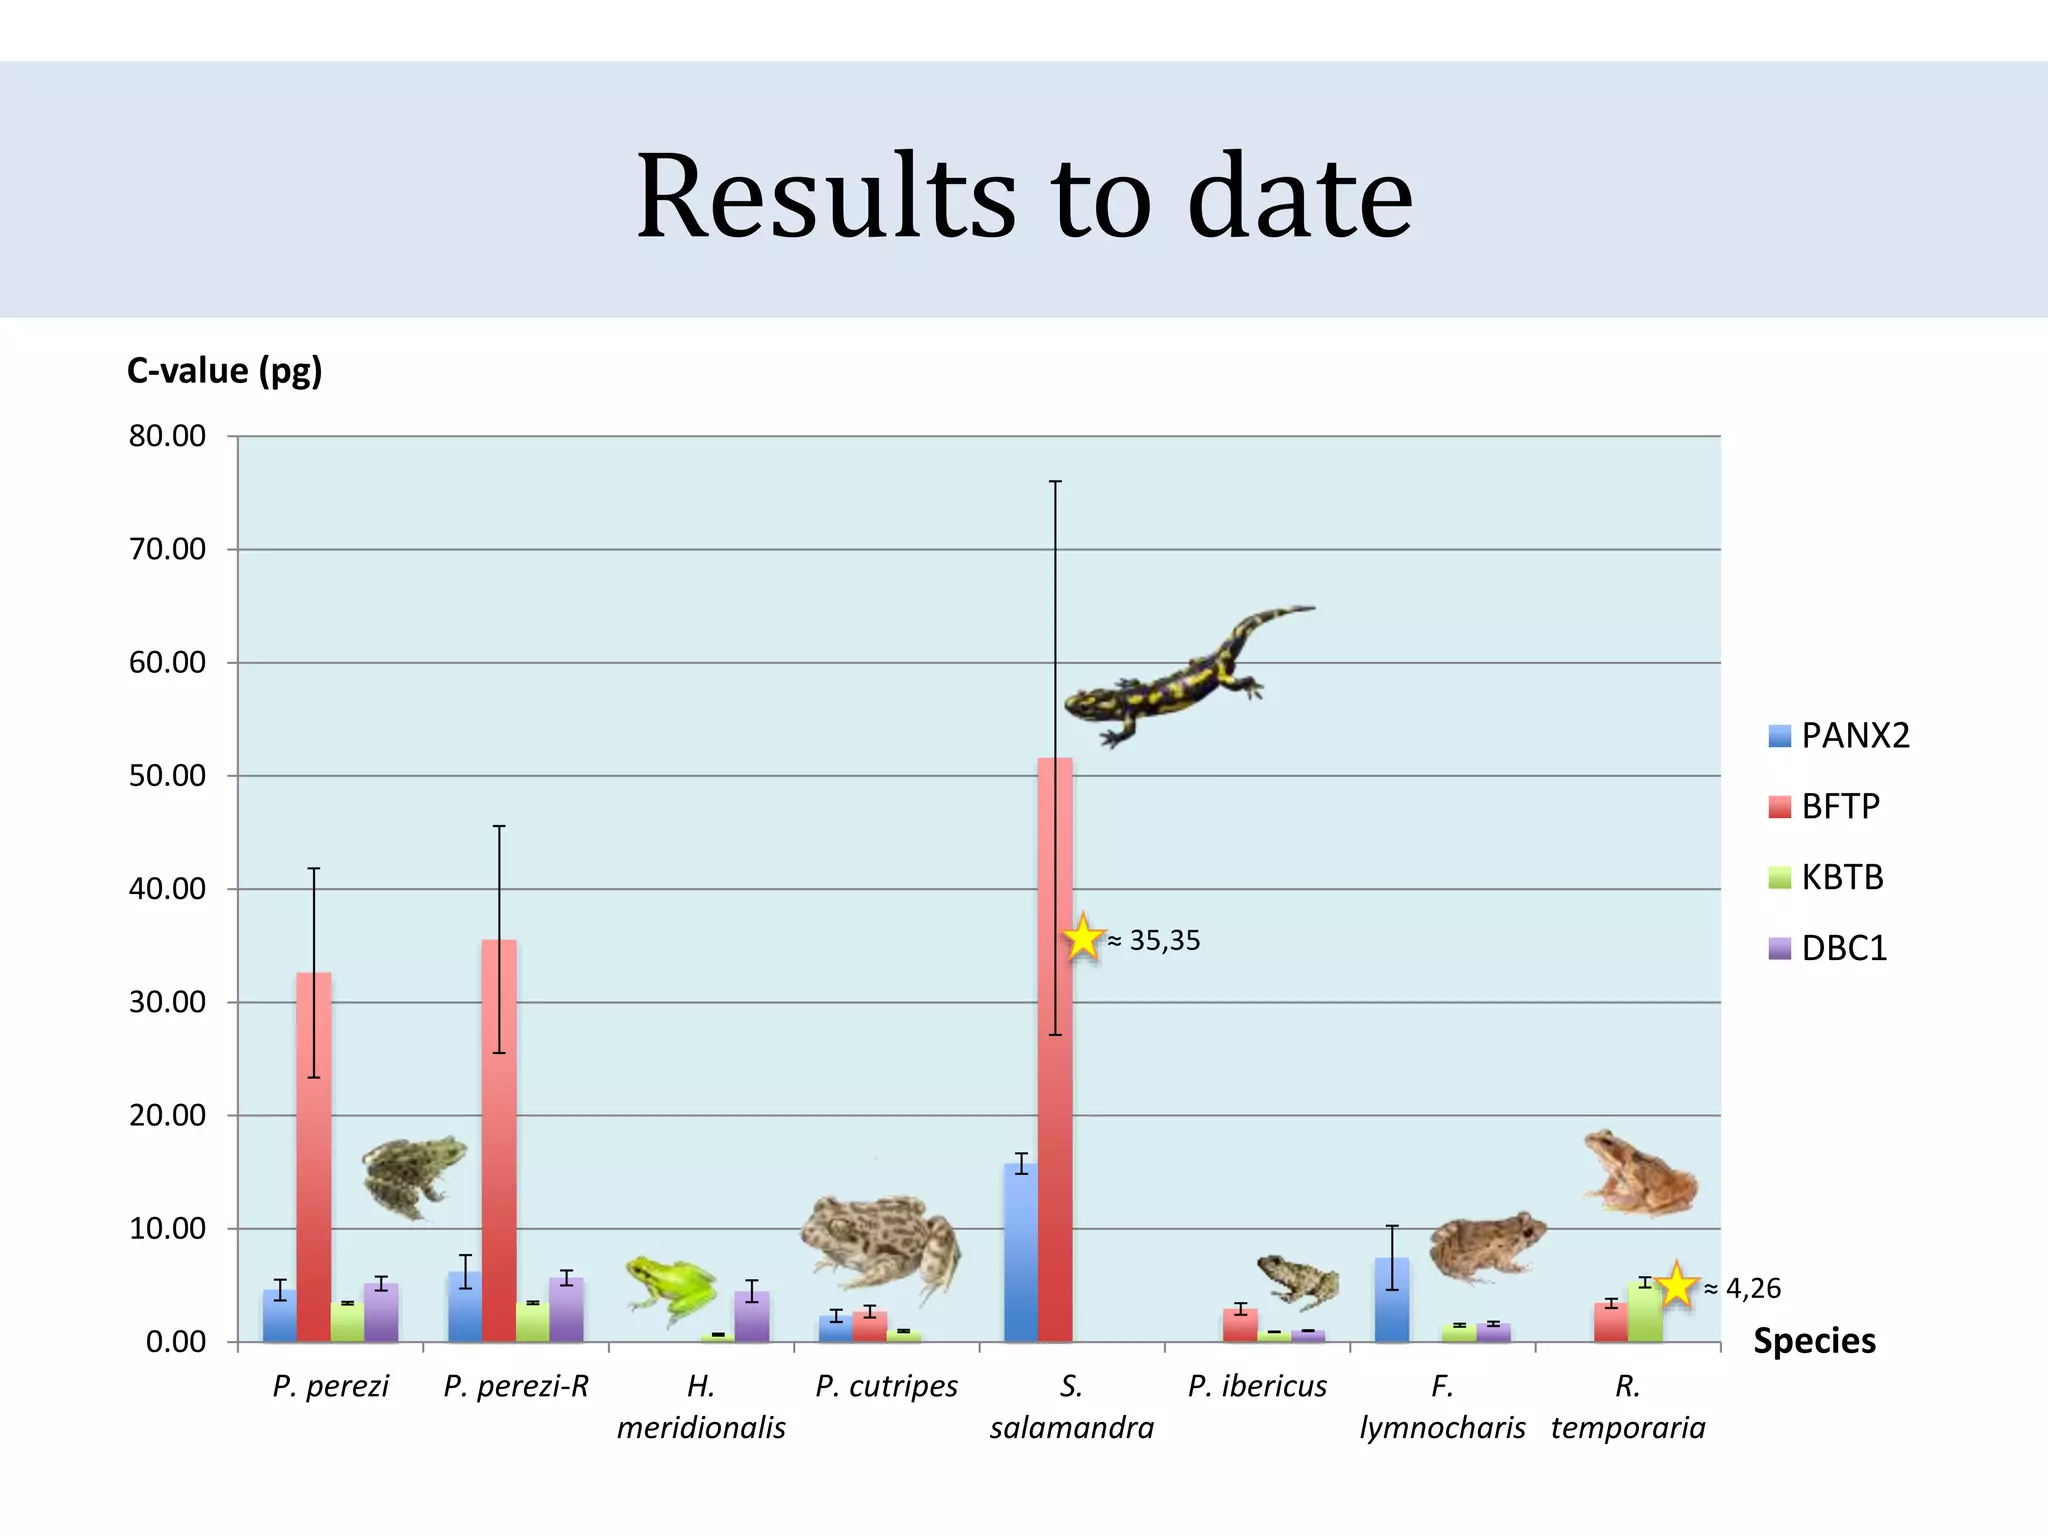
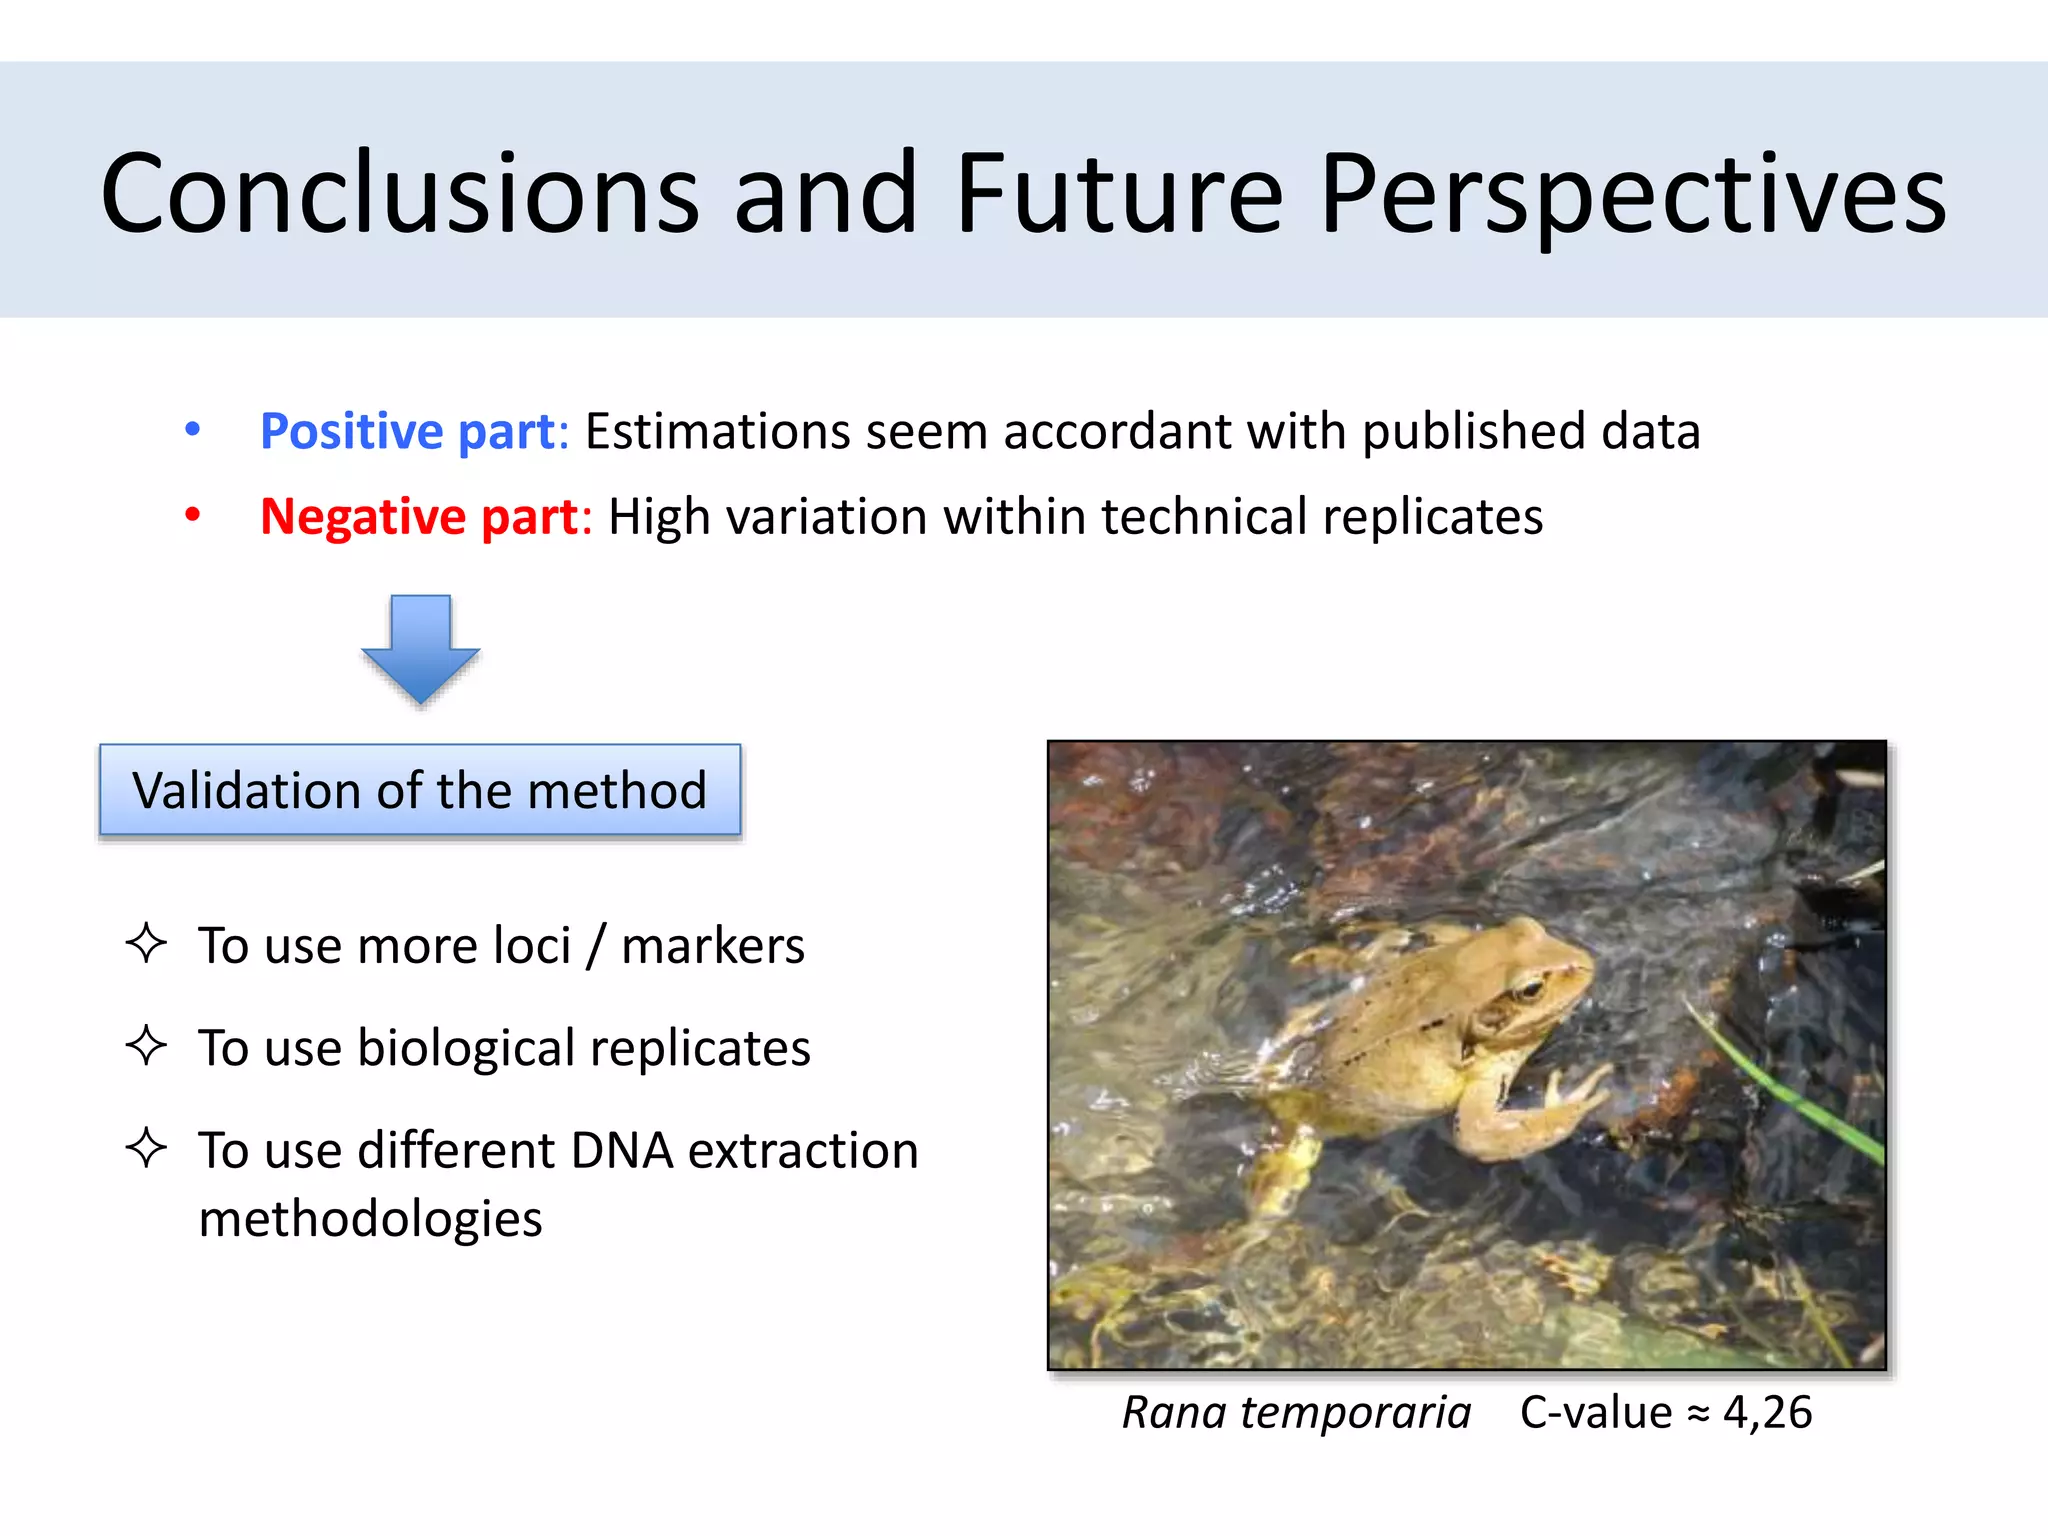
Genome size estimation in amphibians
through Real-Time PCR
Santiago Montero-Mendieta
SEVINOMICS Spring Meeting
March 16th 2016
The Basis of Genome Size
Genome size is the total amount of
DNA contained within one copy of
a single genome
C-value: mass (in picograms)
of DNA per haploid nucleus
Why should anyone care about genome size?
Genome size is a major consideration when choosing
targets for complete genome sequencing projects
- Mapping
- Construction libraries
- Reading the sequence of nucleotides
- Reassembling the individual sequenced fragments
The C-value Enigma
Ascending order of
haploid genomes
(+) Genome size
≠
(+) Nº of genes
Noncoding DNA
WHY?
Classical Methods for Estimating the C-value
- Measuring the phosphate content
- Reassociation kinetics
- Flow cytometry
- Image analysis
- Absorption cytometry
Issues and Challenges
Classical methods require the use of fresh non-processed tissues.
This means genome size can’t be estimated on museum samples
GOAL: to develop a method to estimate genome
size across all amphibians (frogs, newts, salamanders and caecilians)
The Idea Behind
Single copy gene
C = Mass of DNA per haploid nucleus (ng)
m = Total mass of template DNA (ng / uL)
N = Copy number of the target sequence (copies / uL)
Absolute quantification
of a single copy gene in
a genomic DNA sample
by real-time PCR
The approach
Genomic DNA sample
F1/R1: Highly
degenerated primers
F2/R2: Loci-specific primers
(PANX2, BPTF, KBTBD2, DBC1)
F3/R3: Loci-
conserved primers across amphibians
Quantification:
Determination of gDNA
concentration in mass/volume
PCR #1 PCR #2
PCR product: STD
Cleaning & Quantification:
Determination of DNA
concentration in copies/volume
Dilution series: 1/10 … 1/10^9
DNA standardsTarget gene
Real-Time
PCR
Modified from Wilhelm et al. 2003
Results to date
0.00
10.00
20.00
30.00
40.00
50.00
60.00
70.00
80.00
P. perezi P. perezi-R H.
meridionalis
P. cutripes S.
salamandra
P. ibericus F.
lymnocharis
R.
temporaria
C-value (pg)
Species
PANX2
BFTP
KBTB
DBC1
≈ 4,26
≈ 35,35
Conclusions and Future Perspectives
• Positive part: Estimations seem accordant with published data
• Negative part: High variation within technical replicates
Rana temporaria C-value ≈ 4,26
Validation of the method
 To use more loci / markers
 To use biological replicates
 To use different DNA extraction
methodologies
Acknowledgments
SMM is funded by an FPI grant from the Ministerio de
Economía y Competitividad, Spain (BES-2014-069006).
Jennifer LeonardCarles Vilà
Ivan Gómez Miguel Camacho

Genome size estimation by qPCR - 2016 Sevinomics

  • 1.
    Genome size estimationin amphibians through Real-Time PCR Santiago Montero-Mendieta SEVINOMICS Spring Meeting March 16th 2016
  • 2.
    The Basis ofGenome Size Genome size is the total amount of DNA contained within one copy of a single genome C-value: mass (in picograms) of DNA per haploid nucleus
  • 3.
    Why should anyonecare about genome size? Genome size is a major consideration when choosing targets for complete genome sequencing projects - Mapping - Construction libraries - Reading the sequence of nucleotides - Reassembling the individual sequenced fragments
  • 4.
    The C-value Enigma Ascendingorder of haploid genomes (+) Genome size ≠ (+) Nº of genes Noncoding DNA WHY?
  • 5.
    Classical Methods forEstimating the C-value - Measuring the phosphate content - Reassociation kinetics - Flow cytometry - Image analysis - Absorption cytometry
  • 6.
    Issues and Challenges Classicalmethods require the use of fresh non-processed tissues. This means genome size can’t be estimated on museum samples GOAL: to develop a method to estimate genome size across all amphibians (frogs, newts, salamanders and caecilians)
  • 7.
    The Idea Behind Singlecopy gene C = Mass of DNA per haploid nucleus (ng) m = Total mass of template DNA (ng / uL) N = Copy number of the target sequence (copies / uL) Absolute quantification of a single copy gene in a genomic DNA sample by real-time PCR
  • 8.
    The approach Genomic DNAsample F1/R1: Highly degenerated primers F2/R2: Loci-specific primers (PANX2, BPTF, KBTBD2, DBC1) F3/R3: Loci- conserved primers across amphibians Quantification: Determination of gDNA concentration in mass/volume PCR #1 PCR #2 PCR product: STD Cleaning & Quantification: Determination of DNA concentration in copies/volume Dilution series: 1/10 … 1/10^9 DNA standardsTarget gene Real-Time PCR Modified from Wilhelm et al. 2003
  • 9.
    Results to date 0.00 10.00 20.00 30.00 40.00 50.00 60.00 70.00 80.00 P.perezi P. perezi-R H. meridionalis P. cutripes S. salamandra P. ibericus F. lymnocharis R. temporaria C-value (pg) Species PANX2 BFTP KBTB DBC1 ≈ 4,26 ≈ 35,35
  • 10.
    Conclusions and FuturePerspectives • Positive part: Estimations seem accordant with published data • Negative part: High variation within technical replicates Rana temporaria C-value ≈ 4,26 Validation of the method  To use more loci / markers  To use biological replicates  To use different DNA extraction methodologies
  • 11.
    Acknowledgments SMM is fundedby an FPI grant from the Ministerio de Economía y Competitividad, Spain (BES-2014-069006). Jennifer LeonardCarles Vilà Ivan Gómez Miguel Camacho

Editor's Notes

  • #5 Non-coding genes
  • #9 3 gDNA replicates per sample and marker 1 standard curve replicate (only for the first sample) – same standard curve 1 de novo standard curve replicate (first sample) – starting from dilution 1/10