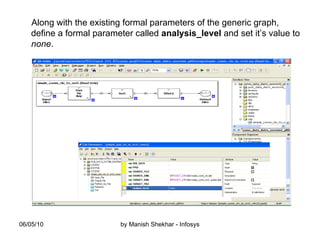
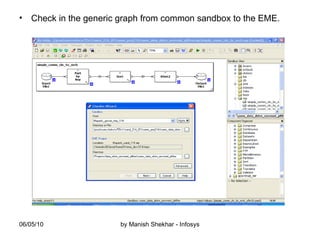
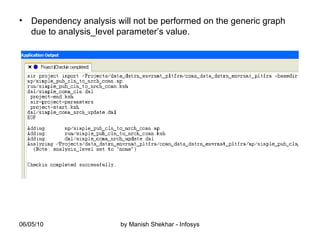
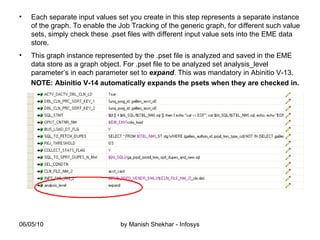
This document discusses characteristics of big data and the big data stack. It describes the evolution of data from the 1970s to today's large volumes of structured, unstructured and multimedia data. Big data is defined as data that is too large and complex for traditional data processing systems to handle. The document then outlines the challenges of big data and characteristics such as volume, velocity and variety. It also discusses the typical data warehouse environment and Hadoop environment. The five layers of the big data stack are then described including the redundant physical infrastructure, security infrastructure, operational databases, organizing data services and tools, and analytical data warehouses.
Hadoop is a framework for distributed processing of large datasets across clusters of computers using a simple programming model. It provides reliable storage through HDFS and processes large amounts of data in parallel through MapReduce. The document discusses installing and configuring Hadoop on Windows, including setting environment variables and configuration files. It also demonstrates running a sample MapReduce wordcount job to count word frequencies in an input file stored in HDFS.
This document discusses handling late arriving fact data in big data warehouses. It provides an example of receiving old telephone call records months after the actual calls occurred. It then outlines steps to correctly insert the late data into the appropriate historical partitions, including:
1) Creating a partitioned output table
2) Inserting data into a temporary table with additional columns
3) Dropping existing partitions prior to the late data date
4) Inserting from the temporary table into the partitioned output table based on the new date column.
Datastage is an ETL tool with client-server architecture. It uses jobs to design data flows from source to target systems. A job contains source definitions, target definitions, and transformation rules. The main Datastage components include the Administrator, Designer, Director, and Manager clients and the Repository, Server, and job execution components. Jobs can be server jobs for smaller data volumes or parallel jobs for larger volumes and use of parallel processing. Stages define sources, targets, and processing in a job. Common stages include files, databases, and transformation stages like Aggregator and Copy.
Data stage interview questions and answers|DataStage FAQSBigClasses.com
The document contains questions and answers about Ascential DataStage. It discusses the differences between DataStage and Informatica, the components of DataStage, system variables, enhancements in version 7.5 compared to 7.0, definitions of DataStage, merges, sequencers, version control, active and passive stages, features of DataStage, data aggregation, how the IPC stage works, stage variables, container types, where the DataStage repository is stored, staging variables, generating sequence numbers, differences between server and parallel jobs, and differences between account and directory options.
The Lotus Code Cookbook - Ulrich Krause
Tipps, Tipps, Tipps ... Die Session behandelt kein zentrales Thema. In loser Folge werden Tipps und Tricks aus allen Bereichen der Programmierung in Lotus Notes / Domino vorgestellt. @Formula, LotusScript, Java, JavaScript, LS2CApi.
Zielgruppe sind Alle, die sich mit Applikationsentwicklung beschäftigen. Anfänger und "alte Hasen"; es ist für jeden etwas dabei.
This document provides an overview of Microsoft Access 2010, including how to get started with Access databases. It covers topics such as understanding relational databases, exploring an Access database, creating tables and relating tables using primary keys. The document also describes how to enter and edit data, as well as important database terminology.
This document provides instructions for a hands-on lab guide to explore the Snowflake data warehouse platform using a free trial. The lab guide walks through loading and analyzing structured and semi-structured data in Snowflake. It introduces the key Snowflake concepts of databases, tables, warehouses, queries and roles. The lab is presented as a story where an analytics team loads and analyzes bike share rider transaction data and weather data to understand riders and improve services.
Data Warehouse Tutorial For Beginners | Data Warehouse Concepts | Data Wareho...Edureka!
This Data Warehouse Tutorial For Beginners will give you an introduction to data warehousing and business intelligence. You will be able to understand basic data warehouse concepts with examples. The following topics have been covered in this tutorial:
1. What Is The Need For BI?
2. What Is Data Warehousing?
3. Key Terminologies Related To Data Warehouse Architecture:
a. OLTP Vs OLAP
b. ETL
c. Data Mart
d. Metadata
4. Data Warehouse Architecture
5. Demo: Creating A Data Warehouse
Data Warehouse Physical Design,Physical Data Model, Tablespaces, Integrity Constraints, ETL (Extract-Transform-Load) ,OLAP Server Architectures, MOLAP vs. ROLAP, Distributed Data Warehouse ,
This document discusses the relational data model and SQL. It begins with an overview of relational database design using ER-to-relational mapping. It then discusses relational model concepts such as relations, attributes, tuples, domains and keys. It also covers integrity constraints and SQL components like data definition, data types, and retrieval, modification and deletion queries. The document outlines topics such as relational algebra, calculus, and features of SQL like views, triggers and transactions. It provides learning objectives and expected outcomes of understanding these concepts.
This document provides 50 tips for using various Excel functions and features. It begins with tips on creating macros, the GETPIVOTDATA function, formatting chart axes, date validation, and using the IF function. Subsequent tips cover additional functions and features such as nested IF statements, forecasting, error handling, date formatting, highlighting dates, transposing data, data validation, random number generation, hyperlinks, data consolidation, text functions, pivot tables, and more. The tips provide step-by-step examples and explanations for how to utilize Excel to analyze data, validate information, visualize results in charts and pivot tables, and automate repetitive tasks.
Snowflake is a cloud data warehouse that offers scalable storage, flexible compute capabilities, and a shared data architecture. It uses a shared data model where data is stored independently from compute resources in micro-partitions in cloud object storage. This allows for elastic scaling of storage and compute. Snowflake also uses a virtual warehouse architecture where queries are processed in parallel across nodes, enabling high performance on large datasets. Data can be loaded into Snowflake from external sources like Amazon S3 and queries can be run across petabytes of data with ACID transactions and security at scale.
OLAP (online analytical processing) allows users to easily extract and view data from different perspectives. It was invented by Edgar Codd in the 1980s and uses multidimensional data structures called cubes to store and analyze data. OLAP utilizes either a multidimensional (MOLAP), relational (ROLAP), or hybrid (HOLAP) approach to store cube data in databases and provide interactive analysis of data.
SQL Server Integration Services (SSIS) is a platform for data integration and workflow applications used for extracting, transforming, and loading (ETL) data. SSIS packages contain control flows and data flows to organize tasks for data migration. SSIS provides tools for loading data, transforming data types, and splitting data into training and testing sets for data mining models. It includes data mining transformations in the control flow and data flow environments to prepare and analyze text data for classification, clustering, and association models.
1. The document defines and provides examples of various data structures including lists, stacks, queues, trees, and their properties.
2. Key concepts covered include linear and non-linear data structures, common tree types, tree traversals, and operations on different data structures like insertion, deletion, and searching.
3. Examples are provided to illustrate concepts like binary search trees, tree representation and traversal methods.
This document is a major project report submitted by Ranjit Singh for the development of a Hospital Management System using Java programming and a database. It includes an introduction describing the purpose, scope and relevant tools used. An overall description provides goals of the proposed system to manage patient, doctor and room records, billing, and user login details. A feasibility study evaluates the technical, economic, operational and schedule feasibility of the system. The report also includes sections on the entity relationship diagram, database and GUI design, implementation, testing, and conclusion.
This document summarizes a presentation about optimizing HBase performance through caching. It discusses how baseline tests showed low cache hit rates and CPU/memory utilization. Reducing the table block size improved cache hits but increased overhead. Adding an off-heap bucket cache to store table data minimized JVM garbage collection latency spikes and improved memory utilization by caching frequently accessed data outside the Java heap. Configuration parameters for the bucket cache are also outlined.
This document provides an overview and introduction to ClickHouse, an open source column-oriented data warehouse. It discusses installing and running ClickHouse on Linux and Docker, designing tables, loading and querying data, available client libraries, performance tuning techniques like materialized views and compression, and strengths/weaknesses for different use cases. More information resources are also listed.
Microsoft Access is a relational database management system that allows users to create and manage databases. It has features that help build and view information in databases. Access integrates with Excel and Word. Users can create tables to store and organize data, as well as forms to view and edit table records and reports to present queried data. The document provides steps on getting started with Access, creating databases, tables, forms, and reports.
Microsoft Excel 2007 is a widely used spreadsheet program that is part of the Microsoft Office suite, with capabilities for performing calculations, organizing data, creating charts and graphics, and automating tasks through macros. Excel allows users to enter and manipulate data in worksheets and perform calculations with formulas, analyze information with built-in functions and tools, and visualize data through a variety of chart types. Key features and functions of Excel 2007 include entering and editing data, working with formulas and functions, formatting worksheets, inserting objects and illustrations, printing and preparing files, reviewing and sharing workbooks, and customizing the Excel environment.
- The document discusses setting up Microsoft Access databases and connecting them to a Visual Basic project to display data in forms using DataGridView controls.
- It provides steps for adding a database file to a project, configuring a data connection, selecting tables and columns as data sources, and formatting DataGridView controls to display the bound data.
- Two forms are created - one to display course data and another for student data by dragging DataGridView controls and configuring them to show records from tables in the Access database file.
This document proposes the development of a data loader tool with the following key capabilities:
- Load data from a text file into backend databases like MS Access, MySQL, Oracle or FoxPro.
- Import and export tables between different backend databases.
- Encrypt text files and decrypt encrypted text files.
The data loader tool would streamline data loading and transferring processes currently done using multiple individual tools. It aims to provide an easy to use interface to perform these functions.
The document discusses data dictionaries and system description techniques. It defines a data dictionary as a place that records information about data flows, data stores, and processes. It also describes three levels of data dictionaries - data elements, data structures, and data flows and data stores. The document then discusses normalization, flowcharts, data flow diagrams, decision tables, and decision trees as techniques for graphically representing systems and processes.
The document discusses how HTML image maps use coordinate pairs to define rectangular regions of an image and link each region to a different webpage. An image map divides an image into multiple clickable areas by specifying the upper-left and lower-right coordinates of each region. It then uses these coordinate pairs in <area> tags within a <map> to associate each region with a hyperlink.
AD SSO with Oracle Analytics Cloud - Oracle Open World 18Becky Wagner
This document discusses options for integrating Active Directory and single sign-on with Oracle Analytics Cloud (OAC). It covers using the AD Bridge, configuring SAML 2.0 with ADFS, and differences between direct SSO and linking accounts. Troubleshooting tips are provided, such as checking log files for the AD Bridge and configuring IDP policies correctly. Removing local logins and a recap of OAC integration options are also summarized.
ClickHouse on Kubernetes! By Robert Hodges, Altinity CEOAltinity Ltd
Slides from Webinar. April 16, 2019
Data services are the latest wave of applications to catch the Kubernetes bug. Altinity is pleased to introduce the ClickHouse operator, which makes it easy to run scalable data warehouses on your favorite Kubernetes distro. This webinar shows how to install the operator and bring up a new data warehouse in three simple steps. We also cover storage management, monitoring, making config changes, and other topics that will help you operate your data warehouse successfully on Kubernetes. There is time for demos and Q&A, so bring your questions. See you online!
Speaker Bio:
Robert Hodges is CEO of Altinity, which offers enterprise support for ClickHouse. He has over three decades of experience in data management spanning 20 different DBMS types. ClickHouse is his current favorite. ;)
Dependency analysis determines where data comes from and which applications produce and depend on the data. Ab Initio automatically creates a repository when installing on a standalone machine. The difference between rollup and scan is that rollup generates cumulative summary records while scan is used to generate further sequences for new records. Merging GUI map files does not create corresponding test scripts, so it is impossible to run a file by just merging two GUI map files. Taking an entire database backup and restoring it in a different instance is one way to ensure database object definitions are consistent between instances.
Ab initio is a Latin phrase meaning "from the beginning" and refers to solving problems from first principles. Ab initio software addresses challenges like scalability, development time, metadata management, and integration. It uses a graphical development environment to build applications as data flow diagrams composed of components. Applications are executed by distributing processes across available servers. Ab initio supports various operating systems and hardware configurations.
Ab initio is one of the popular etl tools that is in the marketeercreddy
AbInitio is an ETL tool that represents processes as graphs composed of components, flows, and parameters. The CoOperating System provides features for managing and running AbInitio graphs, monitoring processes, and managing metadata. The GDE graphical application is used for designing and running AbInitio graphs, while the EME is an AbInitio repository for storing business and technical metadata. Conduct provides a way to create integration systems using AbInitio plans composed of graphs and scripts.
This document provides instructions for setting up Ab Initio and describes some basic concepts. It recommends using version 1.6 or greater of the GDE and version 2.0 or greater of the Ab Initio Co>Operating System. Components have ports that allow data to flow in and out, and the data streams are called flows. The document also explains how to create, delete, and straighten flows, and discusses propagation and viewing data in Ab Initio.
BPC Logics allows us to perform calculations on BPC data. BPC comes with three different types of logic (1) Worksheet logic, (2) Dimension logic and (3)Advanced (Script) logic. Normally we use one or more, or all of them is our BPC environment. Usage of these scripts depends on many factors, for example (1) performance issue, (2) complexity, (3) user preferences, etc. each of these script has its own its own advantages and disadvantages. Among the logics, script logic is much loved and widely used logic. Refer the embedded slide for more information. Hope you will enjoy it. Thanks, Surya Padhi
The document provides steps to extract data from a Hyperion Essbase cube and load it into a relational database using Oracle Data Integrator (ODI). There are three methods for extracting data from Essbase - using a Calc script, Report script, or MDX query. The steps include creating a Calc script using the DATAEXPORT function to extract data to a text file, configuring the Essbase connection in ODI's topology, reversing the Essbase cube, establishing the target database connection, creating an ODI interface using the LKM Hyperion Essbase DATA to SQL knowledge module, and running the interface to load the extracted Essbase data into the relational database tables.
Declaring a PointerTo define a pointer, use an asterisk, (), in t.pdfmalavshah9013
Declaring a Pointer
To define a pointer, use an asterisk, (*), in the declaration to specify the variable will be a pointer
to the specified data type.
Recall that the name of an array holds the memory address of the first element of the array. The
second statement then would store the memory address of the first value in the variable valuePtr.
The name of a pointer is an identifier and must follow the rules for defining an identifier. Some
programmers place the letters ptr, a common abbreviation for pointer, at the end of the variable
name, others prefix a pointer with p_ or ptr_, and there are those who do nothing to distinguish a
pointer by its name. The naming of a pointer variable is a matter of programming style.
Once a pointer has been declared and initialized, it can be used to access the data to which it
points. In order to access this value, the dereference operator, *, must be used to prefix the name
of the pointer. From the code above, valuePtr holds the address of the first element of the values
array; therefore, *valuePtr will access the value 325. Add the following to main and execute the
program.
The output generated should look something like the following.
Where 0xbfad43e8 is a memory address displayed in hexadecimal.
Obtaining the Memory Address of a Variable
The address operator, &, is used to determine the memory address of a variable that is not an
array. Add code necessary to use fixed and setprecision, then add the following to main and run
the program to confirm the use of the address operator.
Using a Pointer to Alter Data
Just as the dereference operator is used to retrieve data, so too is it used to store data. Add the
following to function main and run the program.
The pointer, ratePtr, is used to change the data stored in payRate. The output of payRate
confirms the change.
Using a Pointer in an Expression
As previously shown, the value pointed to by a pointer variable can be retrieved by dereferencing
the pointer. In the above code, the retrieved value was simply displayed to the screen; however,
it can also be used in an expression. Add the following to main and execute the program.
Pointer Arithmetic
It is possible to add to or subtract from a memory address stored in a pointer. These actions can
be accomplished using the addition operator,+, subtraction operator, - and the increment and
decrement operators, ++ and --. This is helpful when accessing arrays via pointers.
The increment operator has been used to add the value 1 to a variable. When used with a pointer,
the increment operator adds the size of the data referenced to the memory address stored in the
pointer, effectively moving the pointer to the next data value. Building on the code from above,
add the following to main and execute the program.
We initialized valuePtr to the memory address of the first element of the array values.
Incrementing valuePtr instructs the computer to add four bytes, the size of an integer, to the
memory addressed stored in .
Twp Upgrading 10g To 11g What To Expect From Optimizerqiw
The document discusses new initialization parameters and features in Oracle 11g for managing optimizer statistics. Key points include:
- Invisible indexes allow creating indexes without impacting execution plans until enabled.
- Pending statistics allow testing statistics before publishing to dictionaries.
- SQL plan management automatically captures plans as baselines and only uses known, verified plans.
- New preferences allow finer control over statistics collection parameters at the table, schema, and global levels.
2004 map reduce simplied data processing on large clusters (mapreduce)anh tuan
The document describes MapReduce, a programming model and associated implementation for processing large datasets across distributed systems. It allows users to specify map and reduce functions to process key-value pairs. The runtime system handles parallelization across machines, partitioning data, scheduling execution, and handling failures. Hundreds of programs have been implemented using MapReduce at Google to process terabytes of data on thousands of machines.
The document describes MapReduce, a programming model and associated implementation for processing large datasets across distributed systems. MapReduce allows users to specify map and reduce functions to process key-value pairs. The runtime system automatically parallelizes and distributes the computation across clusters, handling failures and communication. Hundreds of programs have been implemented using MapReduce at Google to process terabytes of data on thousands of machines.
PHP is a server-side scripting language used for web development. It allows developers to embed PHP code into HTML pages which is executed on the server to produce dynamic web pages. Some key points about PHP include:
- It is free, open source, and runs on many platforms including Windows and Linux.
- PHP code is easy to embed into HTML and syntax uses opening and closing tags.
- It can be used to connect to databases like MySQL and Oracle to dynamically display data on web pages.
- Common PHP functions include echo to output content, if statements for conditional logic, and arrays to store multiple values.
- Cookies can be used to store and retrieve data on the client-side browser to
This document summarizes the key information about installing and using SPSS 11.5 for Windows. It outlines the operating system requirements, installation process, new features in 11.5 including new data definition tools and two-step cluster analysis, and known issues such as limitations of using files saved in SAS formats in other applications and performance issues with large datasets. The document provides guidance on installation, configuration, use, and troubleshooting of SPSS 11.5 for Windows.
The document describes MapReduce, a programming model and associated implementation for processing large datasets across distributed systems. It allows users to specify map and reduce functions to process key-value pairs. The runtime system handles parallelization across machines, partitioning data, scheduling execution, and handling failures. Hundreds of programs have been implemented using MapReduce at Google to process terabytes of data on thousands of machines.
This document provides an overview and lessons on key concepts in SAP BPC, including:
- BPC involves operations on the SAP GUI, web interface, and Excel. It is based on SAP BW and uses BW as its data source.
- Environments, dimensions, models, permissions, and the EPM plug-in are important BPC concepts. Environments contain models, dimensions define data views, and models correspond to BW info cubes.
- The EPM plug-in is used to build reports in Excel that access BPC data. Transformation and conversion files are used to load data into BPC from files via packages that invoke BW process chains.
The document discusses next generation data warehousing and business intelligence (BI) analytics. It outlines some of the challenges with scaling traditional BI systems to handle large and growing volumes of data. It then proposes using a massively parallel processing (MPP) database like Greenplum to enable scalable dataflow and embed analytics processing directly into the data warehouse. This would help address issues of data volume, processing time, and refreshing aggregated data for analytics servers. It presents an application profile for typical BI systems and discusses Greenplum's scaling technology using parallel queries and data streams. Finally, it introduces the draft gNet API for implementing parallel dataflows and analytics procedures directly in the MPP database.
This document introduces MapReduce, a programming model for processing large datasets across distributed systems. It describes how users write map and reduce functions to specify computations. The MapReduce system automatically parallelizes jobs by splitting input data, running the map function on different parts in parallel, collecting output, and running the reduce function to combine results. It handles failures and distribution of work across machines. Many common large-scale data processing tasks can be expressed as MapReduce jobs. The system has been used to process petabytes of data on thousands of machines at Google.
This document introduces MapReduce, a programming model and associated implementation for processing large datasets across distributed systems. The key aspects are:
1. Users specify map and reduce functions that process key-value pairs. The map function produces intermediate key-value pairs and the reduce function merges values for the same key.
2. The system automatically parallelizes the computation by partitioning input data and scheduling tasks on a cluster. It handles failures, data distribution, and load balancing.
3. The implementation runs on large Google clusters and is highly scalable, processing terabytes of data on thousands of machines. Hundreds of programs use MapReduce daily at Google.
The document discusses designing an application to import biological data files into a database table to allow for analysis of large datasets without memory issues, including developing modules to preprocess data files, import data into tables while handling different column orders and splitting data across multiple tables based on column limits, and providing features like undo/redo and standard analysis functions. The application "Database migration and management tool" (DBSERVER) was developed to address these issues and allow researchers to work more comfortably with large biological datasets.
This document discusses the use of spreadsheets and Visual Basic for Applications (VBA) programming to create scaled drawings within Excel spreadsheets to teach structural engineering concepts. It provides an overview of how to organize spreadsheet data, perform calculations in Excel, and then use VBA code to read the input data and create scaled structural drawings. Examples are given of spreadsheets that analyze and draw the design of a footing foundation and a reinforced concrete beam, allowing students to visualize engineering problems and solutions. The approach helps improve student learning by integrating calculations with graphical representations.
Question IYou are going to use the semaphores for process sy.docxaudeleypearl
Question I
You are going to use the semaphores for process synchronization. Therefore, you are asked to develop a consumer and producer multithreaded program.
Let us assume, that we have a thread (producer, we will call it producer_thread) reading data (positive integer numbers) from the keyboard, entered by a user to be stored in an array (dynamic array). (Assume that the array can hold all numbers entered without overflow.)
Another thread (consumer, we will call it consumer_thread) should read data from the array and write them into a file. This thread should run concurrently with the producer (producer_thread).
Your program should make sure that the consumer_thread can read from the array only after the producer_thread has stored new data. Both threads will stop when the user enters a negative number (well synchronized).
Another thread (testing_thread) should start reading the array data as well as the file data and display them on the screen in order to verify if the consumer and producer have worked in a correctly synchronized fashion. This thread should not be synchronized with other threads, it is intended for testing that consumer thread is synchronized with produce thread.
Provide your tutor with the source code as well as screen snapshots that show the work of the testing_thread.
1
TM298_TMA_Q2/build.xml
Builds, tests, and runs the project TM298_TMA_Q2.
TM298_TMA_Q2/manifest.mf
Manifest-Version: 1.0
X-COMMENT: Main-Class will be added automatically by build
TM298_TMA_Q2/nbproject/build-impl.xml
...
This document summarizes a presentation on using Apache Calcite for cost-based query optimization in Apache Phoenix. Key points include:
- Phoenix is adding Calcite's query planning capabilities to improve performance and SQL compliance over its existing query optimizer.
- Calcite models queries as relational algebra expressions and uses rules, statistics, and a cost model to choose the most efficient execution plan.
- Examples show how Calcite rules like filter pushdown and exploiting sortedness can generate better plans than Phoenix's existing optimizer.
- Materialized views and interoperability with other Calcite data sources like Apache Drill are areas for future improvement beyond the initial Phoenix integration.
Cost-based Query Optimization in Apache Phoenix using Apache CalciteJulian Hyde
This document summarizes a presentation on using Apache Calcite for cost-based query optimization in Apache Phoenix. Key points include:
- Phoenix is adding Calcite's query planning capabilities to improve performance and SQL compliance over its existing query optimizer.
- Calcite models queries as relational algebra expressions and uses rules, statistics, and a cost model to choose the most efficient execution plan.
- Examples show how Calcite rules like filter pushdown and exploiting sortedness can generate better plans than Phoenix's existing optimizer.
- Materialized views and interoperability with other Calcite data sources like Apache Drill are areas for future improvement beyond the initial Phoenix+Calcite integration.
The document discusses how Apache Phoenix, an SQL query engine for Apache HBase, is integrating with Apache Calcite, an open source query optimization framework, to improve query optimization capabilities. Key points include:
- Phoenix will leverage Calcite's SQL parser, validator, relational algebra, and cost-based query optimization capabilities to improve performance and SQL standard compliance.
- Calcite models query optimizations as pluggable rules and uses a cost model and statistics to evaluate optimization alternatives. This will allow Phoenix to make more informed decisions around optimizations like index usage, join algorithms, and predicate pushdown.
- Features like materialized views in Calcite will enable new indexing capabilities in Phoenix like defining indexes on query results to better