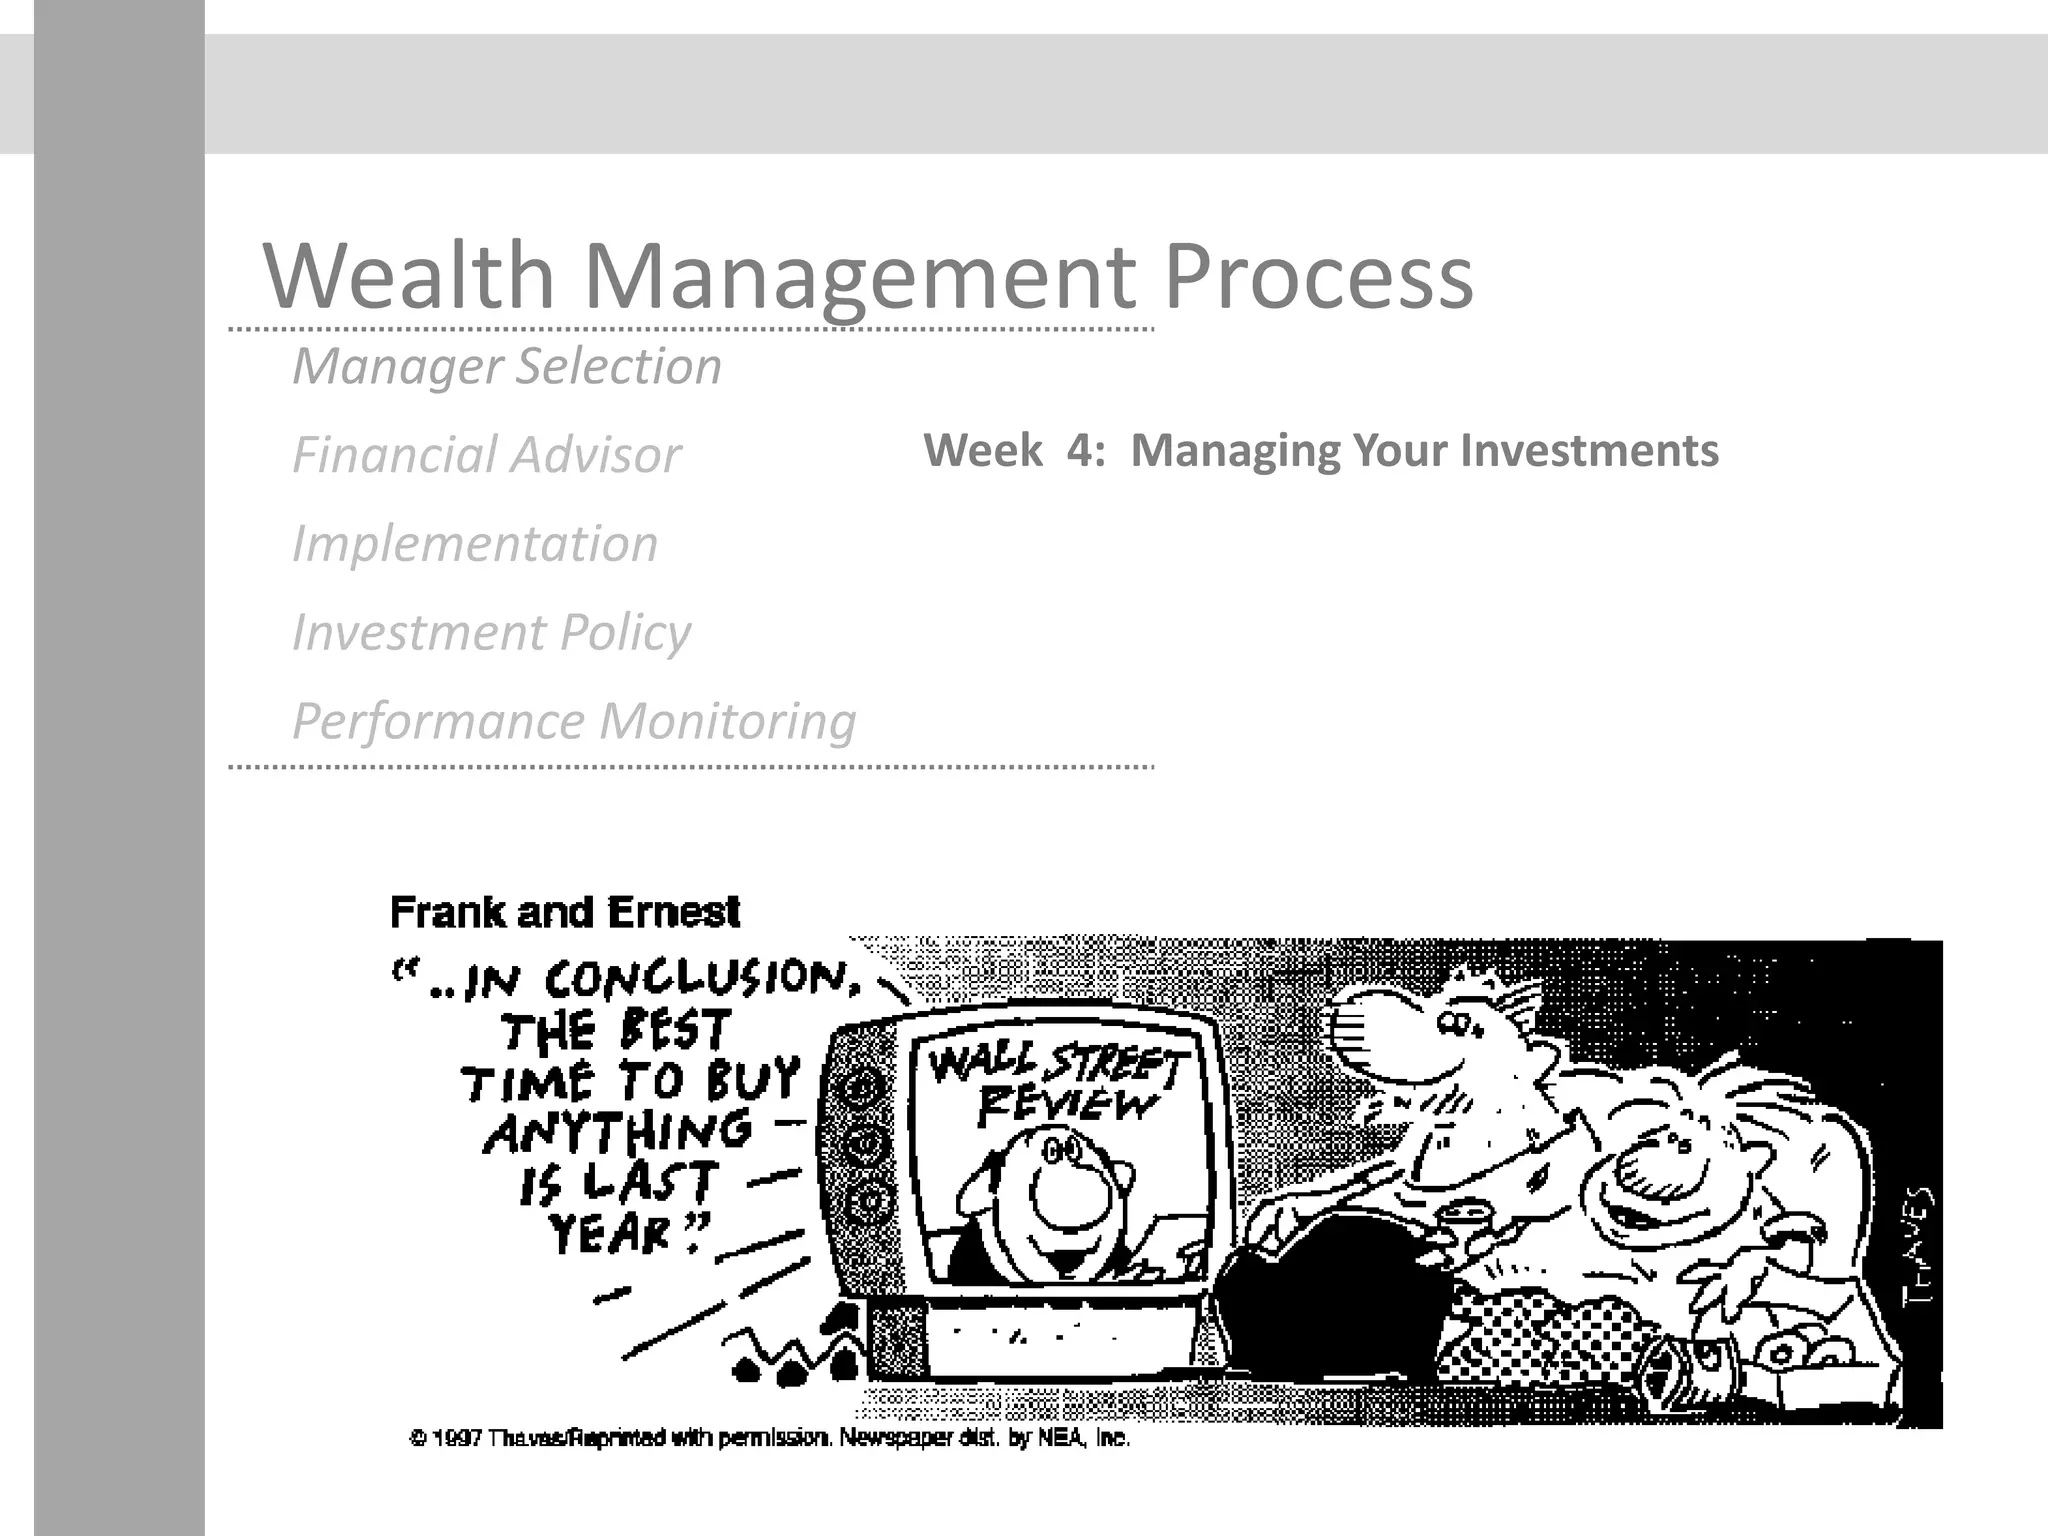
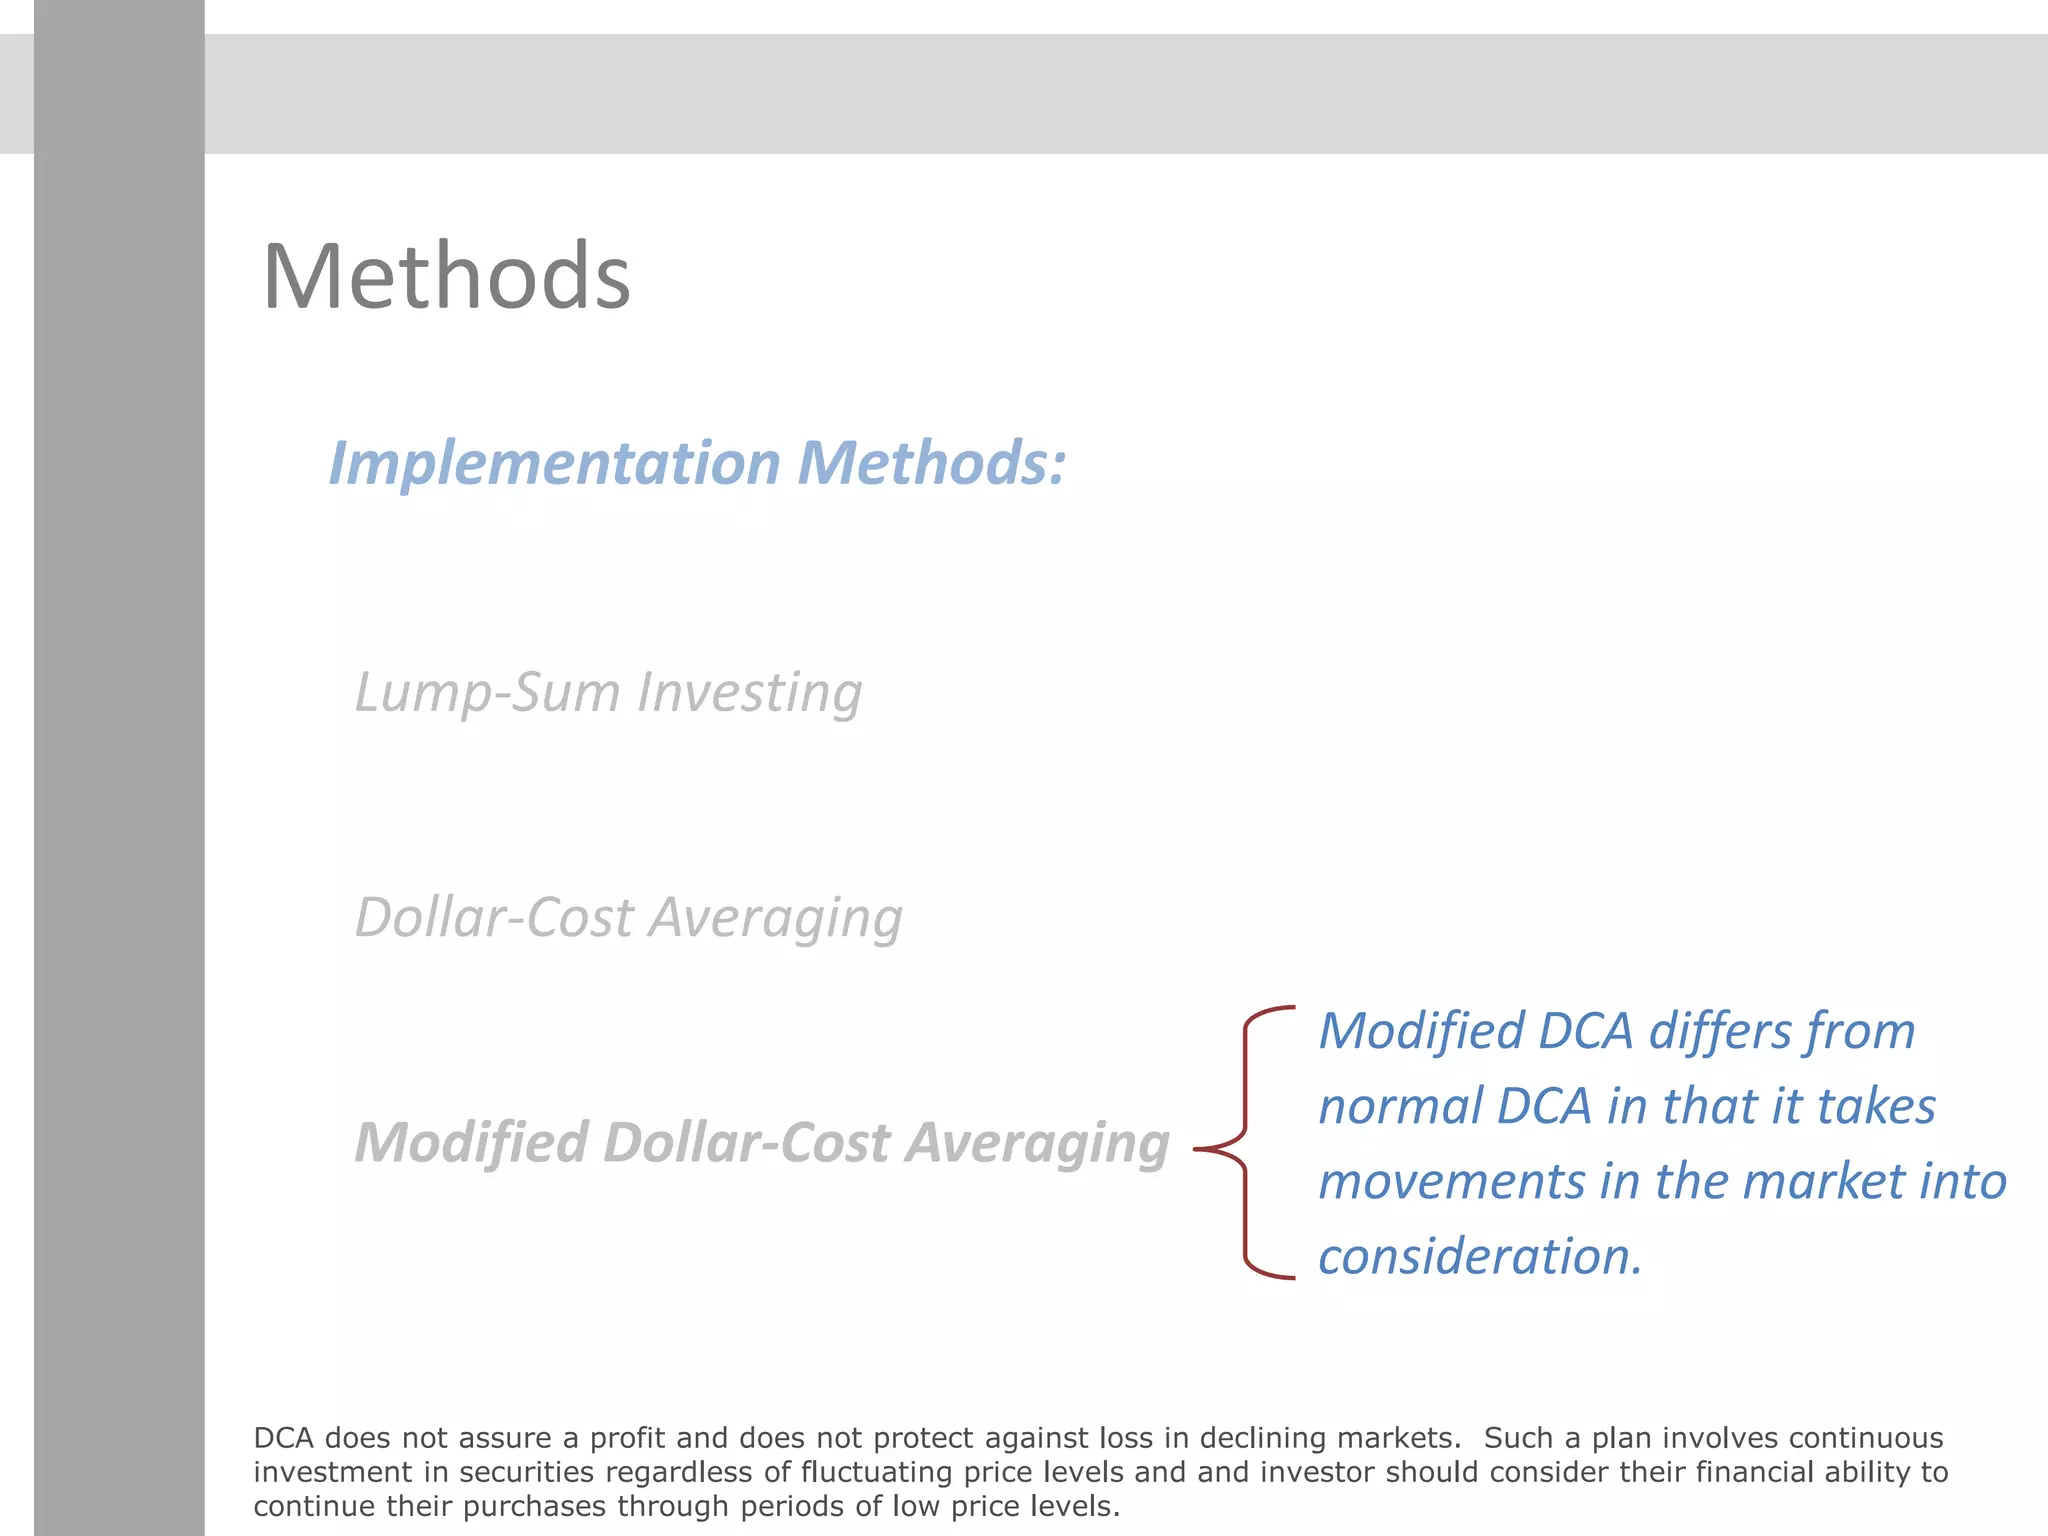
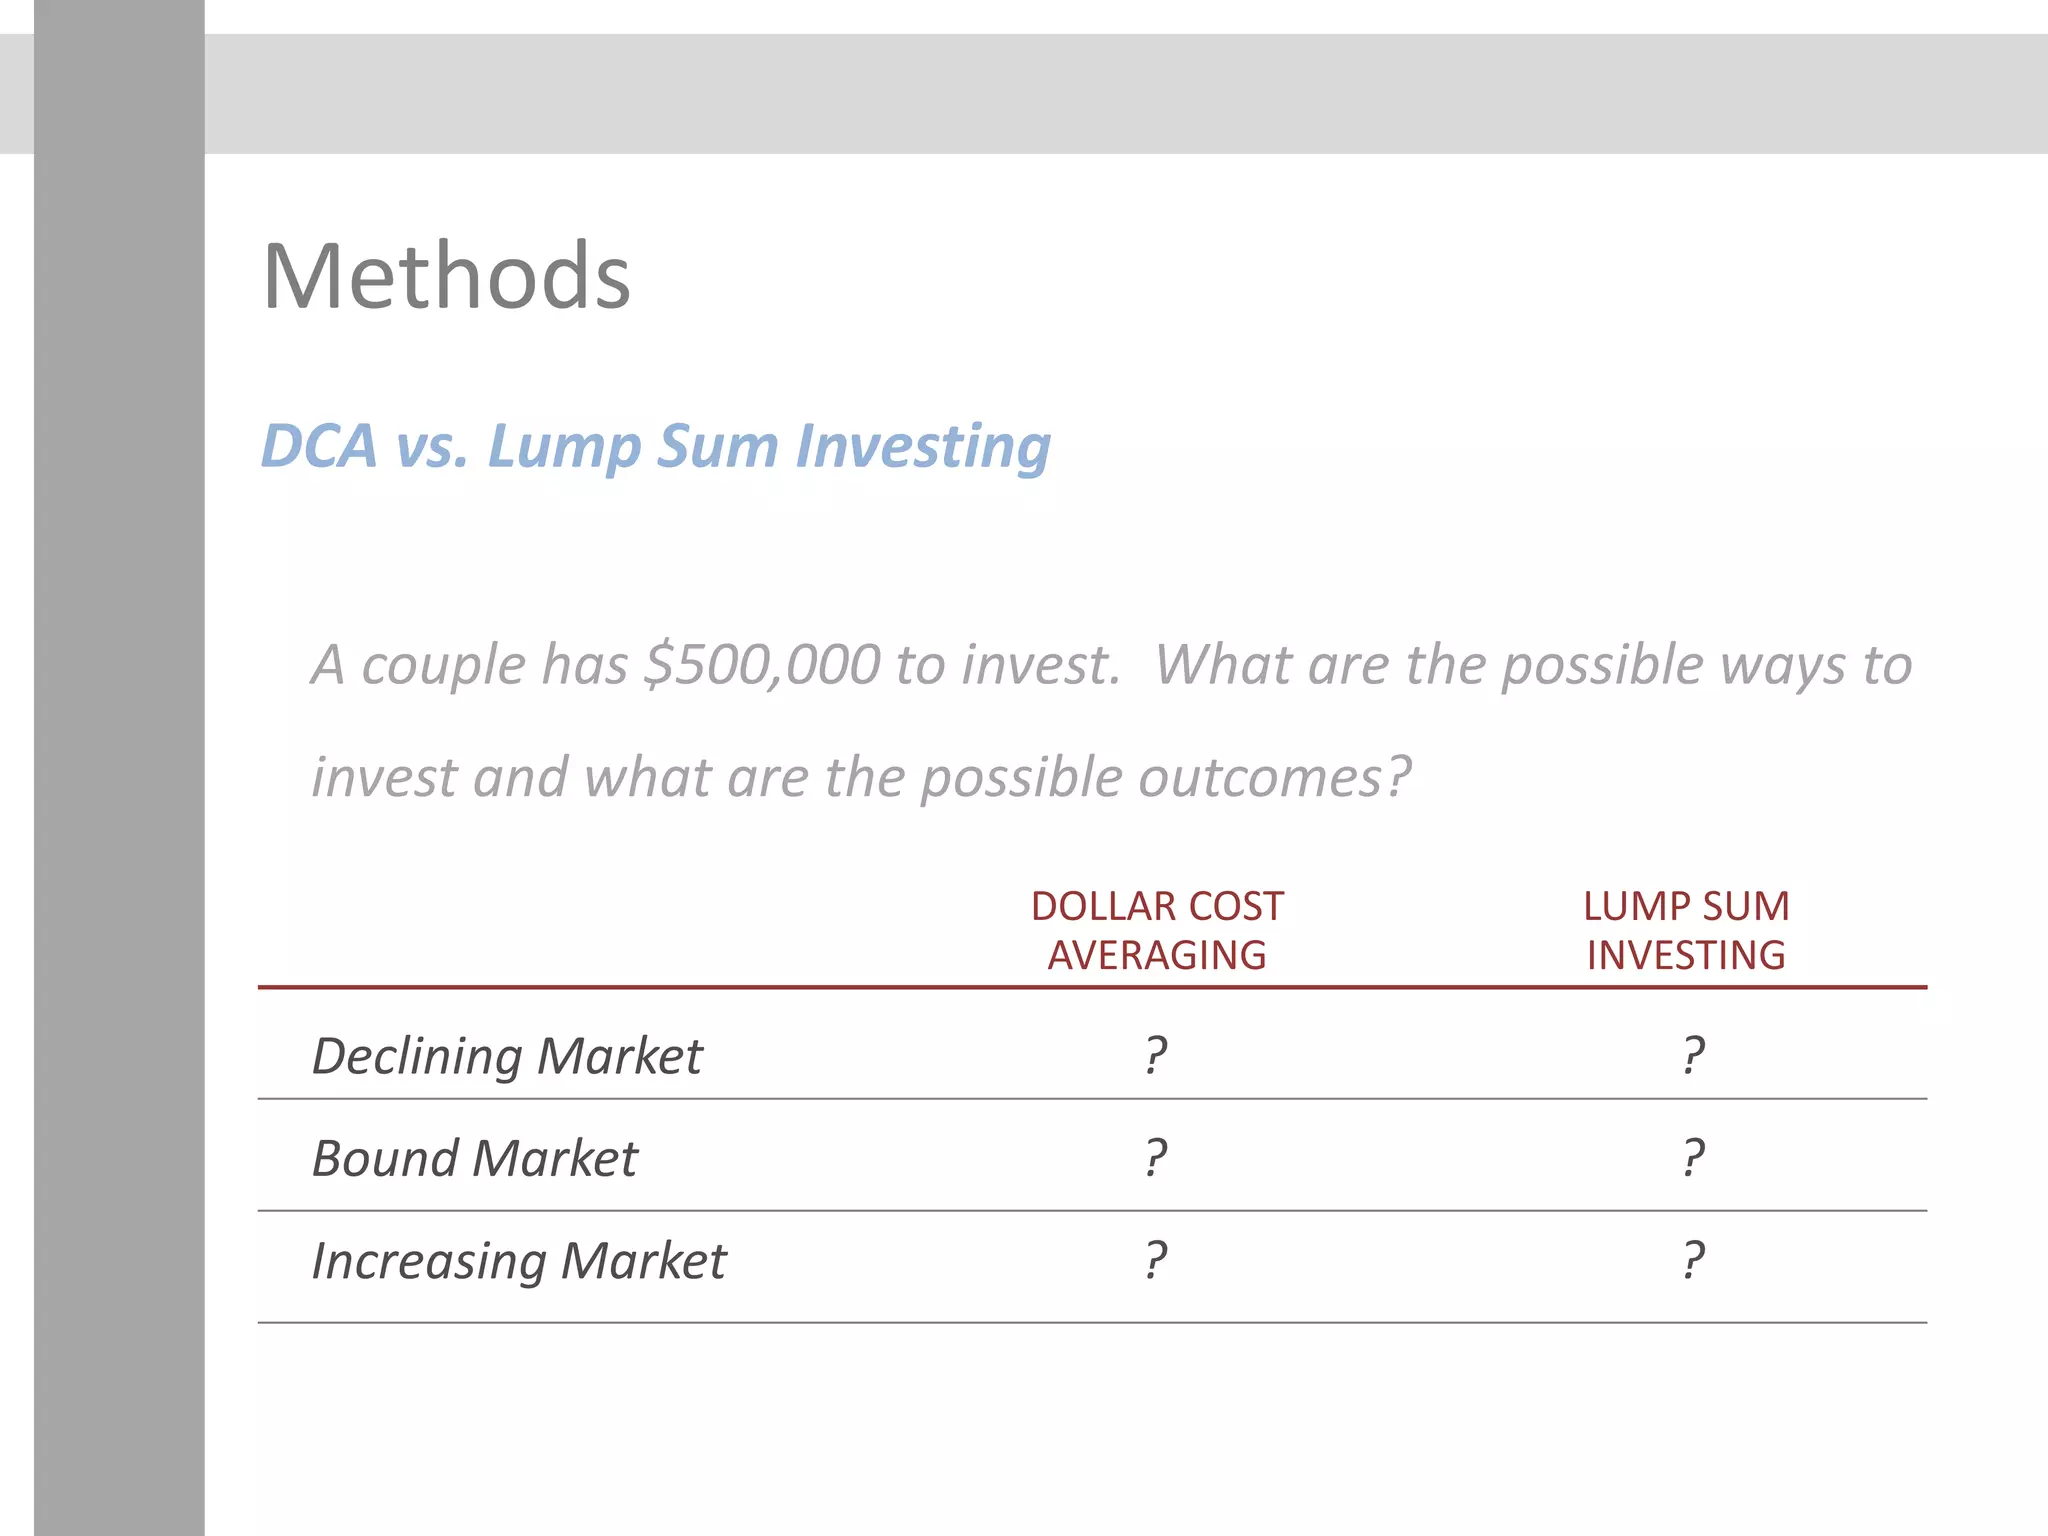
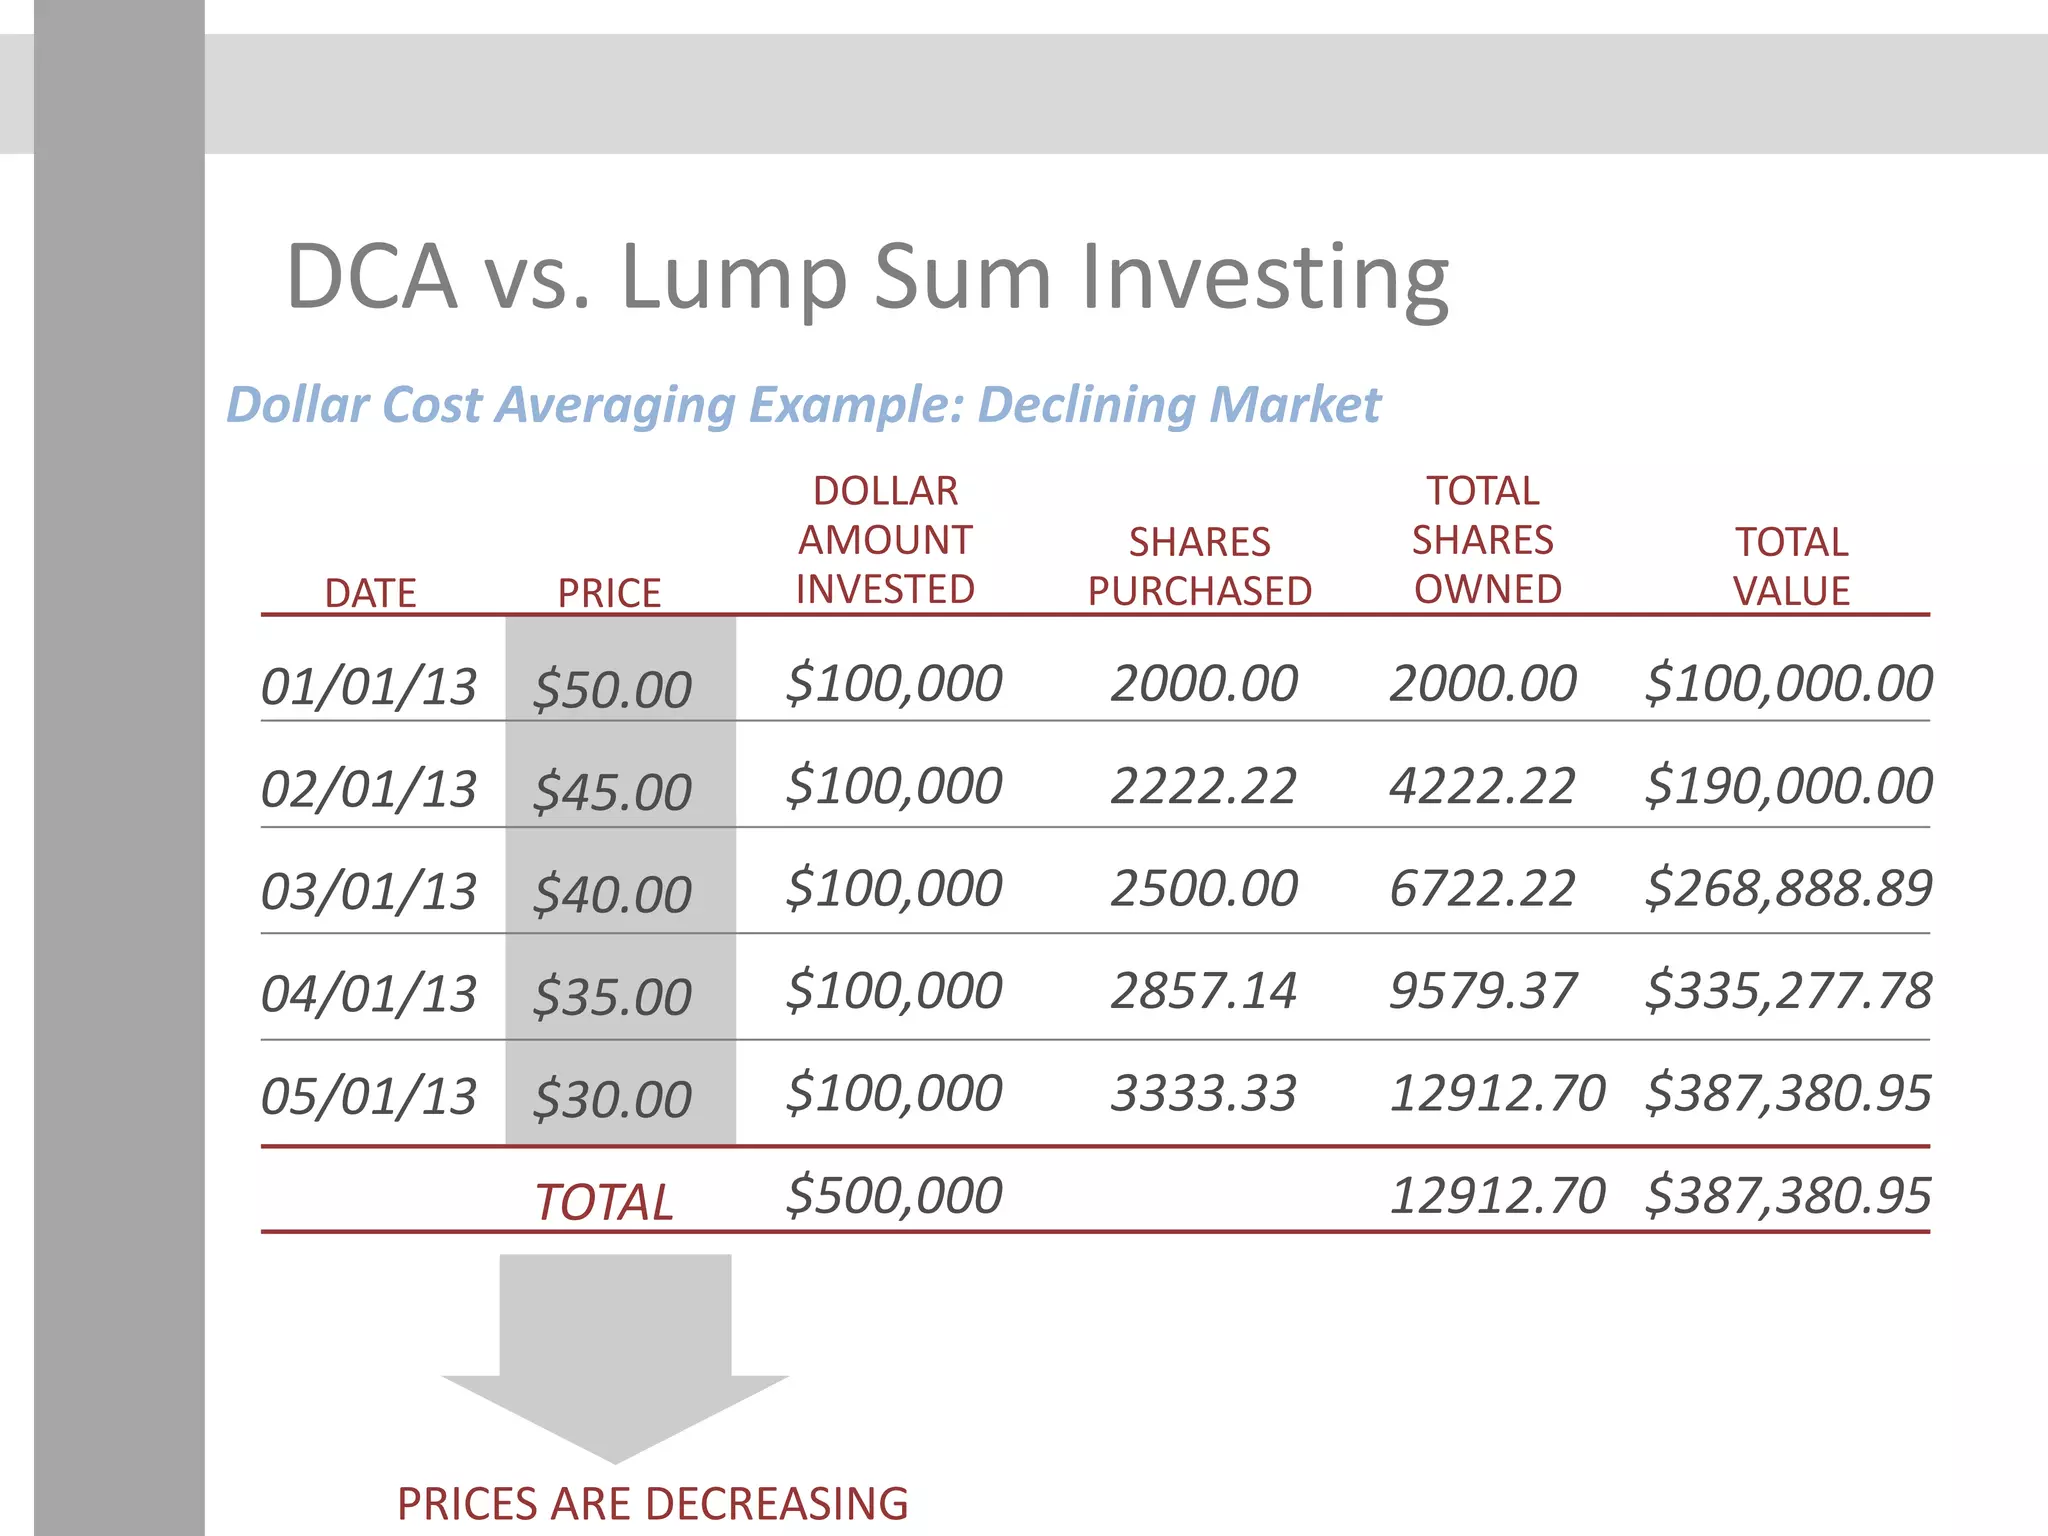
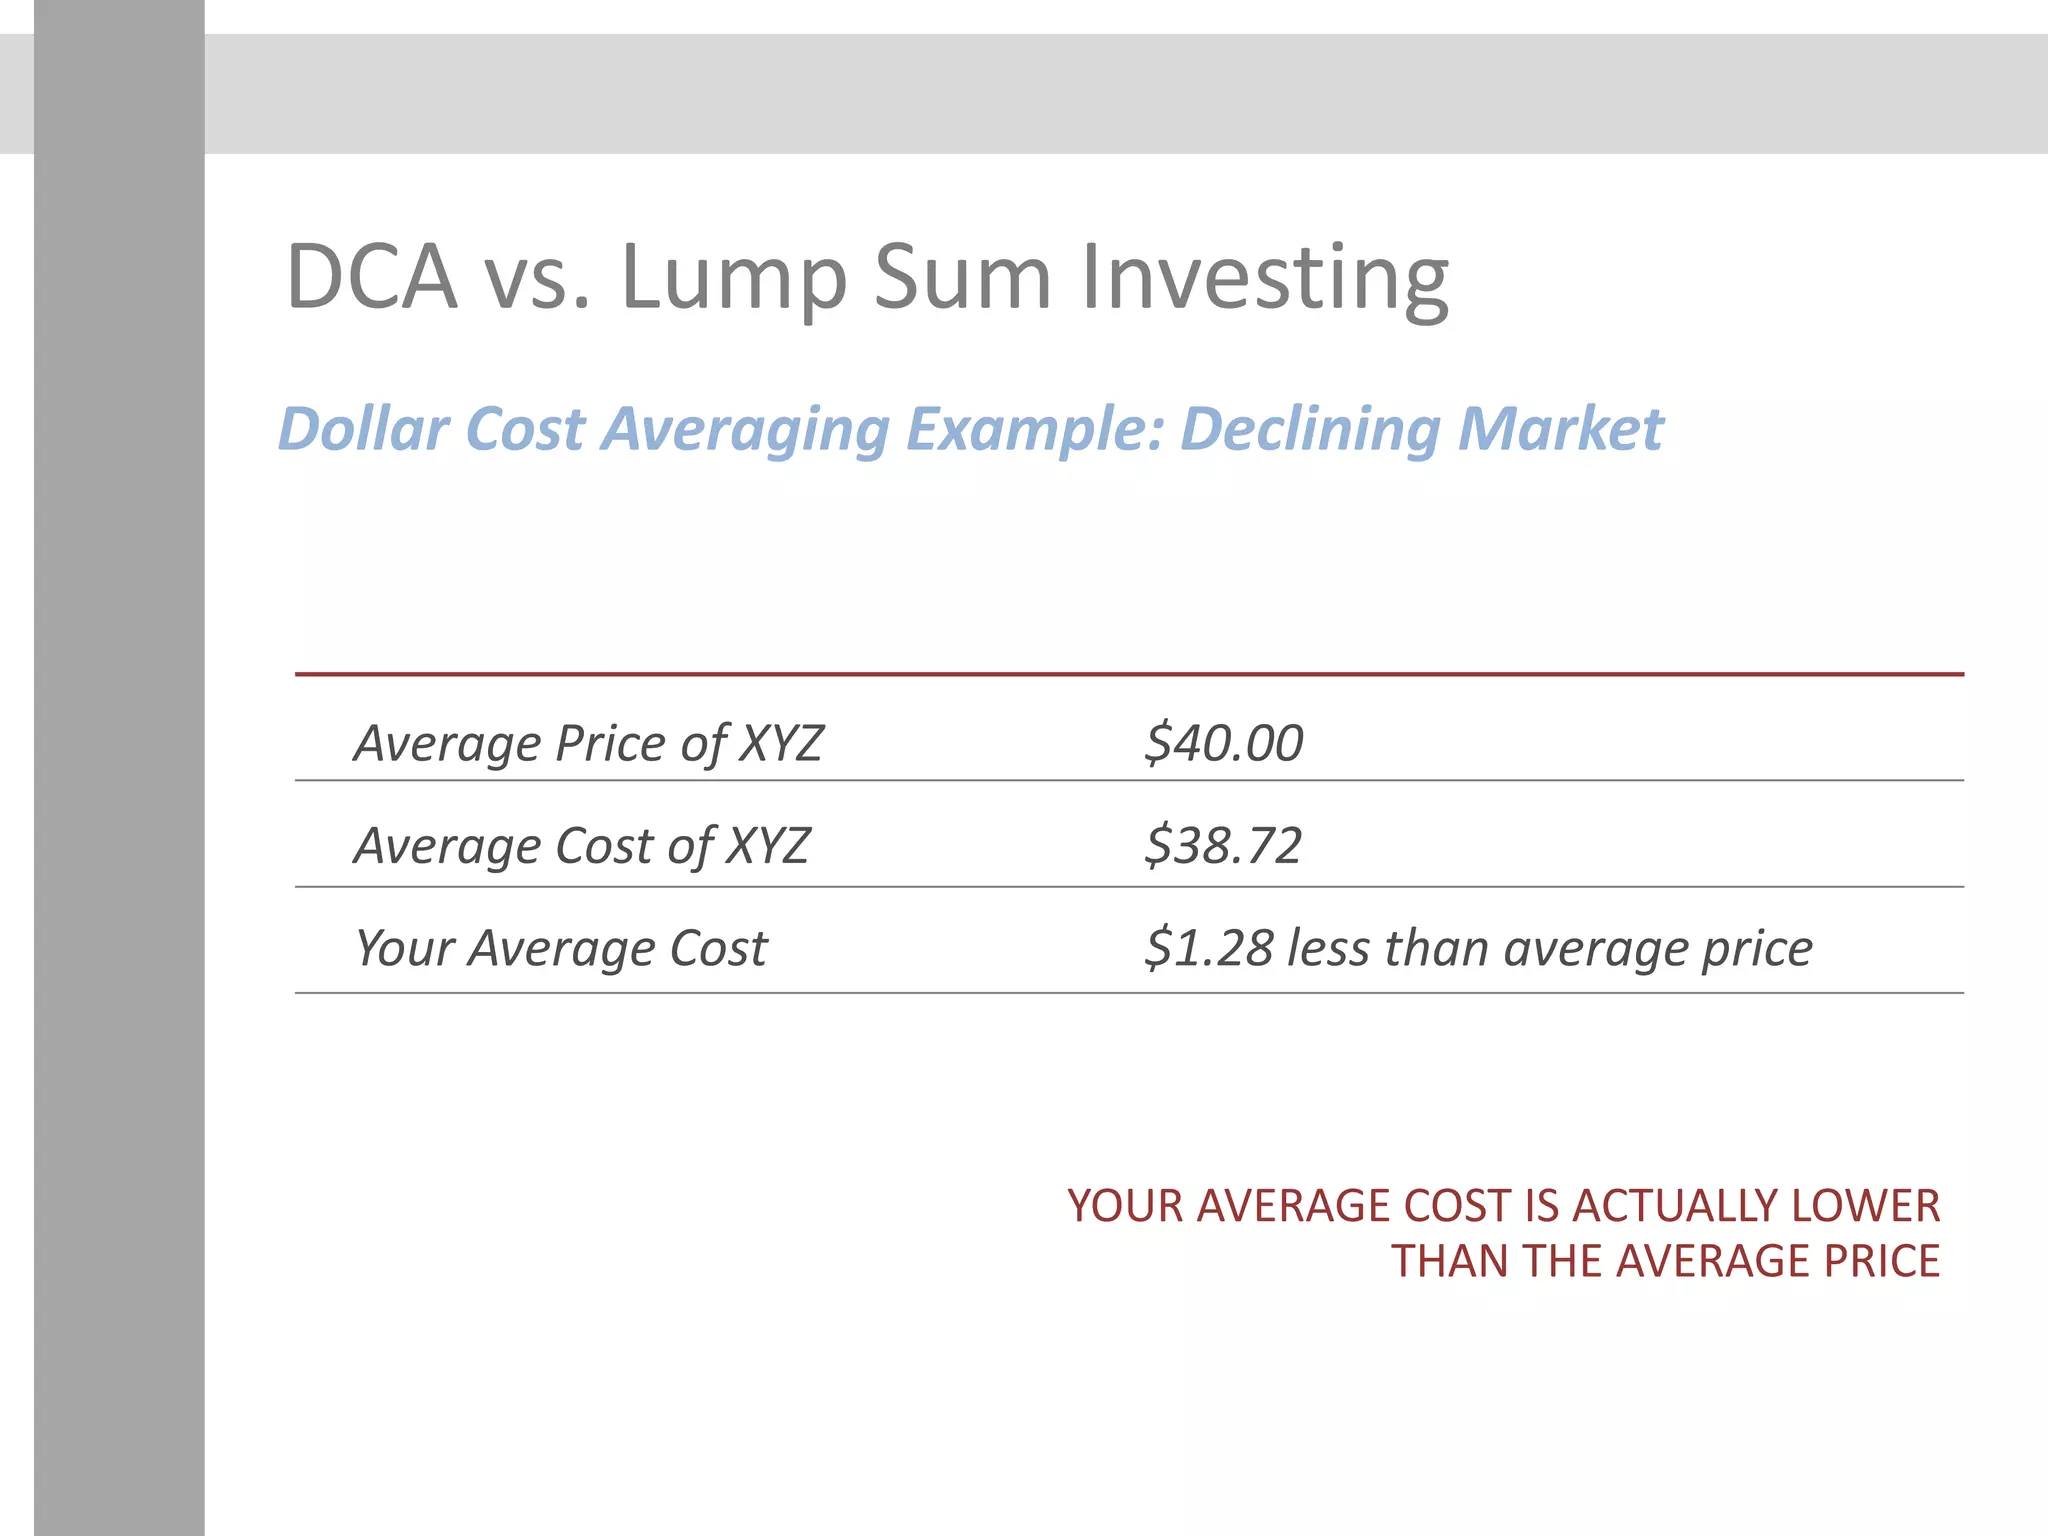
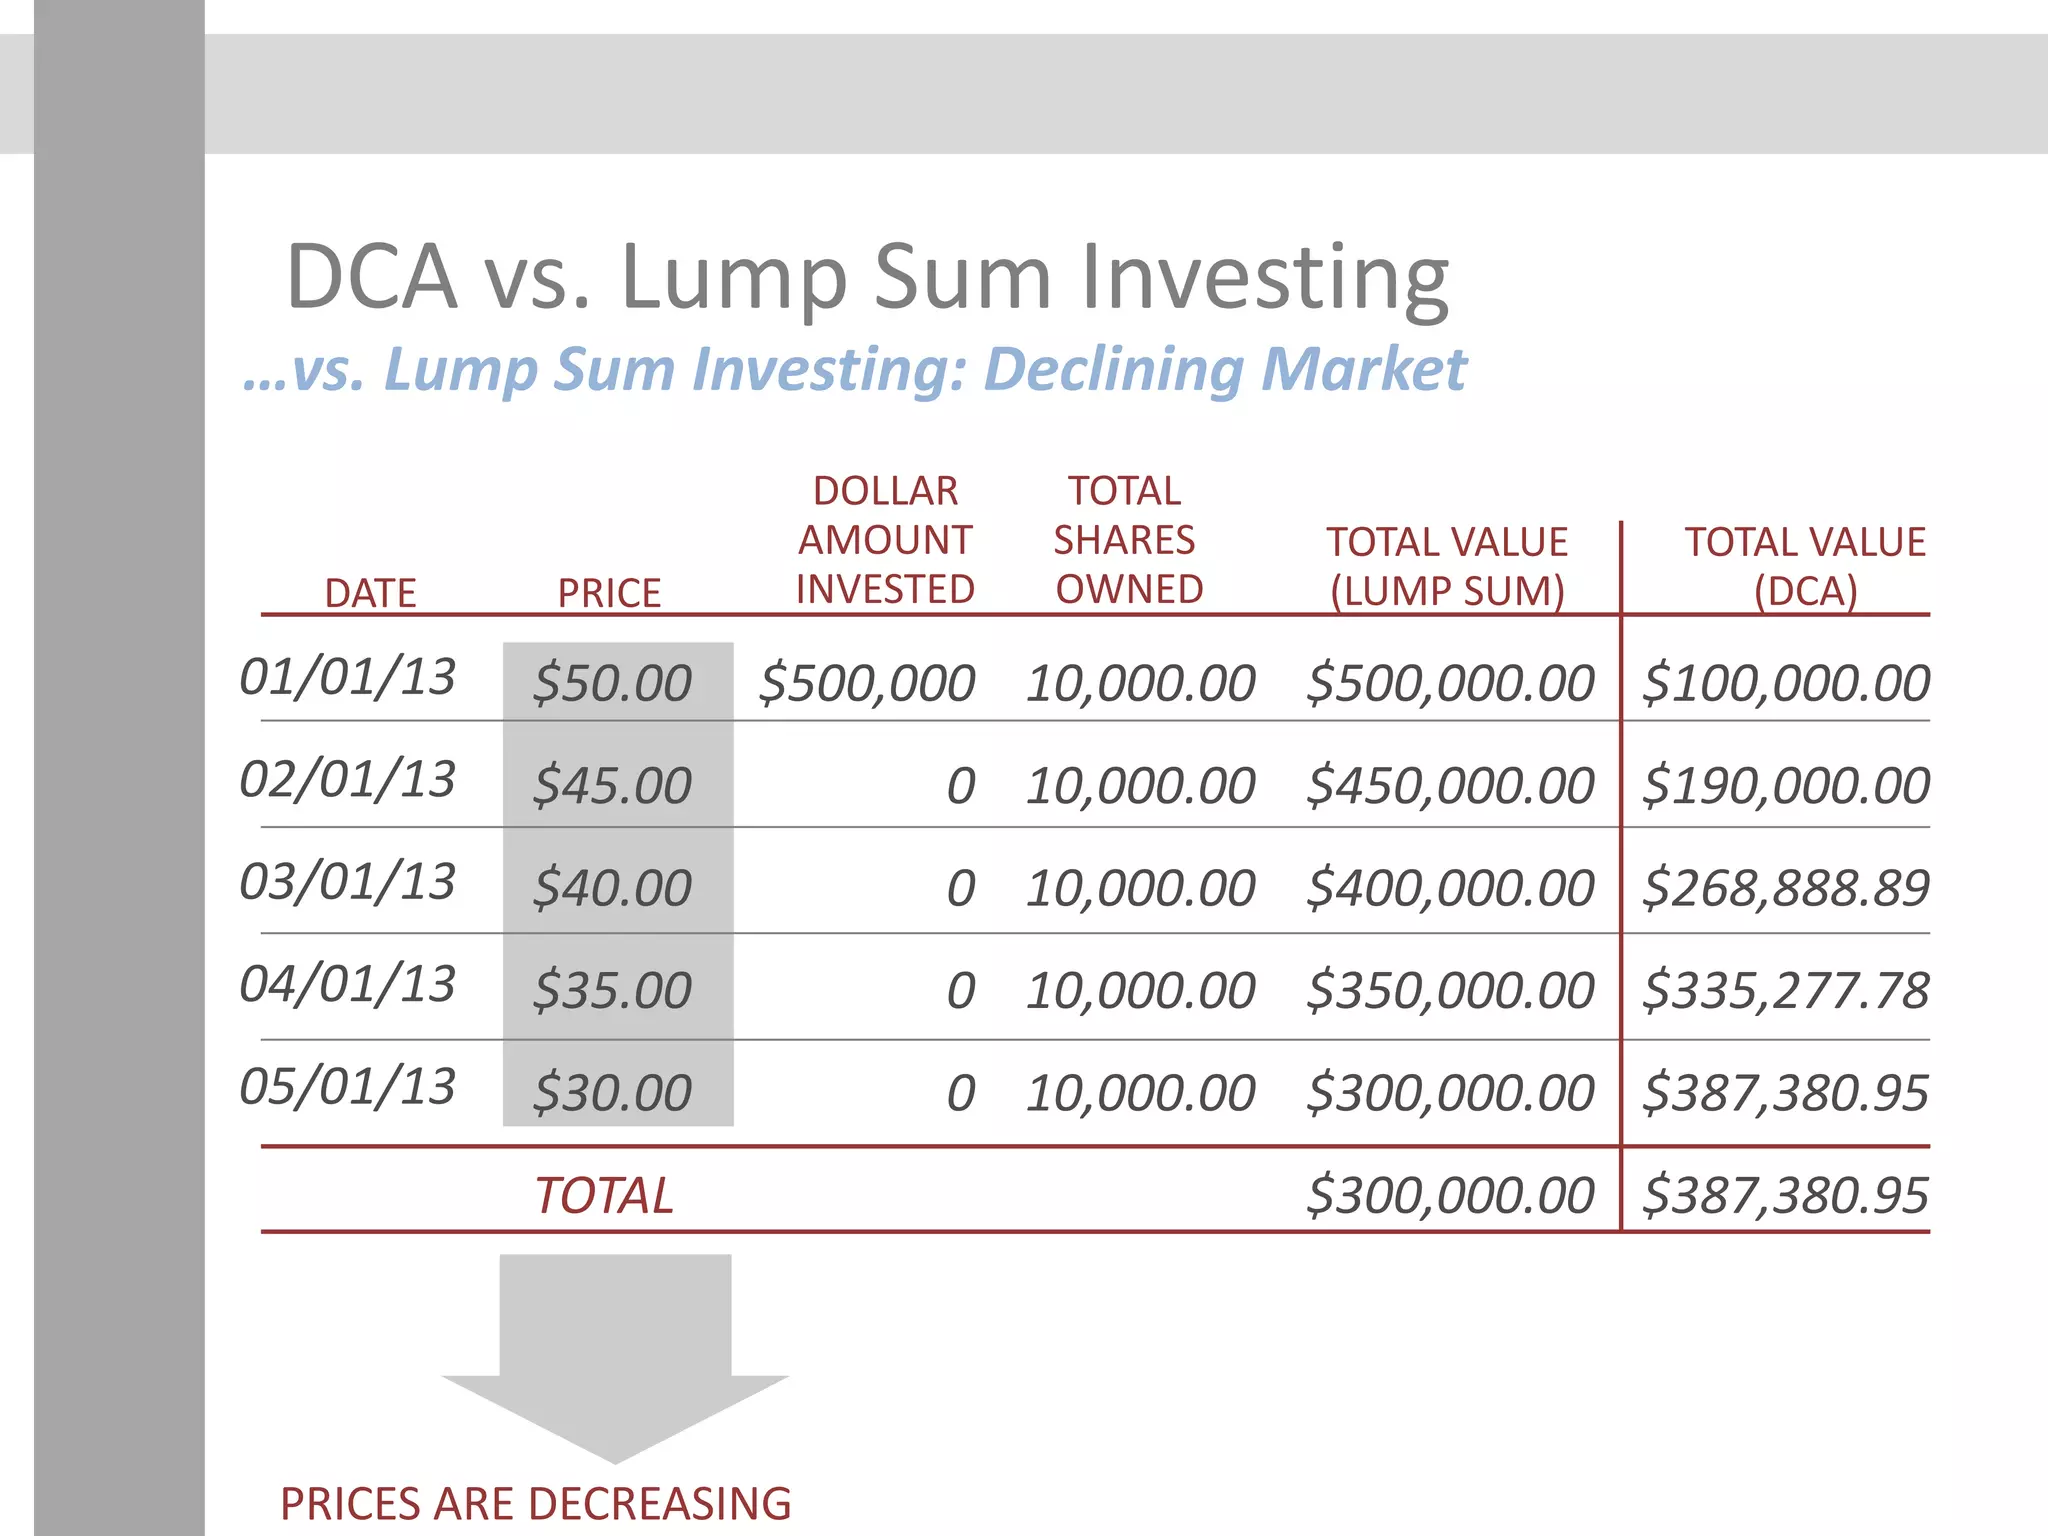
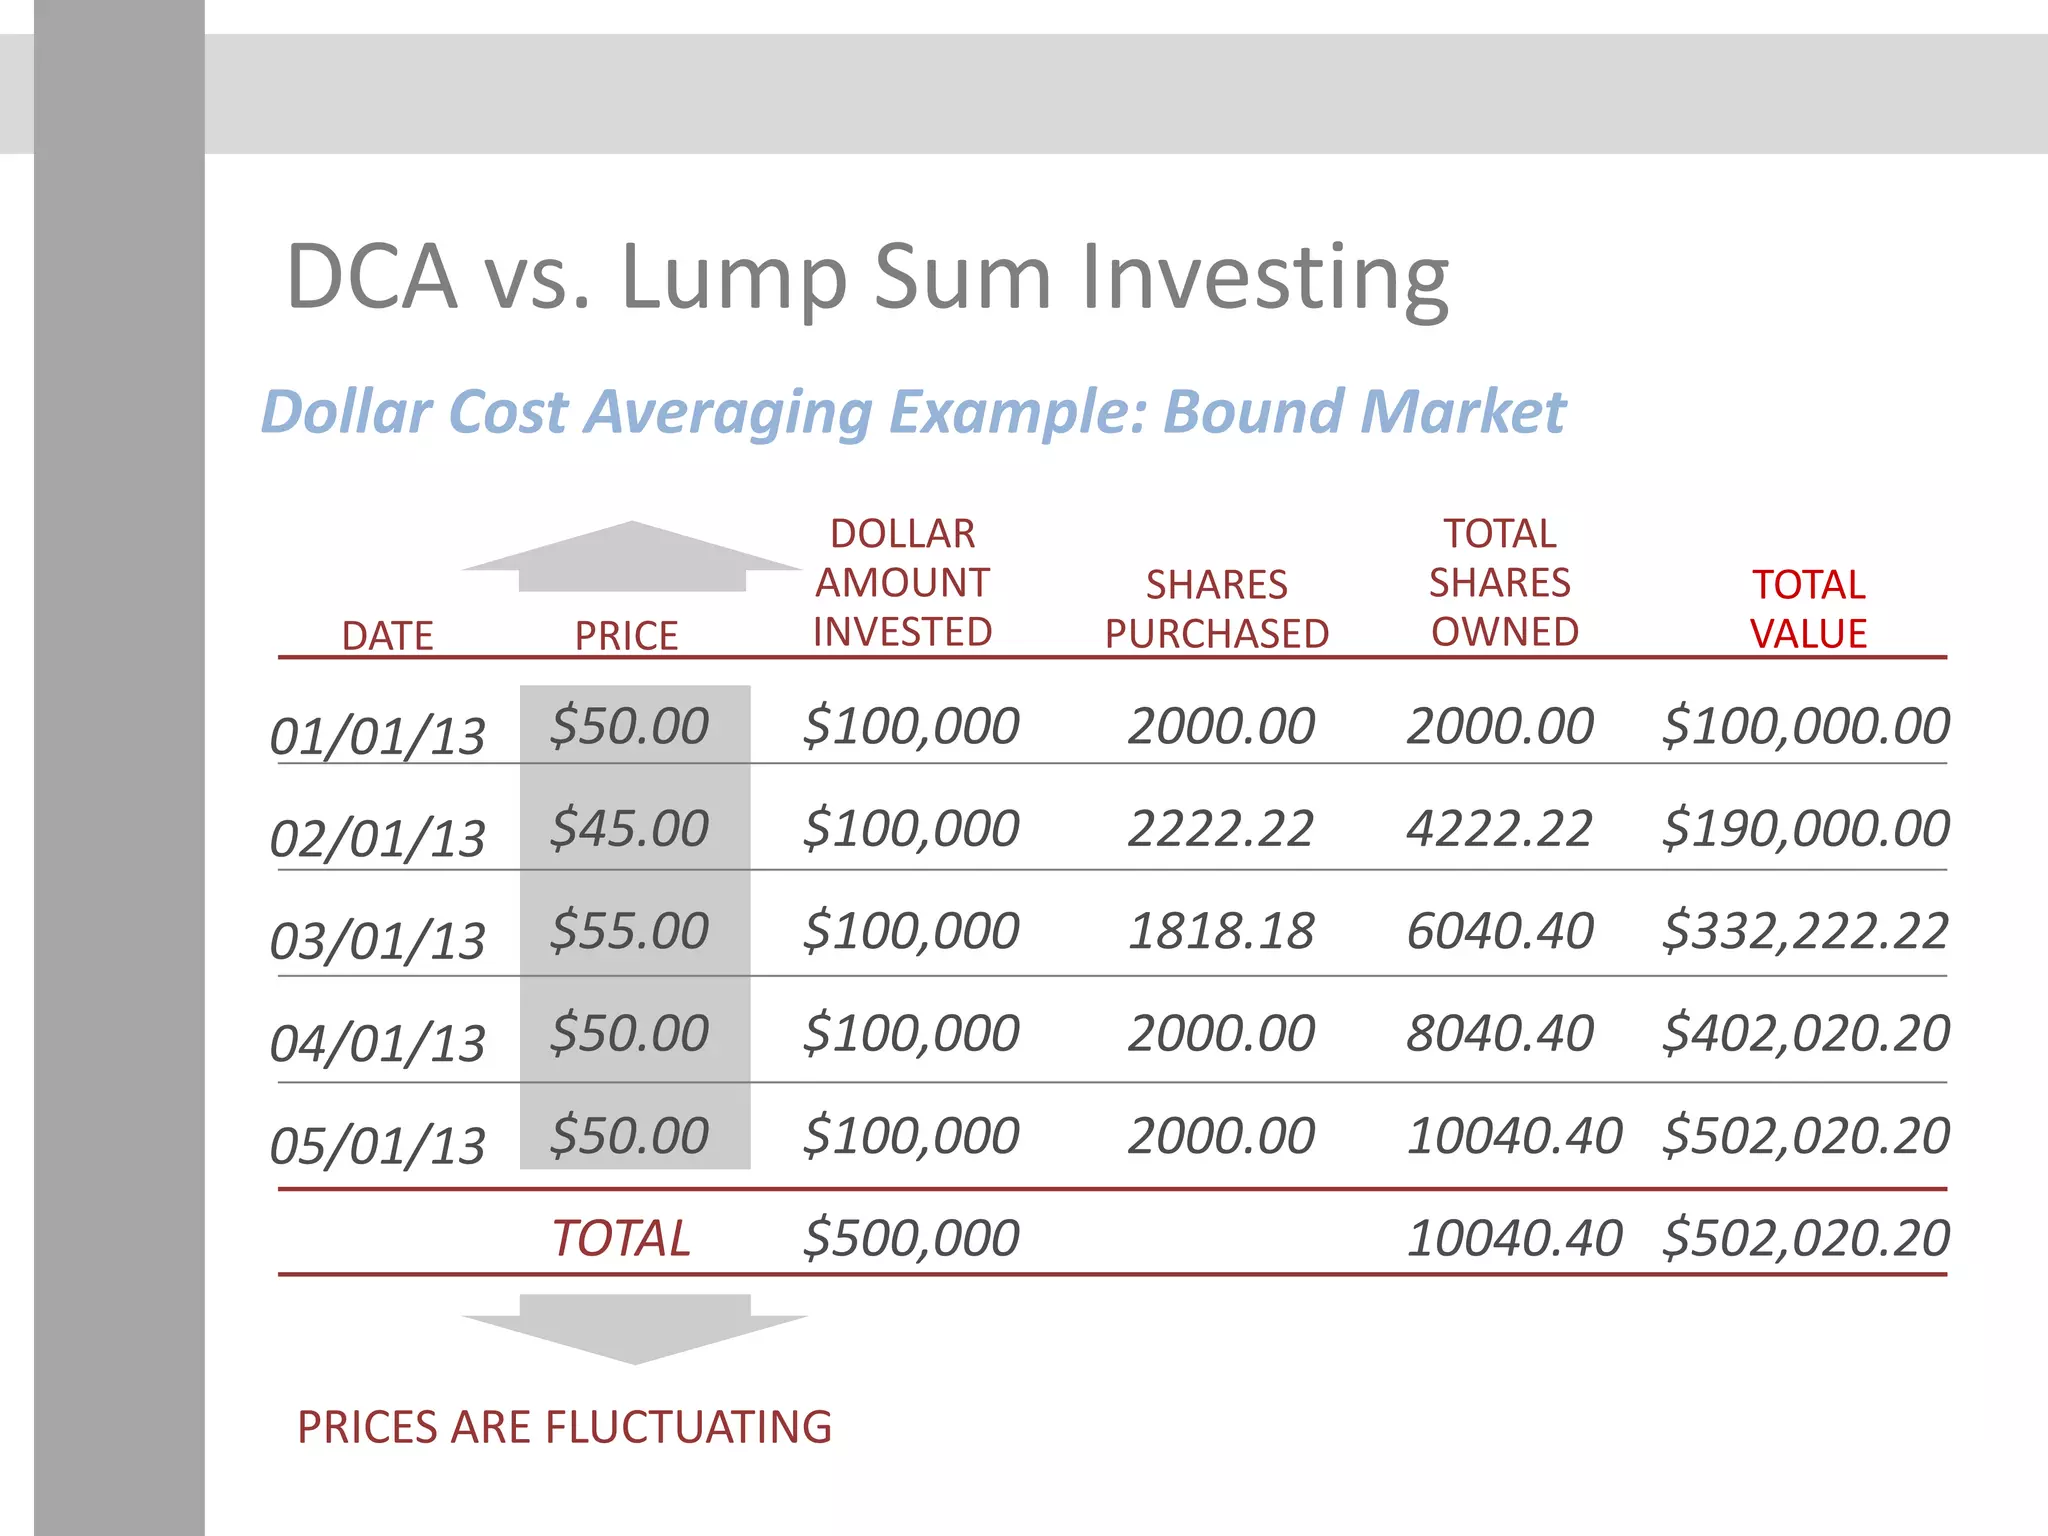
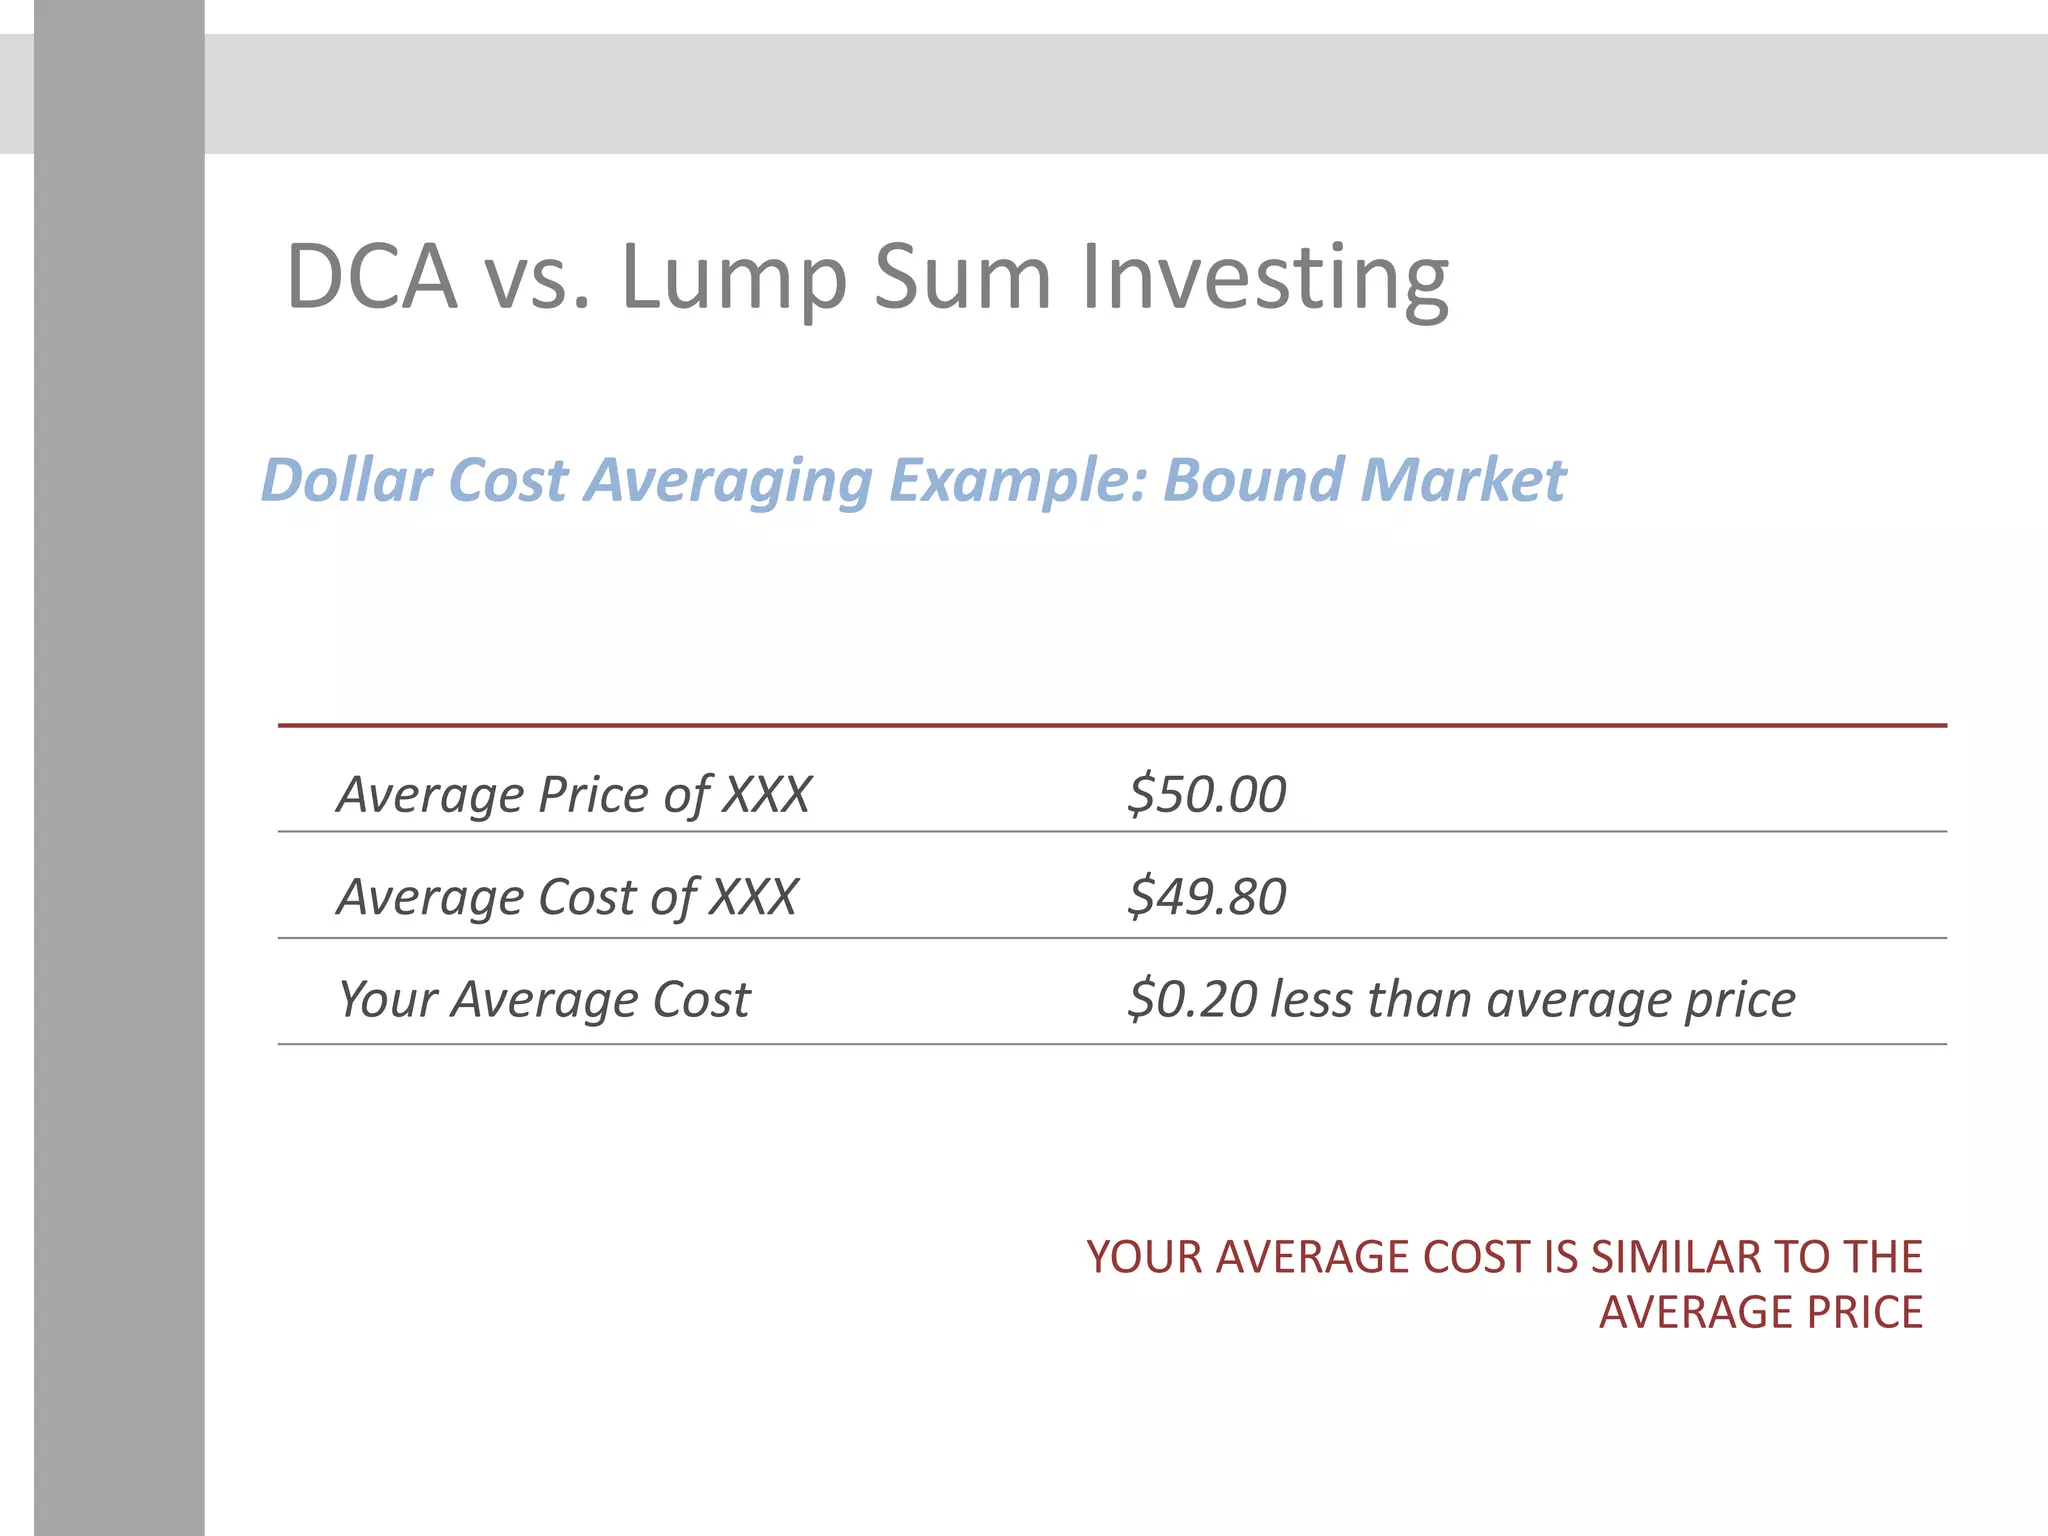
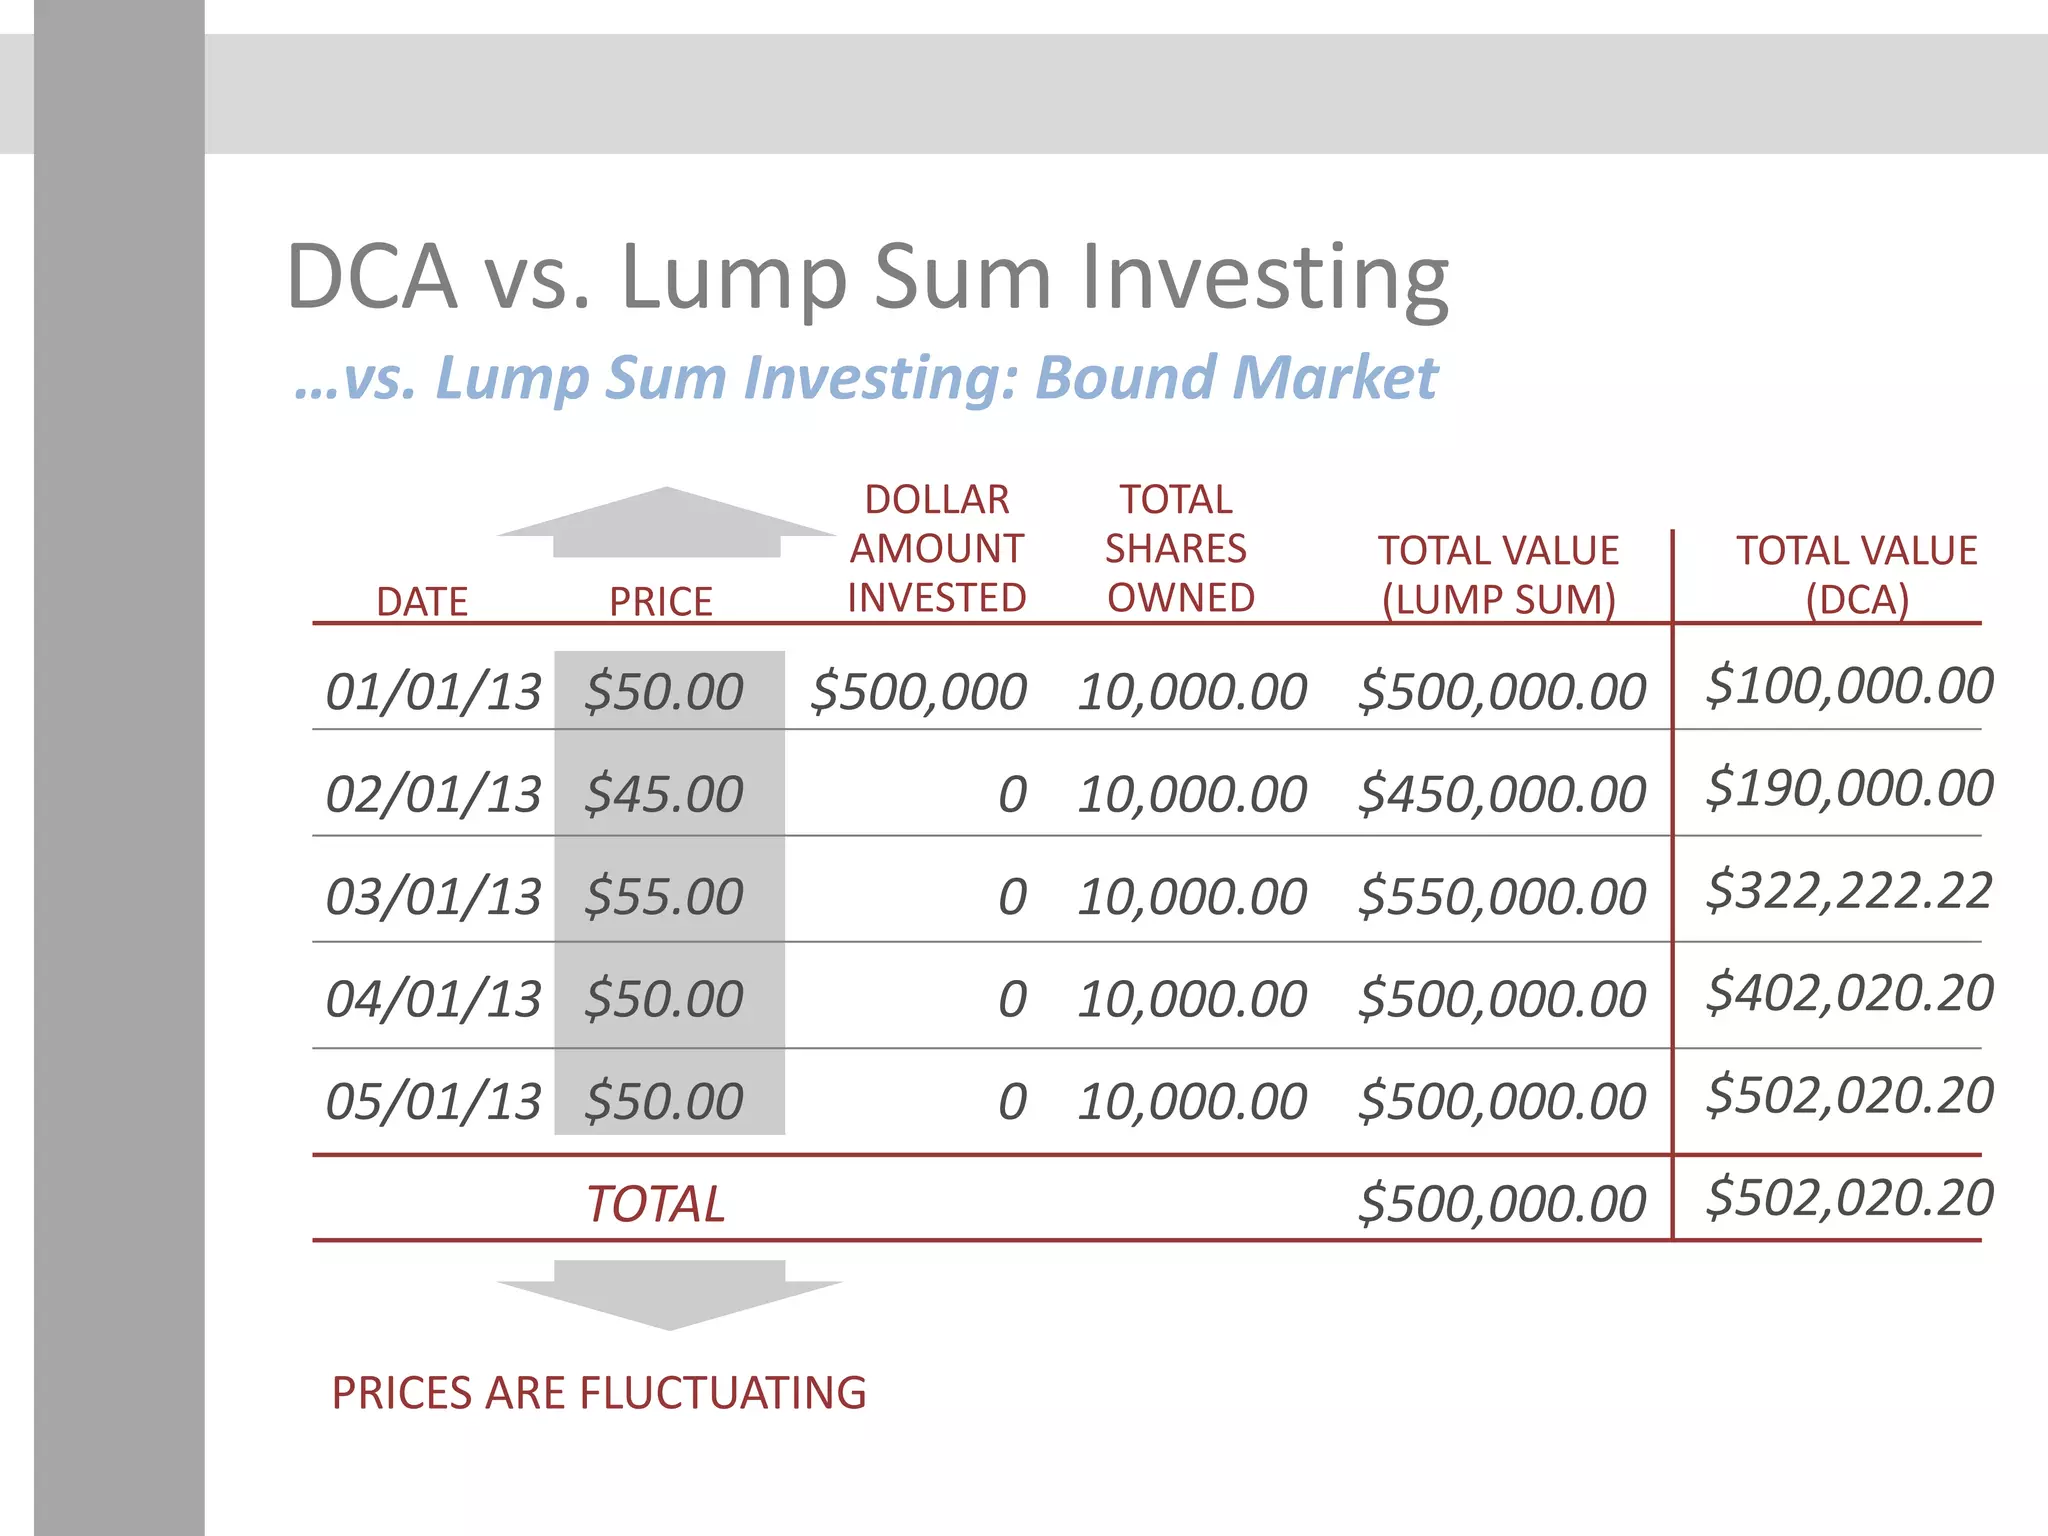
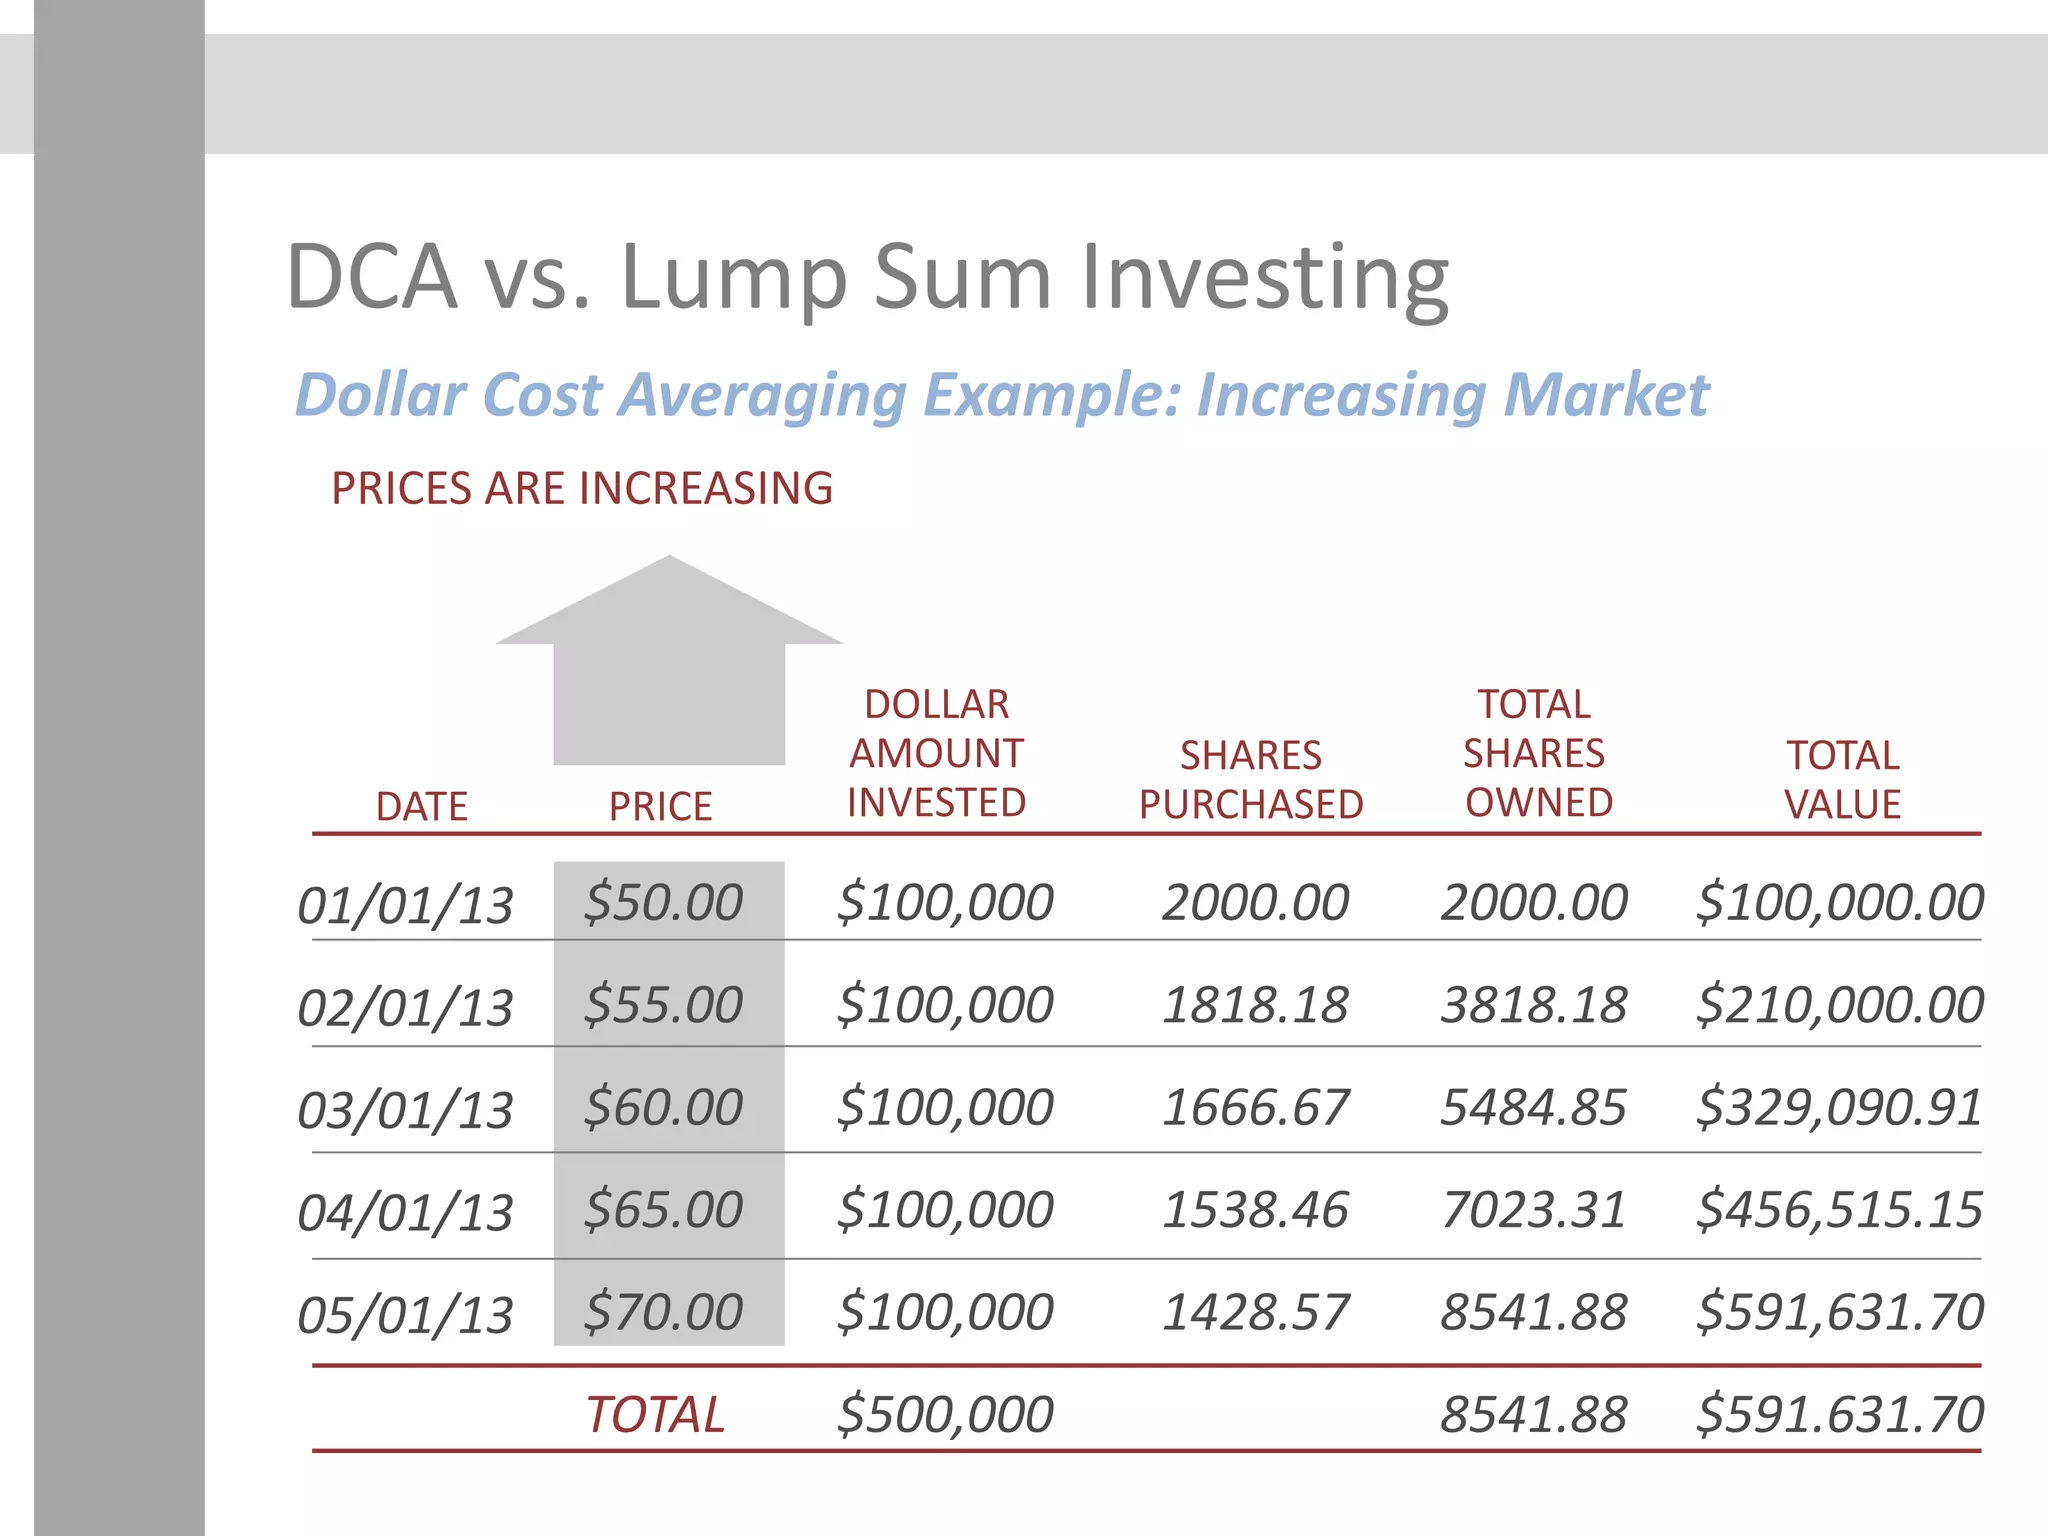
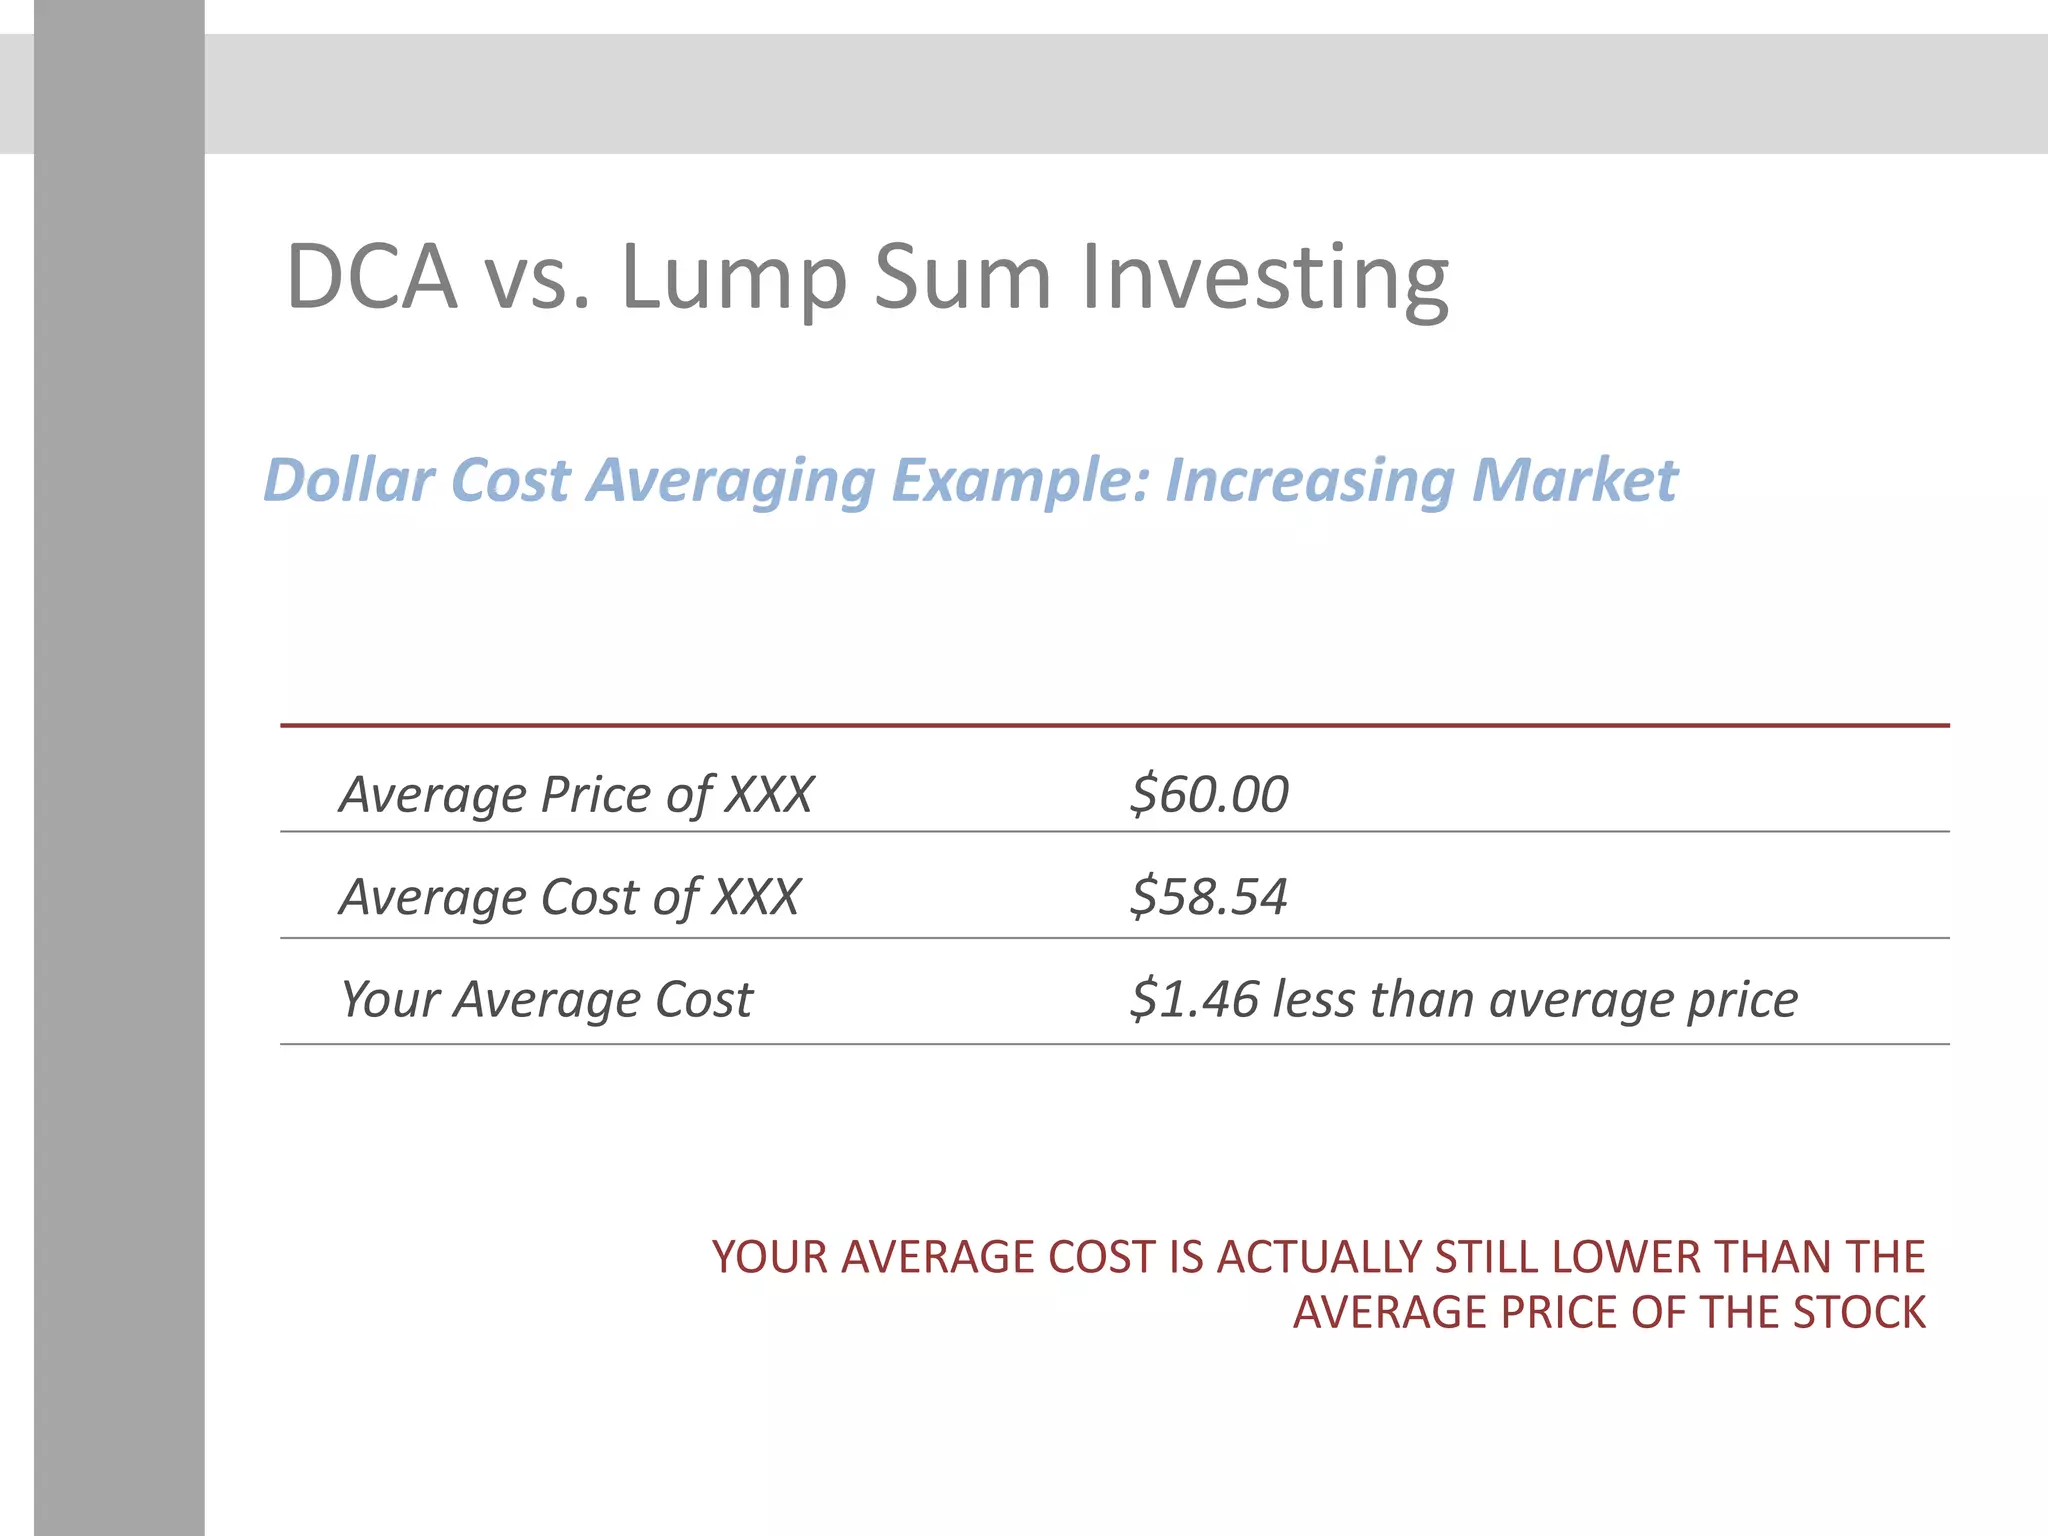
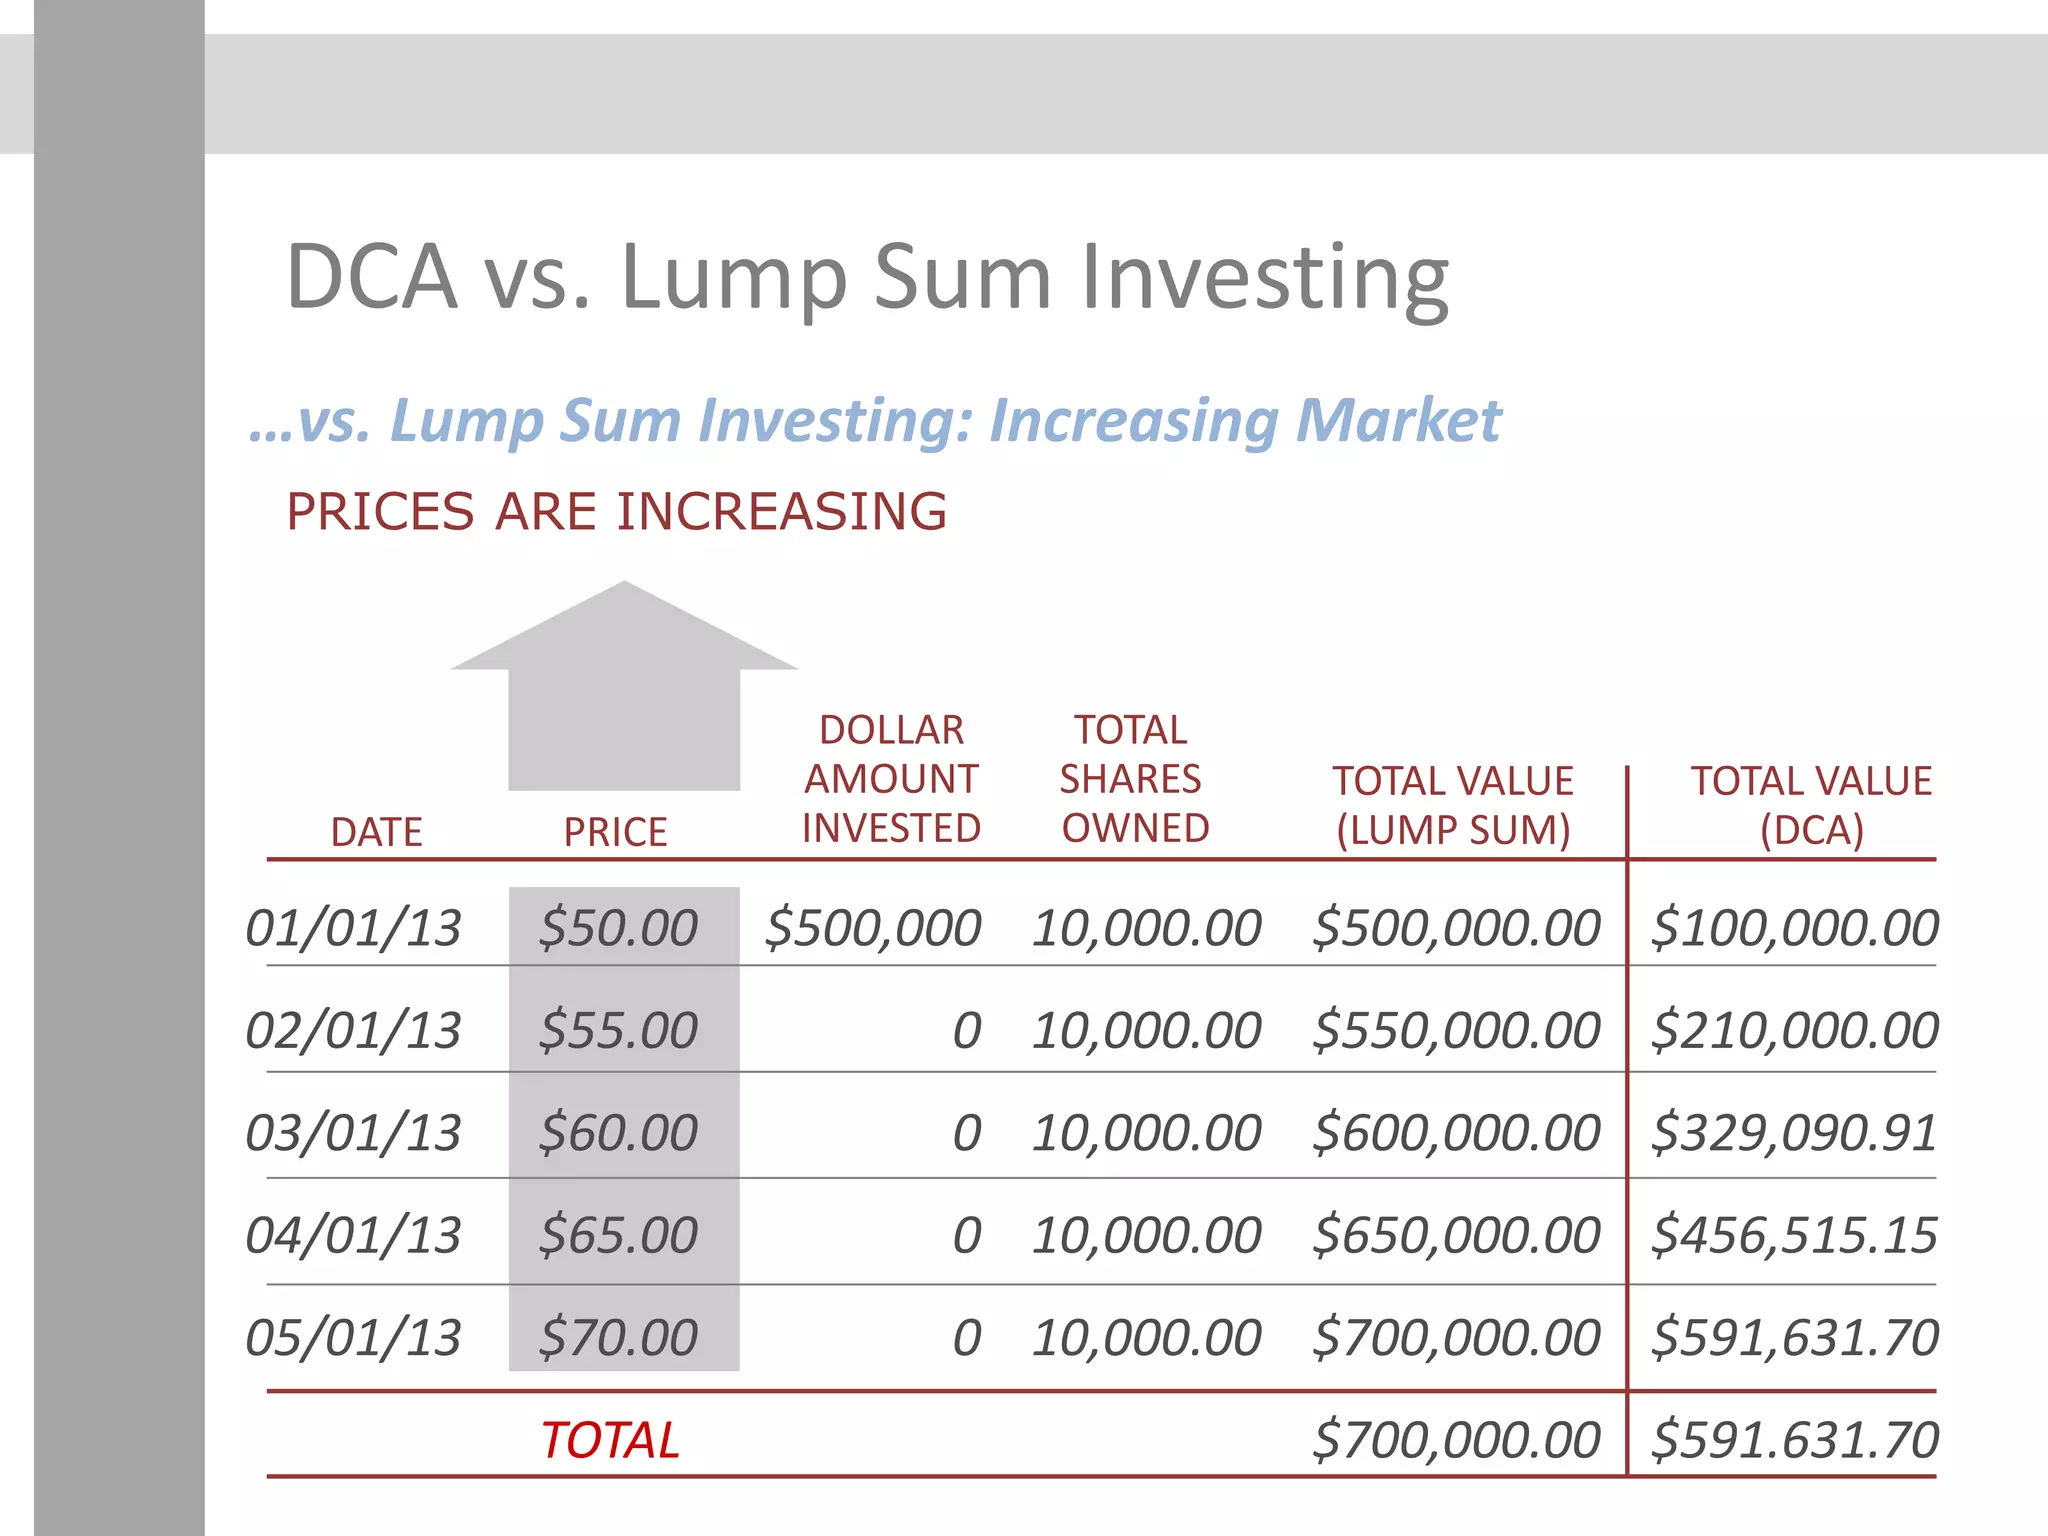
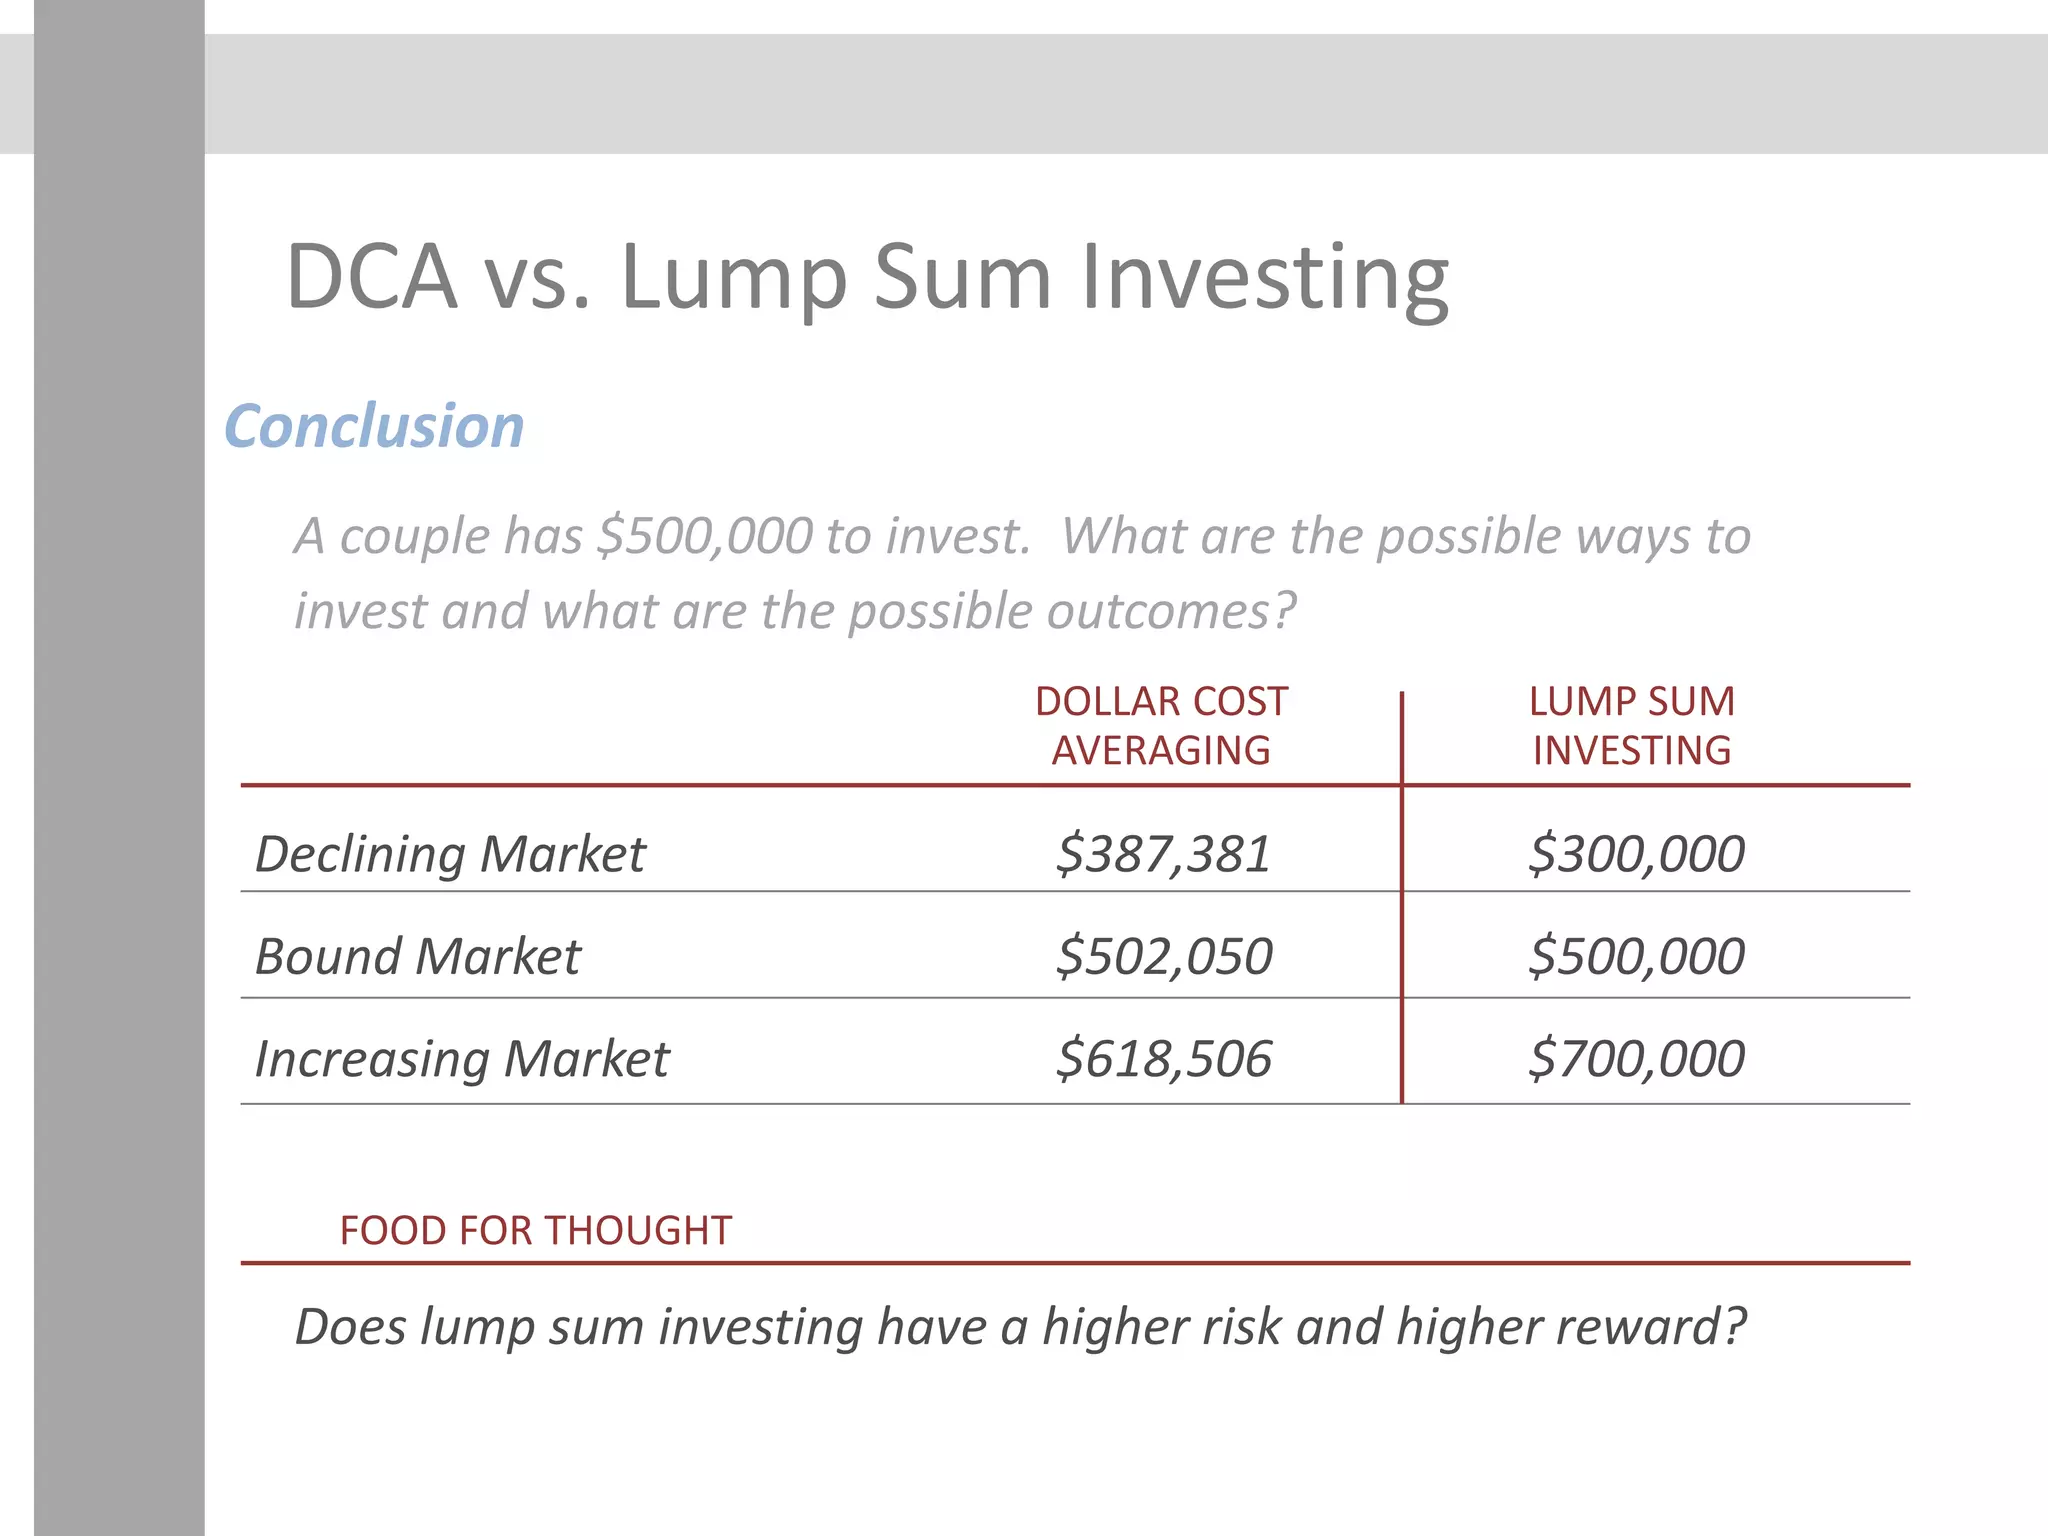
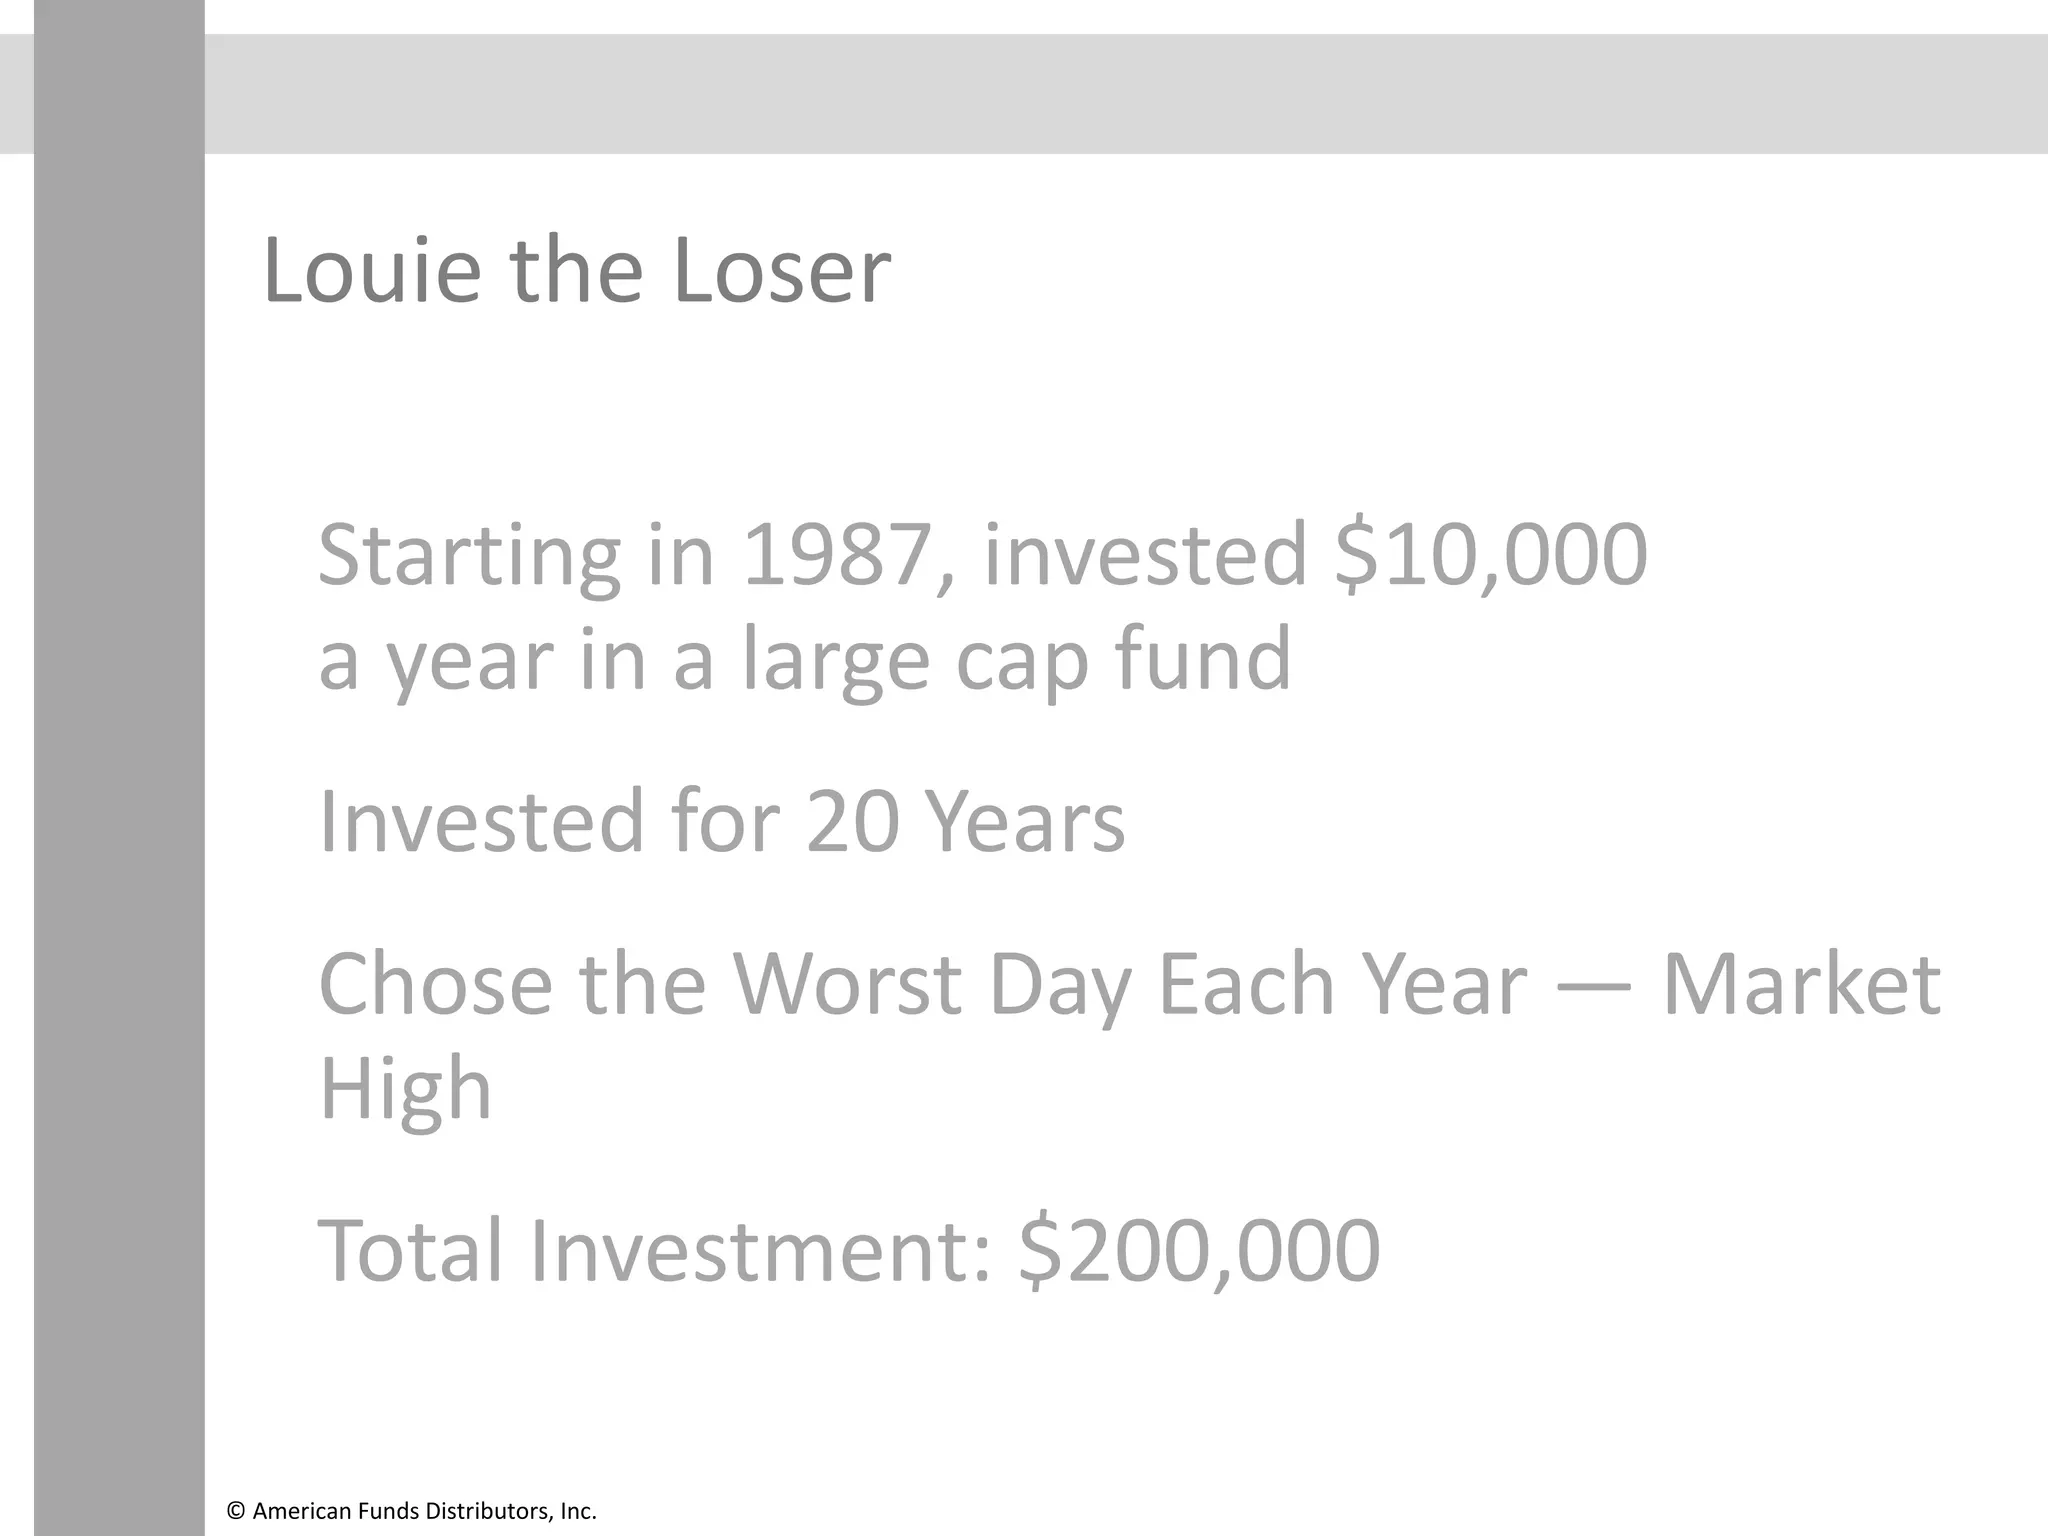
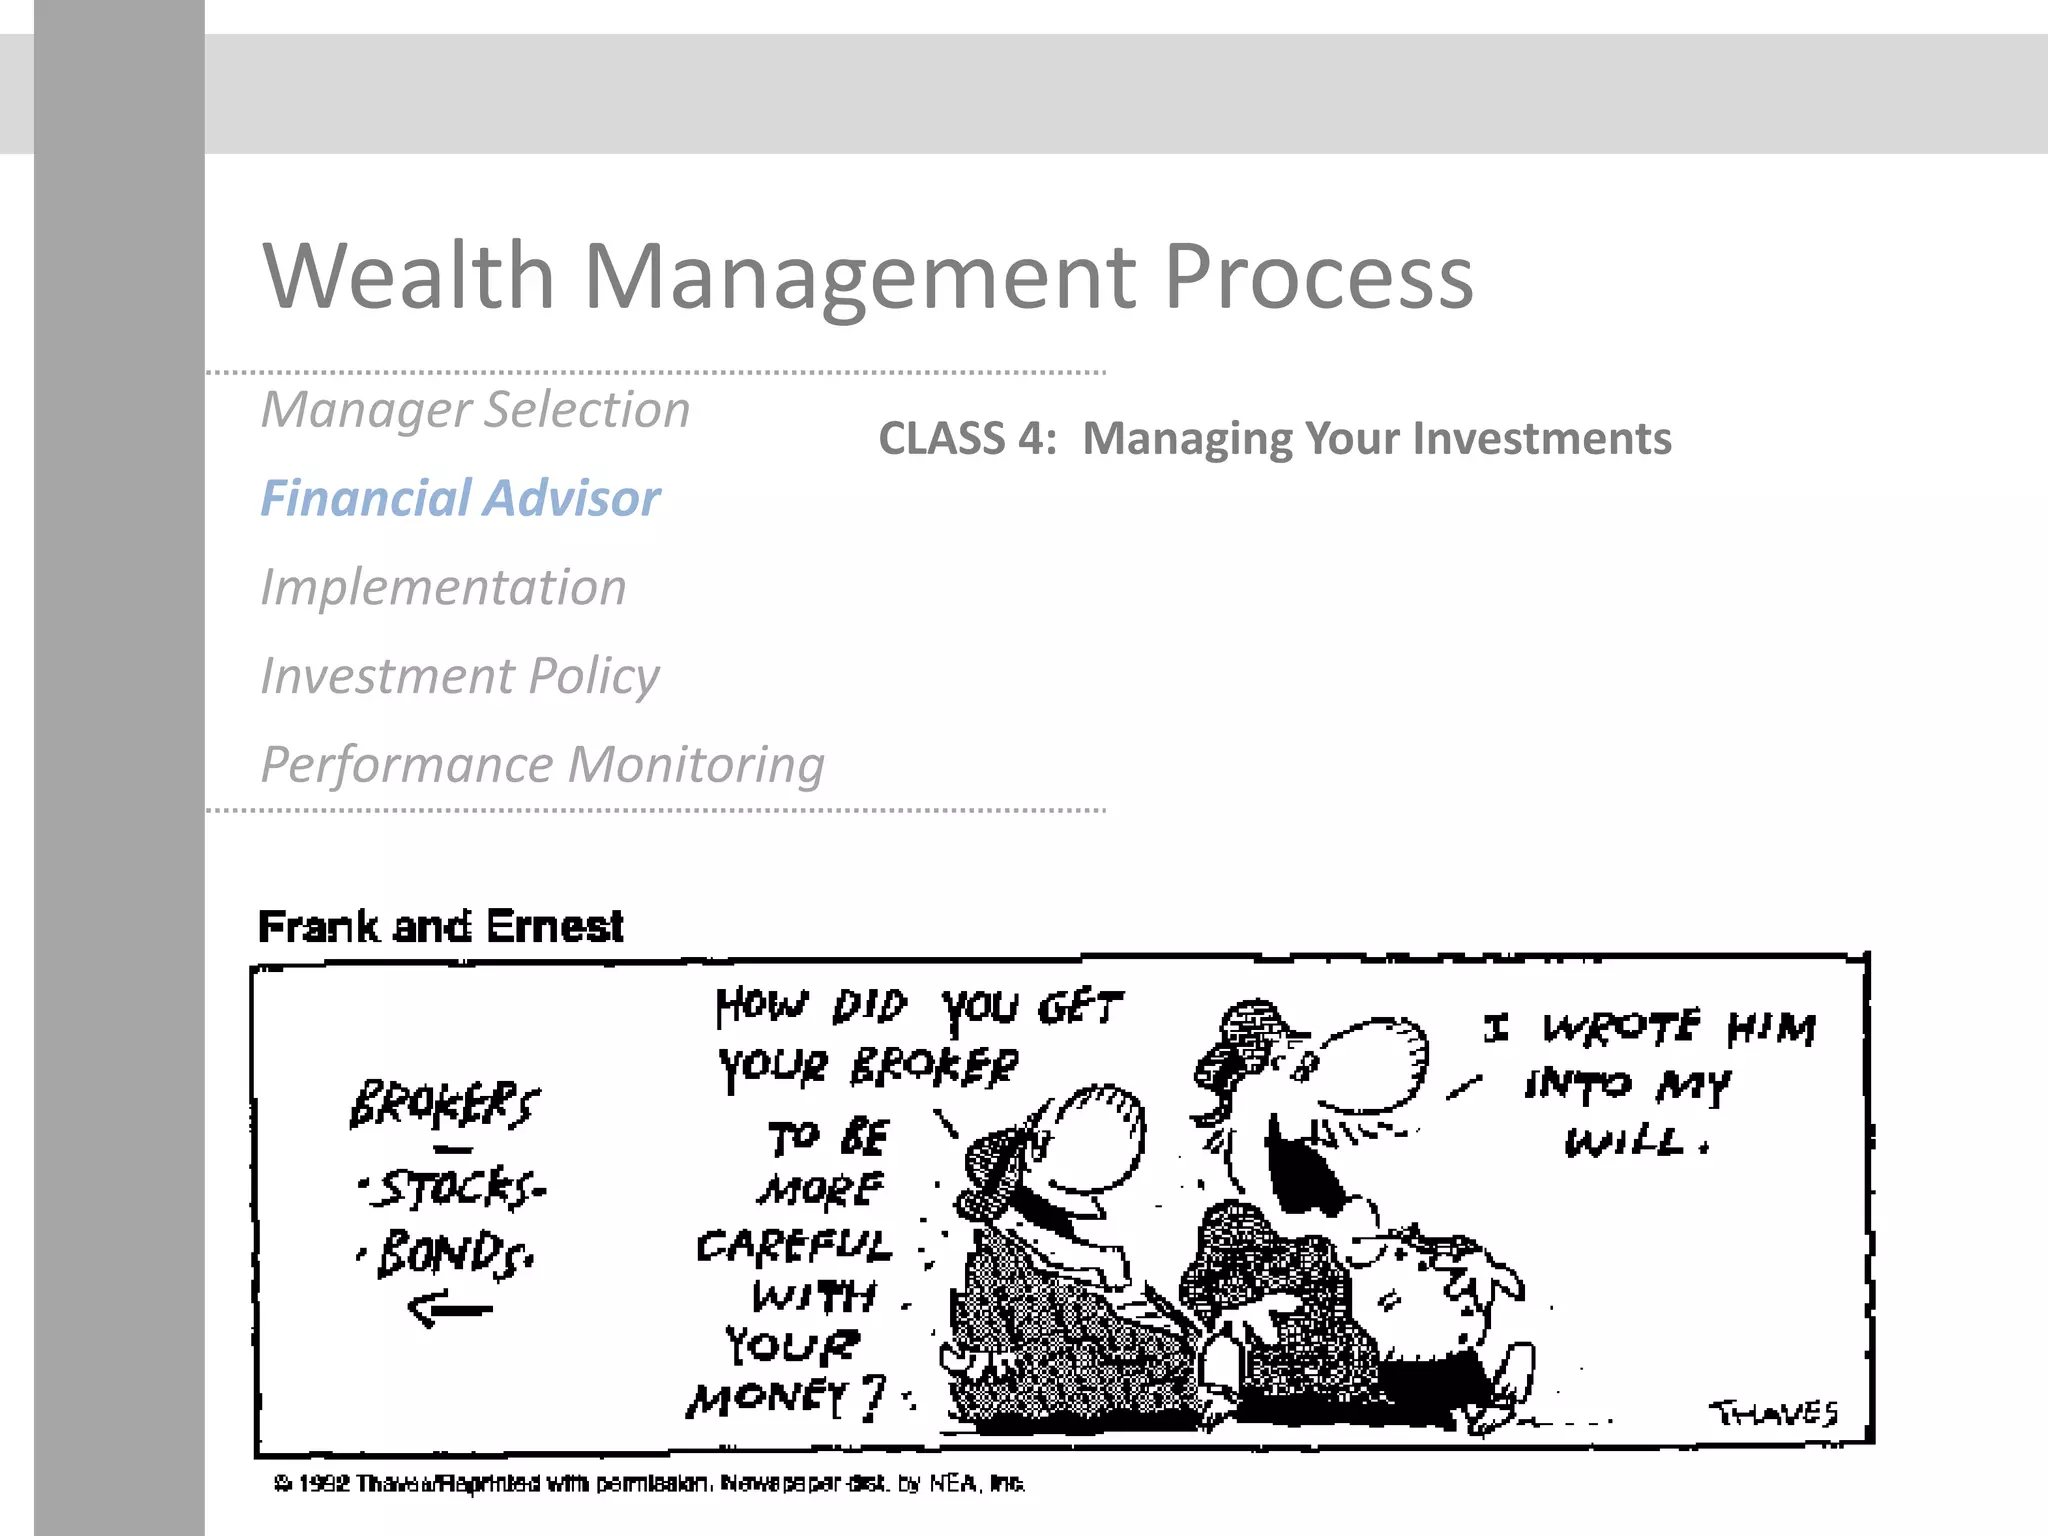
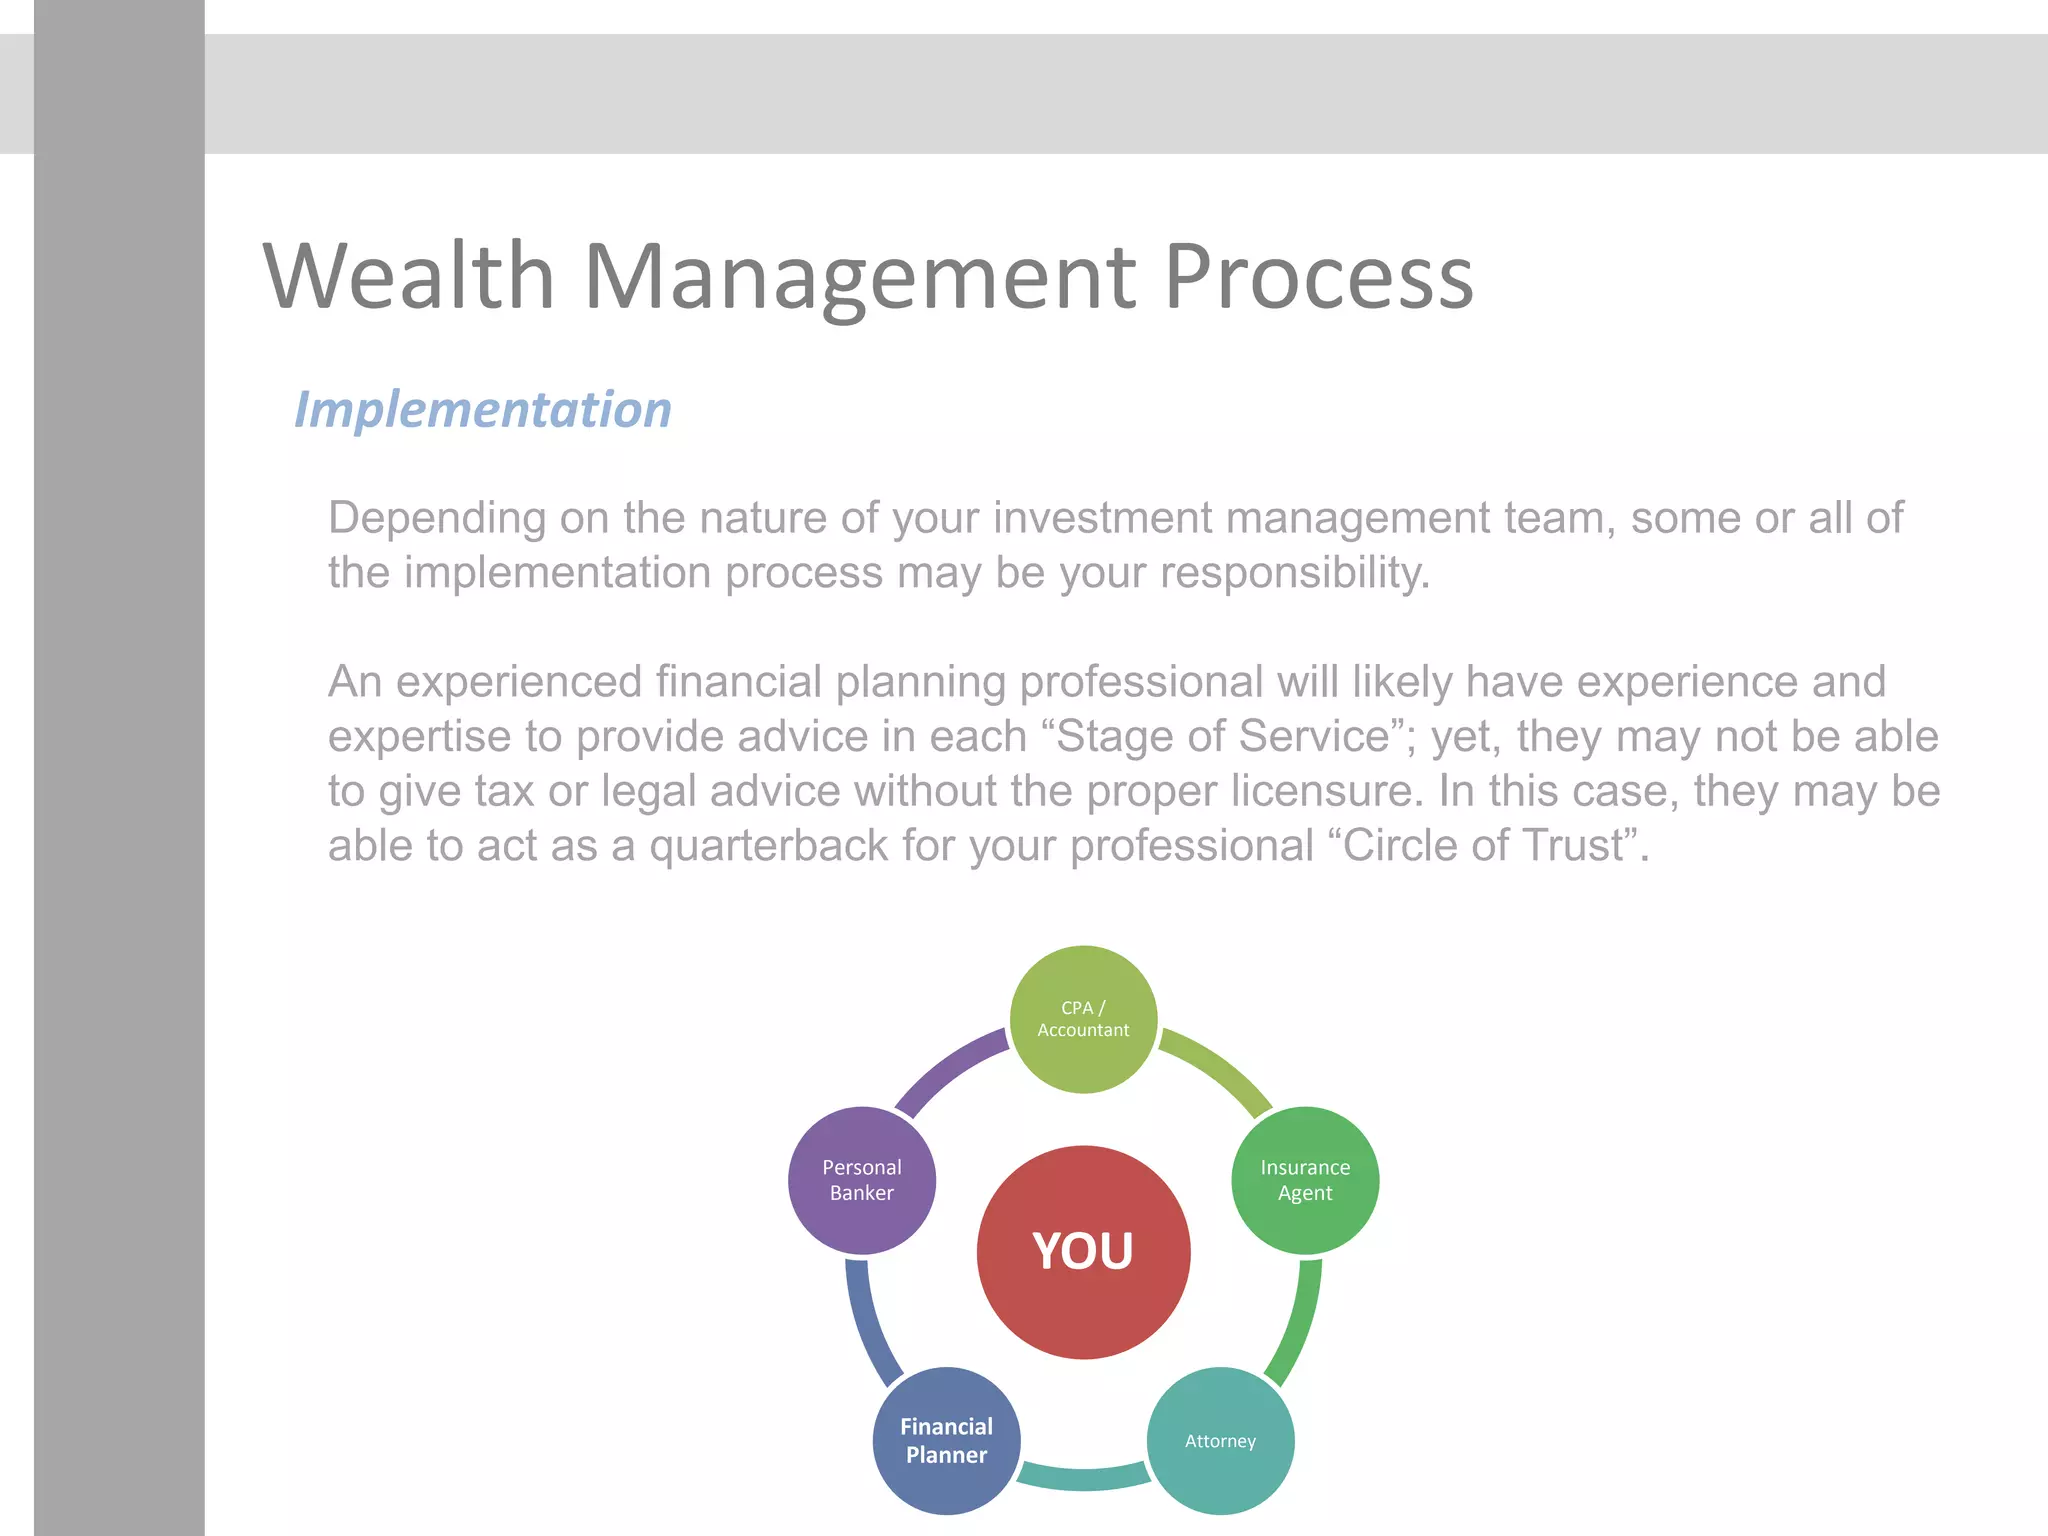
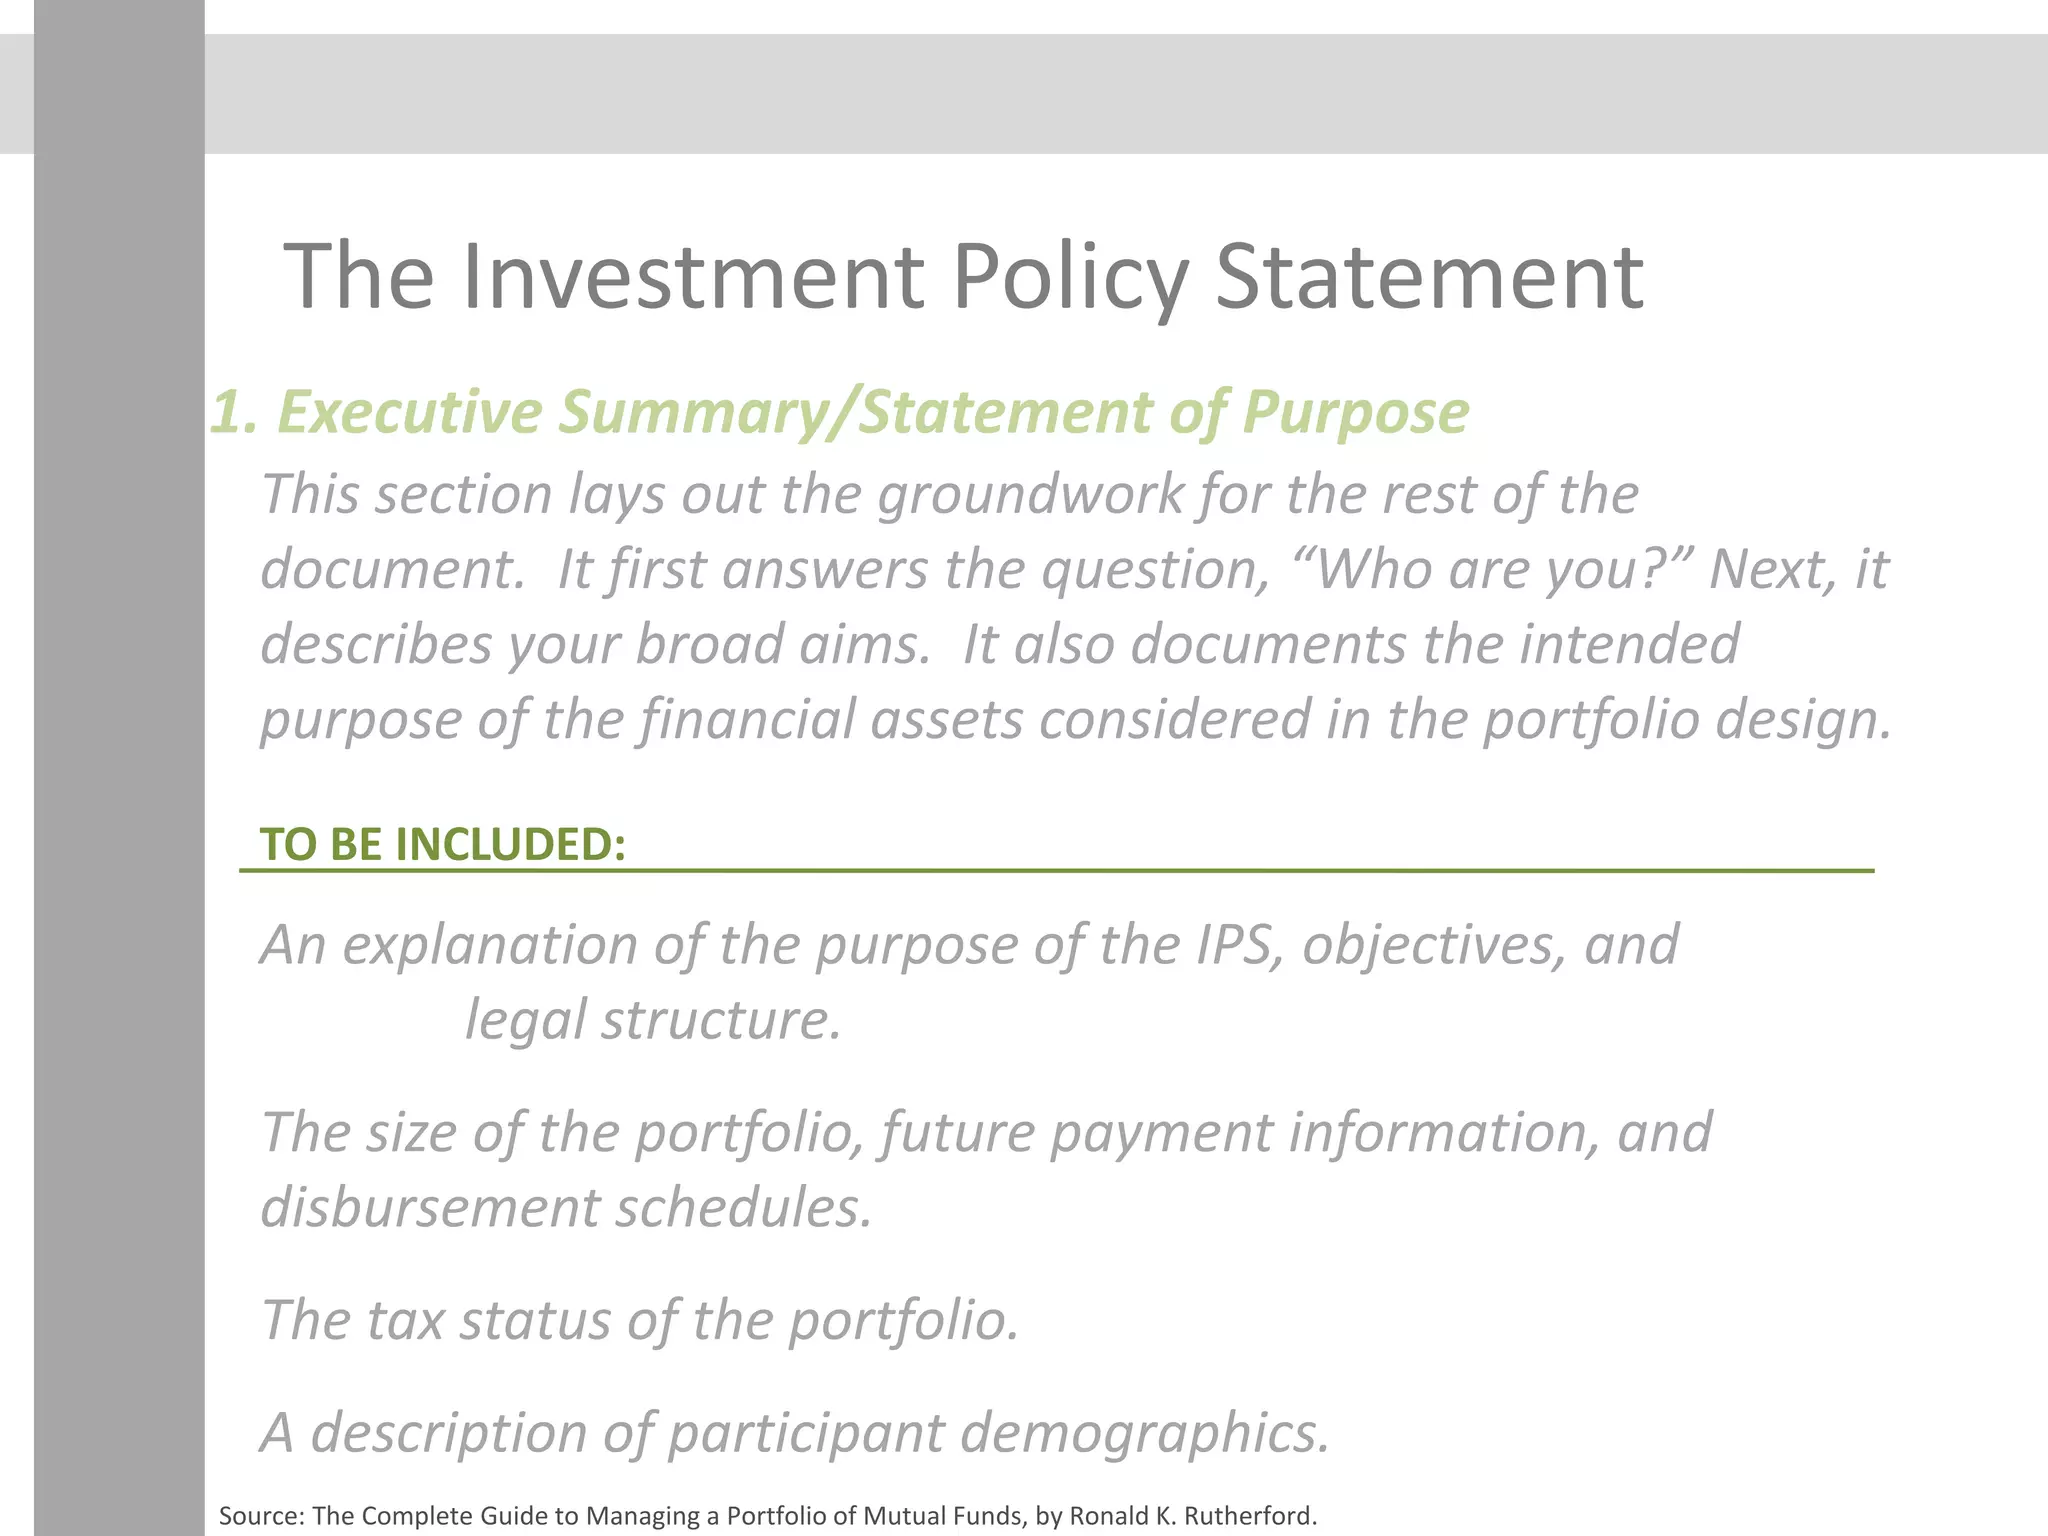
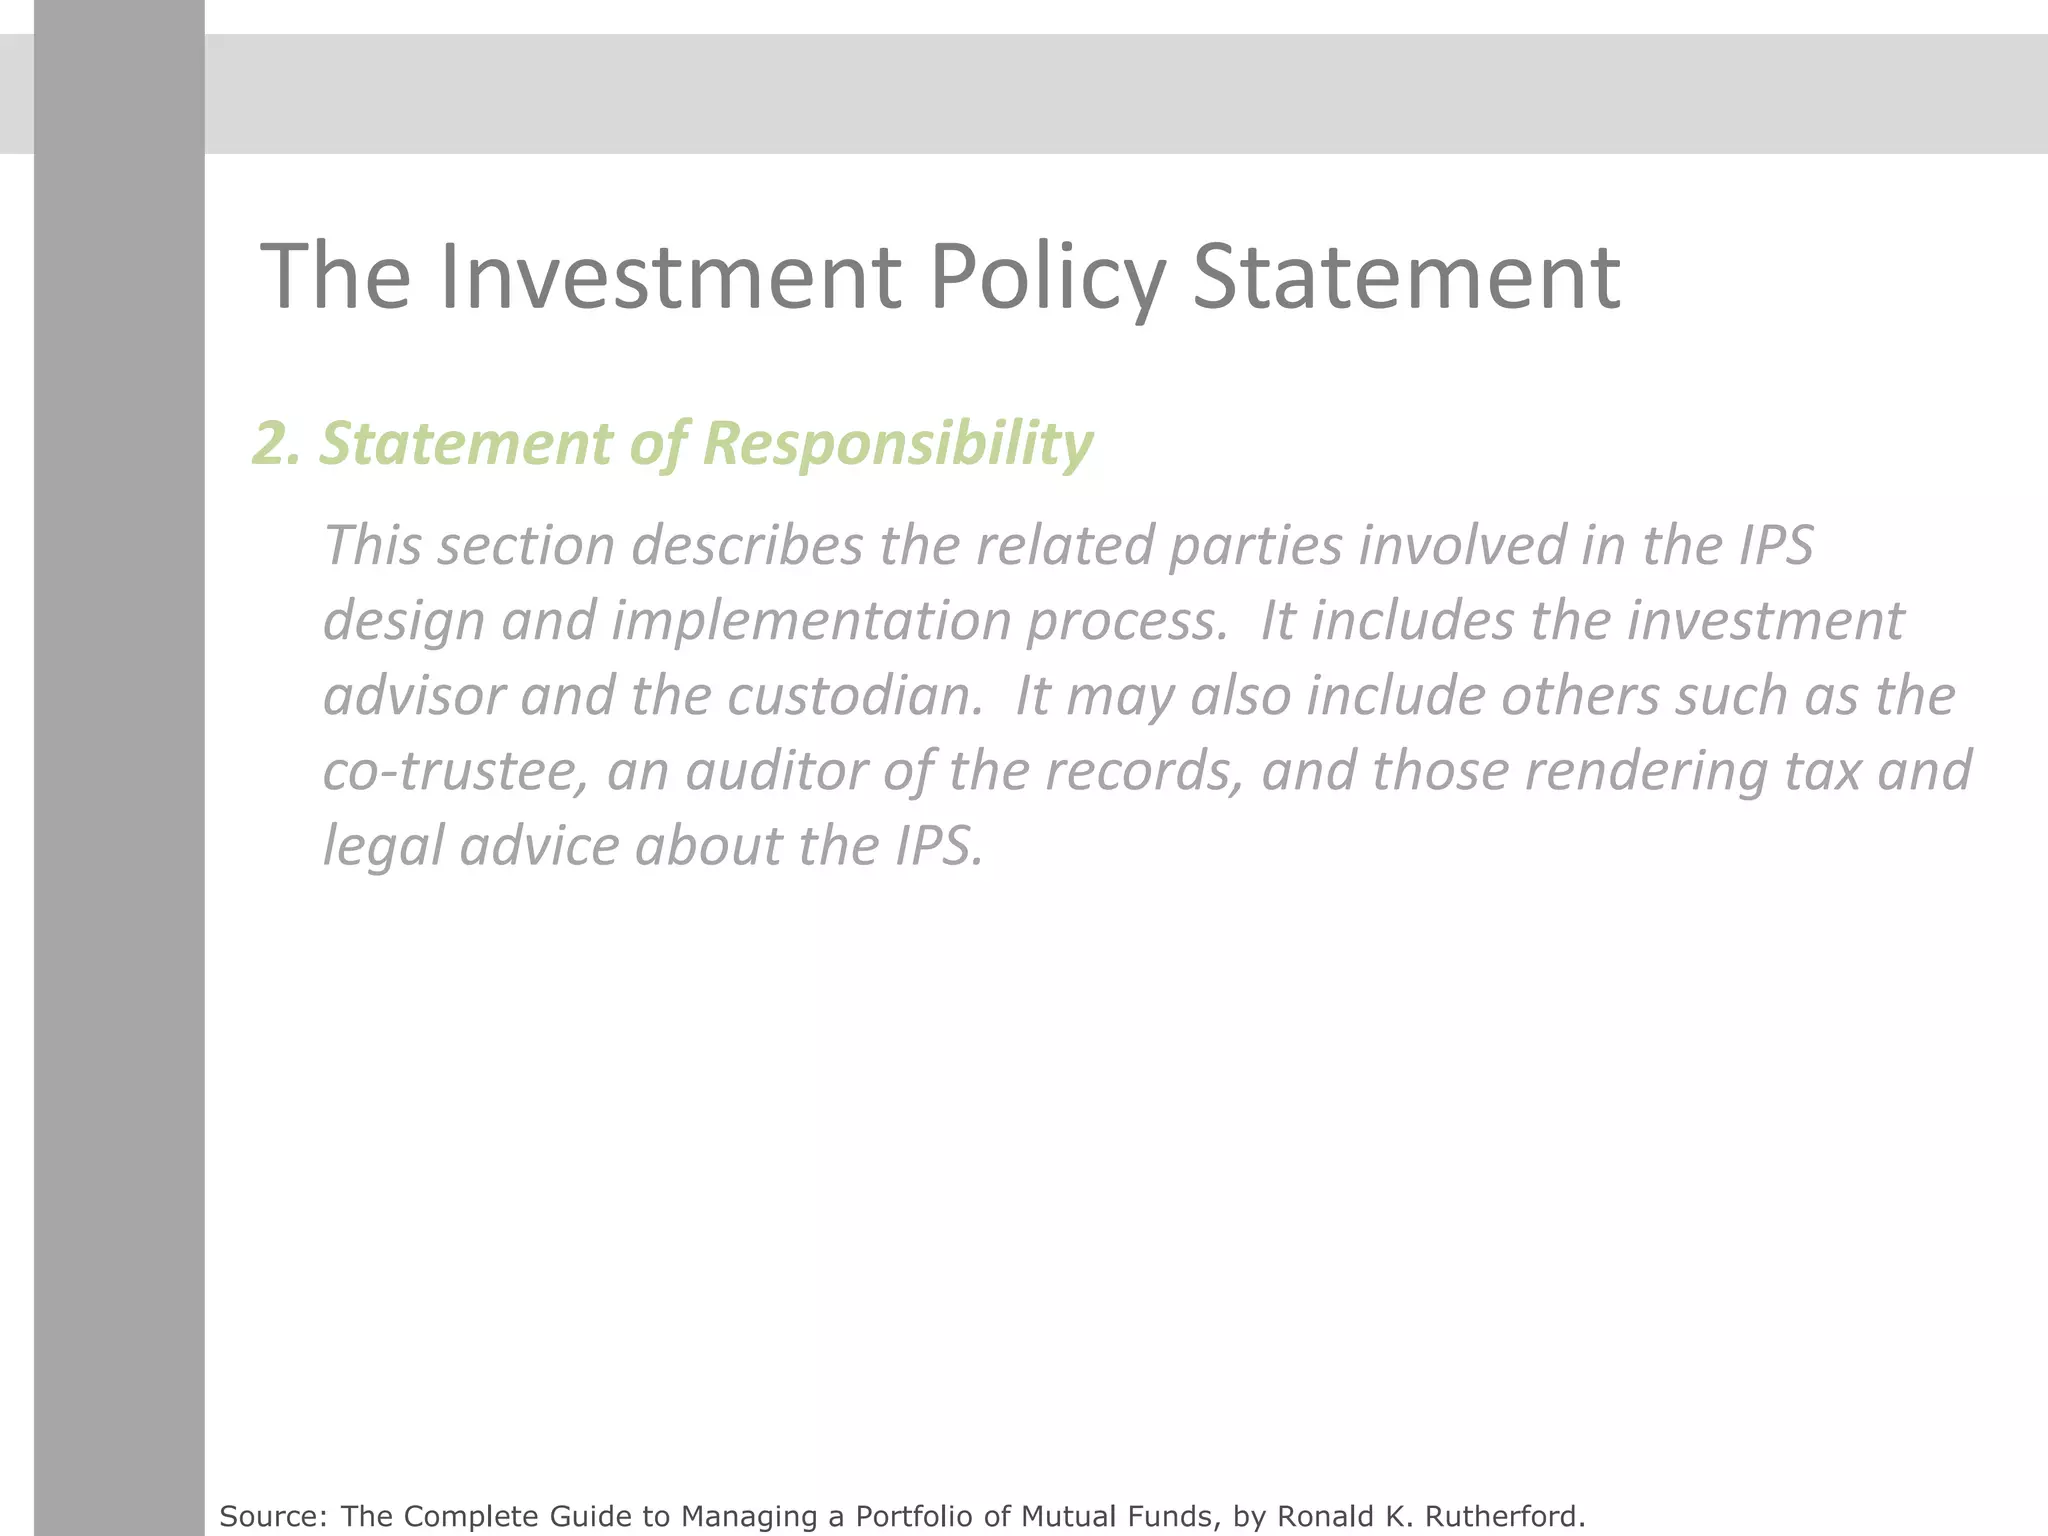
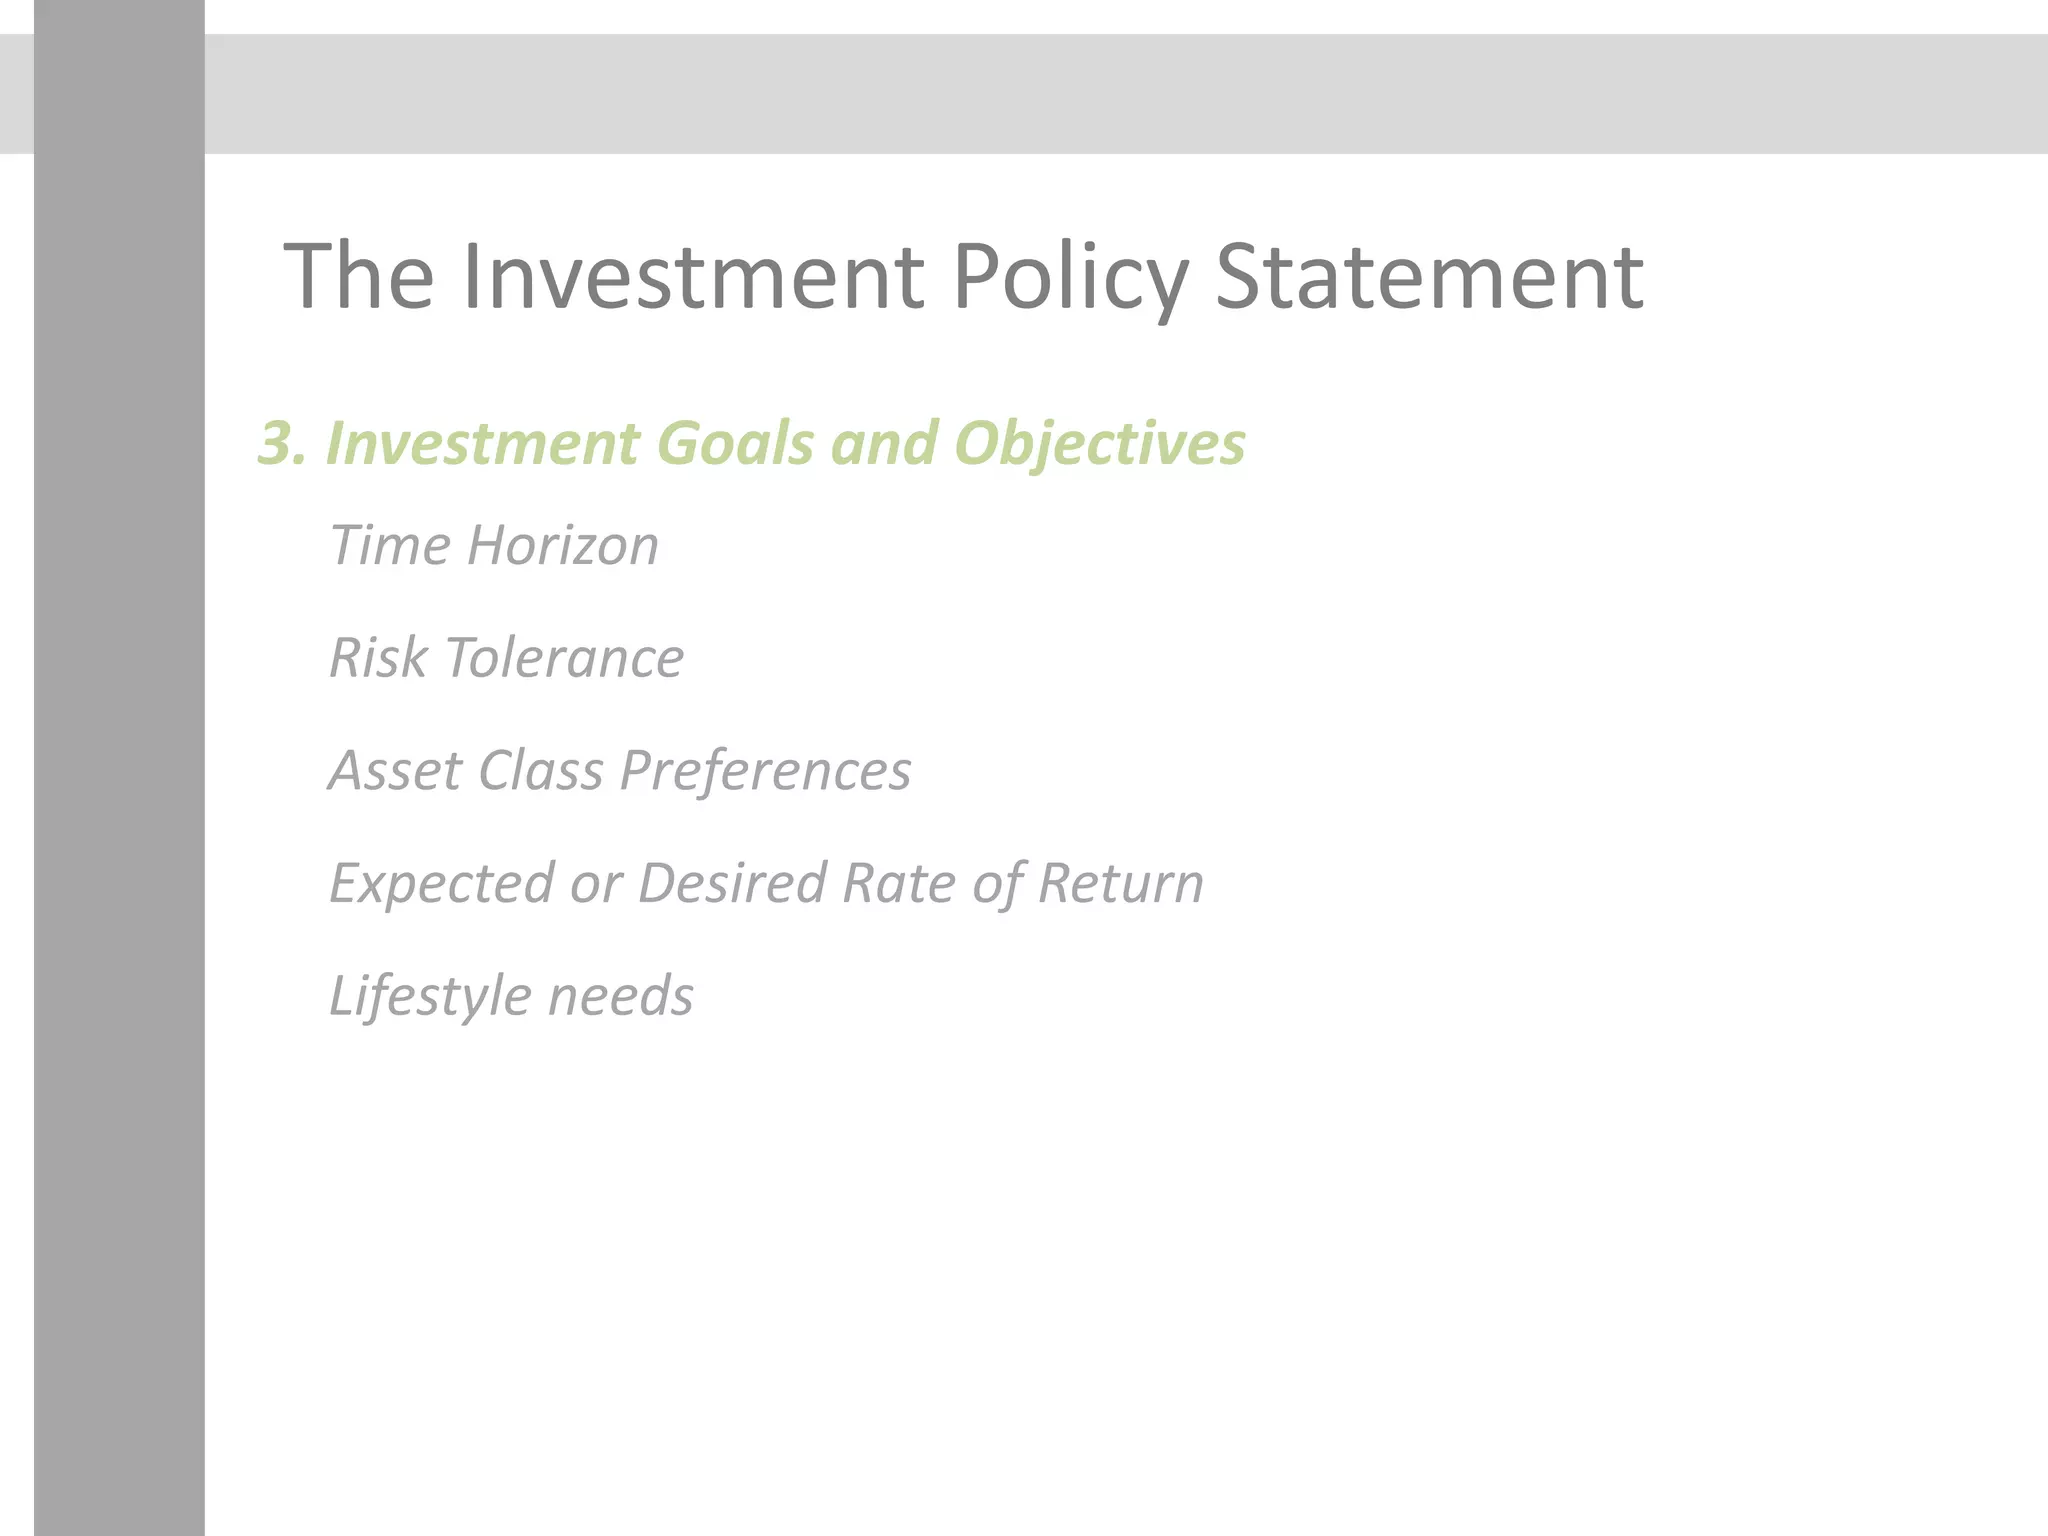
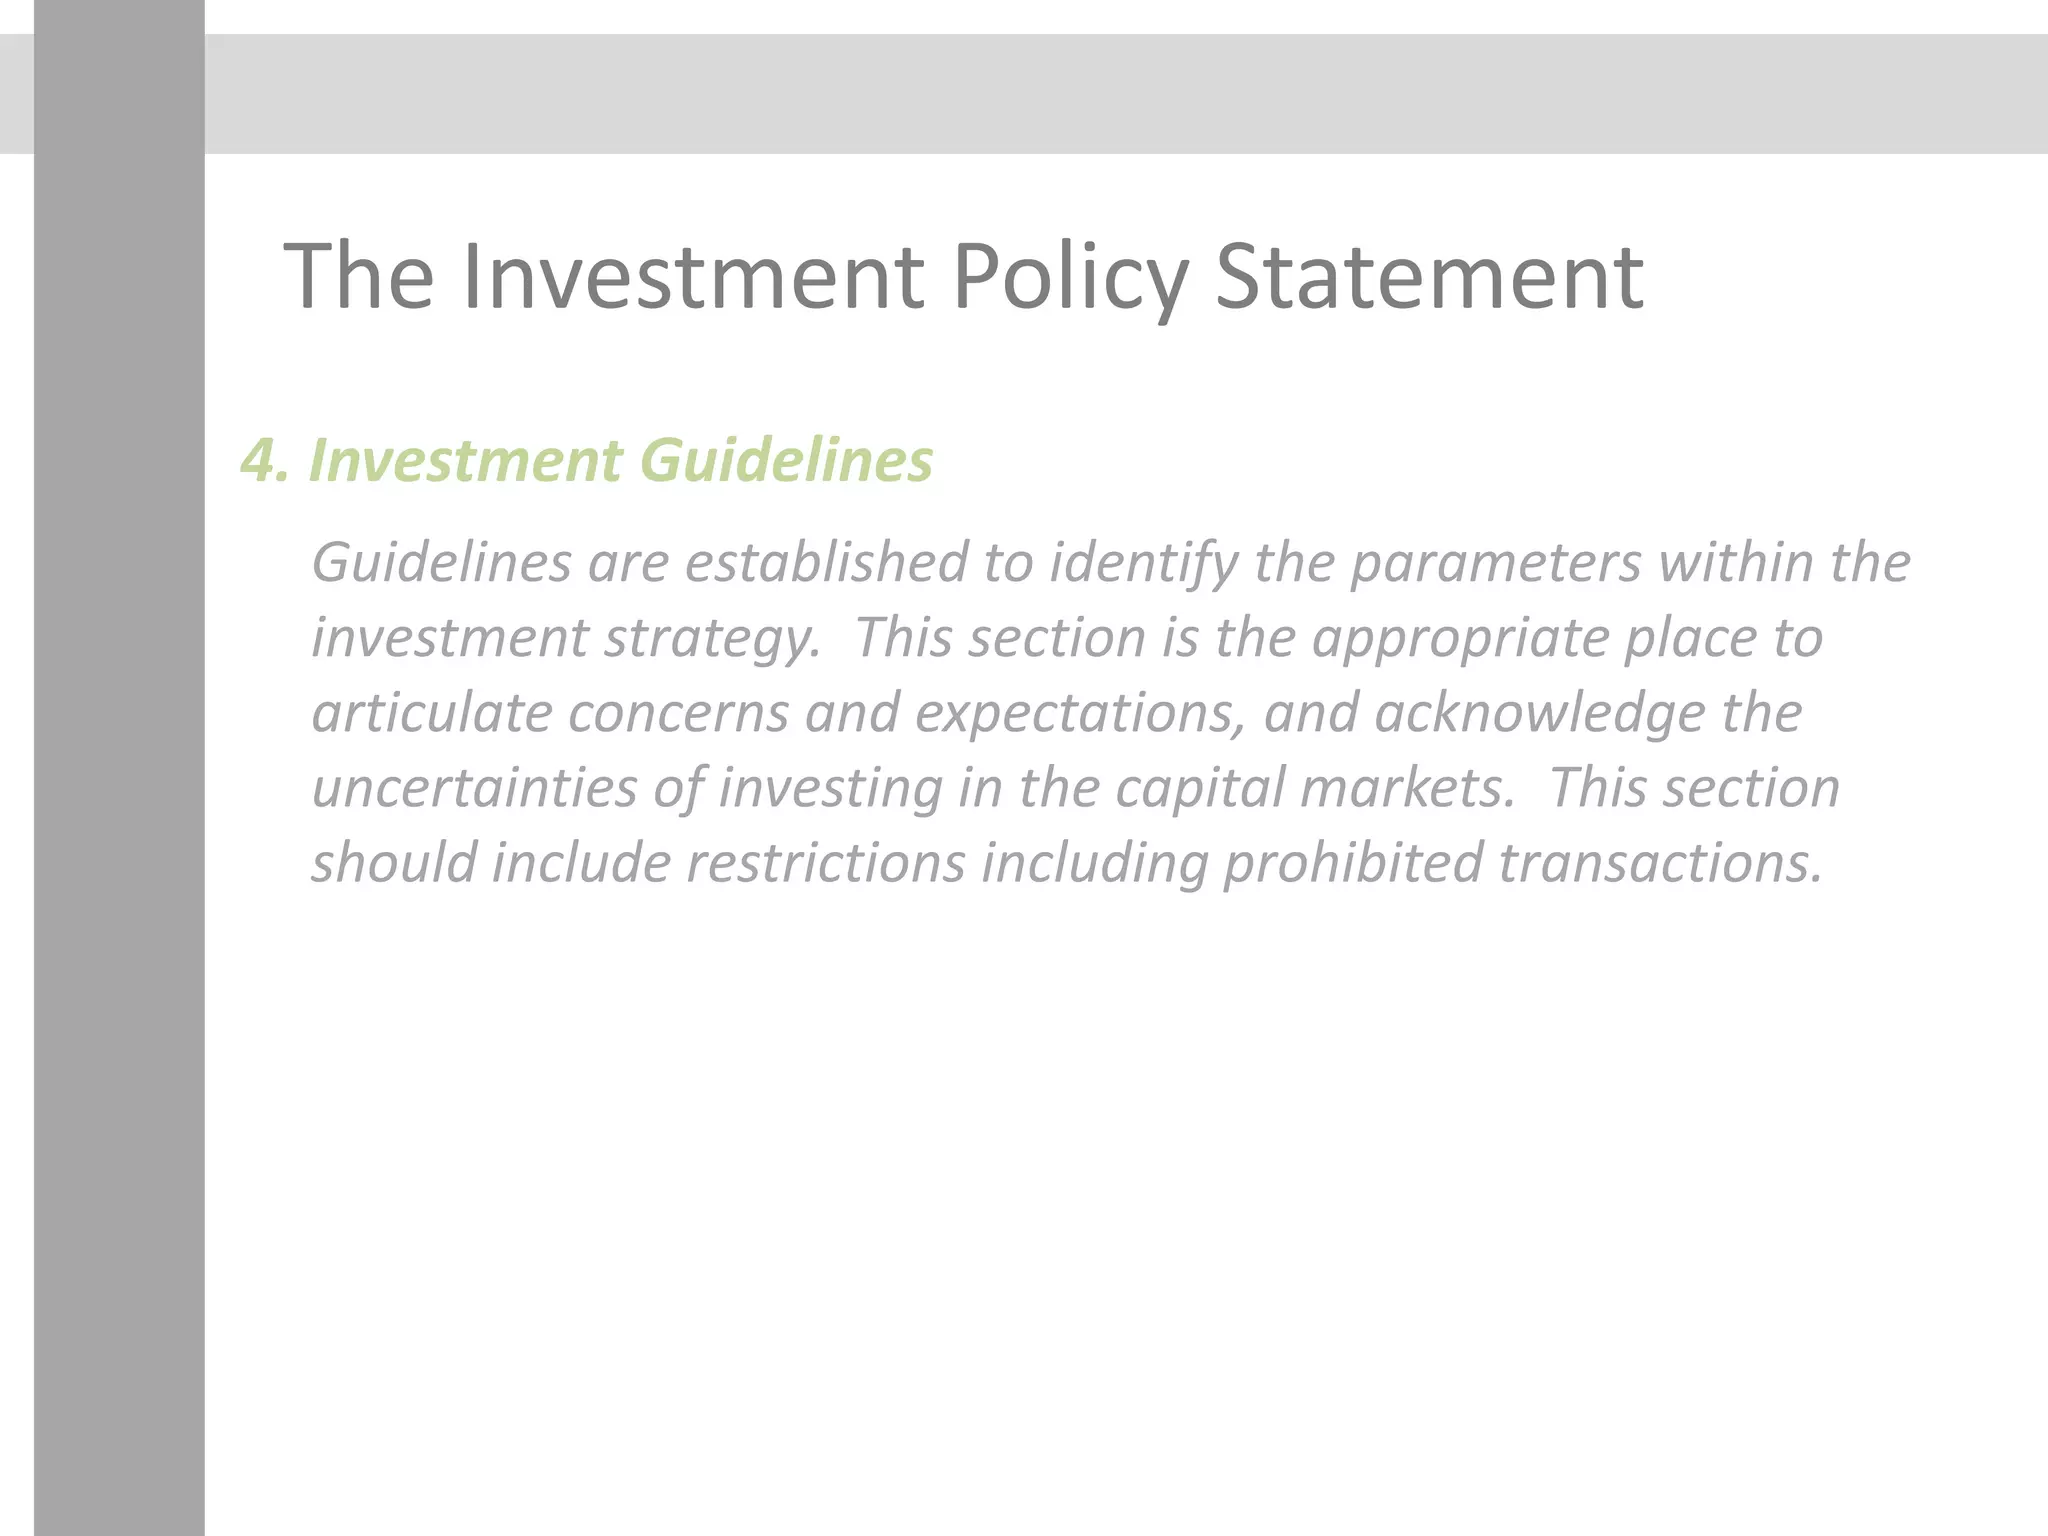
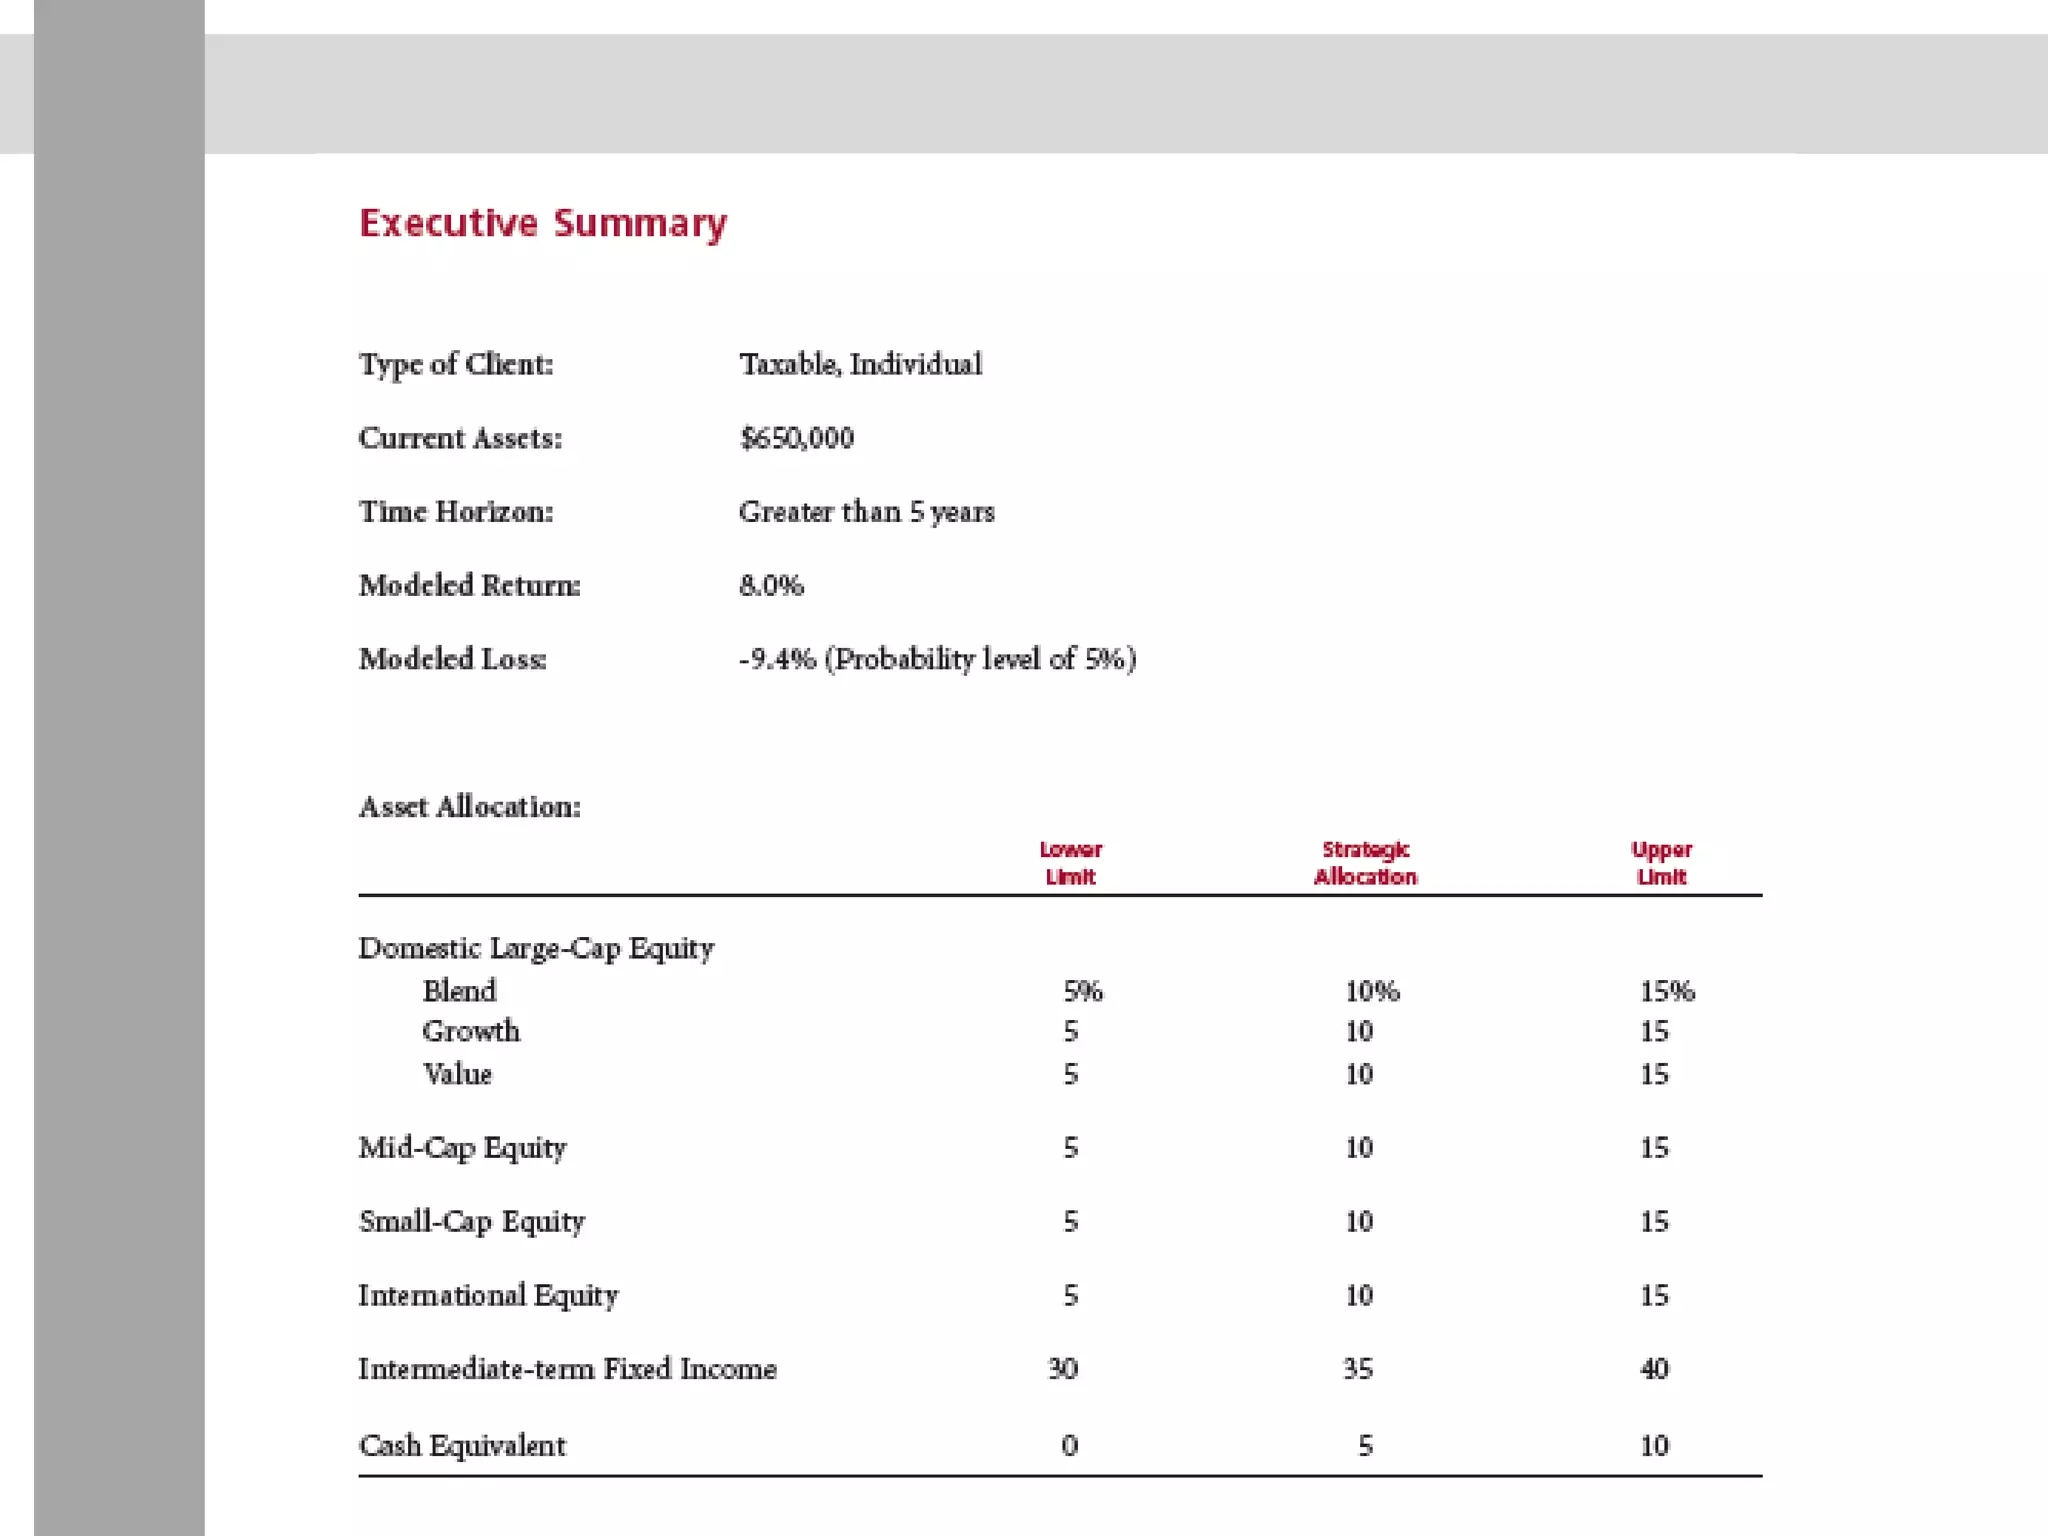
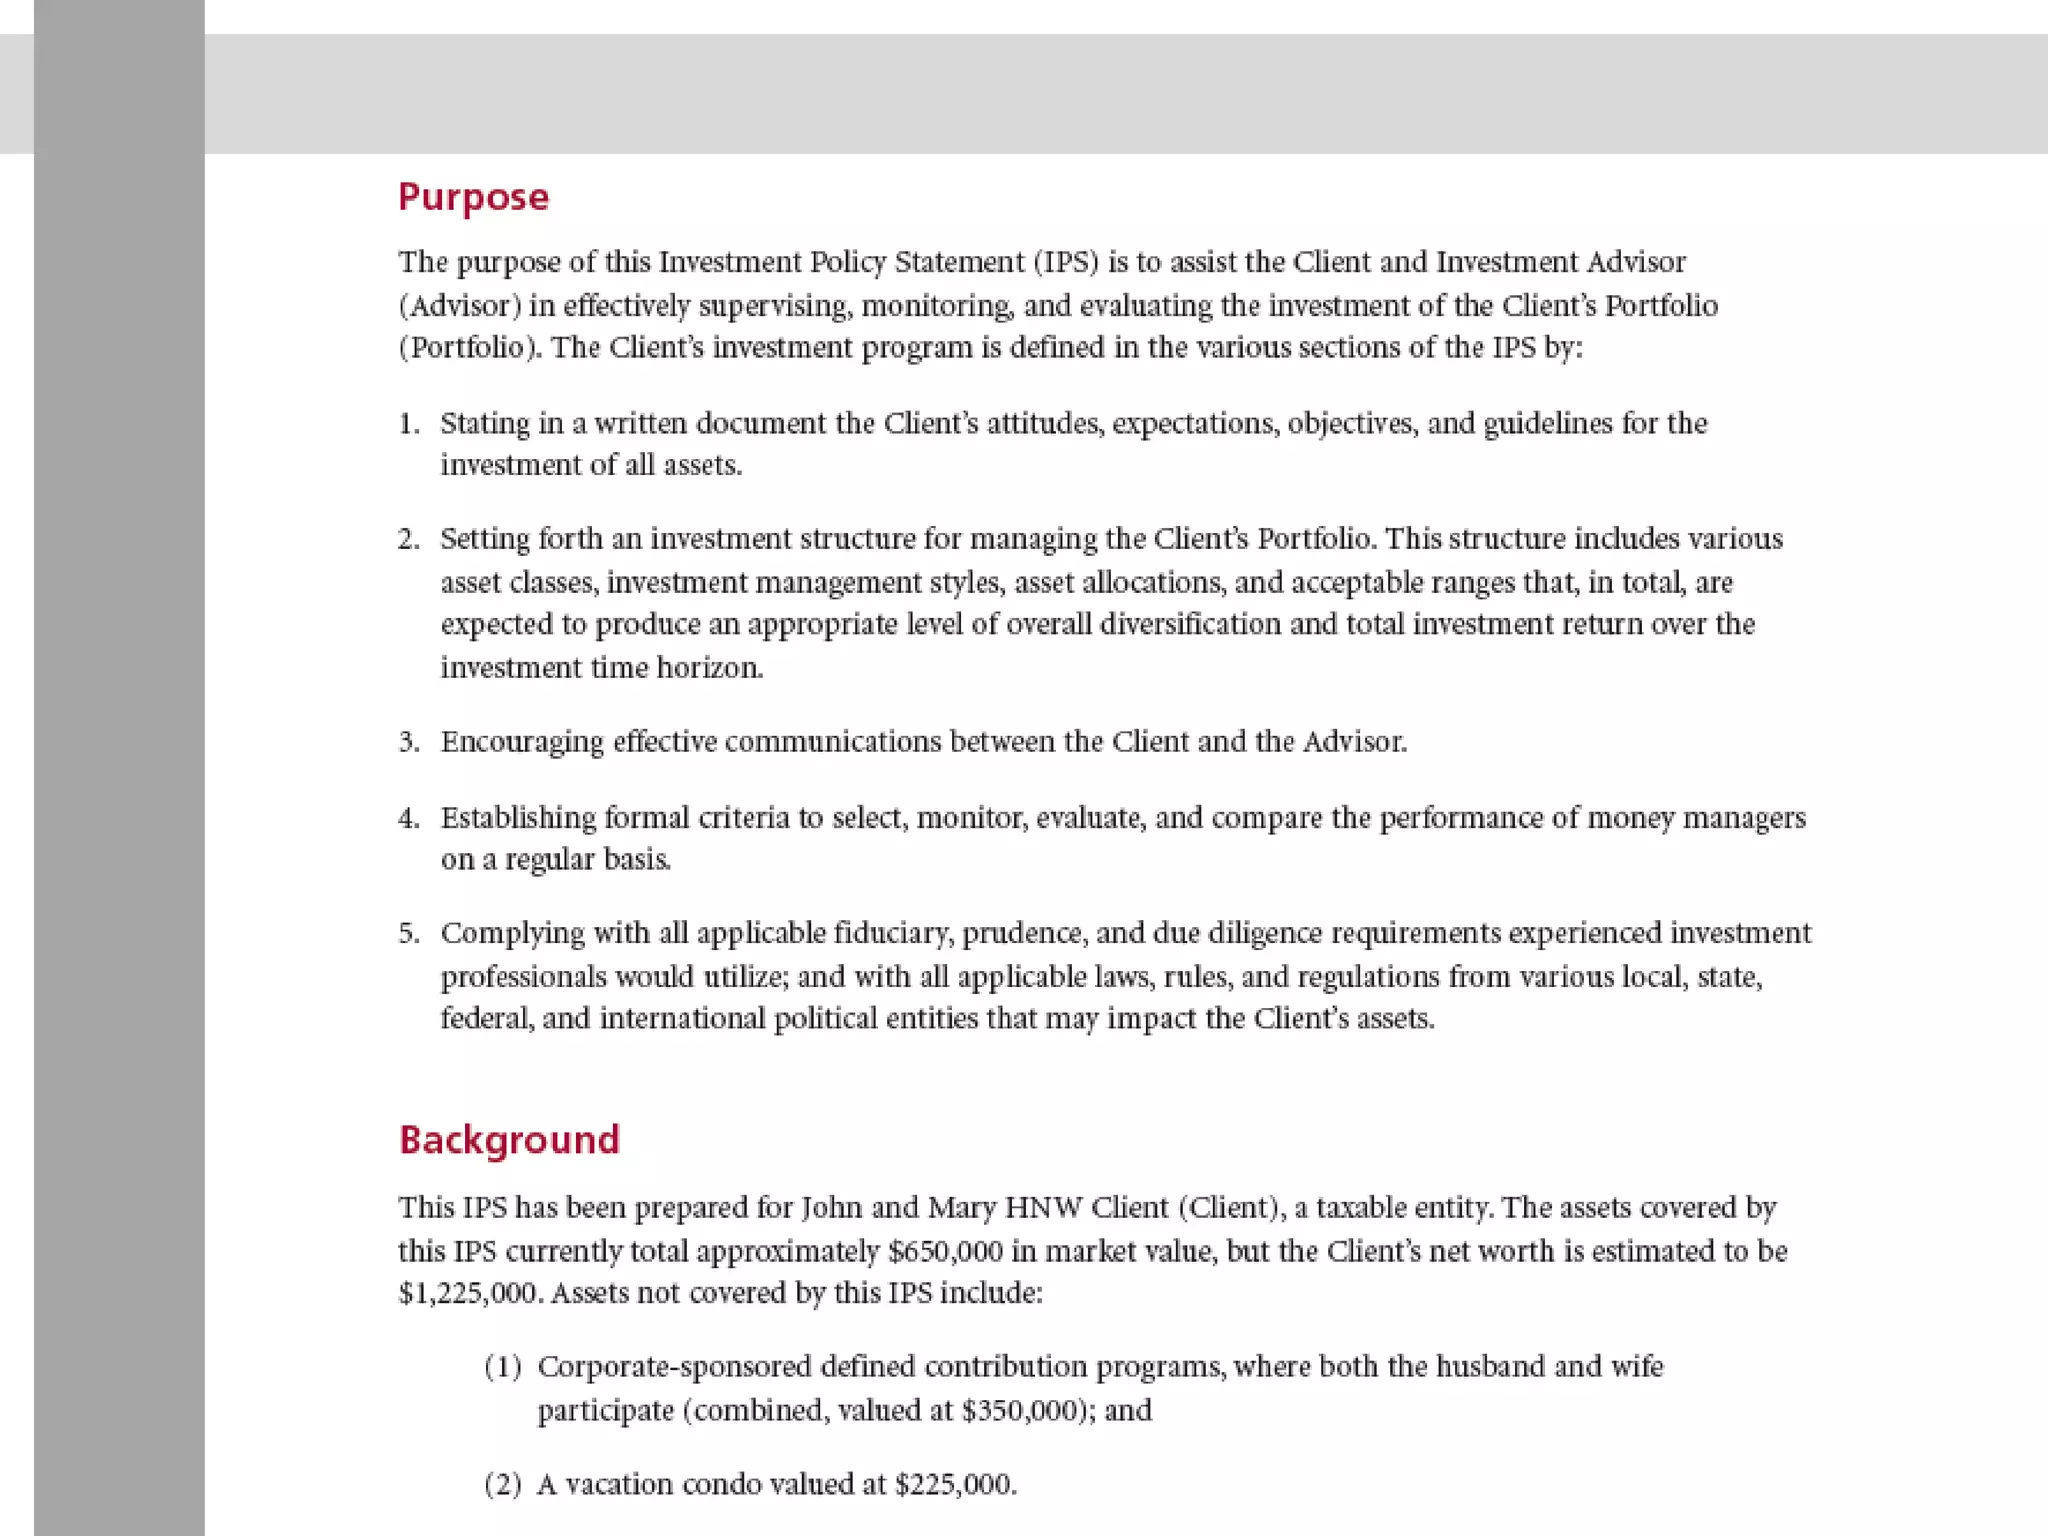
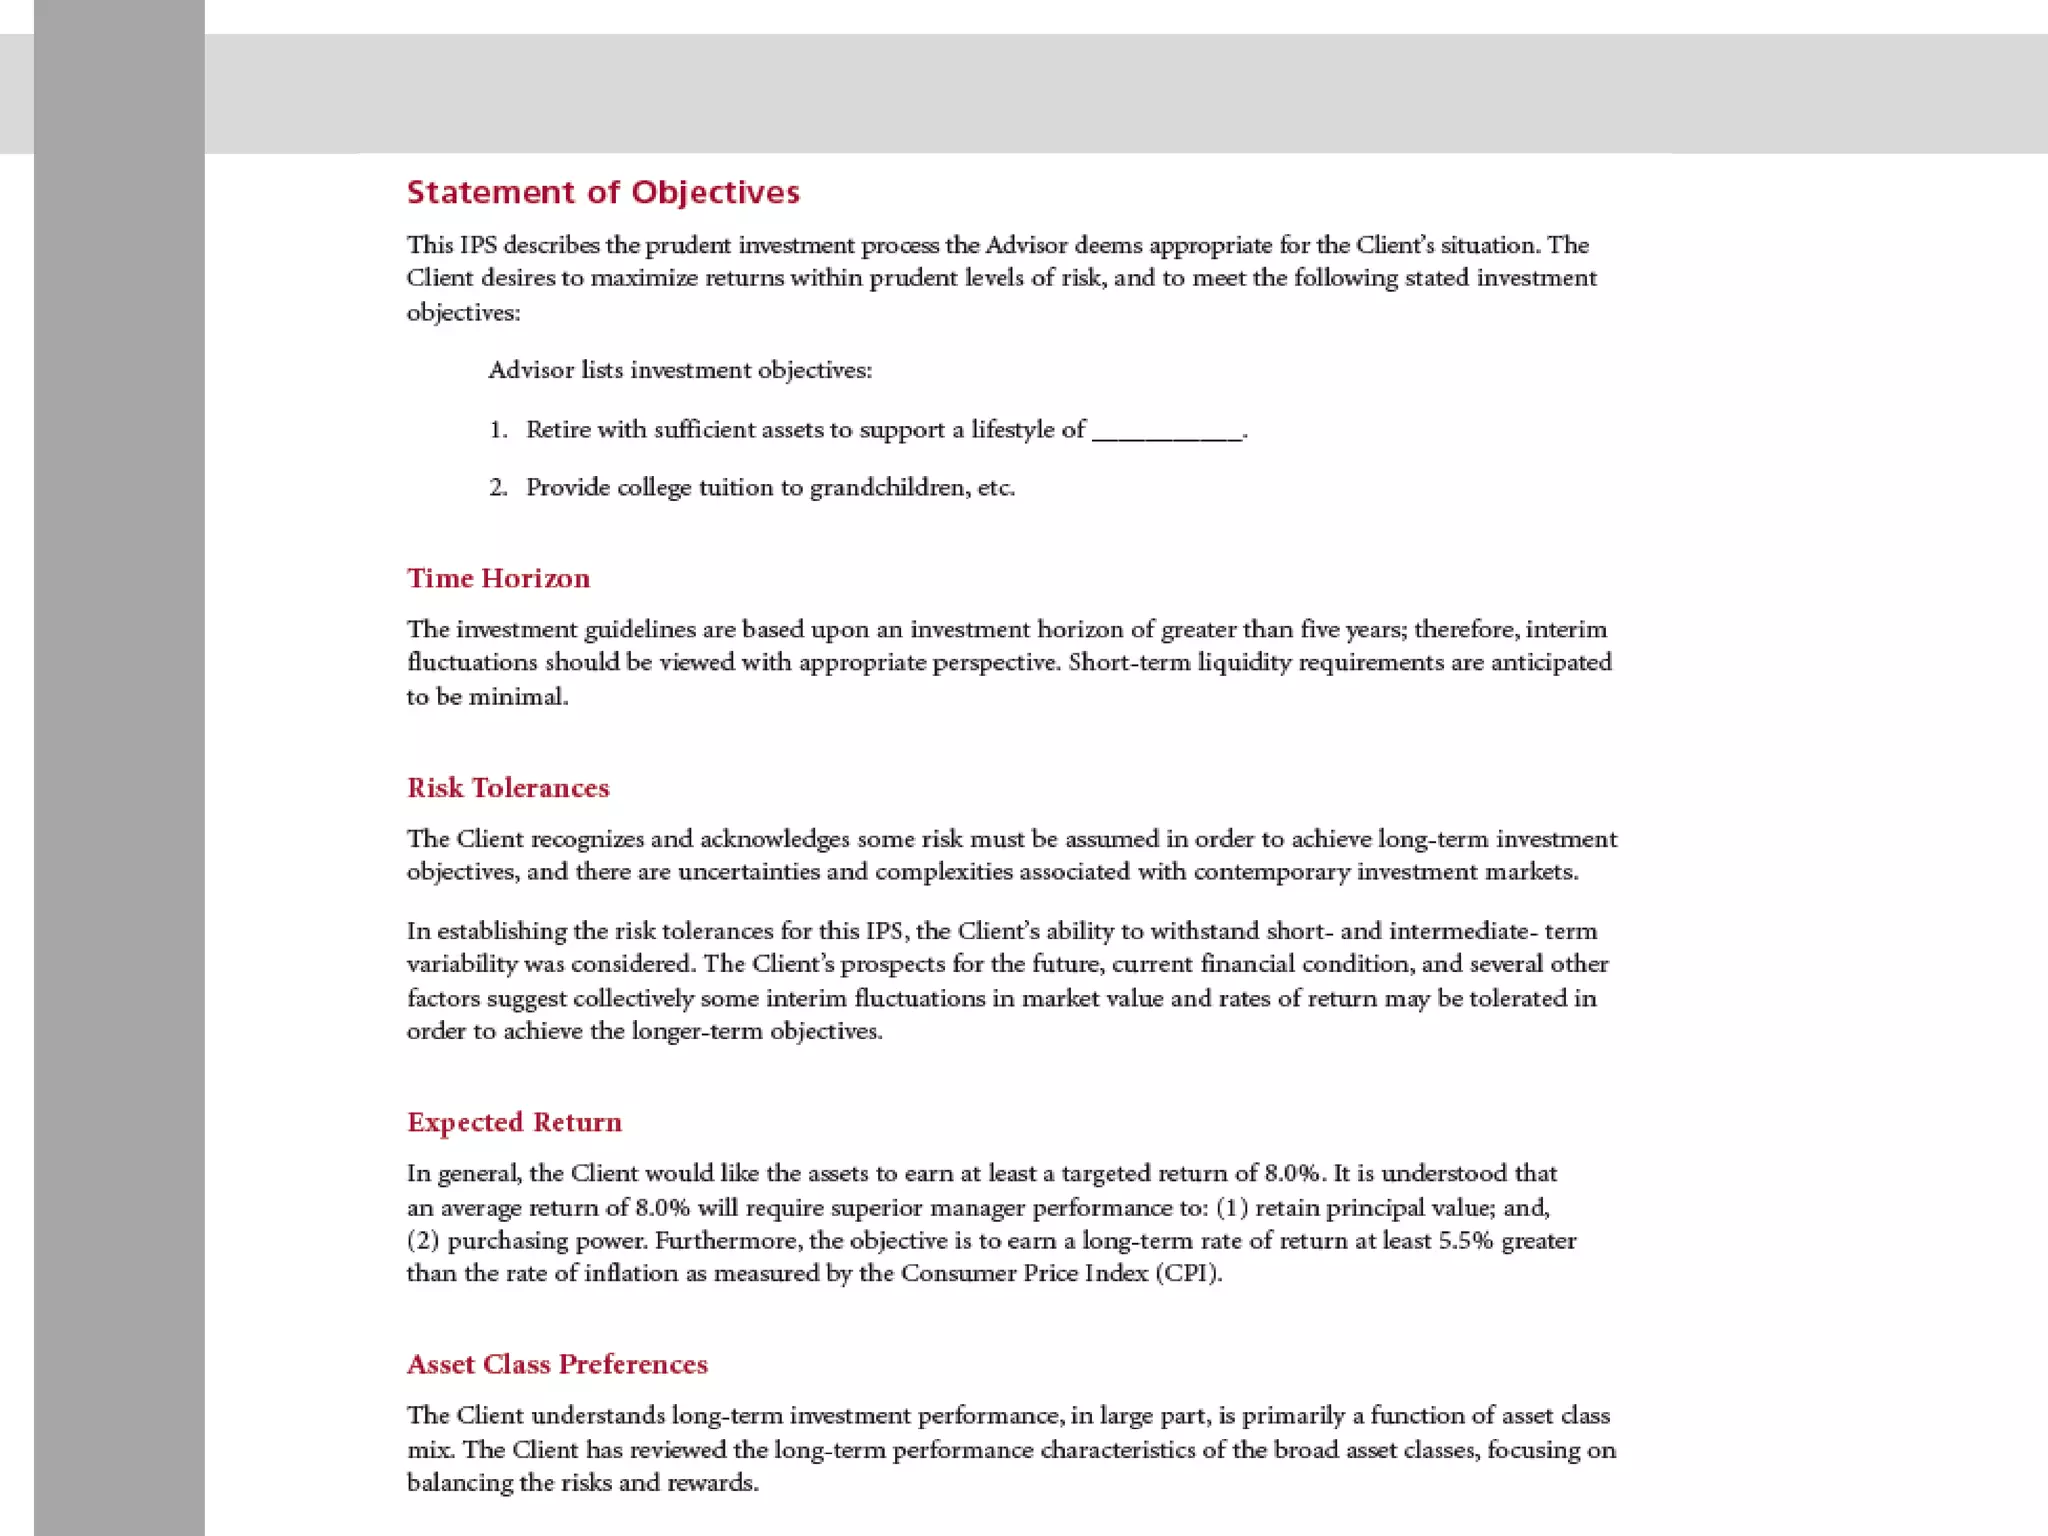
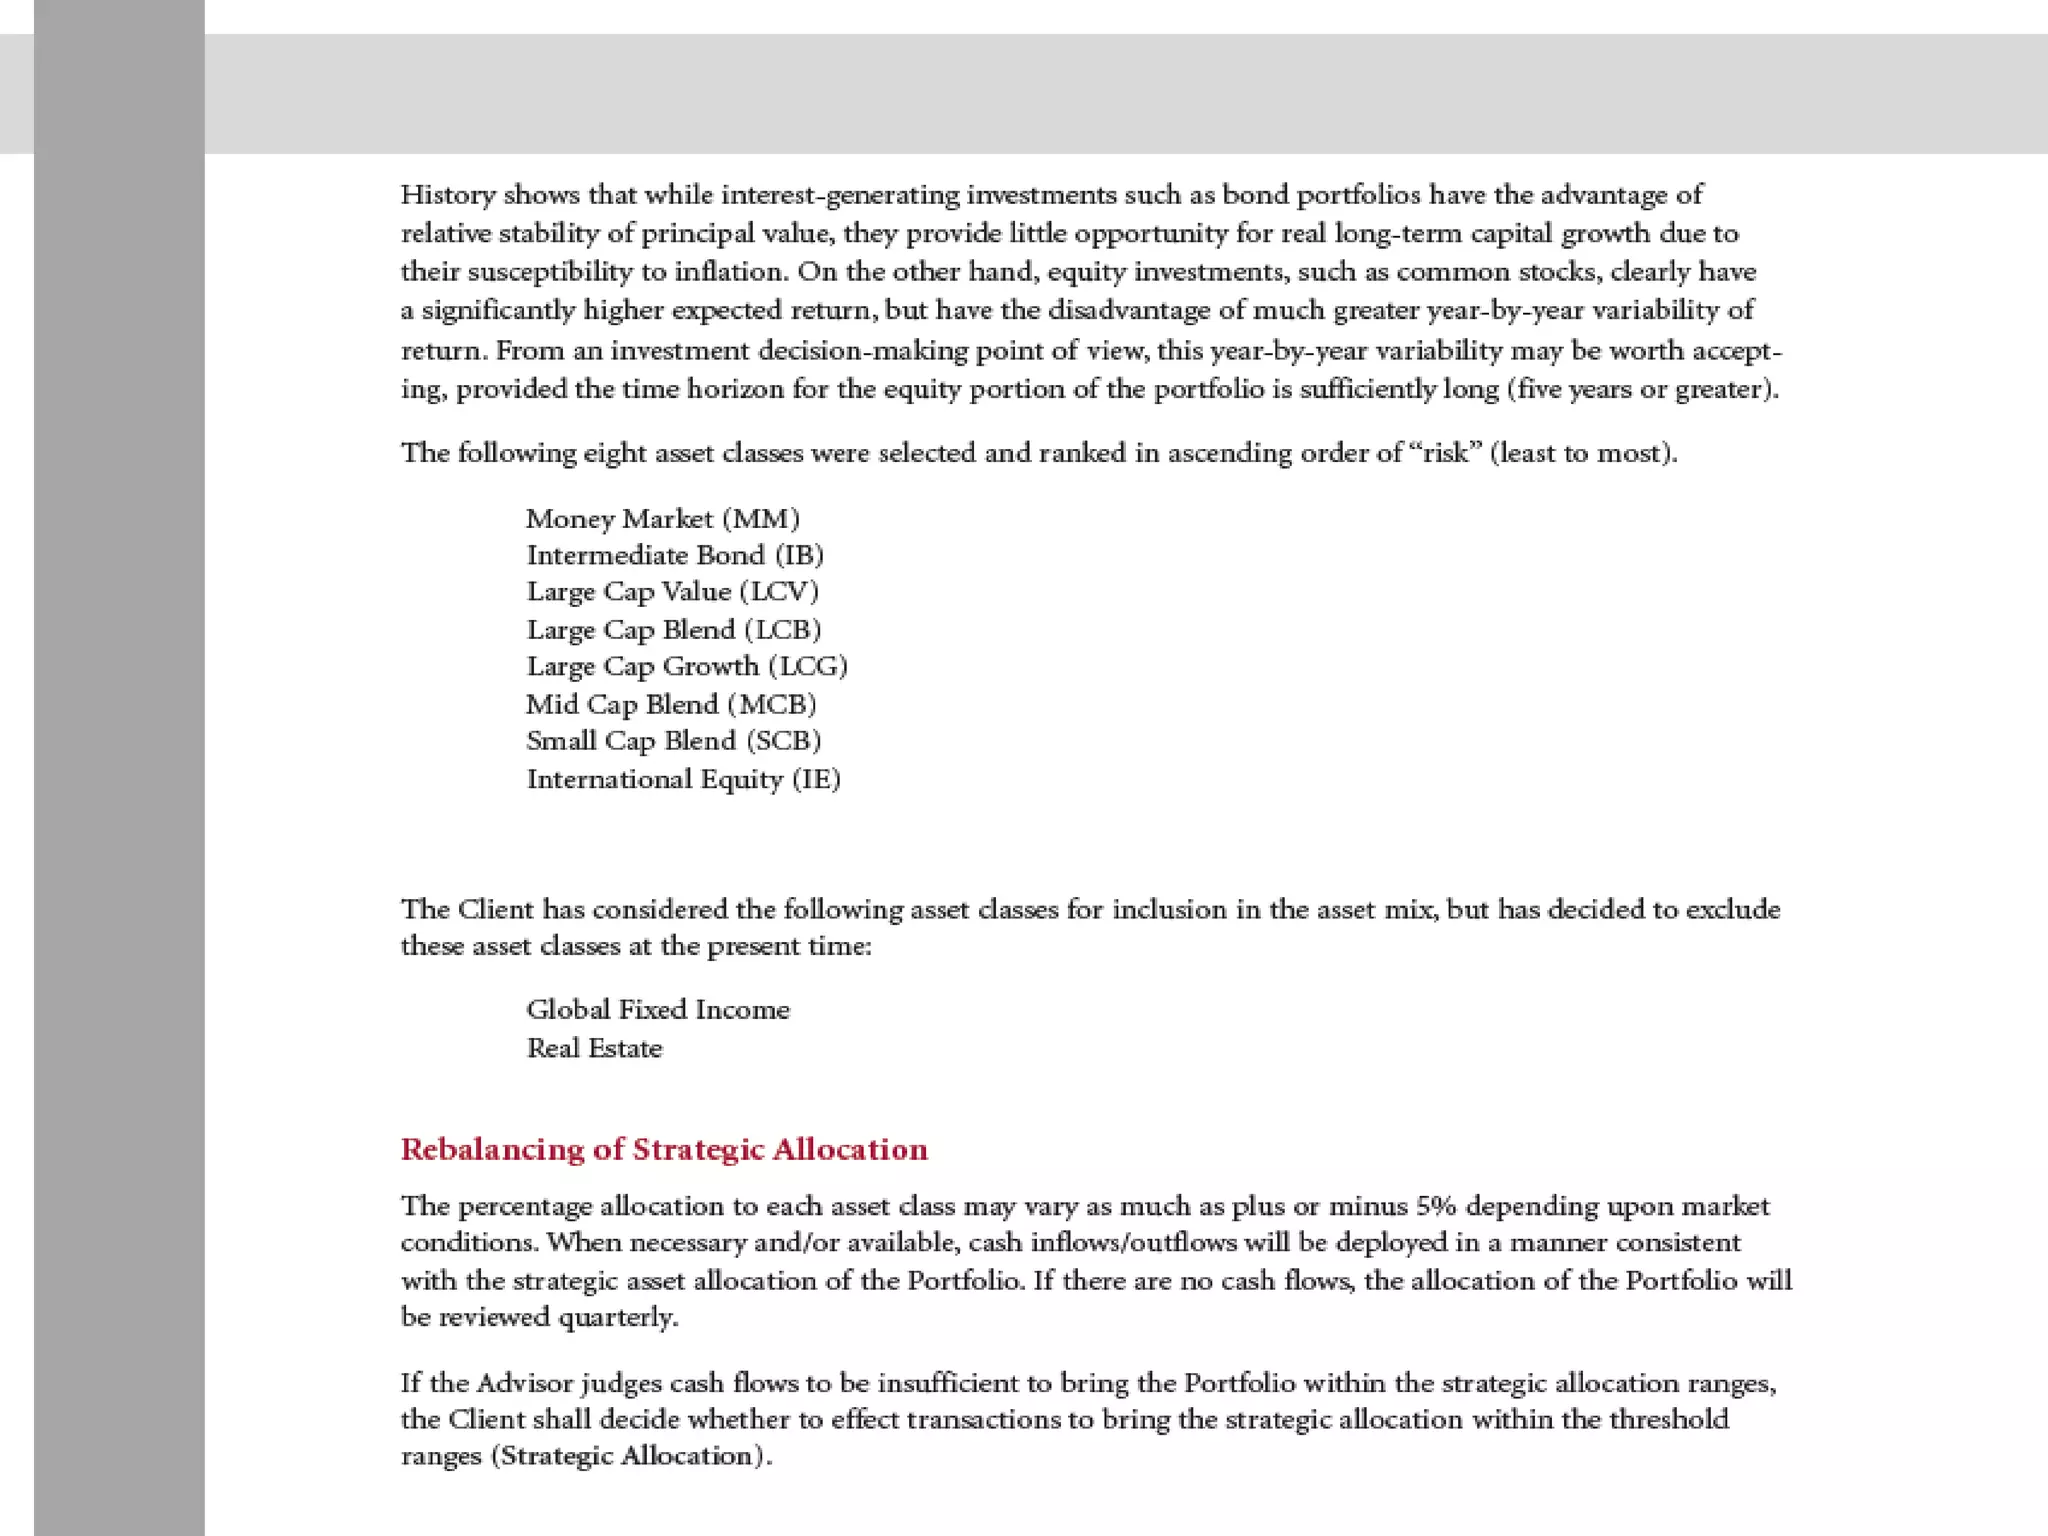
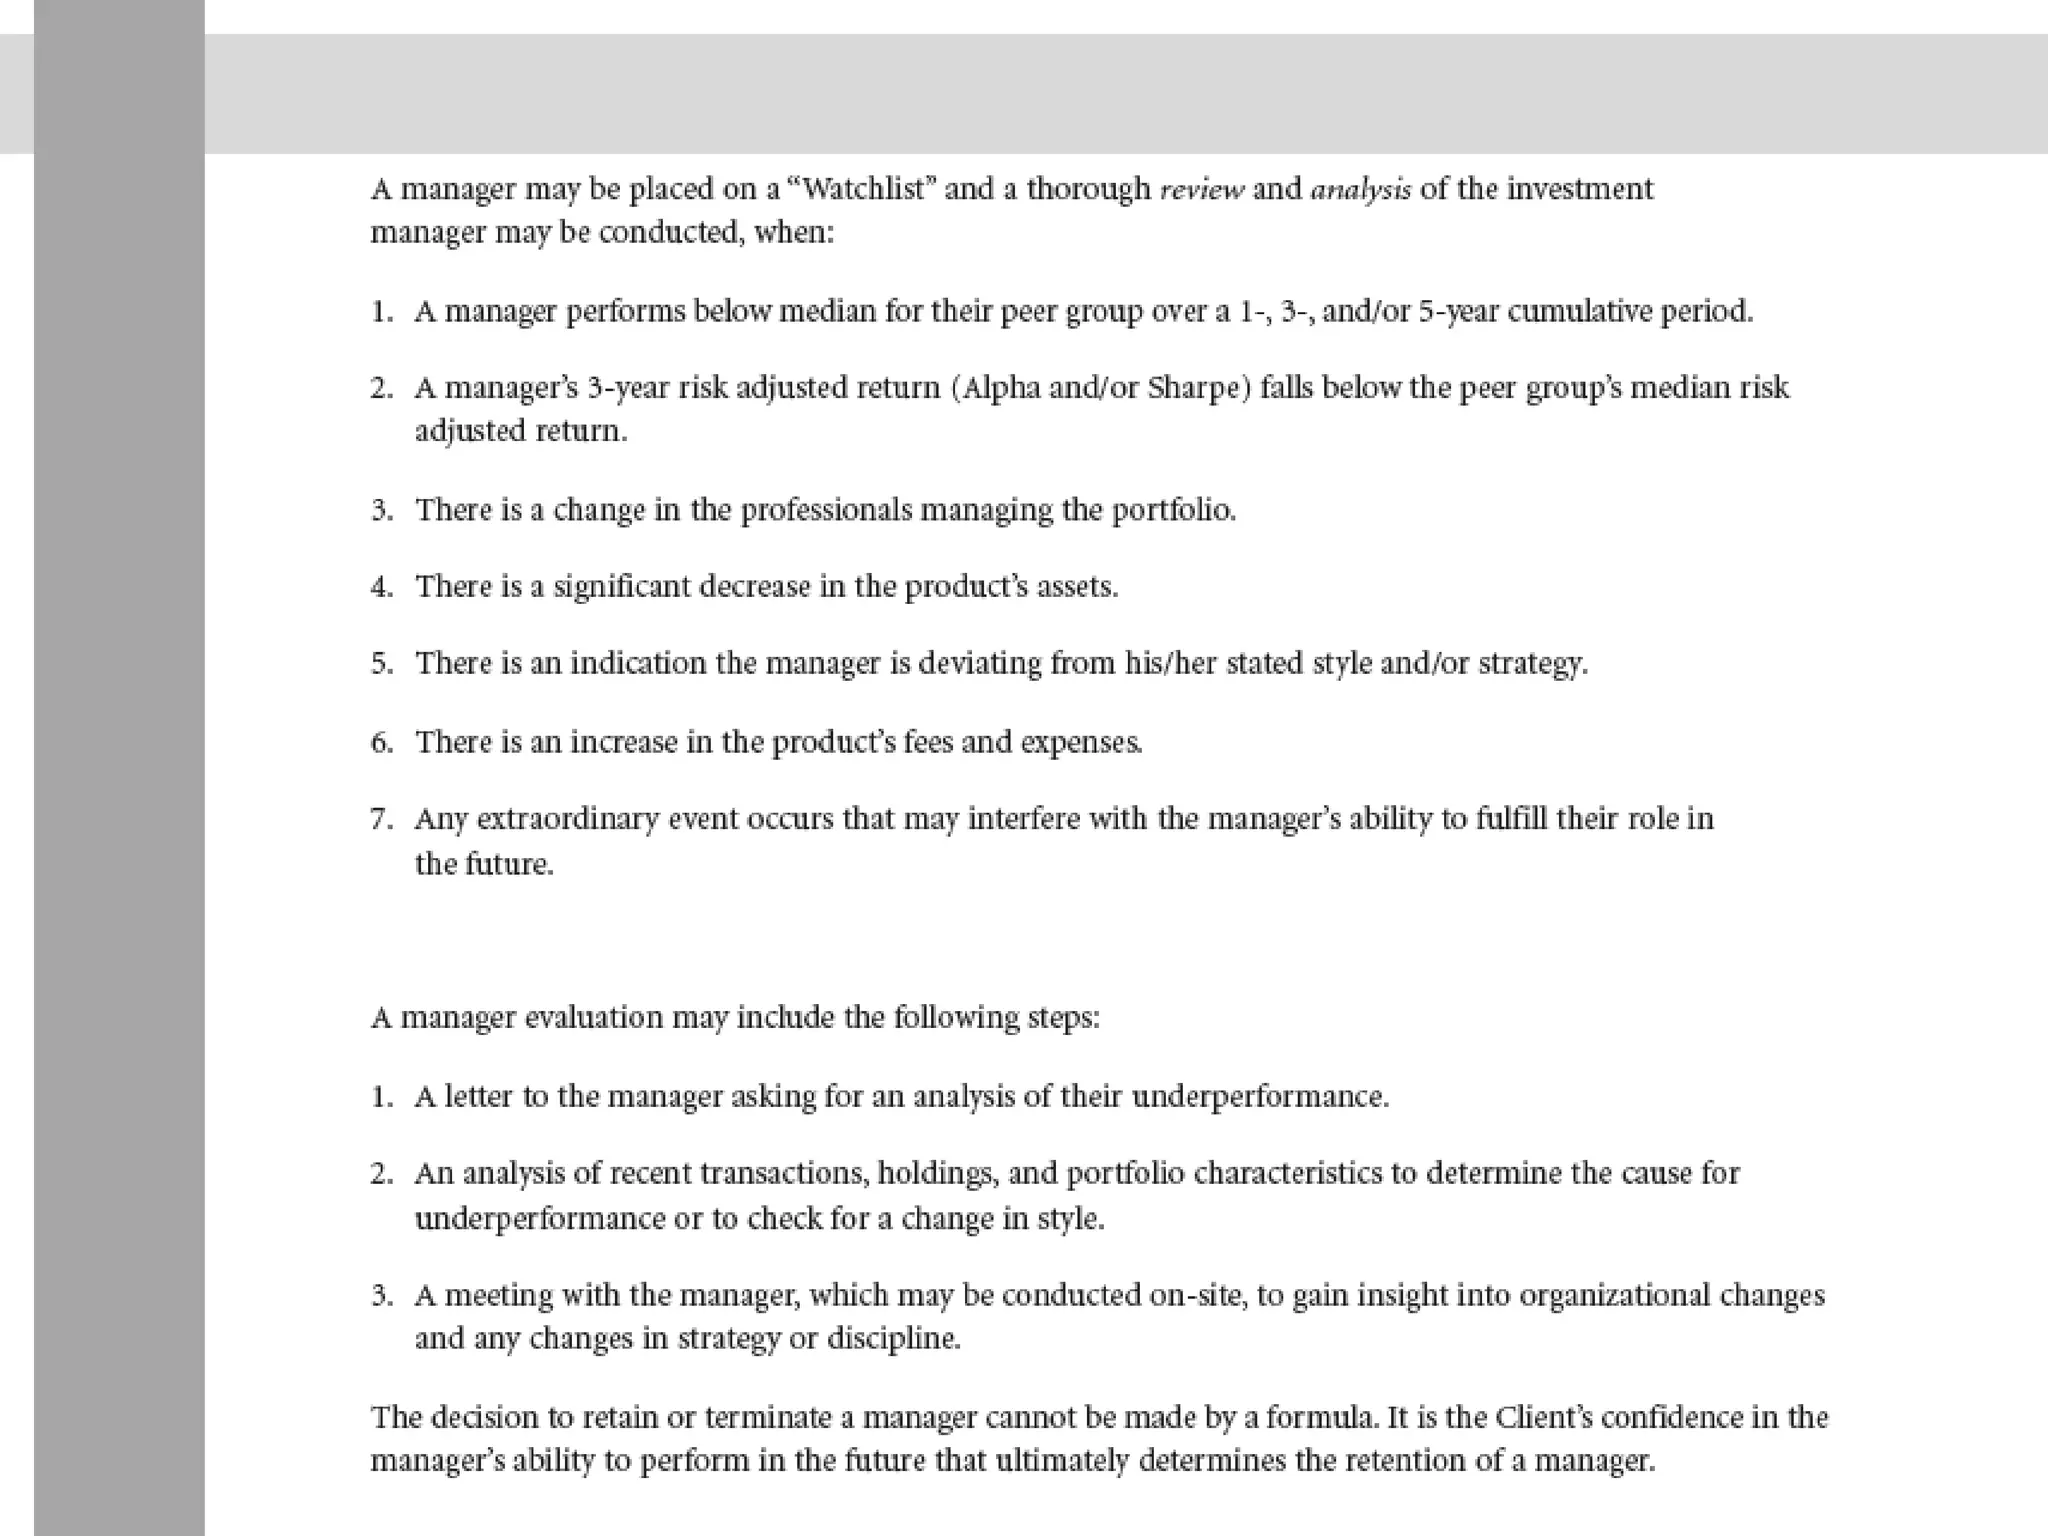
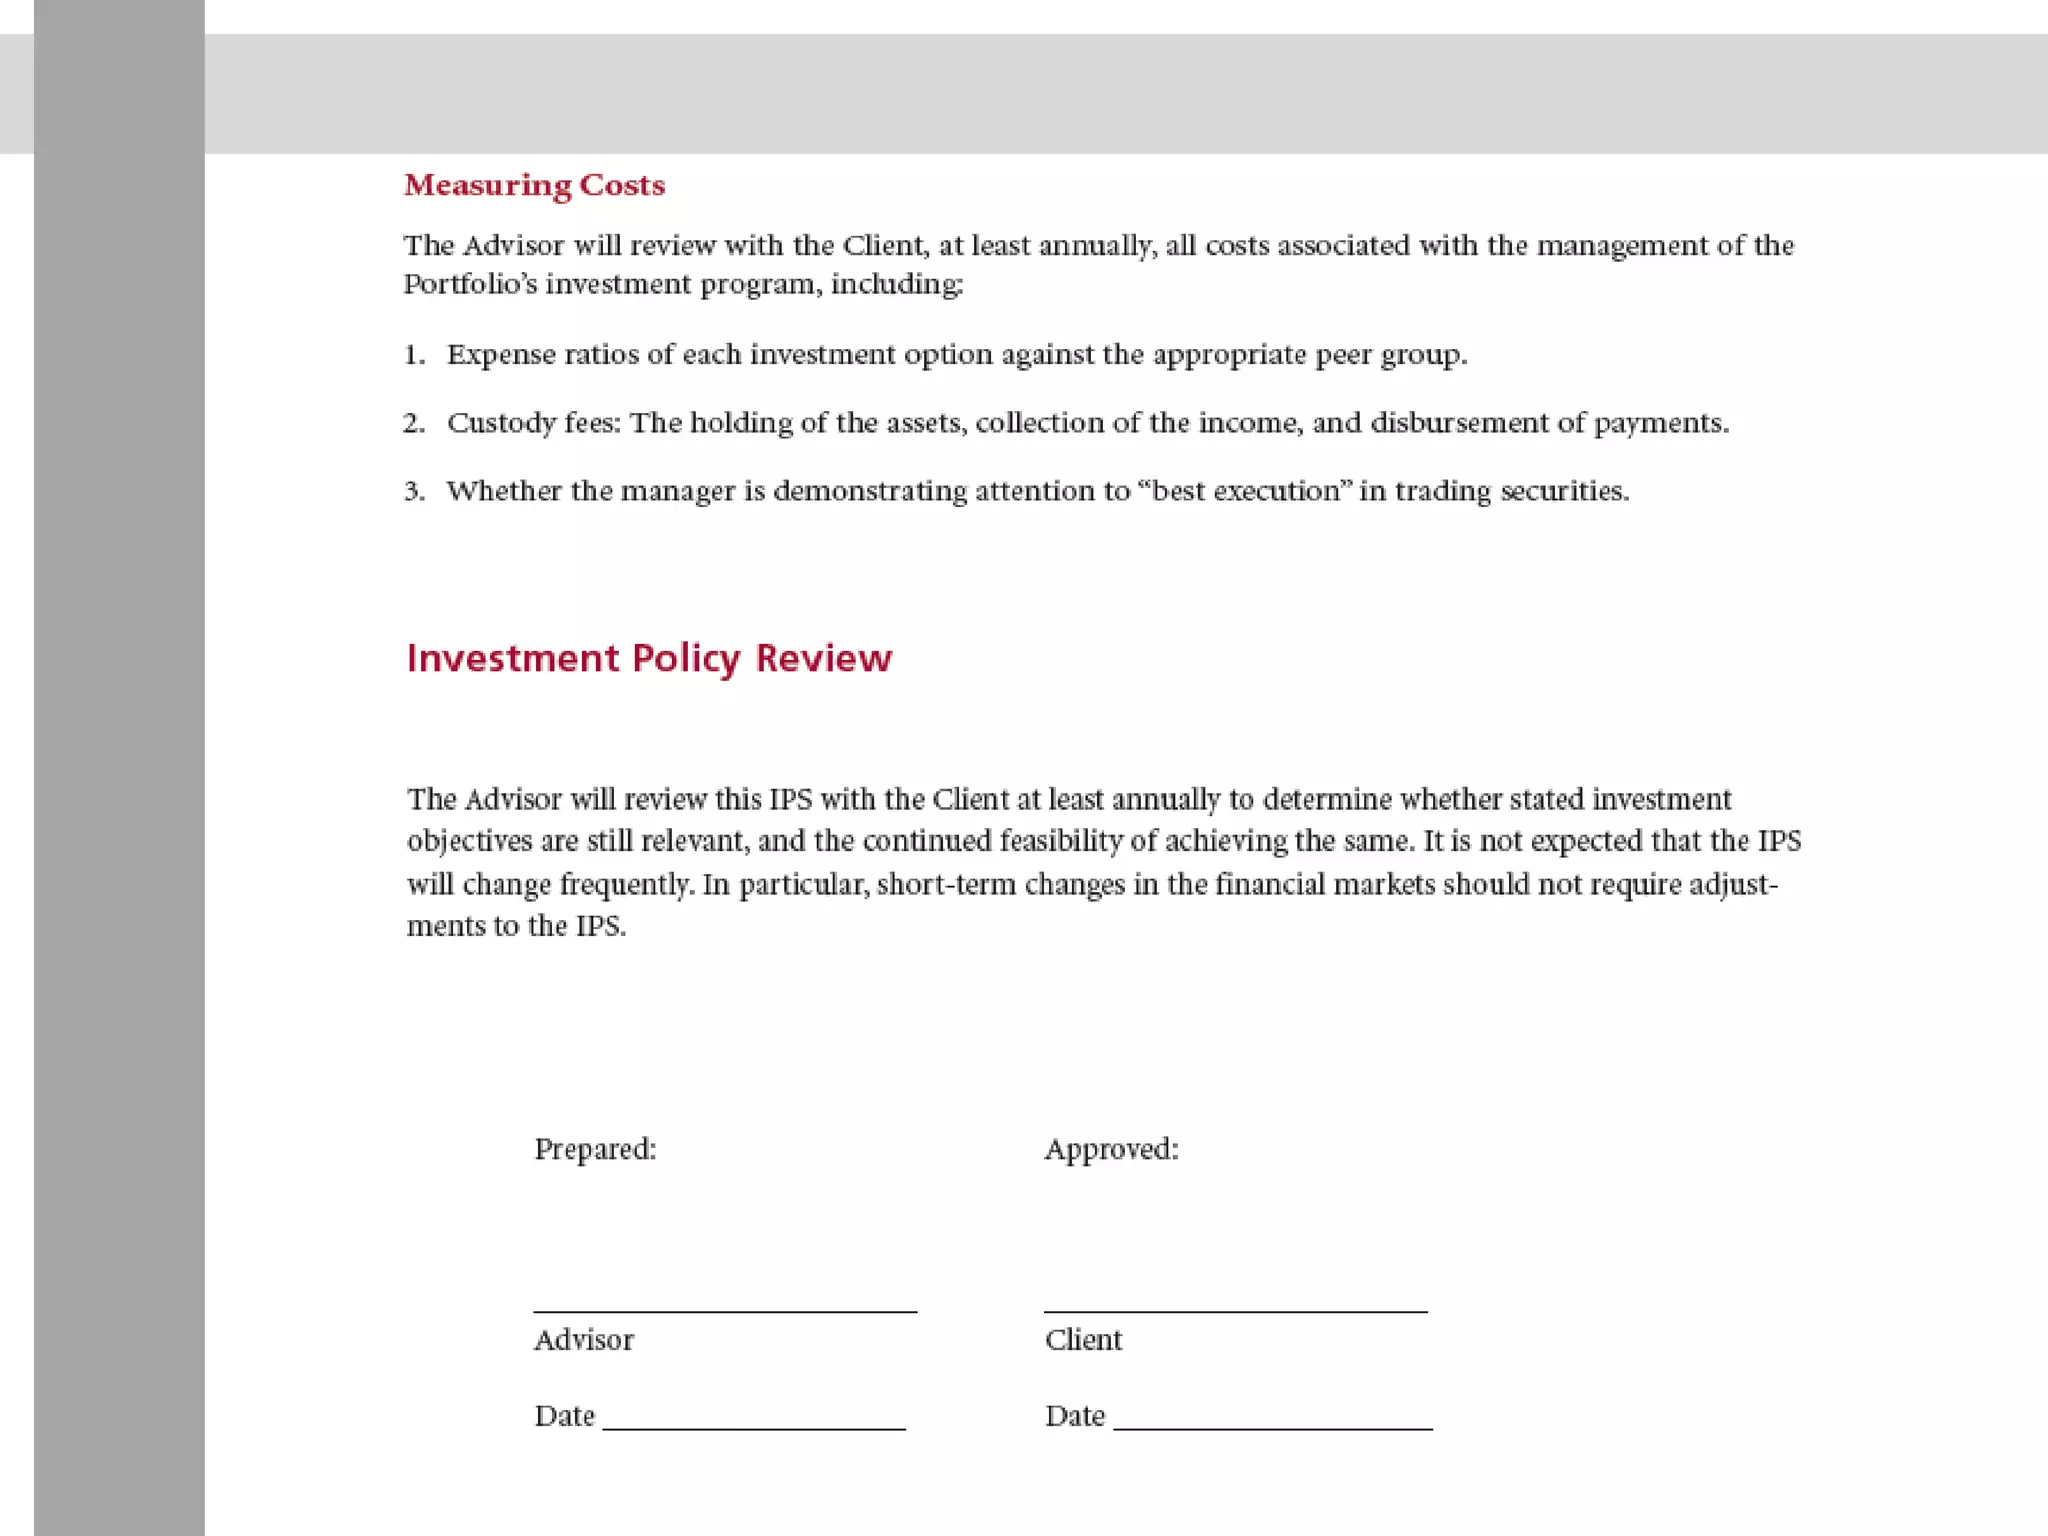
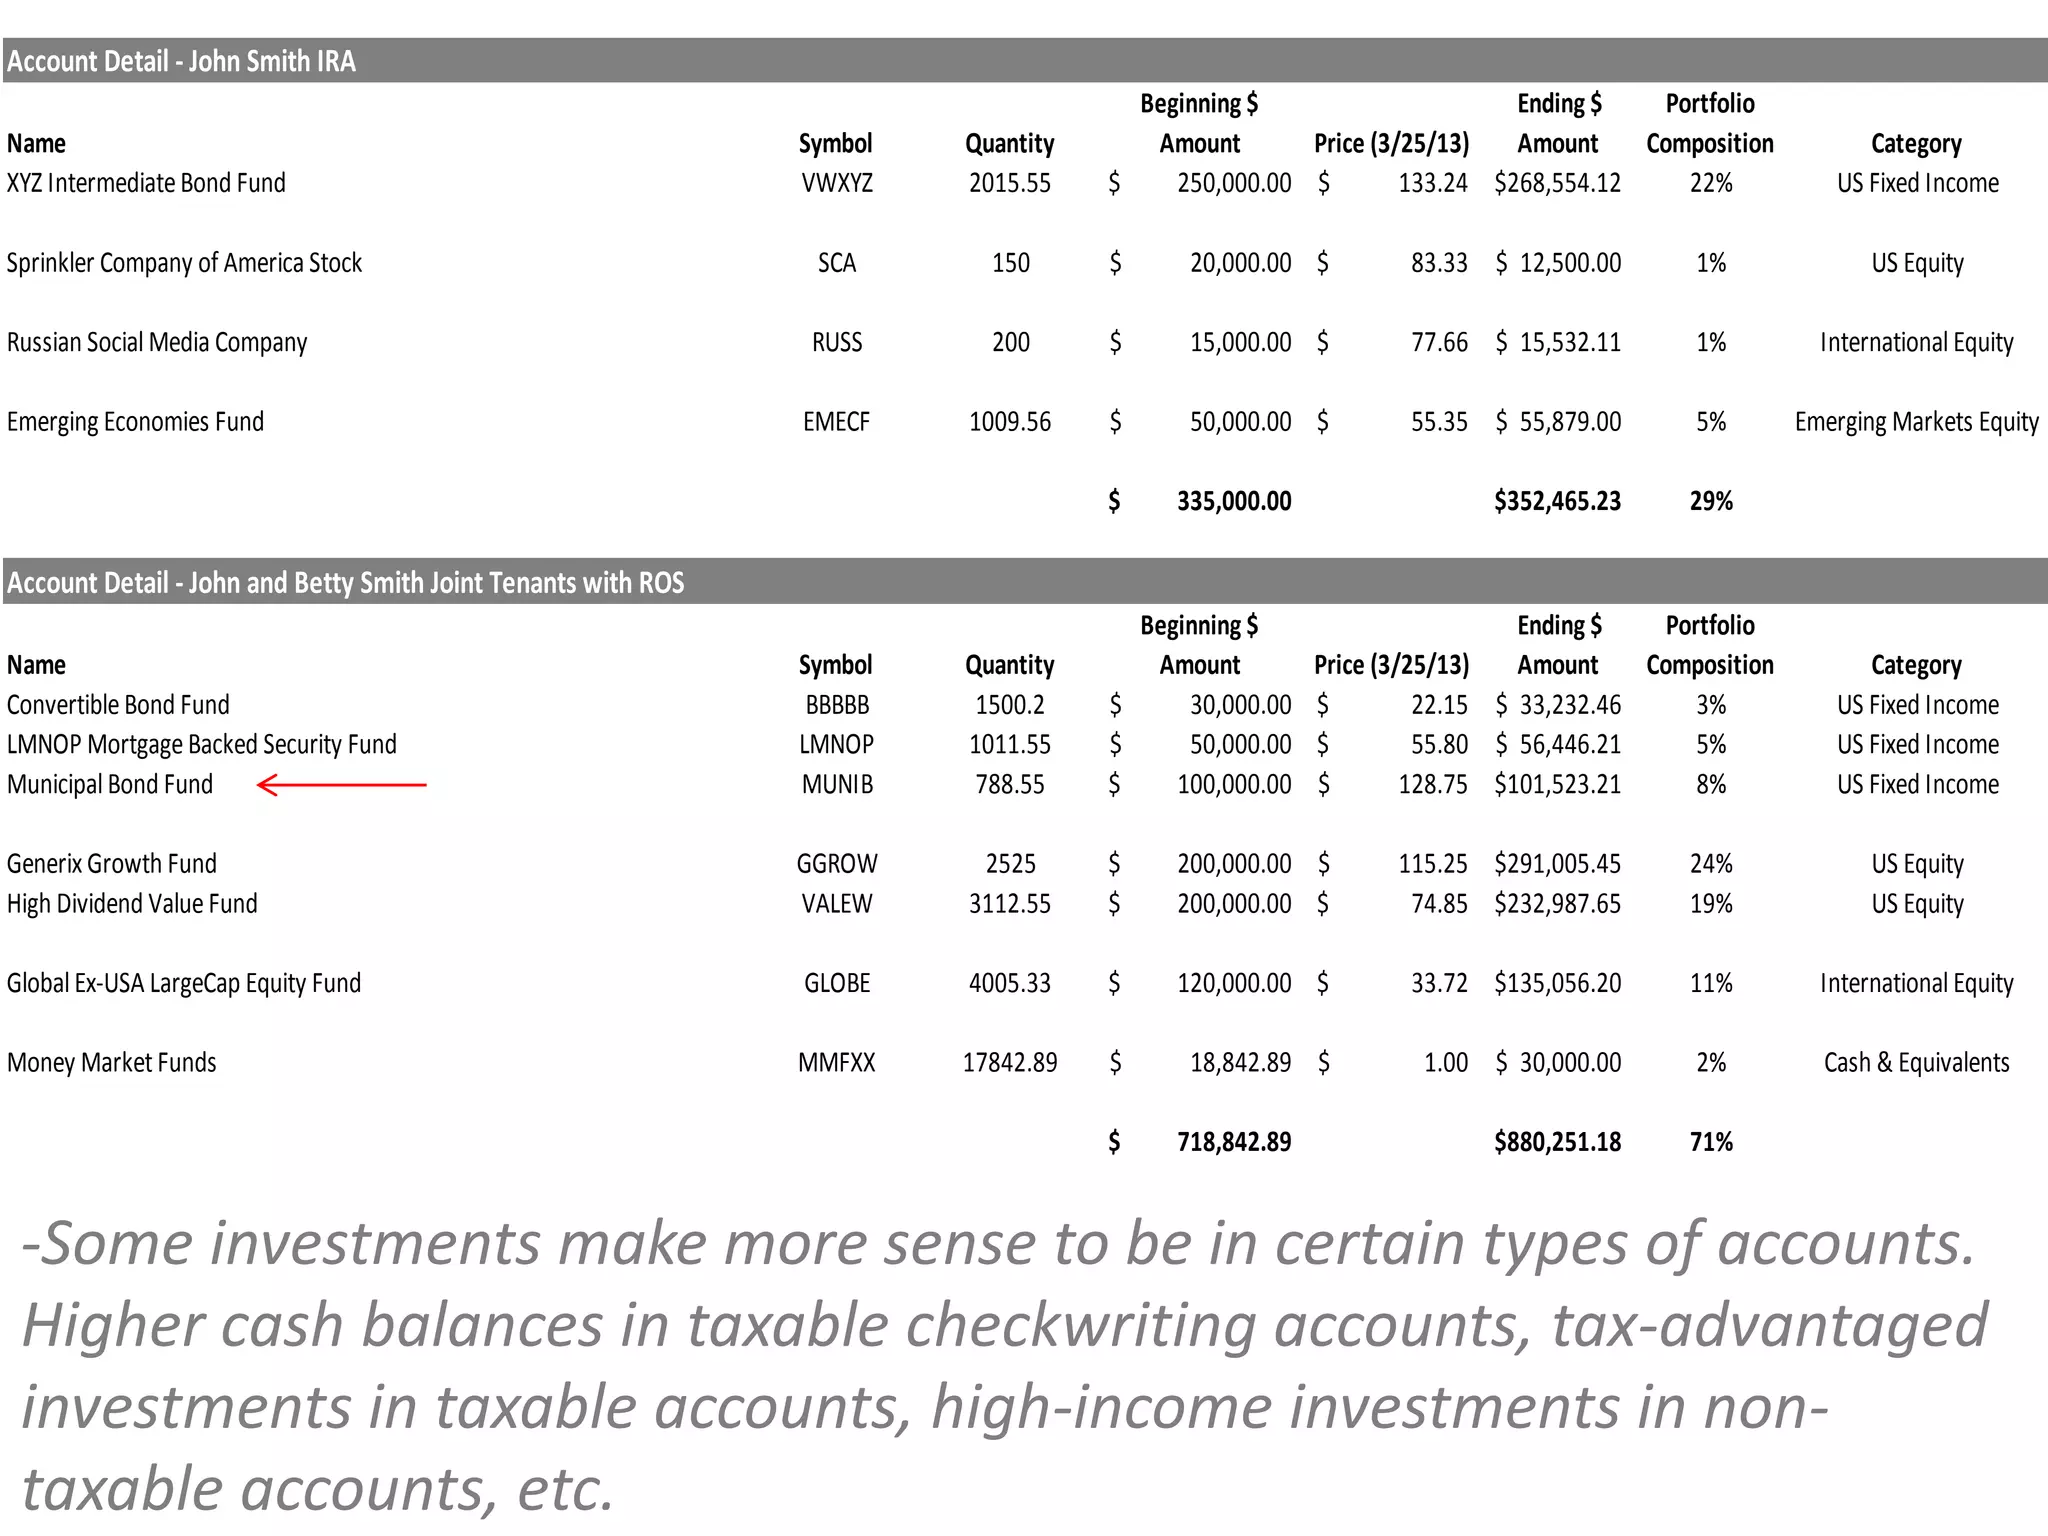
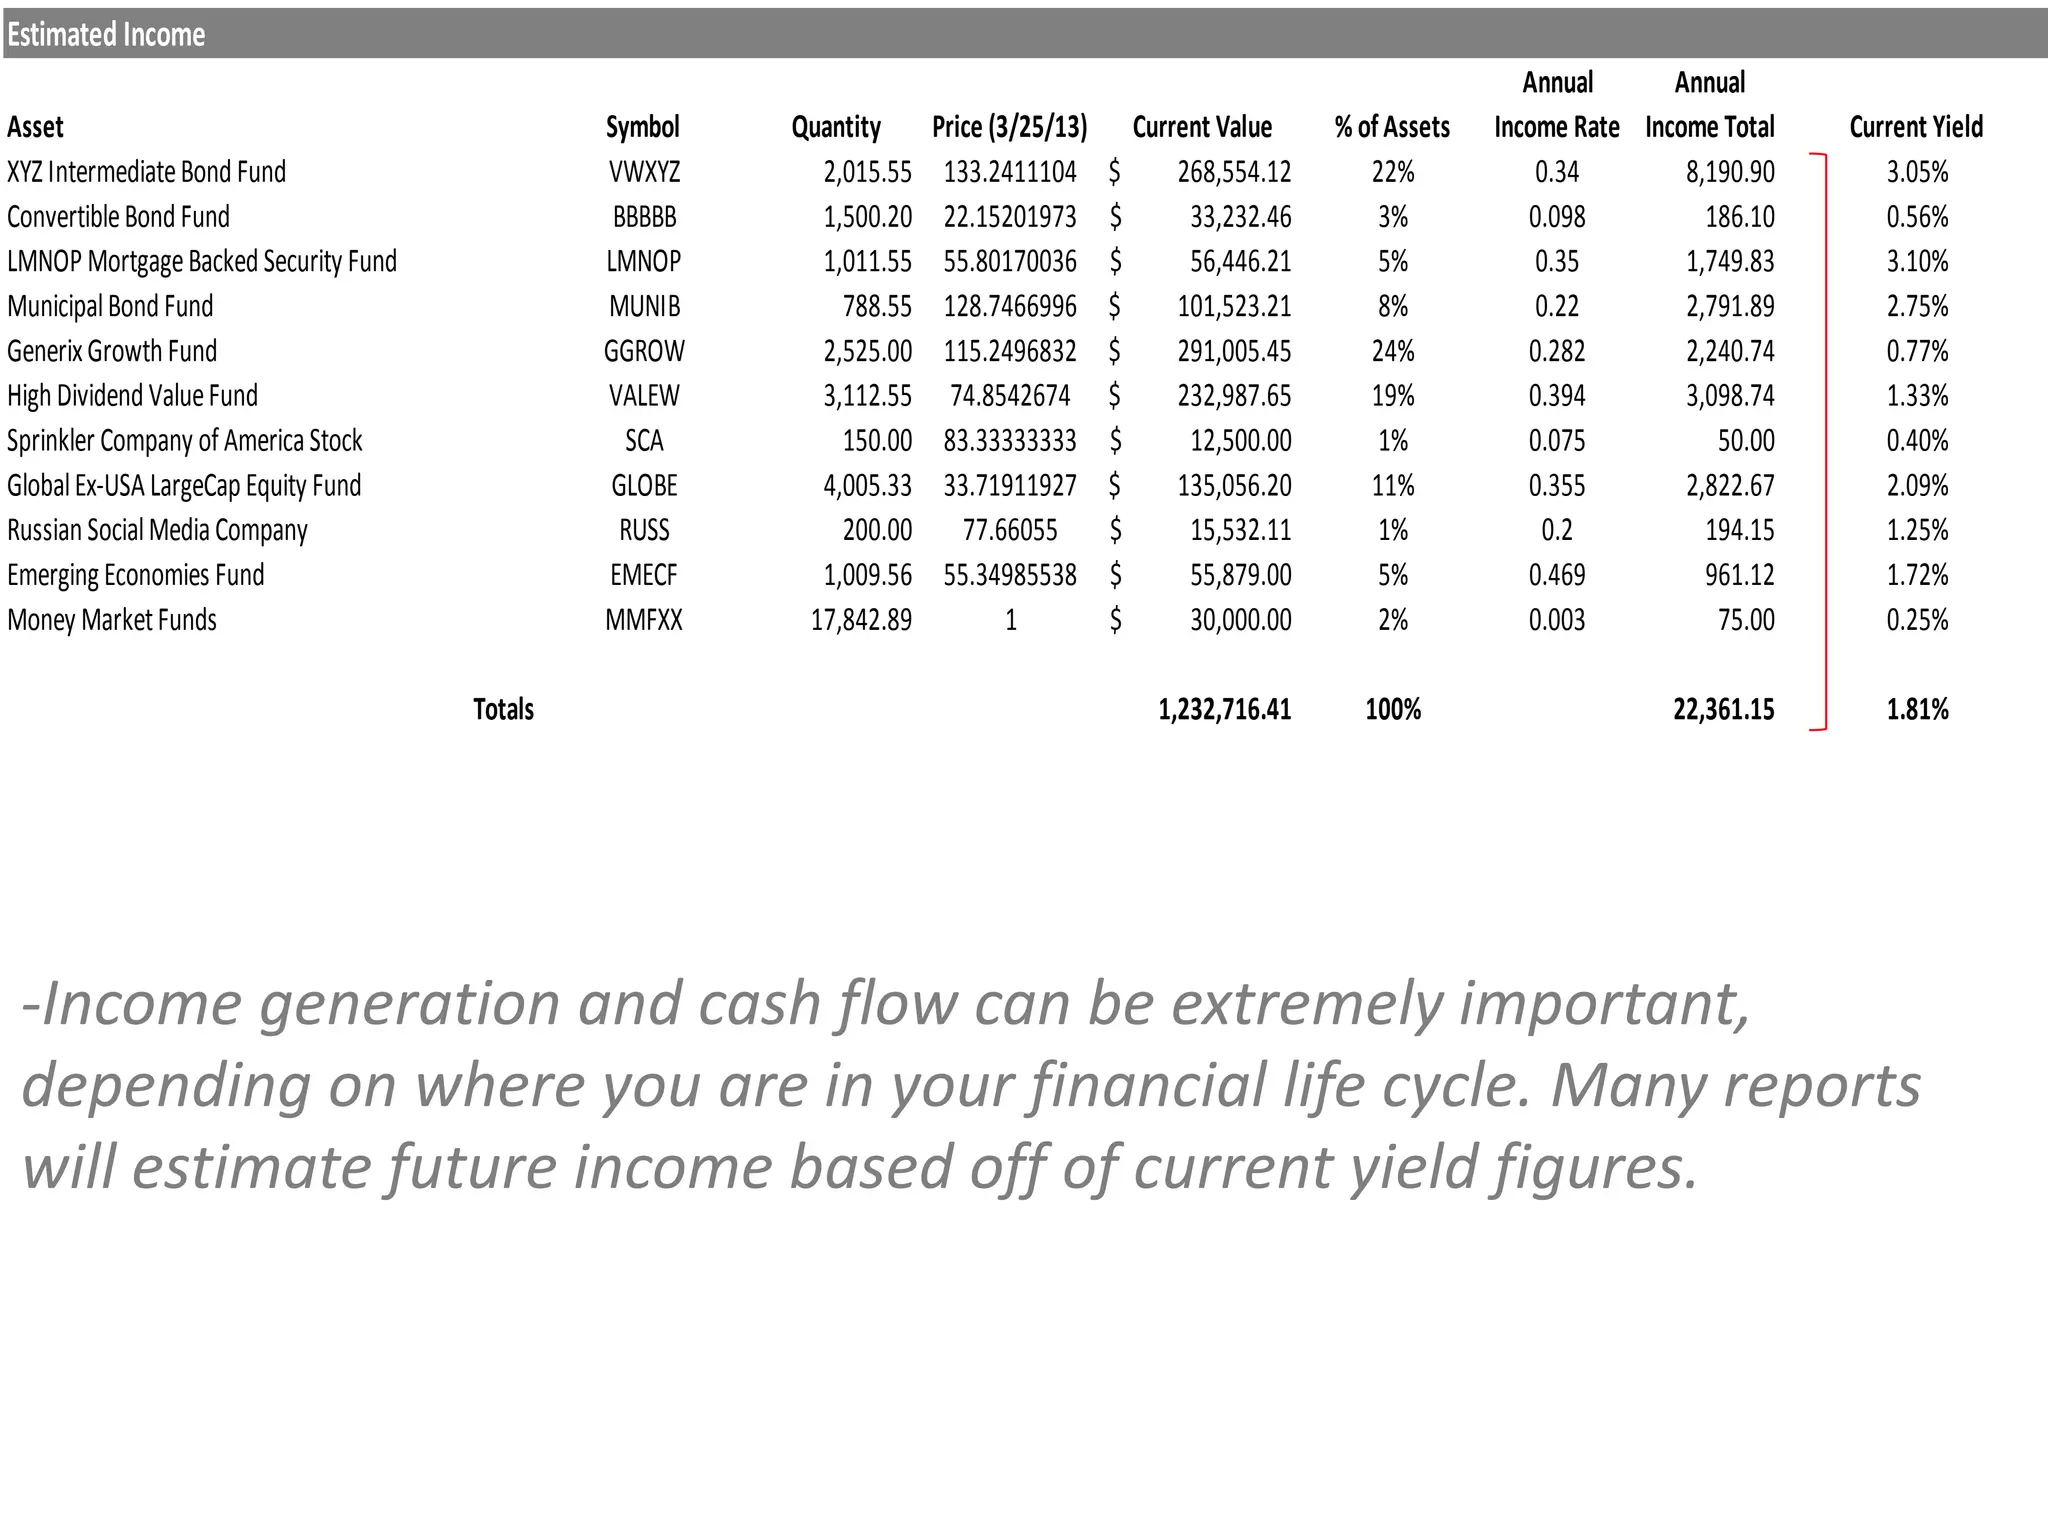
SlideShare a Scribd company logo
1 of 70
Wealth Management
An Unbiased Approach to Managing Your Investments
Designed for the Affluent Investor
Wealth Management Process
Week 4: Managing Your Investments
Manager Selection
Financial Advisor
Implementation
Investment Policy
Performance Monitoring
Methods
Implementation Methods:
Lump-Sum Investing
Dollar-Cost Averaging
Modified Dollar-Cost Averaging
Modified DCA differs from
normal DCA in that it takes
movements in the market into
consideration.
DCA does not assure a profit and does not protect against loss in declining markets. Such a plan involves continuous
investment in securities regardless of fluctuating price levels and and investor should consider their financial ability to
continue their purchases through periods of low price levels.
Methods
Calling the bottom is impossible (Review)
Boston Globe, Aug 12, 2000 - "…at these undervalued prices…we're not
selling any stock at these prices". (On Monday, Aug 14, the S&P 500
closed at 1491. Four years later on Aug 12 2004, the S&P fell a
further 29% to close at 1063.)
Wired Magazine, Dec 4, 2000 - "Fred Siegel, president of investment
management firm Siegel Group, believes that it is unlikely that the
Nasdaq will drop more than another 200 points." (The Nasdaq fell
over 1,000 points shortly after Siegel made his prediction.)
Market guru and former hedge fund manager Jim Cramer of
TheStreet.com said it well in Jan 2001: “I get paid to call bottoms. I
don't see one yet, but in my 18 years of trading I've never called one
exactly right yet. I don't see why this time will be any different."
DCA does not assure a profit and does not protect against loss in declining markets. Such a plan involves continuous
investment in securities regardless of fluctuating price levels and and investor should consider their financial ability to continue
their purchases through periods of low price levels.
Methods
DCA vs. Lump Sum Investing
A couple has $500,000 to invest. What are the possible ways to
invest and what are the possible outcomes?
DOLLAR COST
AVERAGING
LUMP SUM
INVESTING
Declining Market
Bound Market
Increasing Market
?
?
?
?
?
?
DCA vs. Lump Sum Investing
Dollar Cost Averaging Example: Declining Market
DATE
TOTAL
VALUE
2000.00
2222.22
2500.00
2857.14
3333.33
$50.00
$45.00
$40.00
$35.00
$30.00
TOTAL
$100,000
$100,000
$100,000
$100,000
$100,000
$500,000
2000.00
4222.22
6722.22
9579.37
12912.70
12912.70
$100,000.00
$190,000.00
$268,888.89
$335,277.78
$387,380.95
$387,380.95
PRICE
TOTAL
SHARES
OWNED
SHARES
PURCHASED
DOLLAR
AMOUNT
INVESTED
PRICES ARE DECREASING
01/01/13
02/01/13
03/01/13
04/01/13
05/01/13
DCA vs. Lump Sum Investing
Dollar Cost Averaging Example: Declining Market
YOUR AVERAGE COST IS ACTUALLY LOWER
THAN THE AVERAGE PRICE
Average Price of XYZ
Average Cost of XYZ
Your Average Cost
$40.00
$38.72
$1.28 less than average price
DCA vs. Lump Sum Investing
…vs. Lump Sum Investing: Declining Market
DATE
TOTAL VALUE
(LUMP SUM)
$50.00
$45.00
$40.00
$35.00
$30.00
TOTAL
$500,000
0
0
0
0
10,000.00
10,000.00
10,000.00
10,000.00
10,000.00
$500,000.00
$450,000.00
$400,000.00
$350,000.00
$300,000.00
$300,000.00
PRICE
TOTAL
SHARES
OWNED
DOLLAR
AMOUNT
INVESTED
PRICES ARE DECREASING
TOTAL VALUE
(DCA)
$100,000.00
$190,000.00
$268,888.89
$335,277.78
$387,380.95
$387,380.95
01/01/13
02/01/13
03/01/13
04/01/13
05/01/13
DCA vs. Lump Sum Investing
Dollar Cost Averaging Example: Bound Market
DATE
TOTAL
VALUE
2000.00
2222.22
1818.18
2000.00
2000.00
$50.00
$45.00
$55.00
$50.00
$50.00
TOTAL
$100,000
$100,000
$100,000
$100,000
$100,000
$500,000
2000.00
4222.22
6040.40
8040.40
10040.40
10040.40
$100,000.00
$190,000.00
$332,222.22
$402,020.20
$502,020.20
$502,020.20
PRICE
TOTAL
SHARES
OWNED
SHARES
PURCHASED
DOLLAR
AMOUNT
INVESTED
PRICES ARE FLUCTUATING
01/01/13
02/01/13
03/01/13
04/01/13
05/01/13
DCA vs. Lump Sum Investing
Dollar Cost Averaging Example: Bound Market
YOUR AVERAGE COST IS SIMILAR TO THE
AVERAGE PRICE
Average Price of XXX
Average Cost of XXX
Your Average Cost
$50.00
$49.80
$0.20 less than average price
DCA vs. Lump Sum Investing
…vs. Lump Sum Investing: Bound Market
DATE
TOTAL VALUE
(LUMP SUM)
01/01/13
02/01/13
03/01/13
04/01/13
05/01/13
$50.00
$45.00
$55.00
$50.00
$50.00
TOTAL
$500,000
0
0
0
0
10,000.00
10,000.00
10,000.00
10,000.00
10,000.00
$500,000.00
$450,000.00
$550,000.00
$500,000.00
$500,000.00
$500,000.00
PRICE
TOTAL
SHARES
OWNED
DOLLAR
AMOUNT
INVESTED
PRICES ARE FLUCTUATING
TOTAL VALUE
(DCA)
$100,000.00
$190,000.00
$322,222.22
$402,020.20
$502,020.20
$502,020.20
DCA vs. Lump Sum Investing
Dollar Cost Averaging Example: Increasing Market
DATE
TOTAL
VALUE
2000.00
1818.18
1666.67
1538.46
1428.57
$50.00
$55.00
$60.00
$65.00
$70.00
TOTAL
$100,000
$100,000
$100,000
$100,000
$100,000
$500,000
2000.00
3818.18
5484.85
7023.31
8541.88
8541.88
$100,000.00
$210,000.00
$329,090.91
$456,515.15
$591,631.70
$591.631.70
PRICE
TOTAL
SHARES
OWNED
SHARES
PURCHASED
DOLLAR
AMOUNT
INVESTED
PRICES ARE INCREASING
01/01/13
02/01/13
03/01/13
04/01/13
05/01/13
DCA vs. Lump Sum Investing
Dollar Cost Averaging Example: Increasing Market
YOUR AVERAGE COST IS ACTUALLY STILL LOWER THAN THE
AVERAGE PRICE OF THE STOCK
Average Price of XXX
Average Cost of XXX
Your Average Cost
$60.00
$58.54
$1.46 less than average price
DCA vs. Lump Sum Investing
…vs. Lump Sum Investing: Increasing Market
DATE
TOTAL VALUE
(LUMP SUM)
$50.00
$55.00
$60.00
$65.00
$70.00
TOTAL
$500,000
0
0
0
0
10,000.00
10,000.00
10,000.00
10,000.00
10,000.00
$500,000.00
$550,000.00
$600,000.00
$650,000.00
$700,000.00
$700,000.00
PRICE
TOTAL
SHARES
OWNED
DOLLAR
AMOUNT
INVESTED
PRICES ARE INCREASING
TOTAL VALUE
(DCA)
$100,000.00
$210,000.00
$329,090.91
$456,515.15
$591,631.70
$591.631.70
01/01/13
02/01/13
03/01/13
04/01/13
05/01/13
DCA vs. Lump Sum Investing
Conclusion
LUMP SUM
INVESTING
Declining Market
Bound Market
Increasing Market
$387,381
$502,050
$618,506
$300,000
$500,000
$700,000
DOLLAR COST
AVERAGING
Does lump sum investing have a higher risk and higher reward?
FOOD FOR THOUGHT
A couple has $500,000 to invest. What are the possible ways to
invest and what are the possible outcomes?
Louie the Loser
Think you
have bad
timing?
Meet
Louie
the
Loser© American Funds Distributors, Inc.
Louie the Loser
He cancelled his
dental insurance the
day before his root
canal flared up.
His vacation in the
desert was rained
out.
He misses planes
but catches colds.
Why is he so happy?
© American Funds Distributors, Inc.
Louie the Loser
Starting in 1987, invested $10,000
a year in a large cap fund
Invested for 20 Years
Chose the Worst Day Each Year — Market
High
Total Investment: $200,000
© American Funds Distributors, Inc.
Louie the Loser
…20 years later
$10,000 a year, starting in 1987:
Worst-day investments (market highs)
Account value $637,185
Average annual total return 10.7%
Best-day investments (market lows)
Account value $772,705
Average annual total return 12.0%
Market highs and lows based on Dow Jones Industrial Average. Cumulative volume discount applied when appropriate.
Figures are past results and are not predictive of results in future periods. Current and
future results may be lower or higher than those shown. Share prices and returns will
vary, so you may lose money. Fund results are for Class A shares and reflect deduction
of maximum sales charge (5.75%).
© American Funds Distributors, Inc.
What We Know for Sure
It’s time in, not timing, the
market that counts
© American Funds Distributors, Inc. AI-20069
Wealth Management Process
CLASS 4: Managing Your Investments
Manager Selection
Financial Advisor
Implementation
Investment Policy
Performance Monitoring
Investment Professionals
Investment Advisors
Financial Advisors
Financial Planners
Financial Consultants
Stock Brokers
Discount Brokers
Relationship Managers
Investment Professionals
Assets vs. Transactions
Fees vs. Commissions
Counseling vs. Selling
Process vs. Product
Investment Professionals
A good financial advisor should have the following
three characteristics:
Integrity
Intelligence
Motivation
Investment Professionals
What should you look for in an advisor?
Level of Education
Types of Clients
Industry Experience
Professional Memberships
Applicable Market Knowledge
Ability to Educate You
Investment Professionals
Sample Questions
How many client relationships do you have?
Describe your ideal client?
What is your specialty?
Do you hold any professional designations?
Do you use an investment policy statement with your clients?
May I see an example of an investment policy statement that you use?
Describe the process you use with clients.
Which responsibilities do you handle personally and which do you delegate?
How do you evaluate performance?
What performance should I expect from my investments?
What level of risk/volatility should I expect?
Investment Professionals
Sample Questions Continued…
How do you select managers, funds or individual stocks for my portfolio?
What is your disciplinary record?
How would I fit into your practice?
What level of communication should I expect?
Do you employ options and/or future strategies?
How many brokerage firms have you worked for?
If firm has been changed in the past 5 years, why did you change firms?
What would you like to be doing in five years?
Describe everything that I would be paying for to accomplish the
investment programs you advise. Include commissions, expenses,
account fees, transaction fees, 12b-1 fees, maintenance fees, etc.
Investment Professionals
The Stages of Service
Evaluate current situations (every 12 months)
Determine goals and objectives (every 12-24 months)
Determine risk tolerance
Asset allocation analysis (every 90 days)
Manager and manager comparison analysis (every 90 days)
Timing
Tax issues (every 12 months)
Will, Trusts, FLLC (3-5 years)
Insurance (every 12 months)
Monitoring (every 90 days)
Rebalancing (every 90 days)
Investment Professionals
The Stages of Service
EVERY 90 DAYS
ANNUALLY
EVERY 12-24 MONTHS
EVERY 3-5 YEARS
YEARS
0 1 2 3 4
ASSET ALLOCATION ANALYSIS
MANAGER COMPARISON ANALYSIS
MONITORING
REBALANCING
EVALUATE CURRENT SITUATION
TAX ISSUES
INSURANCE
DETERMINE GOALS & OBJECTIVES
WILL, TRUSTS, FLLC
Investment Professionals
Things to look out for:
Trigger words like “Guarantee” or absolute terms like “never”
Promising wealth without risk
Margin or other leverage
Extensive timing schemes
Concentration in single stock, asset class, etc.
Investment Professionals
How do I check my investment advisor’s securities
disciplinary record?
Request from the Financial Industry Regulatory Authority
(FINRA) a disciplinary record for your broker at:
http://www.finra.org/Investors/ToolsCalculators/BrokerCheck/
Wealth Management Process
CLASS 4: Managing Your Investments
Manager Selection
Financial Advisor
Implementation
Investment Policy
Performance Monitoring
Wealth Management Process
Implementation
Depending on the nature of your investment management team, some or all of
the implementation process may be your responsibility.
An experienced financial planning professional will likely have experience and
expertise to provide advice in each “Stage of Service”; yet, they may not be able
to give tax or legal advice without the proper licensure. In this case, they may be
able to act as a quarterback for your professional “Circle of Trust”.
YOU
CPA /
Accountant
Insurance
Agent
Attorney
Financial
Planner
Personal
Banker
Wealth Management Process
CLASS 4: Managing Your InvestmentsManager Selection
Financial Advisor
Implementation
Investment Policy
Performance Monitoring
The Investment Policy Statement
What is an IPS?
The means for turning your vision into reality. It is a living
document that guides all investment decisions.
Establishes a clear understanding between decision makers.
Provides a meaningful basis for the evaluation.
Enables the client, the advisor and portfolio managers to protect
the fund from ad hoc revisions of sound long-term policy
when short-term exigencies are most distressing and the
policy is in doubt.
The Investment Policy Statement
Why is it important to develop an IPS?
Puts structure to your goals
Manager or Broker Succession
Control Emotional Decisions
Identifies Responsibilities
Determine Asset Allocation
Sets Up Performance Measurement Criteria
The Investment Policy Statement
Do I need an Investment Policy Statement?
1. What rate of return have your investments achieved over the
last three years? Last five years?
2. How are the returns calculated?
3. Are you a fiduciary?
4. What procedures do you use to select your investments and/or
your investment managers (or funds)?
5. What is your investment allocation?
6. What system, if any, do you use to time the market or to
rebalance your portfolio?
7. What asset classes are permitted for your use? Which are
restricted?
The Investment Policy Statement
Do I need an Investment Policy Statement?
8. What is your target rate of return and how was it determined?
Is it a nominal rate or in relation to some benchmark, such as
inflation or the S&P 500?
9. What level of risk is acceptable to you and how do you qualify
that?
10. How much liquidity is required for your portfolio and how do
you determine that level?
If your response to any of the above was “I don’t know,” your
answer was less than clear, or if you answered “yes” to
question 3, then you need an Investment Policy Statement
and this section of the class is intended for you.
The Investment Policy Statement
Q: Who is Responsible for its Development?
A: The Client and the Investment Professional!
For the Client, it serves the useful purpose of requiring thinking
about preferences and expectations with respect to the market.
For the Investment Professional, an IPS provides the basis for
recommendations and for investment decisions in situations of
uncertainty.
The Investment Policy Statement
Client Responsibilities
Communicate your goals
Determine your time horizon
Gather personal financial data
Consolidate holdings
Know your fees and expenses
Determine you risk tolerance
The Investment Policy Statement
Investment Professional Responsibilities
Help in determining your risk tolerance
Help determine long term goals
Provide asset allocation recommendations
Explain what appropriate fees and expenses should be
Help select appropriate managers
Set standards for performance reporting
The Investment Policy Statement
Seven Elements of a Well Constructed IPS
1. Executive Summary/Statement of Purpose
2. Investment Goals and Objectives
3. Statement of Responsibility
4. Investment Guidelines
5. Asset Mix Guidelines
6. Communication
7. Performance Review and Evaluation
The Investment Policy Statement
1. Executive Summary/Statement of Purpose
This section lays out the groundwork for the rest of the
document. It first answers the question, “Who are you?” Next, it
describes your broad aims. It also documents the intended
purpose of the financial assets considered in the portfolio design.
An explanation of the purpose of the IPS, objectives, and
legal structure.
The size of the portfolio, future payment information, and
disbursement schedules.
The tax status of the portfolio.
A description of participant demographics.
TO BE INCLUDED:
Source: The Complete Guide to Managing a Portfolio of Mutual Funds, by Ronald K. Rutherford.
The Investment Policy Statement
2. Statement of Responsibility
This section describes the related parties involved in the IPS
design and implementation process. It includes the investment
advisor and the custodian. It may also include others such as the
co-trustee, an auditor of the records, and those rendering tax and
legal advice about the IPS.
Source: The Complete Guide to Managing a Portfolio of Mutual Funds, by Ronald K. Rutherford.
The Investment Policy Statement
3. Investment Goals and Objectives
Time Horizon
Risk Tolerance
Asset Class Preferences
Expected or Desired Rate of Return
Lifestyle needs
The Investment Policy Statement
4. Investment Guidelines
Guidelines are established to identify the parameters within the
investment strategy. This section is the appropriate place to
articulate concerns and expectations, and acknowledge the
uncertainties of investing in the capital markets. This section
should include restrictions including prohibited transactions.
The Investment Policy Statement
5. Asset Mix Guidelines
Asset mix guidelines can include restrictions placed by the client or
client circumstances on securities or investment categories. This is also
the place to document restrictions suggested by the advisor. For
example, an unrestricted asset allocation model may assign all financial
assets to two or three categories or asset classes.
The Investment Policy Statement
6. Communication
Example-Investment Manager(s) Communication with the Trustees
Provide monthly statements, quarterly portfolio valuations and
transaction listings
Meet at least (quarterly, semi-annually, annually)
Review past investment performance, evaluate the current
investment outlook, and discuss investment strategy
Provide information regarding major changes in investment policy
that may result in major investment strategy changes.
The Investment Policy Statement
7. Performance Review
1. Up is good, Down is bad
2. Performance at or above goal
3. Performance within volatility tolerance
4. Relative Performance
5. Trend of Performance vs. Goal
Sample Investment Policy Statement
End of Sample
Sample Portfolio Review
Client: John & Jane Adams
Period: 3/26/2012-3/26/2013
*IMPORTANT: All Investment Names, Indices, Performance Data, and Allocations are fake and do not represent any true
investment and should not be considered investment advice.
Activity Summary
Period YTD
Beginning Market Value (Including Bond Accrual) 1,053,842.89$ 1,153,551.35$
Contributions 40,000.00$ 10,000.00$
Distributions -$ -$
Transfer In/Out 50,000.00$ -$
Dividends and Interest 5,346.29$ 1,537.55$
Miscellaneous Charges (320.55)$ (85.00)$
Advisory Fees Paid (5,062.87)$ (1,255.20)$
Bond Accrual 160.00$ 50.00$
Market Value Increase/Decrease 88,750.65$ 68,917.71$
Ending Market Value (Including Bond Accrual) 1,232,716.41$ 1,232,716.41$
Gross Performance 8.433% 5.996%
Returnsare GrossofFees, First 12 Month Returnsnot Annualized
Allocation Summary
$ %
459,756.00$ 37.3%
536,493.10$ 43.5%
150,588.31$ 12.2%
55,879.00$ 4.5%
30,000.00$ 2.4%
Asset Category
US Fixed Income
US Equity
International
Emerging Markets
Cash & Equivalents
Check Actual % Compare to Target % Rebalance
ConsolidatedHoldings
Name Symbol Quantity
Beginning $
Amount Price (3/25/13) Ending $ Amount
Position
Performance
Portfolio
Composition Category
XYZIntermediateBondFund VWXYZ 2,015.55 250000 133.24$ 268,554.12$ 7.42% 22% USFixedIncome
ConvertibleBondFund BBBBB 1,500.20 30000 22.15$ 33,232.46$ 10.77% 3% USFixedIncome
LMNOPMortgageBackedSecurityFund LMNOP 1,011.55 50000 55.80$ 56,446.21$ 12.89% 5% USFixedIncome
MunicipalBondFund MUNIB 788.55 100000 128.75$ 101,523.21$ 1.52% 8% USFixedIncome
Benchmark:USAggregateBondIndex 7.20%
GenerixGrowthFund GGROW 2,525.00 200000 115.25$ 291,005.45$ 20.50% 24% USEquity
HighDividendValueFund VALEW 3,112.55 200000 74.85$ 232,987.65$ 16.49% 19% USEquity
SprinklerCompanyofAmericaStock SCA 150.00 20000 83.33$ 12,500.00$ -37.50% 1% USEquity
Benchmark:USLargeCapEquityIndex 15.30%
GlobalEx-USALargeCapEquityFund GLOBE 4,005.33 120000 33.72$ 135,056.20$ 12.55% 11% InternationalEquity
RussianSocialMediaCompany RUSS 200.00 15000 77.66$ 15,532.11$ 3.55% 1% InternationalEquity
Benchmark:InternationalEquityIndex 9.60%
EmergingEconomies Fund EMECF 1,009.56 50000 55.35$ 55,879.00$ 11.76% 5% EmergingMarkets Equity
Benchmark:EmergingMarketsEquityIndex 10.50%
MoneyMarketFunds MMFXX 17,842.89 18842.89 1.00$ 30,000.00$ 0.00% 2% Cash&Equivalents
1,053,842.89$ 1,232,716.41$ 8.43% 100%
Class 2 Flashback:
Most Returns are Derived from Asset Allocation,
make sure to track the performance of your individual
investments vs. the Benchmark for that asset class.
Index Comparison - Returns areGross of Fees - First 12 Month Returns arenot annualized
Period(3/26/12-
3/26/13) QTD YTD 1 Year 3 Year 5 Year 10 Year Inception
Client Portfolio 8.43% 5.99% 0.0599 8.43% 5.51% 3.78% 5.75% 6.22%
BenchmarkPortfolio* 6.25% 4.75% 0.0475 6.25% 5.60% 3.90% 4.50% 5.26%
*50%USLargeCapIndex /10%International EquityIndex /40%Aggregate BondIndex
Portfolio Value vs. Benchmark Since Inception
-It can be easy to focus on how your portfolio compared to popular
indices, like the S&P 500, but your portfolio’s benchmark should be
blended based off your target risk and return profile.
Account Detail - John Smith IRA
Name Symbol Quantity
Beginning $
Amount Price (3/25/13)
Ending $
Amount
Portfolio
Composition Category
XYZ IntermediateBond Fund VWXYZ 2015.55 250,000.00$ 133.24$ 268,554.12$ 22% US Fixed Income
Sprinkler Company of America Stock SCA 150 20,000.00$ 83.33$ 12,500.00$ 1% US Equity
Russian Social Media Company RUSS 200 15,000.00$ 77.66$ 15,532.11$ 1% International Equity
Emerging Economies Fund EMECF 1009.56 50,000.00$ 55.35$ 55,879.00$ 5% Emerging Markets Equity
335,000.00$ 352,465.23$ 29%
Account Detail - John and Betty Smith Joint Tenants with ROS
Name Symbol Quantity
Beginning $
Amount Price (3/25/13)
Ending $
Amount
Portfolio
Composition Category
ConvertibleBond Fund BBBBB 1500.2 30,000.00$ 22.15$ 33,232.46$ 3% US Fixed Income
LMNOP Mortgage Backed Security Fund LMNOP 1011.55 50,000.00$ 55.80$ 56,446.21$ 5% US Fixed Income
Municipal Bond Fund MUNIB 788.55 100,000.00$ 128.75$ 101,523.21$ 8% US Fixed Income
Generix Growth Fund GGROW 2525 200,000.00$ 115.25$ 291,005.45$ 24% US Equity
High Dividend ValueFund VALEW 3112.55 200,000.00$ 74.85$ 232,987.65$ 19% US Equity
Global Ex-USA LargeCap Equity Fund GLOBE 4005.33 120,000.00$ 33.72$ 135,056.20$ 11% International Equity
Money Market Funds MMFXX 17842.89 18,842.89$ 1.00$ 30,000.00$ 2% Cash & Equivalents
718,842.89$ 880,251.18$ 71%
-Some investments make more sense to be in certain types of accounts.
Higher cash balances in taxable checkwriting accounts, tax-advantaged
investments in taxable accounts, high-income investments in non-
taxable accounts, etc.
-Income generation and cash flow can be extremely important,
depending on where you are in your financial life cycle. Many reports
will estimate future income based off of current yield figures.
Estimated Income
Asset Symbol Quantity Price (3/25/13) Current Value % ofAssets
Annual
Income Rate
Annual
Income Total Current Yield
XYZ IntermediateBondFund VWXYZ 2,015.55 133.2411104 268,554.12$ 22% 0.34 8,190.90 3.05%
ConvertibleBondFund BBBBB 1,500.20 22.15201973 33,232.46$ 3% 0.098 186.10 0.56%
LMNOP MortgageBacked Security Fund LMNOP 1,011.55 55.80170036 56,446.21$ 5% 0.35 1,749.83 3.10%
MunicipalBondFund MUNIB 788.55 128.7466996 101,523.21$ 8% 0.22 2,791.89 2.75%
GenerixGrowth Fund GGROW 2,525.00 115.2496832 291,005.45$ 24% 0.282 2,240.74 0.77%
High Dividend ValueFund VALEW 3,112.55 74.8542674 232,987.65$ 19% 0.394 3,098.74 1.33%
Sprinkler Company of AmericaStock SCA 150.00 83.33333333 12,500.00$ 1% 0.075 50.00 0.40%
GlobalEx-USALargeCap Equity Fund GLOBE 4,005.33 33.71911927 135,056.20$ 11% 0.355 2,822.67 2.09%
Russian SocialMediaCompany RUSS 200.00 77.66055 15,532.11$ 1% 0.2 194.15 1.25%
Emerging Economies Fund EMECF 1,009.56 55.34985538 55,879.00$ 5% 0.469 961.12 1.72%
Money MarketFunds MMFXX 17,842.89 1 30,000.00$ 2% 0.003 75.00 0.25%
Totals 1,232,716.41 100% 22,361.15 1.81%
Reaching Your Goals
Financial Independence
Financial independence is when you can maintain
your desired lifestyle for the remainder of your life
without the worry of money.
LIFESPAN
INCOME
PRODUCTIONCAPACITY
DESIRED LIFESTYLE
FINANCIAL INDEPENDENCE
FINANCIAL DEPENDENCE
Reaching Your Goals
“Whoever acquires knowledge but does not put it
to use is as one who plows but does not sow.”
-Sa’di

More Related Content

What's hot

Being financially smart employee
Being financially smart employeeBeing financially smart employee
Being financially smart employeeAhsan Saleem
 
Importance of Asset allocation in Wealth Creation
Importance of Asset allocation in Wealth CreationImportance of Asset allocation in Wealth Creation
Importance of Asset allocation in Wealth Creationaditya72
 
Choosing Investments for Your 401(k)
Choosing Investments for Your 401(k)Choosing Investments for Your 401(k)
Choosing Investments for Your 401(k)Allen Patin
 
Investing for the 21st Century
Investing for the 21st CenturyInvesting for the 21st Century
Investing for the 21st CenturyZoe Sexton MBA
 
Financial management(1)
Financial management(1)Financial management(1)
Financial management(1)chowdhury auni
 
Managing startup equity (Equity For Startups)
Managing startup equity (Equity For Startups)Managing startup equity (Equity For Startups)
Managing startup equity (Equity For Startups)Kesava Reddy
 
417Chapter 02
417Chapter 02417Chapter 02
417Chapter 02Rena Krouse
 
Investing in REITs.
Investing in REITs.Investing in REITs.
Investing in REITs.Karim Adatia
 
Dividend Decisions
Dividend DecisionsDividend Decisions
Dividend DecisionsDayasagar S
 
417Chapter 04
417Chapter 04417Chapter 04
417Chapter 04Rena Krouse
 
Applying Stats To Financial Planning 97 2003
Applying Stats To Financial Planning 97 2003Applying Stats To Financial Planning 97 2003
Applying Stats To Financial Planning 97 2003dennismfoley
 
Capital structure and its Determinants
     Capital structure and its Determinants     Capital structure and its Determinants
Capital structure and its DeterminantsMinhas Azeem
 

What's hot (16)

Being financially smart employee
Being financially smart employeeBeing financially smart employee
Being financially smart employee
 
Investment
Investment Investment
Investment
 
Importance of Asset allocation in Wealth Creation
Importance of Asset allocation in Wealth CreationImportance of Asset allocation in Wealth Creation
Importance of Asset allocation in Wealth Creation
 
Maximise your net worth
Maximise your net worthMaximise your net worth
Maximise your net worth
 
Jamal Path to Investing
Jamal Path to InvestingJamal Path to Investing
Jamal Path to Investing
 
Choosing Investments for Your 401(k)
Choosing Investments for Your 401(k)Choosing Investments for Your 401(k)
Choosing Investments for Your 401(k)
 
Investing for the 21st Century
Investing for the 21st CenturyInvesting for the 21st Century
Investing for the 21st Century
 
Financial management(1)
Financial management(1)Financial management(1)
Financial management(1)
 
Managing startup equity (Equity For Startups)
Managing startup equity (Equity For Startups)Managing startup equity (Equity For Startups)
Managing startup equity (Equity For Startups)
 
417Chapter 02
417Chapter 02417Chapter 02
417Chapter 02
 
Investing in REITs - Passive Real Estate Investing
Investing in REITs - Passive Real Estate InvestingInvesting in REITs - Passive Real Estate Investing
Investing in REITs - Passive Real Estate Investing
 
Investing in REITs.
Investing in REITs.Investing in REITs.
Investing in REITs.
 
Dividend Decisions
Dividend DecisionsDividend Decisions
Dividend Decisions
 
417Chapter 04
417Chapter 04417Chapter 04
417Chapter 04
 
Applying Stats To Financial Planning 97 2003
Applying Stats To Financial Planning 97 2003Applying Stats To Financial Planning 97 2003
Applying Stats To Financial Planning 97 2003
 
Capital structure and its Determinants
     Capital structure and its Determinants     Capital structure and its Determinants
Capital structure and its Determinants
 

Similar to Generational Wealth Management - Week 4

Investment Advice Proposal PowerPoint Presentation Slides
Investment Advice Proposal PowerPoint Presentation SlidesInvestment Advice Proposal PowerPoint Presentation Slides
Investment Advice Proposal PowerPoint Presentation SlidesSlideTeam
 
Berkshire Hathaway SP investment May 2020
Berkshire Hathaway SP investment May 2020Berkshire Hathaway SP investment May 2020
Berkshire Hathaway SP investment May 2020Corey Hulls
 
Brochure 1
Brochure 1Brochure 1
Brochure 1Robin Meece
 
Core Capabilities - 2011
Core Capabilities - 2011Core Capabilities - 2011
Core Capabilities - 2011Michael Etheridge
 
The new way to invest and save
The new way to invest and saveThe new way to invest and save
The new way to invest and saveBryan Daly
 
New Way To Invest
New Way To InvestNew Way To Invest
New Way To InvestBryan Daly
 
8 Timeless Principles of Investing
8 Timeless Principles of Investing8 Timeless Principles of Investing
8 Timeless Principles of InvestingBravias Financial
 
Investment Advisory PowerPoint Presentation Slides
Investment Advisory PowerPoint Presentation SlidesInvestment Advisory PowerPoint Presentation Slides
Investment Advisory PowerPoint Presentation SlidesSlideTeam
 
New perspectives on asset class investing
New perspectives on asset class investingNew perspectives on asset class investing
New perspectives on asset class investingRobUgiansky
 
Aboslute Capital Univ. Presentation
Aboslute Capital Univ. PresentationAboslute Capital Univ. Presentation
Aboslute Capital Univ. PresentationTerry Elder
 
NEW PRESENTATION
NEW PRESENTATIONNEW PRESENTATION
NEW PRESENTATIONPaul Fraker
 
The Capabilities of Foley and Foley Wealth Strategies
The Capabilities of Foley and Foley Wealth StrategiesThe Capabilities of Foley and Foley Wealth Strategies
The Capabilities of Foley and Foley Wealth Strategieslukefields1
 
Core Seminar
Core SeminarCore Seminar
Core Seminarguest31bc
 
Core Seminar
Core SeminarCore Seminar
Core Seminarguest31bc
 

Similar to Generational Wealth Management - Week 4 (20)

Investment Advice Proposal PowerPoint Presentation Slides
Investment Advice Proposal PowerPoint Presentation SlidesInvestment Advice Proposal PowerPoint Presentation Slides
Investment Advice Proposal PowerPoint Presentation Slides
 
Berkshire Hathaway SP investment May 2020
Berkshire Hathaway SP investment May 2020Berkshire Hathaway SP investment May 2020
Berkshire Hathaway SP investment May 2020
 
Brochure 1
Brochure 1Brochure 1
Brochure 1
 
Core Capabilities - 2011
Core Capabilities - 2011Core Capabilities - 2011
Core Capabilities - 2011
 
Basic strategy
Basic strategyBasic strategy
Basic strategy
 
The new way to invest and save
The new way to invest and saveThe new way to invest and save
The new way to invest and save
 
New Way To Invest
New Way To InvestNew Way To Invest
New Way To Invest
 
8 Timeless Principles of Investing
8 Timeless Principles of Investing8 Timeless Principles of Investing
8 Timeless Principles of Investing
 
Investment Advisory PowerPoint Presentation Slides
Investment Advisory PowerPoint Presentation SlidesInvestment Advisory PowerPoint Presentation Slides
Investment Advisory PowerPoint Presentation Slides
 
New perspectives on asset class investing
New perspectives on asset class investingNew perspectives on asset class investing
New perspectives on asset class investing
 
Investment Insights July 2017
Investment Insights July 2017Investment Insights July 2017
Investment Insights July 2017
 
Aboslute Capital Univ. Presentation
Aboslute Capital Univ. PresentationAboslute Capital Univ. Presentation
Aboslute Capital Univ. Presentation
 
Strong Women
Strong WomenStrong Women
Strong Women
 
Strong Women
Strong WomenStrong Women
Strong Women
 
Strong Women
Strong WomenStrong Women
Strong Women
 
NEW PRESENTATION
NEW PRESENTATIONNEW PRESENTATION
NEW PRESENTATION
 
Dbp protect trifold_brochure
Dbp protect trifold_brochureDbp protect trifold_brochure
Dbp protect trifold_brochure
 
The Capabilities of Foley and Foley Wealth Strategies
The Capabilities of Foley and Foley Wealth StrategiesThe Capabilities of Foley and Foley Wealth Strategies
The Capabilities of Foley and Foley Wealth Strategies
 
Core Seminar
Core SeminarCore Seminar
Core Seminar
 
Core Seminar
Core SeminarCore Seminar
Core Seminar
 

Recently uploaded

Alper Gobel In Media Res Media Component
Alper Gobel In Media Res Media ComponentAlper Gobel In Media Res Media Component
Alper Gobel In Media Res Media ComponentInMediaRes1
 
Sanyam Choudhary Chemistry practical.pdf
Sanyam Choudhary Chemistry practical.pdfSanyam Choudhary Chemistry practical.pdf
Sanyam Choudhary Chemistry practical.pdfsanyamsingh5019
 
mini mental status format.docx
mini    mental       status     format.docxmini    mental       status     format.docx
mini mental status format.docxPoojaSen20
 
Accessible design: Minimum effort, maximum impact
Accessible design: Minimum effort, maximum impactAccessible design: Minimum effort, maximum impact
Accessible design: Minimum effort, maximum impactdawncurless
 
Mastering the Unannounced Regulatory Inspection
Mastering the Unannounced Regulatory InspectionMastering the Unannounced Regulatory Inspection
Mastering the Unannounced Regulatory InspectionSafetyChain Software
 
Presiding Officer Training module 2024 lok sabha elections
Presiding Officer Training module 2024 lok sabha electionsPresiding Officer Training module 2024 lok sabha elections
Presiding Officer Training module 2024 lok sabha electionsanshu789521
 
ECONOMIC CONTEXT - LONG FORM TV DRAMA - PPT
ECONOMIC CONTEXT - LONG FORM TV DRAMA - PPTECONOMIC CONTEXT - LONG FORM TV DRAMA - PPT
ECONOMIC CONTEXT - LONG FORM TV DRAMA - PPTiammrhaywood
 
A Critique of the Proposed National Education Policy Reform
A Critique of the Proposed National Education Policy ReformA Critique of the Proposed National Education Policy Reform
A Critique of the Proposed National Education Policy ReformChameera Dedduwage
 
call girls in Kamla Market (DELHI) 🔝 >༒9953330565🔝 genuine Escort Service 🔝✔️✔️
call girls in Kamla Market (DELHI) 🔝 >༒9953330565🔝 genuine Escort Service 🔝✔️✔️call girls in Kamla Market (DELHI) 🔝 >༒9953330565🔝 genuine Escort Service 🔝✔️✔️
call girls in Kamla Market (DELHI) 🔝 >༒9953330565🔝 genuine Escort Service 🔝✔️✔️9953056974 Low Rate Call Girls In Saket, Delhi NCR
 
How to Configure Email Server in Odoo 17
How to Configure Email Server in Odoo 17How to Configure Email Server in Odoo 17
How to Configure Email Server in Odoo 17Celine George
 
Introduction to AI in Higher Education_draft.pptx
Introduction to AI in Higher Education_draft.pptxIntroduction to AI in Higher Education_draft.pptx
Introduction to AI in Higher Education_draft.pptxpboyjonauth
 
_Math 4-Q4 Week 5.pptx Steps in Collecting Data
_Math 4-Q4 Week 5.pptx Steps in Collecting Data_Math 4-Q4 Week 5.pptx Steps in Collecting Data
_Math 4-Q4 Week 5.pptx Steps in Collecting DataJhengPantaleon
 
Class 11 Legal Studies Ch-1 Concept of State .pdf
Class 11 Legal Studies Ch-1 Concept of State .pdfClass 11 Legal Studies Ch-1 Concept of State .pdf
Class 11 Legal Studies Ch-1 Concept of State .pdfakmcokerachita
 
Contemporary philippine arts from the regions_PPT_Module_12 [Autosaved] (1).pptx
Contemporary philippine arts from the regions_PPT_Module_12 [Autosaved] (1).pptxContemporary philippine arts from the regions_PPT_Module_12 [Autosaved] (1).pptx
Contemporary philippine arts from the regions_PPT_Module_12 [Autosaved] (1).pptxRoyAbrique
 
“Oh GOSH! Reflecting on Hackteria's Collaborative Practices in a Global Do-It...
“Oh GOSH! Reflecting on Hackteria's Collaborative Practices in a Global Do-It...“Oh GOSH! Reflecting on Hackteria's Collaborative Practices in a Global Do-It...
“Oh GOSH! Reflecting on Hackteria's Collaborative Practices in a Global Do-It...Marc Dusseiller Dusjagr
 
Presentation by Andreas Schleicher Tackling the School Absenteeism Crisis 30 ...
Presentation by Andreas Schleicher Tackling the School Absenteeism Crisis 30 ...Presentation by Andreas Schleicher Tackling the School Absenteeism Crisis 30 ...
Presentation by Andreas Schleicher Tackling the School Absenteeism Crisis 30 ...EduSkills OECD
 

Recently uploaded (20)

9953330565 Low Rate Call Girls In Rohini Delhi NCR
9953330565 Low Rate Call Girls In Rohini  Delhi NCR9953330565 Low Rate Call Girls In Rohini  Delhi NCR
9953330565 Low Rate Call Girls In Rohini Delhi NCR
 
Staff of Color (SOC) Retention Efforts DDSD
Staff of Color (SOC) Retention Efforts DDSDStaff of Color (SOC) Retention Efforts DDSD
Staff of Color (SOC) Retention Efforts DDSD
 
Alper Gobel In Media Res Media Component
Alper Gobel In Media Res Media ComponentAlper Gobel In Media Res Media Component
Alper Gobel In Media Res Media Component
 
Sanyam Choudhary Chemistry practical.pdf
Sanyam Choudhary Chemistry practical.pdfSanyam Choudhary Chemistry practical.pdf
Sanyam Choudhary Chemistry practical.pdf
 
mini mental status format.docx
mini    mental       status     format.docxmini    mental       status     format.docx
mini mental status format.docx
 
Accessible design: Minimum effort, maximum impact
Accessible design: Minimum effort, maximum impactAccessible design: Minimum effort, maximum impact
Accessible design: Minimum effort, maximum impact
 
Model Call Girl in Bikash Puri Delhi reach out to us at 🔝9953056974🔝
Model Call Girl in Bikash Puri  Delhi reach out to us at 🔝9953056974🔝Model Call Girl in Bikash Puri  Delhi reach out to us at 🔝9953056974🔝
Model Call Girl in Bikash Puri Delhi reach out to us at 🔝9953056974🔝
 
Mastering the Unannounced Regulatory Inspection
Mastering the Unannounced Regulatory InspectionMastering the Unannounced Regulatory Inspection
Mastering the Unannounced Regulatory Inspection
 
Presiding Officer Training module 2024 lok sabha elections
Presiding Officer Training module 2024 lok sabha electionsPresiding Officer Training module 2024 lok sabha elections
Presiding Officer Training module 2024 lok sabha elections
 
ECONOMIC CONTEXT - LONG FORM TV DRAMA - PPT
ECONOMIC CONTEXT - LONG FORM TV DRAMA - PPTECONOMIC CONTEXT - LONG FORM TV DRAMA - PPT
ECONOMIC CONTEXT - LONG FORM TV DRAMA - PPT
 
A Critique of the Proposed National Education Policy Reform
A Critique of the Proposed National Education Policy ReformA Critique of the Proposed National Education Policy Reform
A Critique of the Proposed National Education Policy Reform
 
call girls in Kamla Market (DELHI) 🔝 >༒9953330565🔝 genuine Escort Service 🔝✔️✔️
call girls in Kamla Market (DELHI) 🔝 >༒9953330565🔝 genuine Escort Service 🔝✔️✔️call girls in Kamla Market (DELHI) 🔝 >༒9953330565🔝 genuine Escort Service 🔝✔️✔️
call girls in Kamla Market (DELHI) 🔝 >༒9953330565🔝 genuine Escort Service 🔝✔️✔️
 
How to Configure Email Server in Odoo 17
How to Configure Email Server in Odoo 17How to Configure Email Server in Odoo 17
How to Configure Email Server in Odoo 17
 
Introduction to AI in Higher Education_draft.pptx
Introduction to AI in Higher Education_draft.pptxIntroduction to AI in Higher Education_draft.pptx
Introduction to AI in Higher Education_draft.pptx
 
_Math 4-Q4 Week 5.pptx Steps in Collecting Data
_Math 4-Q4 Week 5.pptx Steps in Collecting Data_Math 4-Q4 Week 5.pptx Steps in Collecting Data
_Math 4-Q4 Week 5.pptx Steps in Collecting Data
 
Class 11 Legal Studies Ch-1 Concept of State .pdf
Class 11 Legal Studies Ch-1 Concept of State .pdfClass 11 Legal Studies Ch-1 Concept of State .pdf
Class 11 Legal Studies Ch-1 Concept of State .pdf
 
CĂłdigo Creativo y Arte de Software | Unidad 1
CĂłdigo Creativo y Arte de Software | Unidad 1CĂłdigo Creativo y Arte de Software | Unidad 1
CĂłdigo Creativo y Arte de Software | Unidad 1
 
Contemporary philippine arts from the regions_PPT_Module_12 [Autosaved] (1).pptx
Contemporary philippine arts from the regions_PPT_Module_12 [Autosaved] (1).pptxContemporary philippine arts from the regions_PPT_Module_12 [Autosaved] (1).pptx
Contemporary philippine arts from the regions_PPT_Module_12 [Autosaved] (1).pptx
 
“Oh GOSH! Reflecting on Hackteria's Collaborative Practices in a Global Do-It...
“Oh GOSH! Reflecting on Hackteria's Collaborative Practices in a Global Do-It...“Oh GOSH! Reflecting on Hackteria's Collaborative Practices in a Global Do-It...
“Oh GOSH! Reflecting on Hackteria's Collaborative Practices in a Global Do-It...
 
Presentation by Andreas Schleicher Tackling the School Absenteeism Crisis 30 ...
Presentation by Andreas Schleicher Tackling the School Absenteeism Crisis 30 ...Presentation by Andreas Schleicher Tackling the School Absenteeism Crisis 30 ...
Presentation by Andreas Schleicher Tackling the School Absenteeism Crisis 30 ...
 

Generational Wealth Management - Week 4

  • 1. Wealth Management An Unbiased Approach to Managing Your Investments Designed for the Affluent Investor
  • 2. Wealth Management Process Week 4: Managing Your Investments Manager Selection Financial Advisor Implementation Investment Policy Performance Monitoring
  • 3. Methods Implementation Methods: Lump-Sum Investing Dollar-Cost Averaging Modified Dollar-Cost Averaging Modified DCA differs from normal DCA in that it takes movements in the market into consideration. DCA does not assure a profit and does not protect against loss in declining markets. Such a plan involves continuous investment in securities regardless of fluctuating price levels and and investor should consider their financial ability to continue their purchases through periods of low price levels.
  • 4. Methods Calling the bottom is impossible (Review) Boston Globe, Aug 12, 2000 - "…at these undervalued prices…we're not selling any stock at these prices". (On Monday, Aug 14, the S&P 500 closed at 1491. Four years later on Aug 12 2004, the S&P fell a further 29% to close at 1063.) Wired Magazine, Dec 4, 2000 - "Fred Siegel, president of investment management firm Siegel Group, believes that it is unlikely that the Nasdaq will drop more than another 200 points." (The Nasdaq fell over 1,000 points shortly after Siegel made his prediction.) Market guru and former hedge fund manager Jim Cramer of TheStreet.com said it well in Jan 2001: “I get paid to call bottoms. I don't see one yet, but in my 18 years of trading I've never called one exactly right yet. I don't see why this time will be any different." DCA does not assure a profit and does not protect against loss in declining markets. Such a plan involves continuous investment in securities regardless of fluctuating price levels and and investor should consider their financial ability to continue their purchases through periods of low price levels.
  • 5. Methods DCA vs. Lump Sum Investing A couple has $500,000 to invest. What are the possible ways to invest and what are the possible outcomes? DOLLAR COST AVERAGING LUMP SUM INVESTING Declining Market Bound Market Increasing Market ? ? ? ? ? ?
  • 6. DCA vs. Lump Sum Investing Dollar Cost Averaging Example: Declining Market DATE TOTAL VALUE 2000.00 2222.22 2500.00 2857.14 3333.33 $50.00 $45.00 $40.00 $35.00 $30.00 TOTAL $100,000 $100,000 $100,000 $100,000 $100,000 $500,000 2000.00 4222.22 6722.22 9579.37 12912.70 12912.70 $100,000.00 $190,000.00 $268,888.89 $335,277.78 $387,380.95 $387,380.95 PRICE TOTAL SHARES OWNED SHARES PURCHASED DOLLAR AMOUNT INVESTED PRICES ARE DECREASING 01/01/13 02/01/13 03/01/13 04/01/13 05/01/13
  • 7. DCA vs. Lump Sum Investing Dollar Cost Averaging Example: Declining Market YOUR AVERAGE COST IS ACTUALLY LOWER THAN THE AVERAGE PRICE Average Price of XYZ Average Cost of XYZ Your Average Cost $40.00 $38.72 $1.28 less than average price
  • 8. DCA vs. Lump Sum Investing …vs. Lump Sum Investing: Declining Market DATE TOTAL VALUE (LUMP SUM) $50.00 $45.00 $40.00 $35.00 $30.00 TOTAL $500,000 0 0 0 0 10,000.00 10,000.00 10,000.00 10,000.00 10,000.00 $500,000.00 $450,000.00 $400,000.00 $350,000.00 $300,000.00 $300,000.00 PRICE TOTAL SHARES OWNED DOLLAR AMOUNT INVESTED PRICES ARE DECREASING TOTAL VALUE (DCA) $100,000.00 $190,000.00 $268,888.89 $335,277.78 $387,380.95 $387,380.95 01/01/13 02/01/13 03/01/13 04/01/13 05/01/13
  • 9. DCA vs. Lump Sum Investing Dollar Cost Averaging Example: Bound Market DATE TOTAL VALUE 2000.00 2222.22 1818.18 2000.00 2000.00 $50.00 $45.00 $55.00 $50.00 $50.00 TOTAL $100,000 $100,000 $100,000 $100,000 $100,000 $500,000 2000.00 4222.22 6040.40 8040.40 10040.40 10040.40 $100,000.00 $190,000.00 $332,222.22 $402,020.20 $502,020.20 $502,020.20 PRICE TOTAL SHARES OWNED SHARES PURCHASED DOLLAR AMOUNT INVESTED PRICES ARE FLUCTUATING 01/01/13 02/01/13 03/01/13 04/01/13 05/01/13
  • 10. DCA vs. Lump Sum Investing Dollar Cost Averaging Example: Bound Market YOUR AVERAGE COST IS SIMILAR TO THE AVERAGE PRICE Average Price of XXX Average Cost of XXX Your Average Cost $50.00 $49.80 $0.20 less than average price
  • 11. DCA vs. Lump Sum Investing …vs. Lump Sum Investing: Bound Market DATE TOTAL VALUE (LUMP SUM) 01/01/13 02/01/13 03/01/13 04/01/13 05/01/13 $50.00 $45.00 $55.00 $50.00 $50.00 TOTAL $500,000 0 0 0 0 10,000.00 10,000.00 10,000.00 10,000.00 10,000.00 $500,000.00 $450,000.00 $550,000.00 $500,000.00 $500,000.00 $500,000.00 PRICE TOTAL SHARES OWNED DOLLAR AMOUNT INVESTED PRICES ARE FLUCTUATING TOTAL VALUE (DCA) $100,000.00 $190,000.00 $322,222.22 $402,020.20 $502,020.20 $502,020.20
  • 12. DCA vs. Lump Sum Investing Dollar Cost Averaging Example: Increasing Market DATE TOTAL VALUE 2000.00 1818.18 1666.67 1538.46 1428.57 $50.00 $55.00 $60.00 $65.00 $70.00 TOTAL $100,000 $100,000 $100,000 $100,000 $100,000 $500,000 2000.00 3818.18 5484.85 7023.31 8541.88 8541.88 $100,000.00 $210,000.00 $329,090.91 $456,515.15 $591,631.70 $591.631.70 PRICE TOTAL SHARES OWNED SHARES PURCHASED DOLLAR AMOUNT INVESTED PRICES ARE INCREASING 01/01/13 02/01/13 03/01/13 04/01/13 05/01/13
  • 13. DCA vs. Lump Sum Investing Dollar Cost Averaging Example: Increasing Market YOUR AVERAGE COST IS ACTUALLY STILL LOWER THAN THE AVERAGE PRICE OF THE STOCK Average Price of XXX Average Cost of XXX Your Average Cost $60.00 $58.54 $1.46 less than average price
  • 14. DCA vs. Lump Sum Investing …vs. Lump Sum Investing: Increasing Market DATE TOTAL VALUE (LUMP SUM) $50.00 $55.00 $60.00 $65.00 $70.00 TOTAL $500,000 0 0 0 0 10,000.00 10,000.00 10,000.00 10,000.00 10,000.00 $500,000.00 $550,000.00 $600,000.00 $650,000.00 $700,000.00 $700,000.00 PRICE TOTAL SHARES OWNED DOLLAR AMOUNT INVESTED PRICES ARE INCREASING TOTAL VALUE (DCA) $100,000.00 $210,000.00 $329,090.91 $456,515.15 $591,631.70 $591.631.70 01/01/13 02/01/13 03/01/13 04/01/13 05/01/13
  • 15. DCA vs. Lump Sum Investing Conclusion LUMP SUM INVESTING Declining Market Bound Market Increasing Market $387,381 $502,050 $618,506 $300,000 $500,000 $700,000 DOLLAR COST AVERAGING Does lump sum investing have a higher risk and higher reward? FOOD FOR THOUGHT A couple has $500,000 to invest. What are the possible ways to invest and what are the possible outcomes?
  • 16. Louie the Loser Think you have bad timing? Meet Louie the Loser© American Funds Distributors, Inc.
  • 17. Louie the Loser He cancelled his dental insurance the day before his root canal flared up. His vacation in the desert was rained out. He misses planes but catches colds. Why is he so happy? © American Funds Distributors, Inc.
  • 18. Louie the Loser Starting in 1987, invested $10,000 a year in a large cap fund Invested for 20 Years Chose the Worst Day Each Year — Market High Total Investment: $200,000 © American Funds Distributors, Inc.
  • 19. Louie the Loser …20 years later $10,000 a year, starting in 1987: Worst-day investments (market highs) Account value $637,185 Average annual total return 10.7% Best-day investments (market lows) Account value $772,705 Average annual total return 12.0% Market highs and lows based on Dow Jones Industrial Average. Cumulative volume discount applied when appropriate. Figures are past results and are not predictive of results in future periods. Current and future results may be lower or higher than those shown. Share prices and returns will vary, so you may lose money. Fund results are for Class A shares and reflect deduction of maximum sales charge (5.75%). © American Funds Distributors, Inc.
  • 20. What We Know for Sure It’s time in, not timing, the market that counts © American Funds Distributors, Inc. AI-20069
  • 21. Wealth Management Process CLASS 4: Managing Your Investments Manager Selection Financial Advisor Implementation Investment Policy Performance Monitoring
  • 22. Investment Professionals Investment Advisors Financial Advisors Financial Planners Financial Consultants Stock Brokers Discount Brokers Relationship Managers
  • 23. Investment Professionals Investment Professionals Assets vs. Transactions Fees vs. Commissions Counseling vs. Selling Process vs. Product
  • 24. Investment Professionals A good financial advisor should have the following three characteristics: Integrity Intelligence Motivation
  • 25. Investment Professionals What should you look for in an advisor? Level of Education Types of Clients Industry Experience Professional Memberships Applicable Market Knowledge Ability to Educate You
  • 26. Investment Professionals Sample Questions How many client relationships do you have? Describe your ideal client? What is your specialty? Do you hold any professional designations? Do you use an investment policy statement with your clients? May I see an example of an investment policy statement that you use? Describe the process you use with clients. Which responsibilities do you handle personally and which do you delegate? How do you evaluate performance? What performance should I expect from my investments? What level of risk/volatility should I expect?
  • 27. Investment Professionals Sample Questions Continued… How do you select managers, funds or individual stocks for my portfolio? What is your disciplinary record? How would I fit into your practice? What level of communication should I expect? Do you employ options and/or future strategies? How many brokerage firms have you worked for? If firm has been changed in the past 5 years, why did you change firms? What would you like to be doing in five years? Describe everything that I would be paying for to accomplish the investment programs you advise. Include commissions, expenses, account fees, transaction fees, 12b-1 fees, maintenance fees, etc.
  • 28. Investment Professionals The Stages of Service Evaluate current situations (every 12 months) Determine goals and objectives (every 12-24 months) Determine risk tolerance Asset allocation analysis (every 90 days) Manager and manager comparison analysis (every 90 days) Timing Tax issues (every 12 months) Will, Trusts, FLLC (3-5 years) Insurance (every 12 months) Monitoring (every 90 days) Rebalancing (every 90 days)
  • 29. Investment Professionals The Stages of Service EVERY 90 DAYS ANNUALLY EVERY 12-24 MONTHS EVERY 3-5 YEARS YEARS 0 1 2 3 4 ASSET ALLOCATION ANALYSIS MANAGER COMPARISON ANALYSIS MONITORING REBALANCING EVALUATE CURRENT SITUATION TAX ISSUES INSURANCE DETERMINE GOALS & OBJECTIVES WILL, TRUSTS, FLLC
  • 30. Investment Professionals Things to look out for: Trigger words like “Guarantee” or absolute terms like “never” Promising wealth without risk Margin or other leverage Extensive timing schemes Concentration in single stock, asset class, etc.
  • 31. Investment Professionals How do I check my investment advisor’s securities disciplinary record? Request from the Financial Industry Regulatory Authority (FINRA) a disciplinary record for your broker at: http://www.finra.org/Investors/ToolsCalculators/BrokerCheck/
  • 32. Wealth Management Process CLASS 4: Managing Your Investments Manager Selection Financial Advisor Implementation Investment Policy Performance Monitoring
  • 33. Wealth Management Process Implementation Depending on the nature of your investment management team, some or all of the implementation process may be your responsibility. An experienced financial planning professional will likely have experience and expertise to provide advice in each “Stage of Service”; yet, they may not be able to give tax or legal advice without the proper licensure. In this case, they may be able to act as a quarterback for your professional “Circle of Trust”. YOU CPA / Accountant Insurance Agent Attorney Financial Planner Personal Banker
  • 34. Wealth Management Process CLASS 4: Managing Your InvestmentsManager Selection Financial Advisor Implementation Investment Policy Performance Monitoring
  • 35. The Investment Policy Statement What is an IPS? The means for turning your vision into reality. It is a living document that guides all investment decisions. Establishes a clear understanding between decision makers. Provides a meaningful basis for the evaluation. Enables the client, the advisor and portfolio managers to protect the fund from ad hoc revisions of sound long-term policy when short-term exigencies are most distressing and the policy is in doubt.
  • 36. The Investment Policy Statement Why is it important to develop an IPS? Puts structure to your goals Manager or Broker Succession Control Emotional Decisions Identifies Responsibilities Determine Asset Allocation Sets Up Performance Measurement Criteria
  • 37. The Investment Policy Statement Do I need an Investment Policy Statement? 1. What rate of return have your investments achieved over the last three years? Last five years? 2. How are the returns calculated? 3. Are you a fiduciary? 4. What procedures do you use to select your investments and/or your investment managers (or funds)? 5. What is your investment allocation? 6. What system, if any, do you use to time the market or to rebalance your portfolio? 7. What asset classes are permitted for your use? Which are restricted?
  • 38. The Investment Policy Statement Do I need an Investment Policy Statement? 8. What is your target rate of return and how was it determined? Is it a nominal rate or in relation to some benchmark, such as inflation or the S&P 500? 9. What level of risk is acceptable to you and how do you qualify that? 10. How much liquidity is required for your portfolio and how do you determine that level? If your response to any of the above was “I don’t know,” your answer was less than clear, or if you answered “yes” to question 3, then you need an Investment Policy Statement and this section of the class is intended for you.
  • 39. The Investment Policy Statement Q: Who is Responsible for its Development? A: The Client and the Investment Professional! For the Client, it serves the useful purpose of requiring thinking about preferences and expectations with respect to the market. For the Investment Professional, an IPS provides the basis for recommendations and for investment decisions in situations of uncertainty.
  • 40. The Investment Policy Statement Client Responsibilities Communicate your goals Determine your time horizon Gather personal financial data Consolidate holdings Know your fees and expenses Determine you risk tolerance
  • 41. The Investment Policy Statement Investment Professional Responsibilities Help in determining your risk tolerance Help determine long term goals Provide asset allocation recommendations Explain what appropriate fees and expenses should be Help select appropriate managers Set standards for performance reporting
  • 42. The Investment Policy Statement Seven Elements of a Well Constructed IPS 1. Executive Summary/Statement of Purpose 2. Investment Goals and Objectives 3. Statement of Responsibility 4. Investment Guidelines 5. Asset Mix Guidelines 6. Communication 7. Performance Review and Evaluation
  • 43. The Investment Policy Statement 1. Executive Summary/Statement of Purpose This section lays out the groundwork for the rest of the document. It first answers the question, “Who are you?” Next, it describes your broad aims. It also documents the intended purpose of the financial assets considered in the portfolio design. An explanation of the purpose of the IPS, objectives, and legal structure. The size of the portfolio, future payment information, and disbursement schedules. The tax status of the portfolio. A description of participant demographics. TO BE INCLUDED: Source: The Complete Guide to Managing a Portfolio of Mutual Funds, by Ronald K. Rutherford.
  • 44. The Investment Policy Statement 2. Statement of Responsibility This section describes the related parties involved in the IPS design and implementation process. It includes the investment advisor and the custodian. It may also include others such as the co-trustee, an auditor of the records, and those rendering tax and legal advice about the IPS. Source: The Complete Guide to Managing a Portfolio of Mutual Funds, by Ronald K. Rutherford.
  • 45. The Investment Policy Statement 3. Investment Goals and Objectives Time Horizon Risk Tolerance Asset Class Preferences Expected or Desired Rate of Return Lifestyle needs
  • 46. The Investment Policy Statement 4. Investment Guidelines Guidelines are established to identify the parameters within the investment strategy. This section is the appropriate place to articulate concerns and expectations, and acknowledge the uncertainties of investing in the capital markets. This section should include restrictions including prohibited transactions.
  • 47. The Investment Policy Statement 5. Asset Mix Guidelines Asset mix guidelines can include restrictions placed by the client or client circumstances on securities or investment categories. This is also the place to document restrictions suggested by the advisor. For example, an unrestricted asset allocation model may assign all financial assets to two or three categories or asset classes.
  • 48. The Investment Policy Statement 6. Communication Example-Investment Manager(s) Communication with the Trustees Provide monthly statements, quarterly portfolio valuations and transaction listings Meet at least (quarterly, semi-annually, annually) Review past investment performance, evaluate the current investment outlook, and discuss investment strategy Provide information regarding major changes in investment policy that may result in major investment strategy changes.
  • 49. The Investment Policy Statement 7. Performance Review 1. Up is good, Down is bad 2. Performance at or above goal 3. Performance within volatility tolerance 4. Relative Performance 5. Trend of Performance vs. Goal
  • 51.
  • 52.
  • 53.
  • 54.
  • 55.
  • 56.
  • 57.
  • 58.
  • 59.
  • 60.
  • 62. Sample Portfolio Review Client: John & Jane Adams Period: 3/26/2012-3/26/2013 *IMPORTANT: All Investment Names, Indices, Performance Data, and Allocations are fake and do not represent any true investment and should not be considered investment advice.
  • 63. Activity Summary Period YTD Beginning Market Value (Including Bond Accrual) 1,053,842.89$ 1,153,551.35$ Contributions 40,000.00$ 10,000.00$ Distributions -$ -$ Transfer In/Out 50,000.00$ -$ Dividends and Interest 5,346.29$ 1,537.55$ Miscellaneous Charges (320.55)$ (85.00)$ Advisory Fees Paid (5,062.87)$ (1,255.20)$ Bond Accrual 160.00$ 50.00$ Market Value Increase/Decrease 88,750.65$ 68,917.71$ Ending Market Value (Including Bond Accrual) 1,232,716.41$ 1,232,716.41$ Gross Performance 8.433% 5.996% Returnsare GrossofFees, First 12 Month Returnsnot Annualized
  • 64. Allocation Summary $ % 459,756.00$ 37.3% 536,493.10$ 43.5% 150,588.31$ 12.2% 55,879.00$ 4.5% 30,000.00$ 2.4% Asset Category US Fixed Income US Equity International Emerging Markets Cash & Equivalents Check Actual % Compare to Target % Rebalance
  • 65. ConsolidatedHoldings Name Symbol Quantity Beginning $ Amount Price (3/25/13) Ending $ Amount Position Performance Portfolio Composition Category XYZIntermediateBondFund VWXYZ 2,015.55 250000 133.24$ 268,554.12$ 7.42% 22% USFixedIncome ConvertibleBondFund BBBBB 1,500.20 30000 22.15$ 33,232.46$ 10.77% 3% USFixedIncome LMNOPMortgageBackedSecurityFund LMNOP 1,011.55 50000 55.80$ 56,446.21$ 12.89% 5% USFixedIncome MunicipalBondFund MUNIB 788.55 100000 128.75$ 101,523.21$ 1.52% 8% USFixedIncome Benchmark:USAggregateBondIndex 7.20% GenerixGrowthFund GGROW 2,525.00 200000 115.25$ 291,005.45$ 20.50% 24% USEquity HighDividendValueFund VALEW 3,112.55 200000 74.85$ 232,987.65$ 16.49% 19% USEquity SprinklerCompanyofAmericaStock SCA 150.00 20000 83.33$ 12,500.00$ -37.50% 1% USEquity Benchmark:USLargeCapEquityIndex 15.30% GlobalEx-USALargeCapEquityFund GLOBE 4,005.33 120000 33.72$ 135,056.20$ 12.55% 11% InternationalEquity RussianSocialMediaCompany RUSS 200.00 15000 77.66$ 15,532.11$ 3.55% 1% InternationalEquity Benchmark:InternationalEquityIndex 9.60% EmergingEconomies Fund EMECF 1,009.56 50000 55.35$ 55,879.00$ 11.76% 5% EmergingMarkets Equity Benchmark:EmergingMarketsEquityIndex 10.50% MoneyMarketFunds MMFXX 17,842.89 18842.89 1.00$ 30,000.00$ 0.00% 2% Cash&Equivalents 1,053,842.89$ 1,232,716.41$ 8.43% 100% Class 2 Flashback: Most Returns are Derived from Asset Allocation, make sure to track the performance of your individual investments vs. the Benchmark for that asset class.
  • 66. Index Comparison - Returns areGross of Fees - First 12 Month Returns arenot annualized Period(3/26/12- 3/26/13) QTD YTD 1 Year 3 Year 5 Year 10 Year Inception Client Portfolio 8.43% 5.99% 0.0599 8.43% 5.51% 3.78% 5.75% 6.22% BenchmarkPortfolio* 6.25% 4.75% 0.0475 6.25% 5.60% 3.90% 4.50% 5.26% *50%USLargeCapIndex /10%International EquityIndex /40%Aggregate BondIndex Portfolio Value vs. Benchmark Since Inception -It can be easy to focus on how your portfolio compared to popular indices, like the S&P 500, but your portfolio’s benchmark should be blended based off your target risk and return profile.
  • 67. Account Detail - John Smith IRA Name Symbol Quantity Beginning $ Amount Price (3/25/13) Ending $ Amount Portfolio Composition Category XYZ IntermediateBond Fund VWXYZ 2015.55 250,000.00$ 133.24$ 268,554.12$ 22% US Fixed Income Sprinkler Company of America Stock SCA 150 20,000.00$ 83.33$ 12,500.00$ 1% US Equity Russian Social Media Company RUSS 200 15,000.00$ 77.66$ 15,532.11$ 1% International Equity Emerging Economies Fund EMECF 1009.56 50,000.00$ 55.35$ 55,879.00$ 5% Emerging Markets Equity 335,000.00$ 352,465.23$ 29% Account Detail - John and Betty Smith Joint Tenants with ROS Name Symbol Quantity Beginning $ Amount Price (3/25/13) Ending $ Amount Portfolio Composition Category ConvertibleBond Fund BBBBB 1500.2 30,000.00$ 22.15$ 33,232.46$ 3% US Fixed Income LMNOP Mortgage Backed Security Fund LMNOP 1011.55 50,000.00$ 55.80$ 56,446.21$ 5% US Fixed Income Municipal Bond Fund MUNIB 788.55 100,000.00$ 128.75$ 101,523.21$ 8% US Fixed Income Generix Growth Fund GGROW 2525 200,000.00$ 115.25$ 291,005.45$ 24% US Equity High Dividend ValueFund VALEW 3112.55 200,000.00$ 74.85$ 232,987.65$ 19% US Equity Global Ex-USA LargeCap Equity Fund GLOBE 4005.33 120,000.00$ 33.72$ 135,056.20$ 11% International Equity Money Market Funds MMFXX 17842.89 18,842.89$ 1.00$ 30,000.00$ 2% Cash & Equivalents 718,842.89$ 880,251.18$ 71% -Some investments make more sense to be in certain types of accounts. Higher cash balances in taxable checkwriting accounts, tax-advantaged investments in taxable accounts, high-income investments in non- taxable accounts, etc.
  • 68. -Income generation and cash flow can be extremely important, depending on where you are in your financial life cycle. Many reports will estimate future income based off of current yield figures. Estimated Income Asset Symbol Quantity Price (3/25/13) Current Value % ofAssets Annual Income Rate Annual Income Total Current Yield XYZ IntermediateBondFund VWXYZ 2,015.55 133.2411104 268,554.12$ 22% 0.34 8,190.90 3.05% ConvertibleBondFund BBBBB 1,500.20 22.15201973 33,232.46$ 3% 0.098 186.10 0.56% LMNOP MortgageBacked Security Fund LMNOP 1,011.55 55.80170036 56,446.21$ 5% 0.35 1,749.83 3.10% MunicipalBondFund MUNIB 788.55 128.7466996 101,523.21$ 8% 0.22 2,791.89 2.75% GenerixGrowth Fund GGROW 2,525.00 115.2496832 291,005.45$ 24% 0.282 2,240.74 0.77% High Dividend ValueFund VALEW 3,112.55 74.8542674 232,987.65$ 19% 0.394 3,098.74 1.33% Sprinkler Company of AmericaStock SCA 150.00 83.33333333 12,500.00$ 1% 0.075 50.00 0.40% GlobalEx-USALargeCap Equity Fund GLOBE 4,005.33 33.71911927 135,056.20$ 11% 0.355 2,822.67 2.09% Russian SocialMediaCompany RUSS 200.00 77.66055 15,532.11$ 1% 0.2 194.15 1.25% Emerging Economies Fund EMECF 1,009.56 55.34985538 55,879.00$ 5% 0.469 961.12 1.72% Money MarketFunds MMFXX 17,842.89 1 30,000.00$ 2% 0.003 75.00 0.25% Totals 1,232,716.41 100% 22,361.15 1.81%
  • 69. Reaching Your Goals Financial Independence Financial independence is when you can maintain your desired lifestyle for the remainder of your life without the worry of money. LIFESPAN INCOME PRODUCTIONCAPACITY DESIRED LIFESTYLE FINANCIAL INDEPENDENCE FINANCIAL DEPENDENCE
  • 70. Reaching Your Goals “Whoever acquires knowledge but does not put it to use is as one who plows but does not sow.” -Sa’di