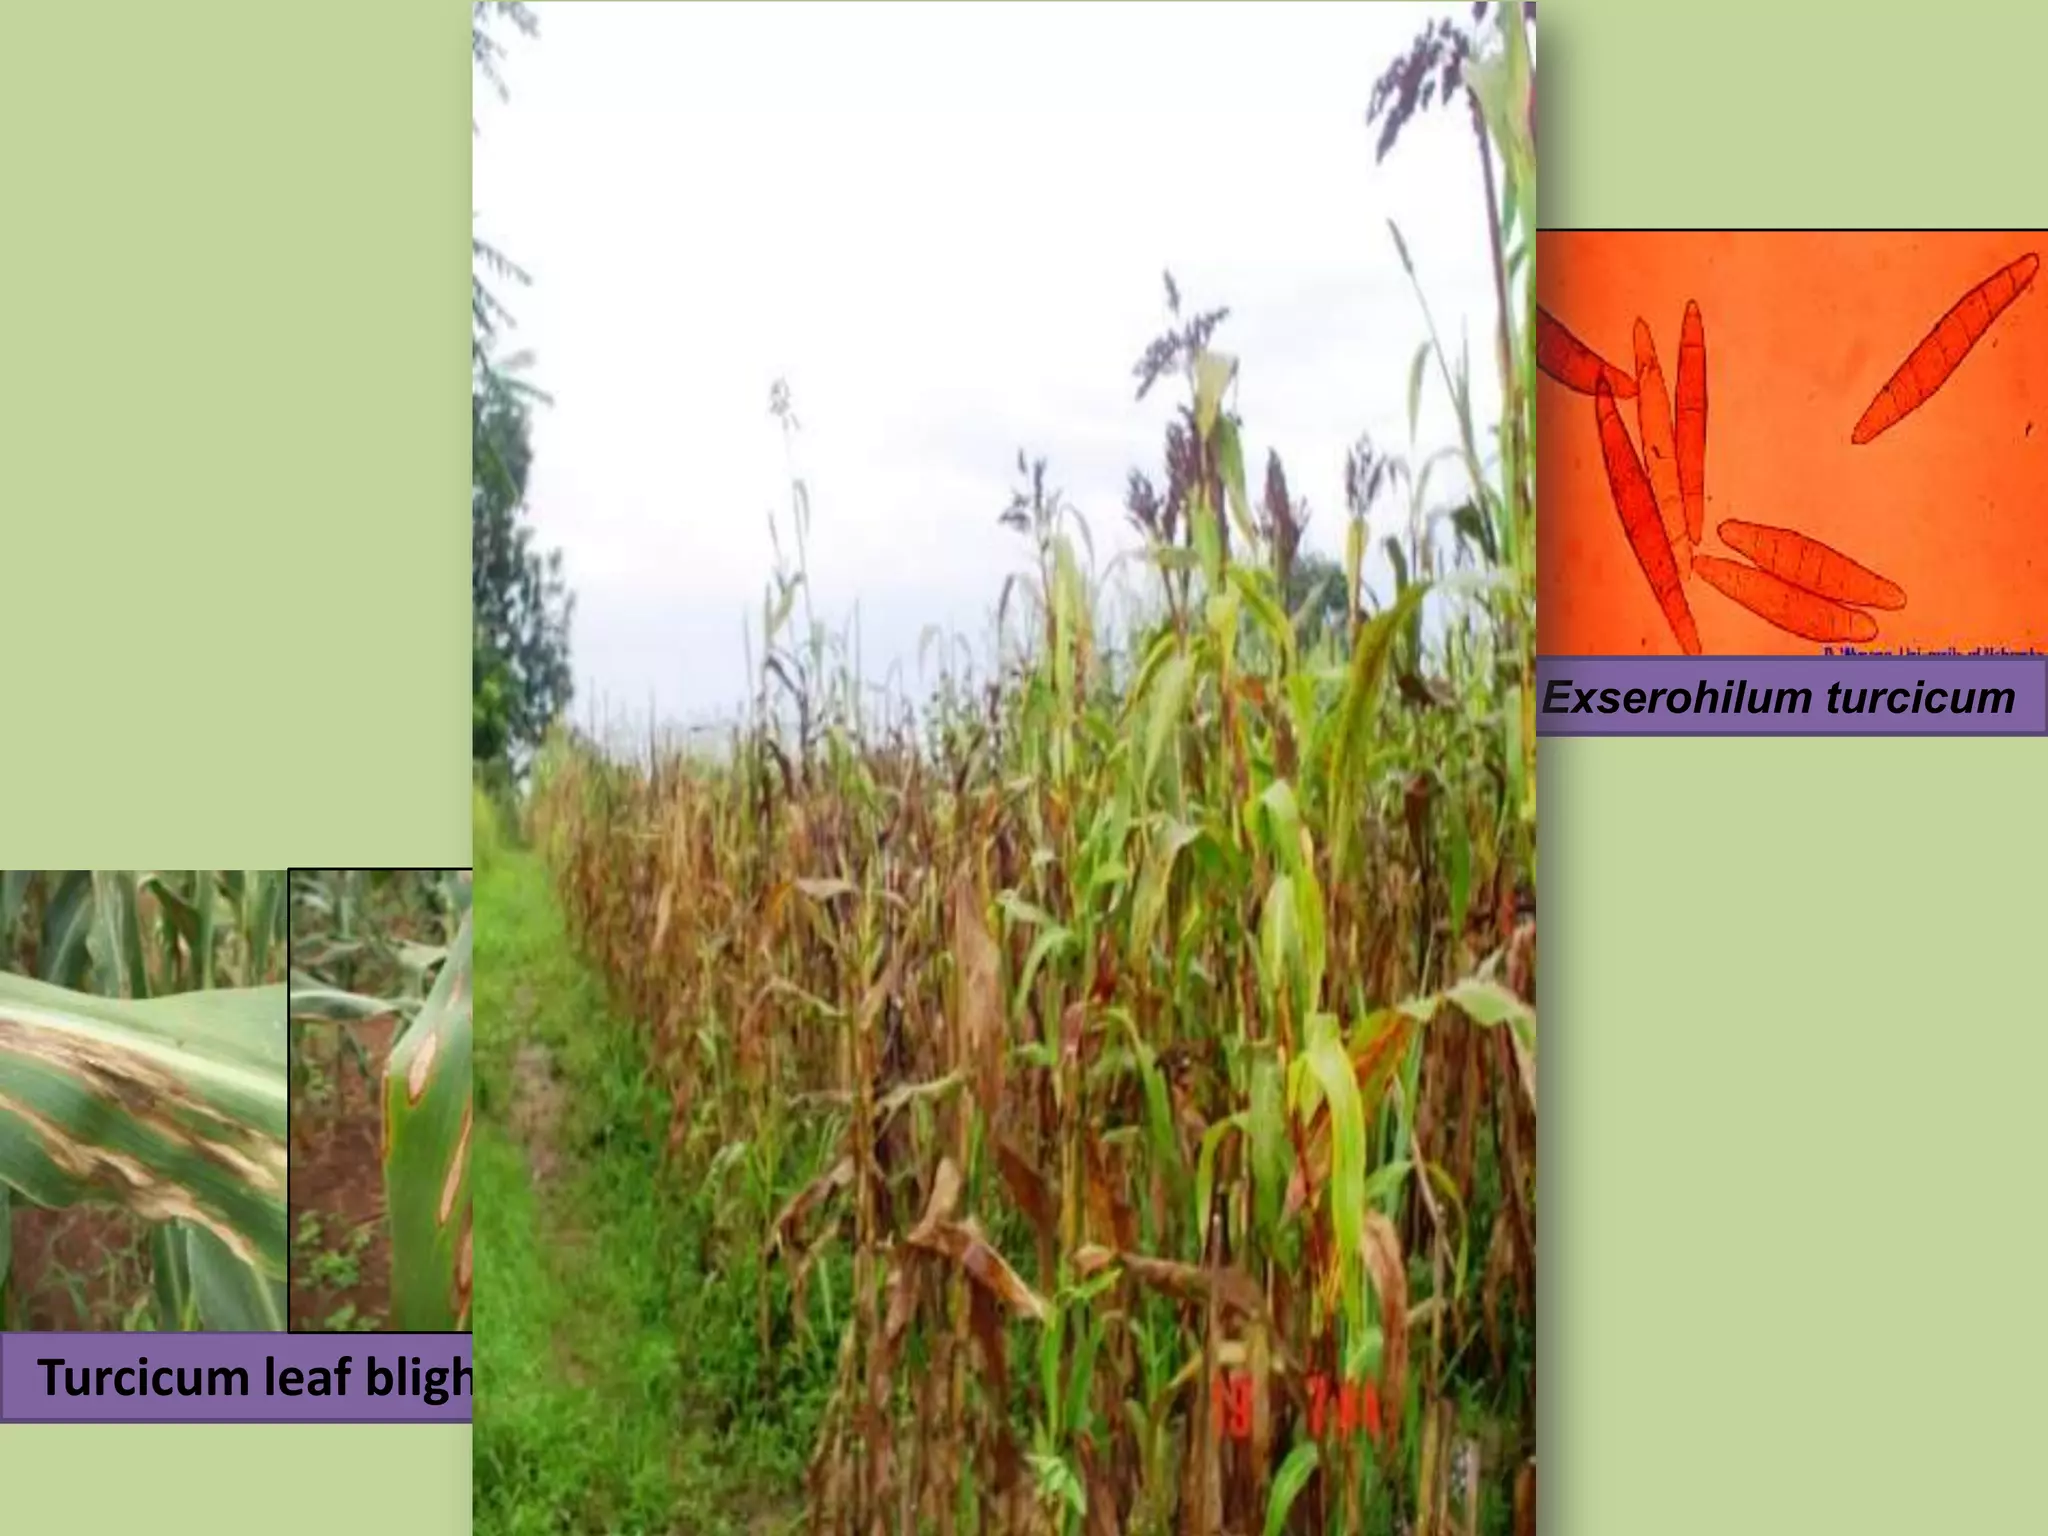
Generation mean analysis for Turcicum Leaf
       Blight in Ugandan Sorghum

  Mayada M.Beshir, Abdelbagi M. Ali and P. Okori


            3rd RUFORUM Biennial, Uganda
                    September, 2012
Introduction
Justification
Sorghum produces 70 million
metric tons of grain from 50
million ha of land, globally
(FAOSTAT, 2012).

Expansion of acreage in
Africa increased at about
3.6%/yr, although    yields
declined    at    1.0%/yr
(FAOSTAT, 2012).

State Of Food Insecurity in the World concludes that
the number of undernourished people in the world
remains high at close to one billion (FAOSTAT, 2012).
Sorghum is Africa's contribution to the world's top crop
www.greenstone.org


      www.greenstone.org        www.harvestchoice.org/production/bioti
                                             c/mapping
Exserohilum turcicum


Turcicum leaf bligh t (TLB)
Objectives
• To determine the contribution of additive,
dominant and epistatic genetic effects.

• To understand the inheritance of turcicum leaf
blight in sorghum


Hypothesis
• Available sorghum genotypes display variable
resistance against turcicum leaf blight.
Materials & Methods
Study site
Field & Greanhouse of Makerere University
Agricultural Research Institute Kabanyolo
(MUARIK) in Uganda .

Data analysis
Regression analysis and ANOVA using GenStat
Discovery Edition 12 (Steel and Torrie, 1997).

Inoculum preparation
Fungal materials will be isolated from naturally
infected sorghum in Uganda & sorghum grains
(Martin et al., 2011).
Genetic materials
Derived from a cross of MUC007/009 and Epuripuri
and populations included:
  1. Mid parent value of the two parents
  2. BC1F1 (to Epuripuri)
  3. F2
  4. F2:3
  5. F2:4


Experiment designs
 Field : CRD
 Greenhouse : α - lattice   Resistant line to TLB diseases
 Genetic ratios were used to calculate the genetics on
the Turcicum leaf blight inheritance among the
developed populations (Bernardo, 2002).

  Population type   Mean   Additive   Dominance   Epistasis

      BC1F1          1       0.5         0.5        0.25

        F1           1        0           1          0

        F2           1        0          0.5         0

       F2:3          1        0         0.25         0

       F2:4          1        0         0.125        0

  MUC007/009 (R)     1        -1          0          1

   Epuripuri (S)     1        1           0          1
Results
 Generational means of AUDPC, initial and final
severity ratings under the greenhouse conditions.

 Population Type        No of Plants   AUDPC   Initial Severity Final Severity

             BC1F1          34          2.7         0.1              5.3

                   F1       101         2.4         0.1              4.6

                   F2       81          2.2         0.1              4.2

               F2:3         68          2.6         0.2              4.4

               F2:4         62          2.5         0.2              4.7

   MUC007/009 (R)           38          2.5         0.1              4.7

      Epuripuri (S)         36          2.6         0.2              4.9

         LSD≤ 0.05                      0.64        0.41            0.98
Generational means of AUDPC, initial and final severity
ratings under field condition during the first rains of 2010.

    Population Type    AUDPC        Initial Severity   Final Severity

             BC1F1       6.7              0.6               7.8

                 F1      6.7              0.6               6.2

                 F2      8.8              0.6               8.6

               F2:3      7.2              0.4               7.5

               F2:4      8.8              0.4              10.0

   MUC007/009 (R)        4.3              0.3               5.3

      Epuripuri (S)      9.8              0.4               9.9

         LSD≤ 0.05      2.38             0.40              2.86
 Estimates of additive, dominance and epistatic effects
  using generation mean analysis.

                                  Relative AUDPC

                             Greenhouse        Field


             Mean             2.513***        8.59***


        Additive effects      0.043ns         4.14*


       Dominance effects      - 0.097ns       - 2.32ns

           Epistasis          0.060ns         - 3.80*
Outputs
Elite lines with resistance to foliar disease


                                             Line 3


              MUK60
 Line 1

                          Resistant line to TLB diseases
Remaining challenges to sorghum
  breeding for TLB disease resistance

1. Resistance scattered within the genome,
   therefore we need marker assisted
   breeding

2. Phenotyping of the disease is very
   complex due to varied symptoms caused
   by TLB pathogens
Acknowledgement
Indeed, if
  the 20th century has been the
century of wheat, rice, and maize,
the   21 st   could become the century
                 of sorghum
THANK YOU

 FOR YOUR
ATTENTION

Generation mean analysis for Turcicum Leaf Blight in Ugandan Sorghum

  • 1.
    Generation mean analysisfor Turcicum Leaf Blight in Ugandan Sorghum Mayada M.Beshir, Abdelbagi M. Ali and P. Okori 3rd RUFORUM Biennial, Uganda September, 2012
  • 2.
  • 3.
    Justification Sorghum produces 70million metric tons of grain from 50 million ha of land, globally (FAOSTAT, 2012). Expansion of acreage in Africa increased at about 3.6%/yr, although yields declined at 1.0%/yr (FAOSTAT, 2012). State Of Food Insecurity in the World concludes that the number of undernourished people in the world remains high at close to one billion (FAOSTAT, 2012).
  • 4.
    Sorghum is Africa'scontribution to the world's top crop www.greenstone.org www.greenstone.org www.harvestchoice.org/production/bioti c/mapping
  • 5.
  • 6.
    Objectives • To determinethe contribution of additive, dominant and epistatic genetic effects. • To understand the inheritance of turcicum leaf blight in sorghum Hypothesis • Available sorghum genotypes display variable resistance against turcicum leaf blight.
  • 7.
  • 8.
    Study site Field &Greanhouse of Makerere University Agricultural Research Institute Kabanyolo (MUARIK) in Uganda . Data analysis Regression analysis and ANOVA using GenStat Discovery Edition 12 (Steel and Torrie, 1997). Inoculum preparation Fungal materials will be isolated from naturally infected sorghum in Uganda & sorghum grains (Martin et al., 2011).
  • 9.
    Genetic materials Derived froma cross of MUC007/009 and Epuripuri and populations included: 1. Mid parent value of the two parents 2. BC1F1 (to Epuripuri) 3. F2 4. F2:3 5. F2:4 Experiment designs  Field : CRD  Greenhouse : α - lattice Resistant line to TLB diseases
  • 10.
     Genetic ratioswere used to calculate the genetics on the Turcicum leaf blight inheritance among the developed populations (Bernardo, 2002). Population type Mean Additive Dominance Epistasis BC1F1 1 0.5 0.5 0.25 F1 1 0 1 0 F2 1 0 0.5 0 F2:3 1 0 0.25 0 F2:4 1 0 0.125 0 MUC007/009 (R) 1 -1 0 1 Epuripuri (S) 1 1 0 1
  • 11.
  • 12.
     Generational meansof AUDPC, initial and final severity ratings under the greenhouse conditions. Population Type No of Plants AUDPC Initial Severity Final Severity BC1F1 34 2.7 0.1 5.3 F1 101 2.4 0.1 4.6 F2 81 2.2 0.1 4.2 F2:3 68 2.6 0.2 4.4 F2:4 62 2.5 0.2 4.7 MUC007/009 (R) 38 2.5 0.1 4.7 Epuripuri (S) 36 2.6 0.2 4.9 LSD≤ 0.05 0.64 0.41 0.98
  • 13.
    Generational means ofAUDPC, initial and final severity ratings under field condition during the first rains of 2010. Population Type AUDPC Initial Severity Final Severity BC1F1 6.7 0.6 7.8 F1 6.7 0.6 6.2 F2 8.8 0.6 8.6 F2:3 7.2 0.4 7.5 F2:4 8.8 0.4 10.0 MUC007/009 (R) 4.3 0.3 5.3 Epuripuri (S) 9.8 0.4 9.9 LSD≤ 0.05 2.38 0.40 2.86
  • 14.
     Estimates ofadditive, dominance and epistatic effects using generation mean analysis. Relative AUDPC Greenhouse Field Mean 2.513*** 8.59*** Additive effects 0.043ns 4.14* Dominance effects - 0.097ns - 2.32ns Epistasis 0.060ns - 3.80*
  • 15.
  • 16.
    Elite lines withresistance to foliar disease Line 3 MUK60 Line 1 Resistant line to TLB diseases
  • 17.
    Remaining challenges tosorghum breeding for TLB disease resistance 1. Resistance scattered within the genome, therefore we need marker assisted breeding 2. Phenotyping of the disease is very complex due to varied symptoms caused by TLB pathogens
  • 18.
  • 19.
    Indeed, if the 20th century has been the century of wheat, rice, and maize, the 21 st could become the century of sorghum
  • 20.
    THANK YOU FORYOUR ATTENTION

Editor's Notes

  • #4 Africa produces 30% of sorghum grains from 60% land