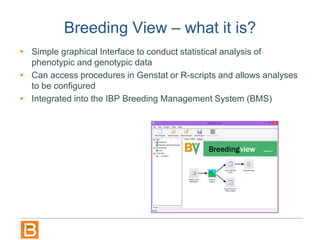
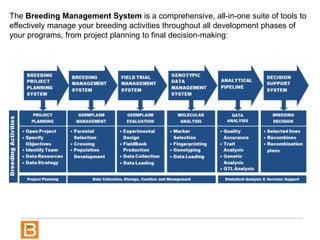
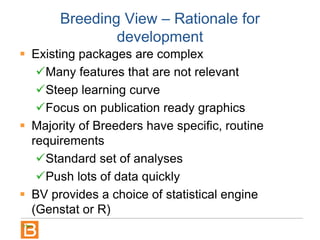
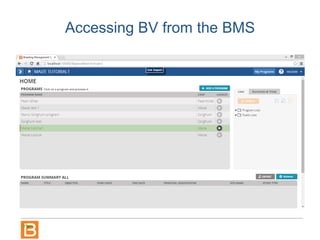
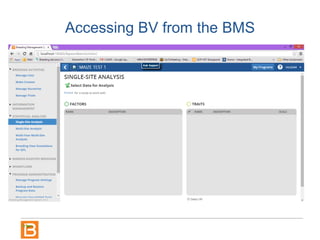
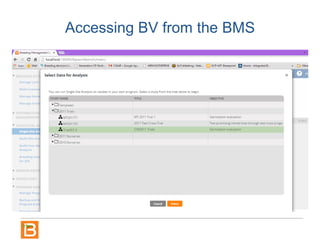
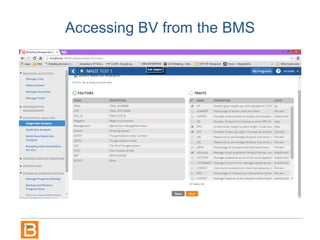
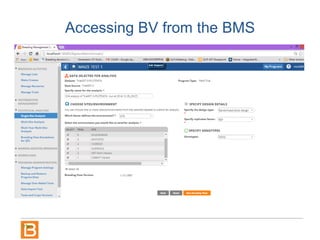
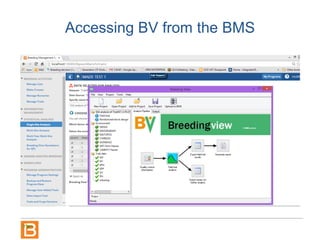
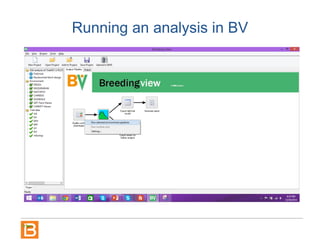
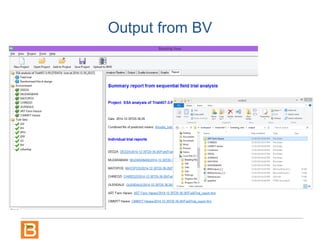
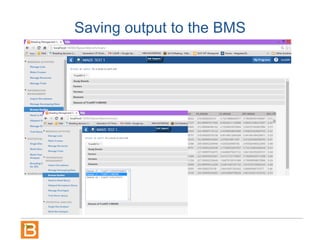
The Breeding View:
Statistical analyses in the Breeding
Management System (BMS)
An initiative of the CGIAR
Generation
Challenge Programme (GCP)
Mark Sawkins
Plant and Animal Genome
2015
San Diego, CA
Breeding View – what it is?
 Simple graphical Interface to conduct statistical analysis of
phenotypic and genotypic data
 Can access procedures in Genstat or R-scripts and allows analyses
to be configured
 Integrated into the IBP Breeding Management System (BMS)
The Breeding Management System is a comprehensive, all-in-one suite of tools to
effectively manage your breeding activities throughout all development phases of
your programs, from project planning to final decision-making:
Breeding View – Rationale for
development
 Existing packages are complex
Many features that are not relevant
Steep learning curve
Focus on publication ready graphics
 Majority of Breeders have specific, routine
requirements
Standard set of analyses
Push lots of data quickly
 BV provides a choice of statistical engine
(Genstat or R)
Current analysis pipelines
Statistical Analysis of Phenotyping Data
 Single site analysis is available for complete and
incomplete block designs as well as row-column designs
and spatial analysis.
 New designs are being added at each update,
 Analyses can be run in batches over environments
and traits,
 Two-stage multi-site analysis is available for GxE and
stability analysis with or without grouping of
environments,
 Single pass meta analysis of unbalanced site by
season data is being incorporated.
Statistical analysis of Genotyping Data
 Single trait linkage analysis (QTL)
 Quality control phenotypes
(summary statistics)
 Quality control marker data
 QTL detection – genome wide scan
using single and composite IM
 Output includes profile plots and
tables
 Results available for automatic
viewing in Flapjack
 HTML report of QTL results
 Multiple trait & environment
sequential analysis
 QTL results for each trait combined
 Single Flapjack view for all traits
Accessing BV from the BMS
Running an analysis in BV
Output from BV
Saving output to the BMS
To Come
 Ongoing updates to the Genstat and R scripts to
support new field designs and analysis types as
they are added to the BMS
 Additional field designs (e.g. Augmented, P-rep)
 Line x Tester analysis
 All pipelines fully integrated in BMS
 Addition of new pipelines (e.g., multi-site/multi-
year analysis
 Incremental improvements to output and reports
 Improved documentation for all pipelines
To come
 Ability to add user/community developed R-
scripts to BV
 Want to know more?
www.integratedbreeding.net
 Questions about licensing?
s.andrews@cgiar.org
Thanks!

PAG 2015 - Breeding View: Statistical analyses in the Breeding Management System - Dr Mark Sawkins

  • 1.
    The Breeding View: Statisticalanalyses in the Breeding Management System (BMS) An initiative of the CGIAR Generation Challenge Programme (GCP) Mark Sawkins Plant and Animal Genome 2015 San Diego, CA
  • 2.
    Breeding View –what it is?  Simple graphical Interface to conduct statistical analysis of phenotypic and genotypic data  Can access procedures in Genstat or R-scripts and allows analyses to be configured  Integrated into the IBP Breeding Management System (BMS)
  • 3.
    The Breeding ManagementSystem is a comprehensive, all-in-one suite of tools to effectively manage your breeding activities throughout all development phases of your programs, from project planning to final decision-making:
  • 4.
    Breeding View –Rationale for development  Existing packages are complex Many features that are not relevant Steep learning curve Focus on publication ready graphics  Majority of Breeders have specific, routine requirements Standard set of analyses Push lots of data quickly  BV provides a choice of statistical engine (Genstat or R)
  • 5.
  • 6.
    Statistical Analysis ofPhenotyping Data  Single site analysis is available for complete and incomplete block designs as well as row-column designs and spatial analysis.  New designs are being added at each update,  Analyses can be run in batches over environments and traits,  Two-stage multi-site analysis is available for GxE and stability analysis with or without grouping of environments,  Single pass meta analysis of unbalanced site by season data is being incorporated.
  • 7.
    Statistical analysis ofGenotyping Data  Single trait linkage analysis (QTL)  Quality control phenotypes (summary statistics)  Quality control marker data  QTL detection – genome wide scan using single and composite IM  Output includes profile plots and tables  Results available for automatic viewing in Flapjack  HTML report of QTL results  Multiple trait & environment sequential analysis  QTL results for each trait combined  Single Flapjack view for all traits
  • 8.
  • 9.
  • 10.
  • 11.
  • 12.
  • 13.
  • 14.
  • 15.
  • 16.
  • 17.
    To Come  Ongoingupdates to the Genstat and R scripts to support new field designs and analysis types as they are added to the BMS  Additional field designs (e.g. Augmented, P-rep)  Line x Tester analysis  All pipelines fully integrated in BMS  Addition of new pipelines (e.g., multi-site/multi- year analysis  Incremental improvements to output and reports  Improved documentation for all pipelines
  • 18.
    To come  Abilityto add user/community developed R- scripts to BV  Want to know more? www.integratedbreeding.net  Questions about licensing? s.andrews@cgiar.org
  • 19.