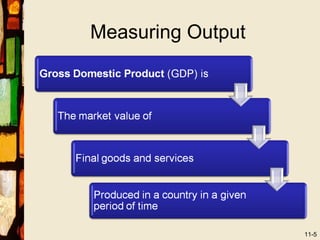
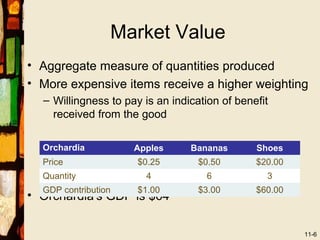
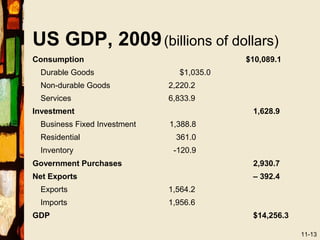
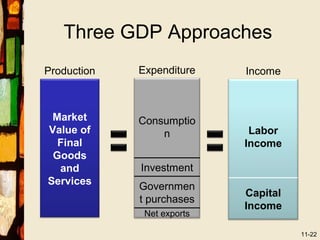
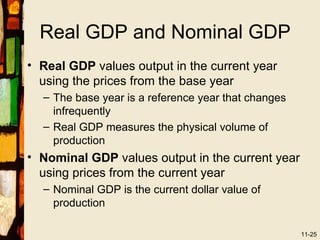
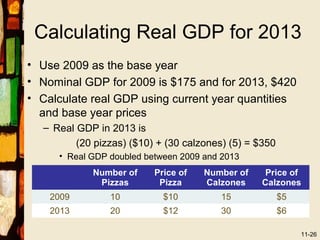
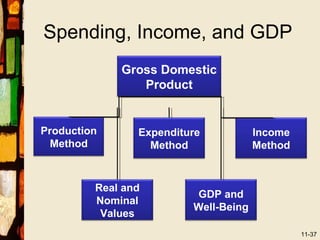
Spending, Income, and
GDP
                    Chapter 11


McGraw-Hill/Irwin       Copyright © 2011 by The McGraw-Hill Companies, Inc. All rights reserved.
Macroeconomics: Data and
         Issues


                           11-2
Learning Objectives
1. Explain how economist define and measure an
   economy's output
2. Apply the expenditure method for measuring
   GDP to analyze economic activity
3. Define and compute nominal GDP and real
   GDP
4. Discuss the relationships between GDP and
   economic well-being


                                                 11-3
Macroeconomics
• Data on output, employment, prices
  – Vital signs of the economy
     • Employment, unemployment, average work hours
     • Stock values and trends
     • Prices and inflation
  – Reported often in the news
• Systematic measurement of economic output
  developed during World War II
  – Common systems and measures used virtually
    worldwide

                                                      11-4
Measuring Output


                   11-5
Market Value
• Aggregate measure of quantities produced
• More expensive items receive a higher weighting
  – Willingness to pay is an indication of benefit
    received from the good

  Orchardia          Apples      Bananas       Shoes
  Price               $0.25        $0.50       $20.00
  Quantity              4           6            3
  GDP contribution    $1.00        $3.00       $60.00
• Orchardia's GDP is $64

                                                        11-6
Some Non-Market Goods
            Included
• Government goods and services are not sold in
  the market
  –   These goods have value
  –   Increase overall output
  –   Quantities are known
  –   Prices cannot be established
• Government production is valued at cost
  – Overstates GDP if there is waste and inefficiency


                                                        11-7
Final Goods and Services
• Final goods and services are consumed by the
  ultimate user
   – End products of production
   – Included in GDP
• Intermediate goods and services are used up in
  the production of final goods
   – Not included in GDP to avoid double counting
• A barber's assistant earns $2 per haircut for
  providing services such as shampooing and
  sweeping up
   – Barber charges $10 per haircut
   – Haircut's contribution to GDP is $10
                                                    11-8
Goods Can Be Final and
             Intermediate
• Milk can be sold as a final product or used as an
  intermediate good
   – Gallons of milk in the store
   – Gallons of milk sold to restaurants
   – Count only the final goods
• A capital good is a long-lived good used in the
  production of other goods and services
   – Houses, apartments, and motels
   – Stoves in restaurants, cooking schools
   – Delivery vehicles and taxis
• Money is not a capital good
                                                      11-9
Value Added
• Value added is the market value of the product
  minus the cost of inputs purchased from other
  firms
  – Count value added in the year it is produced
  – Hot'n'Fresh buys flour and other inputs to make
    bread that sells for $2.00
                             Cost of Purchased   Value
    Company       Revenues
                                   Inputs        Added
  ABC Grain        $0.50           $0.00         $0.50
  General Flour    $1.20           $0.50         $0.70
  Hot'n'Fresh      $2.00           $1.20         $0.80
  Total                                          $2.00
                                                         11-10
Produced in a Country in a
         Period of Time
• "Domestic" in GDP means the activity is
  measured within a country's borders
  – Nationality of owners or company is not relevant
• Value must be produced in the year considered
  – Sell a 20-year old house for $200,000
     • Pay $12,000 commission
     • Value added is $12,000
     • House was not produced in the period of time
       studied
     • Count income generated from the sale of used goods

                                                       11-11
Expenditure Method for
          Measuring GDP
• Four users of final goods
  ď‚§ Households    â–    Firms
  ď‚§ Government    â–    Foreigners
• All goods produced are purchased by one of
  these groups in a given year
• Amount spent = market value
• GDP can be measured two ways
  – Market value
  – Total spending for final goods less value of imports


                                                       11-12
US GDP, 2009 (billions of dollars)
Consumption                               $10,089.1
 Durable Goods                 $1,035.0
 Non-durable Goods           2,220.2
 Services                    6,833.9
Investment                                 1,628.9
 Business Fixed Investment   1,388.8
 Residential                  361.0
 Inventory                    -120.9
Government Purchases                       2,930.7
Net Exports                                – 392.4
 Exports                     1,564.2
 Imports                     1,956.6
GDP                                        $14,256.3

                                                       11-13
Consumption Expenditure
• Consumption expenditure is spending by
  households for goods and services
  – Consumer durables are long-lived consumer goods
    • Cars        • Furniture      • Appliances
  – Consumer non-durable goods are shorter-lived
    goods
     • Clothing   • Food          • Bedding
  – Services are the largest component of consumer
    spending
     • Education     • Taxi rides   • Haircuts


                                                     11-14
Investment
• Investment is spending by firms on final goods
  and services
• Business fixed investment is purchases of new
  capital goods
   • Plant        • Property     • Equipment
• Residential investment is construction of new
  homes and apartment buildings
• Inventory investment is the change in unsold
  goods to the company's inventory
  – These goods are produced but not yet sold
  – This entry can be positive or negative
                                                  11-15
Economic Investment and
       Financial Investment
• Financial investment includes purchases of
  stocks, bonds, and other financial assets
  – Purchase generally transfers ownership of a portion
    of the firm's existing capital stock
  – Does not correspond to any increase in physical
    capital or production capacity, in most cases
     • New stock issues can be an exception
• Economic investment refers to the increase in
  the capital goods used to produce other goods
  – This value is based on the purchase price of the
    capital goods, not on stock value
                                                       11-16
Government Purchases
• Government purchases are final goods and services
  bought by federal, state, and local governments
   • Fighter jets    • Teaching       • Office supplies
• Excludes transfer payments
   – Transfer payments are made by government but the
     government receives no current goods or services
      • Social Security         • Food Stamps
      • No purchases of final goods and services involved in
        transfer payments
         – Spending by recipients is included in GDP
• Excludes interest paid on government debt

                                                           11-17
Net Exports
• Net exports equal exports minus imports
  – Exports are goods and services produced
    domestically and sold abroad
     • Exports reduce the amount available to the domestic
       economy
  – Imports are purchases in the US of goods and
    services produced abroad
     • Imports can be consumption, investment, or
       government spending
     • Imports increase the amount available to the
       domestic economy

                                                         11-18
GDP Expenditures Equation
Terminology
   Y      Gross Domestic Product or output
   C      Consumption Expenditure
   I      Investment
   G      Government Purchases
   NX     Net Exports
• Expenditure approach to measuring GDP

               Y = C + I + G + NX

                                             11-19
GDP Example
• Total production is 1 million cars, $15,000 each
• Production value is 1 million times $15,000 =
  $15 billion
  Sector             # Cars Purchased   GDP Contribution
  Consumers              700,000         $10.500 billion
  Businesses
  Businesses           225,000
                        200,000           $3.375billion
                                          $3.000 billion
  Government              50,000           $0.750 billion
  Net exports             25,000          $0.375 billion
  Total                1,000,000
                         975,000            $15.000
                                         $14.625 billion
                                            billion

  – 25,000 cars are unsold
      • Investment in inventories increases by $0.375 billion
                                                            11-20
Income Approach to GDP
• When a good is sold, its proceeds are distributed to
  workers or business owners
• GDP = labor income + capital income
• Labor income is wages, salaries, benefits, and
  incomes of the self-employed
   – About ⅔ of GDP
• Capital income pays for physical capital and
  intangibles
    • Profits for business owners    • Rent for land
    • Interest for bond holders      • Royalties
   – Measured before taxes
                                                       11-21
Three GDP Approaches
Production   Expenditure    Income


 Market      Consumptio
Value of         n           Labor
  Final                     Income
 Goods
  and        Investment
Services     Governmen
                            Capital
             t purchases
                            Income
              Net exports

                                      11-22
Adjusting for Price Changes
• Compare GDP for different years to see how
  much output has changed
• GDP changes over time because
  – Prices change AND
  – Quantity of output changes
• To see how much output has grown, use only
  the changes in quantities
  – Hold prices constant


                                               11-23
The Pizza and Calzone
            Economy
• GDP in 2009 is $175; GDP in 2013 is $420
  – GDP in 2013 is 2.4 times the GDP in 2009
• Only twice as many pizzas and calzones were
  produced in 2013
  – Market value of output grew faster than the physical
    volume of output
           Number of    Price of   Number of    Price of
            Pizzas       Pizza     Calzones    Calzones
   2009       10         $10          15          $5
   2013       20         $12          30          $6

                                                           11-24
Real GDP and Nominal GDP
• Real GDP values output in the current year
  using the prices from the base year
  – The base year is a reference year that changes
    infrequently
  – Real GDP measures the physical volume of
    production
• Nominal GDP values output in the current year
  using prices from the current year
  – Nominal GDP is the current dollar value of
    production

                                                     11-25
Calculating Real GDP for 2013
• Use 2009 as the base year
• Nominal GDP for 2009 is $175 and for 2013, $420
• Calculate real GDP using current year quantities
  and base year prices
  – Real GDP in 2013 is
         (20 pizzas) ($10) + (30 calzones) (5) = $350
     • Real GDP doubled between 2009 and 2013
            Number of     Price of   Number of     Price of
             Pizzas        Pizza     Calzones     Calzones
    2009        10          $10          15             $5
    2013        20          $12          30             $6

                                                             11-26
Observations on Real and
           Nominal GDP
• Usually, nominal and real GDP increase each year
• Nominal GDP can go up and real GDP go down
   – Fewer goods and services produced AND
   – Prices increase faster than output decreased
• Nominal GDP will be smaller than real GDP if the
  prices in the current year are less than in the base
  year
   – Usually true for years before the base year
• Real GDP could rise and nominal GDP fall, but this
  is rare
   – Prices are falling faster than output is increasing
                                                           11-27
Real GDP and Economic Well-
           Being
• Real GDP is a flawed measure of well-being
  – It values only market transactions
     • Omits illegal transactions, volunteer work, and
       household production
• Maximizing GDP will not necessarily maximize
  national well-being
  – Whether increases in output increase welfare is a
    case-by-case issue


                                                         11-28
GDP Does Not Value Leisure
• Amount of leisure time has increased in the past
  100 years
  – Work weeks are shorter
  – People enter the labor force at an older age
  – People retire earlier
• Leisure produces no goods for market
  – GDP places a value of zero on all leisure time
  – Opportunity cost of an hour of leisure is your hourly
    wage
  – Omission of the value of leisure time makes GDP
    seem smaller
                                                        11-29
Nonmarket Economic Activities
• GDP omits services that are not traded in
  markets
  – Household production
  – Volunteer services
• Valuing these services would be difficult
• Nonmarket activities are important in poor
  countries
  – Self-sufficient households and bartered goods and
    services


                                                        11-30
Underground Economy
• Underground economy is all unreported
  transactions, legal and illegal
• Casual labor is often paid in cash
  – Failure to report transaction reduces taxes
  – Includes baby sitters, lawn care, home repair, etc.
• Some underground activity is illegal
  – A service of value is provided
  – Drug dealers, bookies, fences, prostitution, etc
• Estimates suggest the underground economy is
  large regardless of national income level
                                                          11-31
Environmental Quality
• Suppose a factory is built in your town
  – People are employed and output is produced
     • Productive activity is included in GDP
• Suppose further that the factory creates pollution
  – Your city hires a company to restore the
    environment to its initial condition
  – Clean-up activities are included in GDP
     • Gets environment back to its starting point, not better


                                                            11-32
Resource Depletion
• No adjustment is made for the decline in
  resource availability when mining or other
  harvesting is done
  – One more barrel of oil on the market means one
    less barrel for future use
• Environmental quality and resource depletion
  are difficult to value
  – They have value and that value is omitted from
    GDP


                                                     11-33
Other Quality of Life
             Considerations
• GDP does not account for intangibles people
  value
  –   Crime rates
  –   Traffic congestion
  –   Civic organizations
  –   Open space
  –   Sense of community


                                                11-34
Poverty and Economic
              Inequality
• GDP does not capture the effects of income
  inequality
   – Most would prefer living in a relatively equal society
     to one with a few wealthy and many poor
• US uses an absolute standard of poverty
   – In 2009, a family of four was poor if their income
     was less than $21,756
• Inequality matters and it is increasing in the US
   – The case of the beat-up car


                                                          11-35
GDP as a Welfare Measure
• GDP omits and undervalues some goods and services
• GDP per capita is positively associated with several
  measures of well-being
  – Material standard of living: more goods and
    services
  – Health and life expectancy
     • Residents of industrialized countries fare better
       than residents of developing countries in a range
       of health measures
  – Education
     • Literacy and school enrollment rates are higher
       in high-income countries
                                                      11-36
Spending, Income, and GDP
             Gross Domestic
                Product


Production      Expenditure           Income
  Method          Method              Method


         Real and
                          GDP and
         Nominal
                         Well-Being
          Values
                                               11-37

Gdp

  • 1.
    Spending, Income, and GDP Chapter 11 McGraw-Hill/Irwin Copyright © 2011 by The McGraw-Hill Companies, Inc. All rights reserved.
  • 2.
  • 3.
    Learning Objectives 1. Explainhow economist define and measure an economy's output 2. Apply the expenditure method for measuring GDP to analyze economic activity 3. Define and compute nominal GDP and real GDP 4. Discuss the relationships between GDP and economic well-being 11-3
  • 4.
    Macroeconomics • Data onoutput, employment, prices – Vital signs of the economy • Employment, unemployment, average work hours • Stock values and trends • Prices and inflation – Reported often in the news • Systematic measurement of economic output developed during World War II – Common systems and measures used virtually worldwide 11-4
  • 5.
  • 6.
    Market Value • Aggregatemeasure of quantities produced • More expensive items receive a higher weighting – Willingness to pay is an indication of benefit received from the good Orchardia Apples Bananas Shoes Price $0.25 $0.50 $20.00 Quantity 4 6 3 GDP contribution $1.00 $3.00 $60.00 • Orchardia's GDP is $64 11-6
  • 7.
    Some Non-Market Goods Included • Government goods and services are not sold in the market – These goods have value – Increase overall output – Quantities are known – Prices cannot be established • Government production is valued at cost – Overstates GDP if there is waste and inefficiency 11-7
  • 8.
    Final Goods andServices • Final goods and services are consumed by the ultimate user – End products of production – Included in GDP • Intermediate goods and services are used up in the production of final goods – Not included in GDP to avoid double counting • A barber's assistant earns $2 per haircut for providing services such as shampooing and sweeping up – Barber charges $10 per haircut – Haircut's contribution to GDP is $10 11-8
  • 9.
    Goods Can BeFinal and Intermediate • Milk can be sold as a final product or used as an intermediate good – Gallons of milk in the store – Gallons of milk sold to restaurants – Count only the final goods • A capital good is a long-lived good used in the production of other goods and services – Houses, apartments, and motels – Stoves in restaurants, cooking schools – Delivery vehicles and taxis • Money is not a capital good 11-9
  • 10.
    Value Added • Valueadded is the market value of the product minus the cost of inputs purchased from other firms – Count value added in the year it is produced – Hot'n'Fresh buys flour and other inputs to make bread that sells for $2.00 Cost of Purchased Value Company Revenues Inputs Added ABC Grain $0.50 $0.00 $0.50 General Flour $1.20 $0.50 $0.70 Hot'n'Fresh $2.00 $1.20 $0.80 Total $2.00 11-10
  • 11.
    Produced in aCountry in a Period of Time • "Domestic" in GDP means the activity is measured within a country's borders – Nationality of owners or company is not relevant • Value must be produced in the year considered – Sell a 20-year old house for $200,000 • Pay $12,000 commission • Value added is $12,000 • House was not produced in the period of time studied • Count income generated from the sale of used goods 11-11
  • 12.
    Expenditure Method for Measuring GDP • Four users of final goods  Households ■ Firms  Government ■ Foreigners • All goods produced are purchased by one of these groups in a given year • Amount spent = market value • GDP can be measured two ways – Market value – Total spending for final goods less value of imports 11-12
  • 13.
    US GDP, 2009(billions of dollars) Consumption $10,089.1 Durable Goods $1,035.0 Non-durable Goods 2,220.2 Services 6,833.9 Investment 1,628.9 Business Fixed Investment 1,388.8 Residential 361.0 Inventory -120.9 Government Purchases 2,930.7 Net Exports – 392.4 Exports 1,564.2 Imports 1,956.6 GDP $14,256.3 11-13
  • 14.
    Consumption Expenditure • Consumptionexpenditure is spending by households for goods and services – Consumer durables are long-lived consumer goods • Cars • Furniture • Appliances – Consumer non-durable goods are shorter-lived goods • Clothing • Food • Bedding – Services are the largest component of consumer spending • Education • Taxi rides • Haircuts 11-14
  • 15.
    Investment • Investment isspending by firms on final goods and services • Business fixed investment is purchases of new capital goods • Plant • Property • Equipment • Residential investment is construction of new homes and apartment buildings • Inventory investment is the change in unsold goods to the company's inventory – These goods are produced but not yet sold – This entry can be positive or negative 11-15
  • 16.
    Economic Investment and Financial Investment • Financial investment includes purchases of stocks, bonds, and other financial assets – Purchase generally transfers ownership of a portion of the firm's existing capital stock – Does not correspond to any increase in physical capital or production capacity, in most cases • New stock issues can be an exception • Economic investment refers to the increase in the capital goods used to produce other goods – This value is based on the purchase price of the capital goods, not on stock value 11-16
  • 17.
    Government Purchases • Governmentpurchases are final goods and services bought by federal, state, and local governments • Fighter jets • Teaching • Office supplies • Excludes transfer payments – Transfer payments are made by government but the government receives no current goods or services • Social Security • Food Stamps • No purchases of final goods and services involved in transfer payments – Spending by recipients is included in GDP • Excludes interest paid on government debt 11-17
  • 18.
    Net Exports • Netexports equal exports minus imports – Exports are goods and services produced domestically and sold abroad • Exports reduce the amount available to the domestic economy – Imports are purchases in the US of goods and services produced abroad • Imports can be consumption, investment, or government spending • Imports increase the amount available to the domestic economy 11-18
  • 19.
    GDP Expenditures Equation Terminology Y Gross Domestic Product or output C Consumption Expenditure I Investment G Government Purchases NX Net Exports • Expenditure approach to measuring GDP Y = C + I + G + NX 11-19
  • 20.
    GDP Example • Totalproduction is 1 million cars, $15,000 each • Production value is 1 million times $15,000 = $15 billion Sector # Cars Purchased GDP Contribution Consumers 700,000 $10.500 billion Businesses Businesses 225,000 200,000 $3.375billion $3.000 billion Government 50,000 $0.750 billion Net exports 25,000 $0.375 billion Total 1,000,000 975,000 $15.000 $14.625 billion billion – 25,000 cars are unsold • Investment in inventories increases by $0.375 billion 11-20
  • 21.
    Income Approach toGDP • When a good is sold, its proceeds are distributed to workers or business owners • GDP = labor income + capital income • Labor income is wages, salaries, benefits, and incomes of the self-employed – About ⅔ of GDP • Capital income pays for physical capital and intangibles • Profits for business owners • Rent for land • Interest for bond holders • Royalties – Measured before taxes 11-21
  • 22.
    Three GDP Approaches Production Expenditure Income Market Consumptio Value of n Labor Final Income Goods and Investment Services Governmen Capital t purchases Income Net exports 11-22
  • 23.
    Adjusting for PriceChanges • Compare GDP for different years to see how much output has changed • GDP changes over time because – Prices change AND – Quantity of output changes • To see how much output has grown, use only the changes in quantities – Hold prices constant 11-23
  • 24.
    The Pizza andCalzone Economy • GDP in 2009 is $175; GDP in 2013 is $420 – GDP in 2013 is 2.4 times the GDP in 2009 • Only twice as many pizzas and calzones were produced in 2013 – Market value of output grew faster than the physical volume of output Number of Price of Number of Price of Pizzas Pizza Calzones Calzones 2009 10 $10 15 $5 2013 20 $12 30 $6 11-24
  • 25.
    Real GDP andNominal GDP • Real GDP values output in the current year using the prices from the base year – The base year is a reference year that changes infrequently – Real GDP measures the physical volume of production • Nominal GDP values output in the current year using prices from the current year – Nominal GDP is the current dollar value of production 11-25
  • 26.
    Calculating Real GDPfor 2013 • Use 2009 as the base year • Nominal GDP for 2009 is $175 and for 2013, $420 • Calculate real GDP using current year quantities and base year prices – Real GDP in 2013 is (20 pizzas) ($10) + (30 calzones) (5) = $350 • Real GDP doubled between 2009 and 2013 Number of Price of Number of Price of Pizzas Pizza Calzones Calzones 2009 10 $10 15 $5 2013 20 $12 30 $6 11-26
  • 27.
    Observations on Realand Nominal GDP • Usually, nominal and real GDP increase each year • Nominal GDP can go up and real GDP go down – Fewer goods and services produced AND – Prices increase faster than output decreased • Nominal GDP will be smaller than real GDP if the prices in the current year are less than in the base year – Usually true for years before the base year • Real GDP could rise and nominal GDP fall, but this is rare – Prices are falling faster than output is increasing 11-27
  • 28.
    Real GDP andEconomic Well- Being • Real GDP is a flawed measure of well-being – It values only market transactions • Omits illegal transactions, volunteer work, and household production • Maximizing GDP will not necessarily maximize national well-being – Whether increases in output increase welfare is a case-by-case issue 11-28
  • 29.
    GDP Does NotValue Leisure • Amount of leisure time has increased in the past 100 years – Work weeks are shorter – People enter the labor force at an older age – People retire earlier • Leisure produces no goods for market – GDP places a value of zero on all leisure time – Opportunity cost of an hour of leisure is your hourly wage – Omission of the value of leisure time makes GDP seem smaller 11-29
  • 30.
    Nonmarket Economic Activities •GDP omits services that are not traded in markets – Household production – Volunteer services • Valuing these services would be difficult • Nonmarket activities are important in poor countries – Self-sufficient households and bartered goods and services 11-30
  • 31.
    Underground Economy • Undergroundeconomy is all unreported transactions, legal and illegal • Casual labor is often paid in cash – Failure to report transaction reduces taxes – Includes baby sitters, lawn care, home repair, etc. • Some underground activity is illegal – A service of value is provided – Drug dealers, bookies, fences, prostitution, etc • Estimates suggest the underground economy is large regardless of national income level 11-31
  • 32.
    Environmental Quality • Supposea factory is built in your town – People are employed and output is produced • Productive activity is included in GDP • Suppose further that the factory creates pollution – Your city hires a company to restore the environment to its initial condition – Clean-up activities are included in GDP • Gets environment back to its starting point, not better 11-32
  • 33.
    Resource Depletion • Noadjustment is made for the decline in resource availability when mining or other harvesting is done – One more barrel of oil on the market means one less barrel for future use • Environmental quality and resource depletion are difficult to value – They have value and that value is omitted from GDP 11-33
  • 34.
    Other Quality ofLife Considerations • GDP does not account for intangibles people value – Crime rates – Traffic congestion – Civic organizations – Open space – Sense of community 11-34
  • 35.
    Poverty and Economic Inequality • GDP does not capture the effects of income inequality – Most would prefer living in a relatively equal society to one with a few wealthy and many poor • US uses an absolute standard of poverty – In 2009, a family of four was poor if their income was less than $21,756 • Inequality matters and it is increasing in the US – The case of the beat-up car 11-35
  • 36.
    GDP as aWelfare Measure • GDP omits and undervalues some goods and services • GDP per capita is positively associated with several measures of well-being – Material standard of living: more goods and services – Health and life expectancy • Residents of industrialized countries fare better than residents of developing countries in a range of health measures – Education • Literacy and school enrollment rates are higher in high-income countries 11-36
  • 37.
    Spending, Income, andGDP Gross Domestic Product Production Expenditure Income Method Method Method Real and GDP and Nominal Well-Being Values 11-37

Editor's Notes

  • #11 Sum of value added is equal to the sum of the value of final goods and services
  • #14 GDP per capita was roughly $45,000
  • #19 A tourist's haircut in the US is an exported service