Recommended

Recommended
More Related Content
What's hot
What's hot (20)
Similar to GassertPosterSEDAAG
Similar to GassertPosterSEDAAG (20)
Recently uploaded
Recently uploaded (20)
GassertPosterSEDAAG
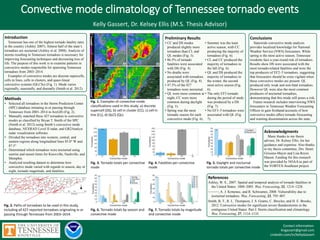
- 1. Fig. 6. Tornado totals by season and convective mode Convective mode climatology of Tennessee tornado events Kelly Gassert, Dr. Kelsey Ellis (M.S. Thesis Advisor) Fig. 2. Paths of tornadoes to be used in this study, including all 427 reported tornadoes originating in or passing through Tennessee from 2003–2014. Contact information: Kngassert@gmail.com Linkedin.com/in/KellyGassert Fig. 1. Examples of convective mode classifications used in this study: a) discrete supercell (DS), b) cell in cluster (CC), c) cell in line (CL), d) QLCS (QL). Introduction Tennessee has one of the highest tornado fatality rates in the country (Ashley 2007). Almost half of the state’s tornadoes are nocturnal (Ashley et al. 2008). Analysis of storms resulting in Tennessee tornadoes is necessary for improving forecasting techniques and decreasing loss of life. The purpose of this work is to examine patterns in convective modes responsible for spawning Tennessee tornadoes from 2003–2014. Examples of convective modes are discrete supercells, cells in lines, cells in clusters, and quasi-linear convective systems (QLCSs) (Fig. 1). Mode varies regionally, seasonally, and diurnally (Smith et al. 2012). Methods • Selected all tornadoes in the Storm Prediction Center (SPC) database initiating in or passing through Tennessee from 2003–2014 in ArcGIS (Fig. 2). • Manually matched these 427 tornadoes to convective modes as classified by Bryan T. Smith of the SPC (Smith et al. 2012) using Smith’s convective mode database, NEXRAD Level II radar, and GR2Analyst radar visualization software. • Divided the tornadoes into western, central, and eastern regions along longitudinal lines 85.0° W and 87.5° • Determined which tornadoes were nocturnal using sunrise and sunset times for Knoxville, Nashville, and Memphis. • Analyzed resulting dataset to determine how convective mode varied with regards to season, day or night, tornado magnitude, and fatalities. Acknowledgments Many thanks to my thesis advisor, Dr. Kelsey Ellis, for her guidance and expertise. Also thanks to my thesis committee, Drs. Henri Grissino-Mayer and Lisa Reyes Mason. Funding for this research was provided by NOAA as part of the VORTEX-Southeast project. A C B D Fig. 5. Daylight and nocturnal tornado totals per convective mode Fig. 7. Tornado totals by magnitude and convective mode References Ashley, W. S., 2007: Spatial and temporal analysis of tornado fatalities in the United States: 1880–2005. Wea. Forecasting, 22, 1214–1228. ———, A. J. Krmenec, and R. Schwantes, 2008: Vulnerability due to nocturnal tornadoes. Wea. Forecasting, 23, 795–807. Smith, B. T., R. L. Thompson, J. S. Grams, C. Broyles, and H. E. Brooks, 2012: Convective modes for significant severe thunderstorms in the contiguous United States. Part I: Storm classification and climatology. Wea. Forecasting, 27, 1114–1135. Fig. 4. Fatalities per convective mode Fig. 3. Tornado totals per convective mode Preliminary Results • CC and DS modes produced slightly more tornadoes than CL and QL modes (Fig. 3). • 86.5% of tornado fatalities were associated with DS (Fig. 4). • No deaths were associated with tornadoes produced by QL (Fig. 4). • 47.5% of the 427 tornadoes were nocturnal. • QL were more common at night; CC were more common during daylight (Fig. 5). • Spring was the most tornadic season for each convective mode (Fig. 6). • Summer was the least active season, with CC producing the majority of tornadoes (Fig. 6). • CL and CC produced the majority of tornadoes in the fall (Fig. 6). • QL and DS produced the majority of tornadoes in the winter, the second most active season (Fig. 6). • The only EF5 tornado during the period of study was produced by a DS (Fig. 7). • No EF3–5 tornadoes were associated with QL (Fig. 7). Conclusions Statewide convective mode analysis provides localized knowledge for National Weather Service (NWS) forecasters. While spring is the most active season, Tennessee residents face a year-round risk of tornadoes. Results show DS were associated with the most tornado-related fatalities and were the top producers of EF2–5 tornadoes, suggesting that forecasters should be extra vigilant when these convective modes are present. QL produced only weak and non-fatal tornadoes. However QL were also the most common producers of nocturnal tornadoes, demonstrating that this mode still poses a risk. Future research includes interviewing NWS forecasters in Tennessee Weather Forecasting Offices to gain firsthand accounts of how convective modes affect tornado forecasting and warning dissemination across the state. 20 10 30 40 50 60 70 80 DBZ N 0 62.5 125 250 Kilometers