1. Calculating the predictability of climate change: the effect of climate change on
moth species in the Pacific Northwest varies among functional groups.
Julie A. Maurer, Merrill A. Peterson; Biology Dept., Western Washington University
Introduction
• Climate change has driven shifts in phenology and distribution for many
species. These effects are often idiosyncratic3 and it remains unclear whether
they vary consistently among functional groups, limiting our ability to draw
broad conclusions about how climate change affects species4.
• Previous studies have indicated that Lepidoptera (butterflies and moths) are
sensitive to climate change.1
• We analyzed a large database of moth specimen records from the Pacific
Northwest (PNW) to examine climate change responses over more than 100
years for a suite of 241 functionally diverse species, including spring and fall
active species as well as dietary generalists and specialists (Table 1).
• Our goal was to investigate the effect of among-year variation in regional late
winter to early spring temperatures on the seasonal timing of adult activity,
and whether that effect differs among moth functional groups.
• We hypothesized that moths would have earlier flight dates in warmer years,
and that this effect would be greatest for both early-season and dietary
specialists.
Methods
• We obtained annual temperatures anomalies for each year in which we had
moth data (1895-2015), drawing from NOAA climate records5 (Fig. 1).
• Only single-brooded moth species with at least 100 complete collection
records were included in the analysis.
• Multiple records of a species from a locality in a given year were reduced to the
median Julian Date (JD) of those records, to avoid pseudoreplication.
• We used generalized linear mixed models (GLMMs) to determine the effect of
temperature anomaly on flight date for each species.
• Elevation, latitude, and longitude were included as random effects to account
for phenological differences due to these factors2.
• For each species, we determined the shift in flight date (days/˚C) resulting from
a 1˚ C increase from the historical average temperature, based on the species-
specific relationships between anomaly and flight date (Fig. 2a).
• To assess whether moths generally fly earlier in warmer years, we analyzed the
distribution of slopes of these relationships using a one-tailed t-test.
• To determine if functional groups differ in the probability of exhibiting a
significant response to temperature anomaly, we used G-tests.
• We used ANOVA to compare slopes for the anomaly-flight date relationship
across functional groups, to test the hypothesis that the magnitude of the
effect of temperature anomaly varies among groups.
Acknowledgements
We thank Dr. Ben Miner for many helpful conversations about statistical methods and Ryan McLaughlin for
Python code that made data processing much easier. In addition, we are grateful to the many people who
contributed to the development of the Pacific Northwest Moths website, but especially to Jon Shepard for
obtaining the bulk of the collection records and Lars Crabo for ensuring accurate specimen identification.
References
1Caldas, A. 2014. Species traits of relevance for climate vulnerability and the prediction of phenological responses to climate change. J. Lepid Soc. 68;197-202.
2Highland, S. A., Miller, J. C., & Jones, J. A. 2013. Determinants of moth diversity and community in a temperate mountain landscape: Vegetation, topography,
and seasonality. Ecosphere 4;1-22.
3Kharouba, H. M., Paquette, S. R., Kerr, J. T., & Vellend, M. 2013. Predicting the sensitivity of butterfly phenology to temperature over the past century. Global
Change Biol. 20;504-514.
4Mote, P. M., Parson, E. A., Hamlet, A. F., Keeton, W. S., Lettenmaier, D., Mantua, N., Miles, E. L., Peterson, D. W., Peterson, D. L., Slaughter, R., Snover, A. K.
2003. Preparing for climatic change: The water, salmon, and forests, of the Pacific Northwest. Climatic Change 61;45-88.
5NOAA: National Center for Environmental Information (NCEI). Climate at a Glance. (nClimDiv dataset). http://www.ncdc.noaa.gov/cag (accessed 5/11/2016).
Table 1. Moth functional groups compared in this study. Post-hoc analyses of the species-specific
effects of temperature on flight date examined the effect of these two parameters.
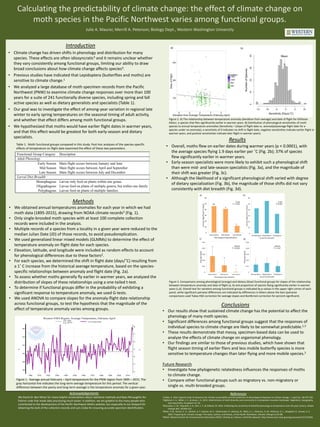
Figure 1. Average annual February – April temperature for the PNW region from 1895 – 2015. The
gray horizontal line indicates the long-term average temperature for this period. The vertical
difference between the yearly and long-term average is the temperature anomaly for a given year.
Results
• Overall, moths flew on earlier dates during warmer years (p < 0.0001), with
the average species flying 1.9 days earlier per ˚C (Fig. 2b); 37% of species
flew significantly earlier in warmer years.
• Early-season specialists were more likely to exhibit such a phenological shift
than were mid- and late-season specialists (Fig. 3a), and the magnitude of
their shift was greater (Fig. 3c).
• Although the likelihood of a significant phenological shift varied with degree
of dietary specialization (Fig. 3b), the magnitude of those shifts did not vary
consistently with diet breadth (Fig. 3d).
Conclusions
• Our results show that sustained climate change has the potential to affect the
phenology of many moth species.
• Significant differences among functional groups suggest that the responses of
individual species to climate change are likely to be somewhat predictable.1,3
• These results demonstrate that messy, specimen-based data can be used to
analyze the effects of climate change on organismal phenology.
• Our findings are similar to those of previous studies, which have shown that
flight season timing of earlier fliers and less mobile butterfly species is more
sensitive to temperature changes than later flying and more mobile species.3
Future Research
• Investigate how phylogenetic relatedness influences the responses of moths
to climate change.
• Compare other functional groups such as migratory vs. non-migratory or
single vs. multi-brooded groups.
Figure 2. A) The relationship between temperature anomaly (deviation from average) and date of flight for Orthosia
hibisci, a species that flies significantly earlier in warmer years. B) Distribution of phenological sensitivities of moth
species to annual temperature anomalies (Sensitivity = (slope of flight date vs. anomaly)x(average flight date for a
species under no anomaly); a sensitivity of 0 indicates no shift in flight date, negative sensitivities indicate earlier flight in
warmer years, and positive sensitivities indicate later flight in warmer years).
Figure 3. Comparisons among phenological (orange) and dietary (blue) functional groups for slopes of the relationship
between temperature anomaly and date of flight (a, b) and proportion of species flying significantly earlier in warmer
years (c,d). Overall test for variation among functional groups is indicated by p-values in the upper right corner of each
panel, while significant pairwise differences are indicated by differences in letters above the bars (pairwise
comparisons used Tukey HSD correction for average slopes and Bonferroni correction for percent significant).