Downloaded 47 times
- 1 / 20
- 2 / 20
- 3 / 20
- 4 / 20
- 5 / 20
- 6 / 20
- 7 / 20
- 8 / 20
- 9 / 20
- 10 / 20
- 11 / 20
- 12 / 20
- 13 / 20
- 14 / 20
- 15 / 20
- 16 / 20
- 17 / 20

- 18 / 20
- 19 / 20
- 20 / 20
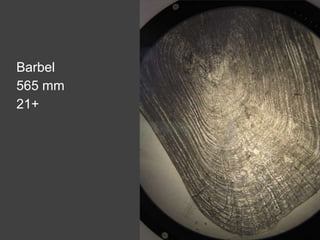

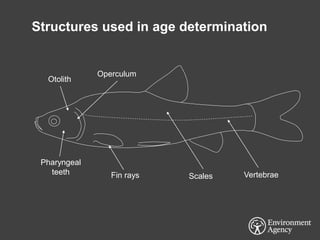
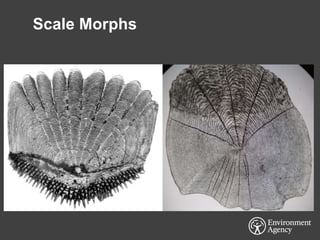
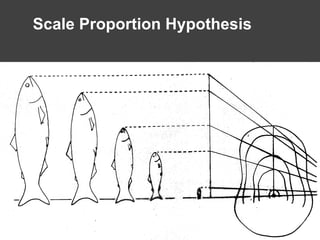
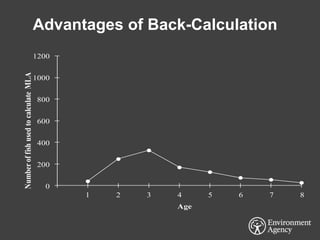
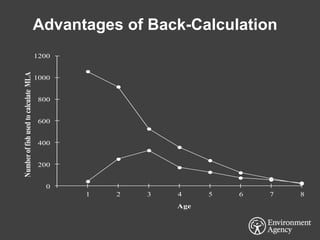
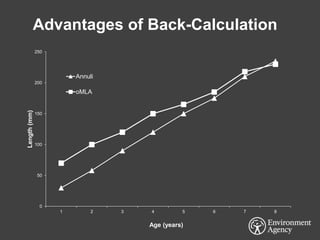
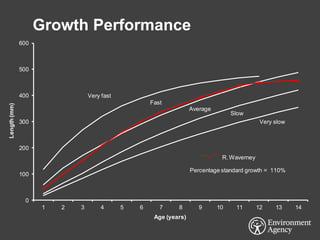
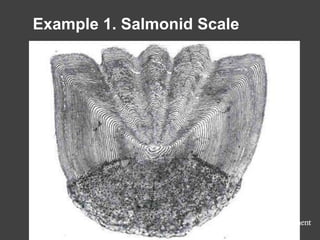
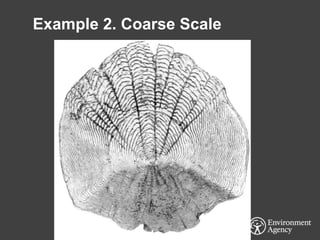
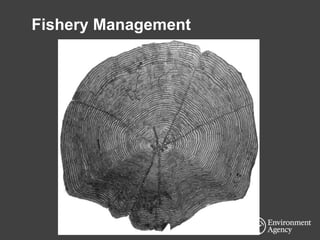
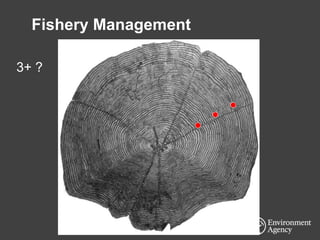
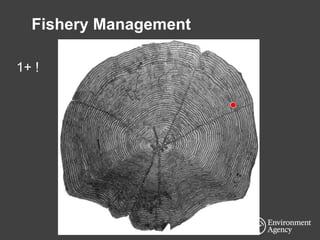
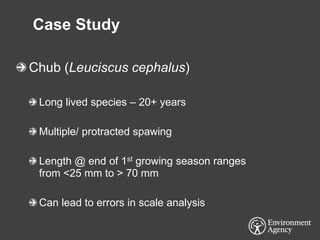
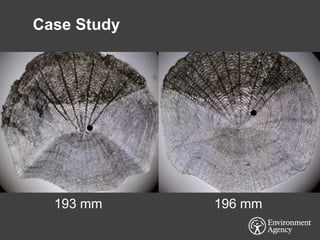
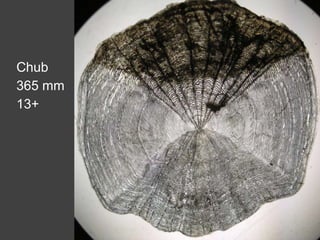
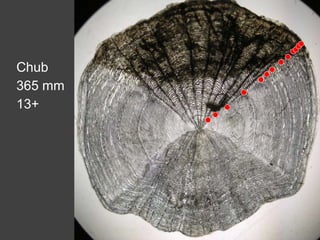
The document discusses methods for determining the age of coarse fish, specifically focusing on the utility of scale readings among other structures. It covers topics such as fish population age structure, advantages of back-calculation in growth performance assessments, and case studies, including that of the chub (Leuciscus cephalus). The author highlights the importance of accurate age determination for effective fishery management and rehabilitation efforts.


