This document outlines a practical lab on fish population dynamics. It includes definitions of key terms like fish population dynamics, stock, and gonosomatic index. It also describes several common methods to estimate fish population parameters and stock abundance, like mark-recapture methods, depletion methods, and sampling surveys. Specific questions ask students to calculate growth parameters, length-weight relationships, population estimates, and compare models like the von Bertalanffy and Ford-Walford plots used for growth estimation. The document provides data to help students complete calculations and analysis for the lab.
Nile tilapia inhabiting Doma Dam and Abu Zabal Lake primarily consume phytoplankton, especially diatoms. Analysis of gut contents from fish in both bodies of water found diatoms to be the most common food item of plant origin. While the stomachs of some fish were empty, likely during spawning periods, plant material generally dominated the diets of Nile tilapia. However, supplementary feeding may be needed in Doma Dam where food availability is limited. Overall, the papers highlighted phytoplankton, particularly diatoms, as the key component of Nile tilapia diets in these aquatic ecosystems.
Snappers are a family of fish found in tropical and temperate waters around the world. They range in size from medium to large and some species can reach over 1 meter in length. Several species of snappers are commercially important as food fish, for sport fishing, and for aquariums. Snappers support important fisheries but some populations have declined due to overfishing of spawning aggregations. Management efforts include aquaculture to enhance wild stocks and meet commercial demand.
This document discusses the natural food and feeding habits of fishes. It covers different types of plankton, benthos, and detritus that serve as food sources for fishes based on their ecological niche. Various feeding classifications are described, including feeding types, trophic niches, and quantitative analyses of gut content. Structural modifications in fishes related to their different feeding habits are also mentioned.
This document discusses polyculture of carp fish in Bangladesh. It describes that polyculture involves culturing multiple fish species together that have different feeding habits and ecological niches. Common carp species cultured together in Bangladesh include various types of indigenous carp like rohu, mrigal carp, and exotic carp like silver carp. Effective polyculture management requires selecting compatible species, maintaining suitable water quality parameters, providing adequate natural and supplemental food, monitoring fish health and growth, and preventing diseases. Polyculture aims to maximize fish production from a water body by fully utilizing available resources.
Grouper are a family of fish found in marine environments around the world. They have stout bodies, large mouths, and come in a variety of colors depending on species. While not fast swimmers, some grouper species can grow very large, over a meter in length and 100 kg in weight. Grouper reproduce through both sex change and dedicated sexes depending on species, with larger males typically controlling harems. They are an important part of marine ecosystems, preying on other fish and invertebrates while also serving as prey for larger predators.
Live feed enrichment,Biorouting of nutrients.Chemo-therapeutants & othergrowt...SukalpaMandal1
This document discusses various techniques for enriching live feeds used in fish hatcheries, including rotifers and artemia. It describes enriching live feeds with fatty acids, vitamins, proteins, minerals, and probiotics to improve their nutritional value for fish larvae. The document also discusses bio-routing of nutrients in aquaculture ponds and the use of chemotherapeutants, antibiotics, and other growth promoting agents to treat diseases and promote growth in farmed fish.
This document discusses parasitic diseases of fish. It covers various protozoan parasites like Ichthyophthirius multifilis and Epistylis sp. that can infect fish skin and gills. It also discusses metazoan parasites like monogenean trematodes of the genus Dactylogyrus and Gyrodactylus that attach to fish gills and skin, and nematodes of the genus Contracaecum that can infect fish intestines and other tissues. The life cycles of these parasites are described along with the diseases they can cause in fish like emaciation, decreased growth and survival. Methods for specimen collection and examination for parasites are also outlined.
This document discusses laws related to inland fisheries in India. It covers topics such as leasing of open water bodies, culture-based fisheries, aquaculture regulations, land reforms acts, control of destructive fishing practices, and conservation efforts. Key points include preferential leasing of tanks to cooperatives and youth groups, costs associated with culture-based fisheries, inclusion of fish/shrimp farming as agricultural activities, and management of open access water bodies of different sizes.
This document provides taxonomic classification and information about groupers, including their life cycle, reproduction, commonly cultured species, hatchery design considerations, and broodstock acquisition and management. Groupers are popular aquaculture species in Asia-Pacific known for their fast growth and hardiness. They are mostly protogynous hermaphrodites that change sex from female to male. Hatchery design focuses on biosecurity to prevent diseases like viral nervous necrosis. Broodstock are selected based on health and size criteria and held in large tanks before spawning.
This document discusses the non-penaeid prawn fishery of India. Some key points:
- The fishery is mainly supported by species like Acetes indicus, A. johni, Nematopalaemon tenuipes, and Exhipolysmata ensirostris.
- Major landing sites are along the coasts of Maharashtra and Gujarat.
- Species like A. indicus have an annual production cycle, breeding throughout the year with a peak in January. Their lifespan is typically 3-6 months.
- The prawns are caught mainly as bycatch using nets like bag nets and dol nets. While a low value
This document provides an overview of different fishing gears and techniques. It discusses the main categories of active gears like trawls and dredges that chase fish, and passive gears like gillnets and traps that sit and allow fish to approach. Specific gear types are described in detail such as purse seines, trammel nets, longlines and various trawl nets. Both advantages and disadvantages of different fishing methods are presented. The document emphasizes the importance of selecting the right fishing gear and using it sustainably to minimize environmental impacts.
Aquaculture refers to culturing aquatic animals like fish, shrimp, and shellfish. It began over 4000 years ago when Sumerians kept fish in ponds. Ancient Egyptians, Romans, Chinese, and Indians also engaged in early forms of fish culture. In modern times, aquaculture has expanded globally and plays an important role in food production, economic growth, and employment. A wide variety of fish, shellfish, algae and other aquatic species are now farmed using advanced techniques.
This document provides an introduction to fish stock assessment and key concepts. It discusses the primary objective of fish stock assessment as determining the optimal exploitation level to achieve maximum sustainable yield. It defines the stock concept as a subset of a species inhabiting a particular area with consistent growth and mortality parameters. The document emphasizes that fish stock assessment should be performed separately for each identified stock.
This document contains information about an exam on fish diseases and management. It includes (1) a matching question about different fish diseases and their causes, (2) short note topics about biological oxygen demand, water intoxication, and more, and (3) questions asking to tabulate differences between various diseases. The document provides sample exam questions, short notes assignments, and information about fish diseases and management.
Recirculating aquaculture systems (RAS) operate by filtering water from the fish (or shellfish) tanks so it can be reused within the tank. This dramatically reduces the amount of water and space required to intensively produce seafood products.
This document discusses the feeding habits and nutritional requirements of fish at different life stages. It begins by explaining that fish require energy, amino acids, fatty acids, vitamins, and minerals to sustain life and promote growth. It then discusses the feeding behaviors and nutritional needs of fish larvae, including their underdeveloped digestive systems and reliance on plankton and zooplankton. The document also categorizes different types of food sources for fish and classifies fish based on their dependence on food types and positions in the water column. Specific examples are provided of the feeding behaviors of fish larvae, juveniles, and adults.
This slide is about a pearl spot fish which includes about its habit, habitat ,morphology, food and feeding, breeding behaviour, hatching, larval rearing, embryonic development, nutritive values, farming practices, seed production and pond preparation...
This document discusses larval rearing and aquaculture in India. It notes that while India has vast aquatic resources, it has failed to utilize even 50% of its water bodies for aquaculture. It identifies several key constraints including poor survival and quality of larvae, inadequate infrastructure and technical competency. It discusses issues with hatcheries like genetic degradation, use of conventional methods, and technical incompetence. It suggests lessons can be learned from other countries and fields to improve Indian aquaculture and move towards more precision farming approaches.
Asian sea bass, also known as giant perch or Bhetki, is a profitable species for aquaculture in Southeast Asia. It can be cultured in both freshwater and saltwater. Hatcheries in Thailand produce sea bass fry that are also exported to other countries. Major challenges for sea bass culture are cannibalism among young fish and dependence on fishmeal. The life cycle involves nursery rearing of fry from 2-5 grams to 5-10 centimeters, then grow out in ponds or cages to a market size of 300-400 grams in 3-4 months or 700-1200 grams in 8-12 months. Sea bass is commonly cultured with tilapia in polyculture systems.
Introduction
Fish Health Management GOALS
Principles of fish health management
Factors affecting fish health
Common symptoms of diseases
General preventive measures
Proper Health Management through Manipulating the disease triangle
Conclusion
References
This document provides information about seine nets, which are rectangular nets used to surround and catch schools of fish. It describes the basic components of a seine net, including the netting material, ropes, floats, and sinkers. There are different types of seine nets categorized by their structure, including beach seines, lampara seines, Danish seines, and purse seines. Seine nets target both demersal and pelagic species and can be used in inland and marine waters.
Biology and Aquaculture Pearl spot E. suratensisB. BHASKAR
This document provides information on the biology, aquaculture, and culture of Pearl spot fish. Some key points:
- Pearl spot is an indigenous fish found along India's coasts that is important for aquaculture. It is cultured in brackishwater and freshwater environments.
- Details are provided on its classification, life cycle, breeding/spawning behavior, hatchery seed production techniques, and pond preparation for culturing.
- For grow-out culture, Pearl spot can attain market size within 8-10 months under monoculture or polyculture. Yields of 1,000 kg/ha/year are possible at stocking densities of 20,000-30,000 fish/ha. Pro
Engineering aspects of fish and shrimp hatcheryRAONE1994
This document discusses key considerations for establishing a fish or shrimp hatchery, including site selection criteria, basic hatchery facility requirements, and design principles. Specifically, it addresses factors like water availability and quality, infrastructure needs, broodstock requirements, and ensuring proper tank designs for maturation, spawning, larval rearing, and more. Topography, soil composition, and environmental conditions are among the important site characteristics to evaluate. The document provides technical guidance on setting up various hatchery systems and components.
This document provides information about grow-out techniques for Penaeus monodon. It includes sections on the scientific classification of P. monodon, an overview of extensive, semi-intensive and intensive grow-out techniques, the production cycle from spawning to harvest, prawn physiology, ideal geographical locations, pond preparation including soil and water management, prawn feed, harvest, and disease control measures. It also lists members of a grow-out culture group and provides an outline of topics to be covered.
Cage culture involves confining fish or shellfish within mesh enclosures in existing water bodies like ponds, rivers, and oceans. Some key advantages are the flexibility to use different water resources with minimal initial investment. However, there are also disadvantages like the need for complete diets, high risk of disease transmission due to crowding, potential for localized water quality issues, and limitations to production yields. Cage aquaculture has rapidly expanded in recent decades and continues to adapt to growing global demand through clustering cages and developing more intensive cage farming systems.
This document discusses monosex tilapia and GIFT tilapia. It explains that monosex tilapia are all male populations that are easy to farm since they do not breed uncontrollably. Monosex tilapia can be produced through hybridization, manual sexing, or hormone treatment. GIFT tilapia were developed through selective breeding to grow quickly and survive well, increasing aquaculture yields. GIFT tilapia have faster growth, improved survival, allow for three crops per year, and generate additional income for farmers.
Organic aquaculture refers to ecological production management systems that promote biodiversity and biological cycles. It is based on minimal off-farm inputs and holistic practices. Historically, organic aquaculture developed from the organic agriculture movement in the early 1990s in Europe. Standards were established and production has grown significantly since, now totaling over 50,000 tonnes globally per year. Major species include salmon, shrimp, and carp. Principles of organic aquaculture standards include an absence of GMOs, limited stocking densities, and nutrient recycling rather than intensive inputs. While still nascent, organic aquaculture is growing in India through projects like organic scampi farming in Andhra Pradesh.
1. The document discusses a study analyzing the growth rates of ferox trout using scale analysis and the Von Bertalanffy growth function model.
2. Significant differences were found between sympatric ferox trout and brown trout populations in Loch Awe and Loch Rannoch for certain growth parameters.
3. While scale analysis provides a non-lethal method, there are limitations to its accuracy which the study acknowledges, though it maintains scales are still preferable to otoliths for analyzing rare ferox trout.
This document studies the length-weight relationship of Mugil cephalus, a species of grey mullet, collected from the Kovalam coast of Chennai, India. The slope value (b) estimated for both male and female M. cephalus was 1.0368, indicating allometric growth. The regression equation for females was Log W = -0.7292 + 1.0368 Log L. The growth was found to be significantly different between sexes. Comparing the slope value to other brackishwater fish species, it was concluded that the slope value of 1.0368 for M. cephalus is less than the typical value of 3, indicating their growth pattern differs from the
1. Von Bertalanffy's growth equation is commonly used to model fish growth and estimate growth parameters.
2. The key growth parameters estimated include asymptotic length (L∞), growth coefficient (K), and theoretical age at zero length (t0).
3. Various methods can be used to estimate the parameters from length-at-age data, including Gulland and Holt plot, Ford-Walford plot, and Chapman's method. Estimated parameters are then used in fish stock assessment models.
The document discusses Von Bertalanffy growth parameters which are used as input data in fish stock assessment methods. It describes how growth parameters like length infinity, growth coefficient, and initial condition parameter are estimated. These parameters differ between species, sexes, and stocks. They are determined from length frequency data, mark recapture experiments, and age and growth estimation from hard parts. The parameters are then used to estimate mortality and in yield/recruit models to assess fish stocks.
This document discusses a study on the length-weight relationship of Pearl spot (Etroplus suratensis) fish collected from Pulicat Lake in southeast India. A total of 120 fish ranging from 3.5 to 10.5 cm in length and 2.0 to 34.0 g in weight were measured. Regression analysis found the length-weight relationship to follow an allometric growth pattern. The slope value (b) was estimated to be 1.0368, indicating the weight does not increase cubically with length. Separate regression equations were calculated for males and females. The study provides baseline information that can be used for future research and population comparisons.
- Mathematical models can be used to predict future fish stock levels and yields in order to help sustainably manage fisheries (1).
- The Beverton-Holt yield-per-recruit model is a classic population model that can estimate yield from a given number of recruits based on factors like fishing mortality and mesh size (2).
- Using this model and testing different fishing mortality levels, the maximum sustainable yield and optimal fishing mortality can be determined to help set management measures like mesh size regulations (3).
Size distribution and biometric relationships of little tunny Euthynnus allet...inventy
This study is taken from data of commercial fishing of the little tunny, Euthynnus alletteratus (Rafinesque, 1810) caught in the Algerian coast, sampled between november 2011 and april 2016. Data were collected in order to determine size distributions of the population and biometric relationships of species including the size - weight relationships. A total of 601 fish ranged from 30.9 and 103 cm fork length (FL) were observed. The size distribution of Euthynnus alletteratus shows multiple modal values witch the most important cohort corresponds to the age class 2 (42-46 cm). The value of the allometric coefficient (b) of the FL/TW relationship is lower than 3, indicating a negative allometric growth.
fish population dynamics, Population structureDegonto Islam
Estimation of fish population dynamics are often based on age structures. Understanding past
population structure is of interest to evolutionary biologists because it can reveal when migration
regimes changed in natural populations, thereby pointing to potential environmental factors such as
climate changes as driving evolutionary forces. Characterizing the structure of extent populations is also
key to conservation genetics as translocation or reintroduction decisions must preserve evolutionary
stable units. Finally, population structure has important biomedical consequences either when a number
of subpopulation groups is locally adapted to particular environmental conditions (and maladapted
when exposed to new environments) or represents a confounding factor in the study of the statistical
association between genetic variants and phenotyp
International Journal of Engineering Research and DevelopmentIJERD Editor
Electrical, Electronics and Computer Engineering,
Information Engineering and Technology,
Mechanical, Industrial and Manufacturing Engineering,
Automation and Mechatronics Engineering,
Material and Chemical Engineering,
Civil and Architecture Engineering,
Biotechnology and Bio Engineering,
Environmental Engineering,
Petroleum and Mining Engineering,
Marine and Agriculture engineering,
Aerospace Engineering.
This document summarizes a study on the age, growth, mortality and exploitation of Liza falcipinnis fish in Ebrié and Grand-Lahou lagoons in Ivory Coast. Population parameters were estimated using length frequency data analyzed with FiSAT software. Asymptotic length was 39.9cm for Ebrié lagoon and 42cm for Grand-Lahou lagoon. Total mortality was estimated at 1.28 years-1 for Ebrié lagoon and 1.43 years-1 for Grand-Lahou lagoon. Exploitation levels were estimated to be 0.36 for Ebrié lagoon and 0.37 for
Population dynamics of 15 fish species in Grand-Lahou lagoon (West Africa, Cô...Open Access Research Paper
This study described growth, mortality, recruitment patterns and exploitation rates of 15 fish species in Grand-Lahou lagoon (Côte d’Ivoire). Monthly length-frequency data collected from artisanal fisheries from November 2013 to October 2014 were analyzed with FiSAT software using the ELEFAN package to estimate the population parameters of fishes. Asymptotic values for total length (L∞) ranged from 15.75 cm for Synodontis schall to 59.80 cm for Trachinotus teraia. Growth rate (k) varied from 0.19 for Coptodon guineensis to 0.98 for Caranx hippos. The growth performance index estimates were close to the values found by other authors for most of the fish species. The total mortality (Z) high values were recorded for Synodontis schall (Z= 4.15 year-1; M = 2.50 year-1) Schilbe mandibularis (Z= 2.19 year-1; M=1.33 year-1). Fishing mortality (F) and exploitation rate (E) were found to be less than the optimum levels of exploitation for most fish species. The exploitation rate (E) was higher than the maximum sustainable yield (Emax) for Caranx hippos and higher than E0.5 for Eucinostomus melanopterus, Elops lacerta and Synodontis schall. Recruitment was noted as year-round and bimodal for most studied populations. These results demonstrate that some fish stocks necessitate effective management measures particularly C. hippos, E. melanopterus, E. lacerta and S. schall.
This lab report summarizes a population dynamics simulation of seals and killer whales. The purpose was to analyze how predation, birth and death rates impact marine populations over time. Variables like initial population sizes, growth and death rates were adjusted. Results showed the highest populations occurred when seal numbers were highest, providing more food for whales. Birth rates affected both species' capacities, as they depend on each other. Climate change reducing seal habitat could decrease their numbers by improving whale hunting efficiency. Introducing another whale food source may cause both populations to rise. The simulation showed a sigmoid relationship between the two species. While simplifying nature, the lab helped visualize ecosystem interactions.
This document discusses the age and growth of the red toothed triggerfish (Odonus niger) off the coast of Thoothukudi, India. It estimates the von Bertalanffy growth parameters for O. niger as L∞ = 283.90 cm and K = 0.75 based on length frequency data. Total mortality (Z) was estimated to be 1.07 and fishing mortality (F) was 0.27. The natural mortality (M) was estimated to be 0.80. The exploitation ratio was estimated to be 0.25, indicating the stock is under fishing pressure. The length at first capture was close to the length that provides maximum yield per recruit. The lifespan of O
This document discusses the age and growth of the red toothed triggerfish (Odonus niger) off the coast of Thoothukudi, India. It analyzed samples collected from bottom trawls between 2008° 53.6'N latitude 78° 16'E longitude and 08° 53.8'N latitude 78° 32'E longitude. The von Bertalanffy growth parameters were estimated as L∞ = 283.90 cm and K = 0.75. Total mortality was estimated to be 1.07 and fishing mortality was 0.27. The exploitation ratio was estimated to be 0.25, indicating the stock is under fishing pressure. The estimated life span of O. niger appears to
Length Frequency Distribution, Length-Weight Relationship and Condition Facto...paperpublications3
Abstract: Length –Frequency Distribution, Length – Weight relationship and condition factor of Pomadasys jubelini from the Lagos lagoon were investigated for 6months in order to study the growth pattern and wellbeing of P.jubelini. A total of 305 specimens of P.jubelini were purchased from local fisher-folks on landing sites at different locations within the Lagos lagoon ( Majidun, Makoko, Ibese, Bayeiku) from January 2012 to June 2012 and used for this study. Their Total length ranging from 12cm to 29.5cm and body weight ranged from 21.3g to 367g. The frequency distribution showed a polymodal distribution of P.jubelini. The size class of 18.0cm to 20.9cm (TL) was more abundant. The length weight relationship was determined by regression coefficient equation Log W= -1.8357+2.9628LogL (n =305, r = 0.9213). P.jubelini showed negative allometric growth (b= 2.96). The mean condition factor 1.31, indicates that P.jubelini were in good condition in the lagoon. The result from this study is relevant for fishery management and stock assessment studies of P.jubelini from the Lagos lagoon.
This document analyzes the weight-length relationship of the rosy barb fish (Puntius conchonius) collected from water bodies in Nagaland, India. 50 fish ranging from 5.2-7.6cm and 1.6-7.1g were measured. Log-transformed regressions found significant correlations between length and weight for mixed, male, and female populations, though growth was negatively allometric. The relationships suggest predictive equations can estimate weight from length and vice versa. The study provides information on the growth and management of the species' fisheries in Nagaland.
Accretion Profile of the Rosy Barb, Puntius Conchonius (Hamilton- Buchanan, 1...IOSR Journals
Present study was made on 50 freshwater wild Puntius conchonius (Hamilton - Buchanan) of
various sizes ranging from a total length of 5.2 cm to 7.6 cm and weighing 1.6 gm to 7.1 gm. They were
sampled from different lentic and lotic water bodies of Nagaland, to investigate the weight-length relationship.
Each fish was measured and weight was taken. Log transformed regressions were used to test the growth trend. It was observed that growth in weight is not proportional to the cube of its length. Coefficient of correlation values for both male and female as well as for mixed population were found to be highly significant.
Or: Beyond linear.
Abstract: Equivariant neural networks are neural networks that incorporate symmetries. The nonlinear activation functions in these networks result in interesting nonlinear equivariant maps between simple representations, and motivate the key player of this talk: piecewise linear representation theory.
Disclaimer: No one is perfect, so please mind that there might be mistakes and typos.
dtubbenhauer@gmail.com
Corrected slides: dtubbenhauer.com/talks.html
Current Ms word generated power point presentation covers major details about the micronuclei test. It's significance and assays to conduct it. It is used to detect the micronuclei formation inside the cells of nearly every multicellular organism. It's formation takes place during chromosomal sepration at metaphase.
The debris of the ‘last major merger’ is dynamically youngSérgio Sacani
The Milky Way’s (MW) inner stellar halo contains an [Fe/H]-rich component with highly eccentric orbits, often referred to as the
‘last major merger.’ Hypotheses for the origin of this component include Gaia-Sausage/Enceladus (GSE), where the progenitor
collided with the MW proto-disc 8–11 Gyr ago, and the Virgo Radial Merger (VRM), where the progenitor collided with the
MW disc within the last 3 Gyr. These two scenarios make different predictions about observable structure in local phase space,
because the morphology of debris depends on how long it has had to phase mix. The recently identified phase-space folds in Gaia
DR3 have positive caustic velocities, making them fundamentally different than the phase-mixed chevrons found in simulations
at late times. Roughly 20 per cent of the stars in the prograde local stellar halo are associated with the observed caustics. Based
on a simple phase-mixing model, the observed number of caustics are consistent with a merger that occurred 1–2 Gyr ago.
We also compare the observed phase-space distribution to FIRE-2 Latte simulations of GSE-like mergers, using a quantitative
measurement of phase mixing (2D causticality). The observed local phase-space distribution best matches the simulated data
1–2 Gyr after collision, and certainly not later than 3 Gyr. This is further evidence that the progenitor of the ‘last major merger’
did not collide with the MW proto-disc at early times, as is thought for the GSE, but instead collided with the MW disc within
the last few Gyr, consistent with the body of work surrounding the VRM.
The binding of cosmological structures by massless topological defectsSérgio Sacani
Assuming spherical symmetry and weak field, it is shown that if one solves the Poisson equation or the Einstein field
equations sourced by a topological defect, i.e. a singularity of a very specific form, the result is a localized gravitational
field capable of driving flat rotation (i.e. Keplerian circular orbits at a constant speed for all radii) of test masses on a thin
spherical shell without any underlying mass. Moreover, a large-scale structure which exploits this solution by assembling
concentrically a number of such topological defects can establish a flat stellar or galactic rotation curve, and can also deflect
light in the same manner as an equipotential (isothermal) sphere. Thus, the need for dark matter or modified gravity theory is
mitigated, at least in part.
Unlocking the mysteries of reproduction: Exploring fecundity and gonadosomati...AbdullaAlAsif1
The pygmy halfbeak Dermogenys colletei, is known for its viviparous nature, this presents an intriguing case of relatively low fecundity, raising questions about potential compensatory reproductive strategies employed by this species. Our study delves into the examination of fecundity and the Gonadosomatic Index (GSI) in the Pygmy Halfbeak, D. colletei (Meisner, 2001), an intriguing viviparous fish indigenous to Sarawak, Borneo. We hypothesize that the Pygmy halfbeak, D. colletei, may exhibit unique reproductive adaptations to offset its low fecundity, thus enhancing its survival and fitness. To address this, we conducted a comprehensive study utilizing 28 mature female specimens of D. colletei, carefully measuring fecundity and GSI to shed light on the reproductive adaptations of this species. Our findings reveal that D. colletei indeed exhibits low fecundity, with a mean of 16.76 ± 2.01, and a mean GSI of 12.83 ± 1.27, providing crucial insights into the reproductive mechanisms at play in this species. These results underscore the existence of unique reproductive strategies in D. colletei, enabling its adaptation and persistence in Borneo's diverse aquatic ecosystems, and call for further ecological research to elucidate these mechanisms. This study lends to a better understanding of viviparous fish in Borneo and contributes to the broader field of aquatic ecology, enhancing our knowledge of species adaptations to unique ecological challenges.
ESPP presentation to EU Waste Water Network, 4th June 2024 “EU policies driving nutrient removal and recycling
and the revised UWWTD (Urban Waste Water Treatment Directive)”
Comparing Evolved Extractive Text Summary Scores of Bidirectional Encoder Rep...University of Maribor
Slides from:
11th International Conference on Electrical, Electronics and Computer Engineering (IcETRAN), Niš, 3-6 June 2024
Track: Artificial Intelligence
https://www.etran.rs/2024/en/home-english/
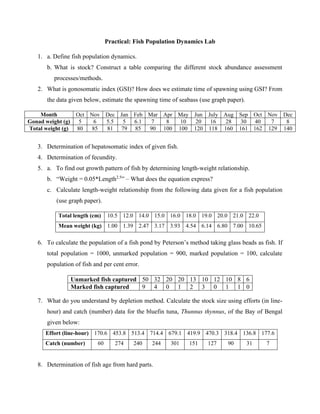
1. Practical: Fish Population Dynamics Lab
1. a. Define fish population dynamics.
b. What is stock? Construct a table comparing the different stock abundance assessment
processes/methods.
2. What is gonosomatic index (GSI)? How does we estimate time of spawning using GSI? From
the data given below, estimate the spawning time of seabass (use graph paper).
Month Oct Nov Dec Jan Feb Mar Apr May Jun July Aug Sep Oct Nov Dec
Gonad weight (g) 5 6 5.5 5 6.1 7 8 10 20 16 28 30 40 7 8
Total weight (g) 80 85 81 79 85 90 100 100 120 118 160 161 162 129 140
3. Determination of hepatosomatic index of given fish.
4. Determination of fecundity.
5. a. To find out growth pattern of fish by determining length-weight relationship.
b. “Weight = 0.05*Length2.5
” – What does the equation express?
c. Calculate length-weight relationship from the following data given for a fish population
(use graph paper).
Total length (cm) 10.5 12.0 14.0 15.0 16.0 18.0 19.0 20.0 21.0 22.0
Mean weight (kg) 1.00 1.39 2.47 3.17 3.93 4.54 6.14 6.80 7.00 10.65
6. To calculate the population of a fish pond by Peterson’s method taking glass beads as fish. If
total population = 1000, unmarked population = 900, marked population = 100, calculate
population of fish and per cent error.
Unmarked fish captured 50 32 20 20 13 10 12 10 8 6
Marked fish captured 9 4 0 1 2 3 0 1 1 0
7. What do you understand by depletion method. Calculate the stock size using efforts (in line-
hour) and catch (number) data for the bluefin tuna, Thunnus thynnus, of the Bay of Bengal
given below:
Effort (line-hour) 170.6 453.8 513.4 714.4 679.1 419.9 470.3 318.4 136.8 177.6
Catch (number) 60 274 240 244 301 151 127 90 31 7
8. Determination of fish age from hard parts.
2. a. Age determination from scales
b. Age determination from otoliths
9. Mention a list of basic fish growth parameters? Compare the Ford-Walford and von-
Bertalanffy plots for growth estimation.
10. Write the formula of von Bertalanffy growth equation. Calculate the value of K and L∞ based
on the data given below:
Length in one year, Lt 17 24 29 33
Length in one year later, Lt+1 24 29 33 35
11. What is surplus production model? Estimate MSY and FMSY using Schaefer model and Fox
model.
Catch
(t)
382 431.3 656 432 1054 820 745 531.7 764.1 856.1 607 632.1 592.8 533.9 505.4 507.8 593.8
Effort
(hmnd)
17300 21000 22800 15700 72000 95900 100700 71400 66900 95400 85500 71400 66300 45000 41400 34900 31300
3. Question no; 01: Define Fish Population Dynamics.
Fish population dynamics may be defined as the study of the rate of changes in number of fishes
in the population and the factors influencing these changes including the rate of loss and
replacement of individuals and any other regulatory process tending to keep the population number
steady or at last to prevent any change.
Fish population dynamics is a branch of fisheries science dealing with the fluctuation of fish
parameters such as growth, reproduction, recruitment, mortality, survival, yield, abundance,
migration etc.
Question no; 02: What is stock? Construct a table comparing the different
stock abundance assessment process.
Stock is a part of population which is manageable or which we like to manage.
A stock is the part of a fish population which is under consideration from the point of view of
actual or potential utilization. A group of a fish population which shares common ecological and
genetic features. In terms of stock assessment, stock is designated as a subset of species. For fishery
management purposes, stock is a sub group of species.
The estimation of stock abundance is important in determining the effects of fishing and
environmental disturbances as well as in estimating parameters such as mortality. Although
estimates of absolute abundance (the total number of individuals) are sometimes required, it is
often sufficient to obtain estimates of relative abundance – the number of individuals in one area
in relation to the numbers present in another area, or in the same area at another time. estimating
total stock size include sampling surveys, mark–recapture, depletion and swept area methods. The
comparison among the different stock abundance assessment process is given below:
Topics Mark –
recapture
method
Swept area
method
Depletion
method
Sampling
surveys
method
4. Definition Mark recapture
method is a
method commonly
used in ecology to
estimate an animal
population size
where a portion of
the population is
captured, marked,
and released and
then another
portion will be
captured and the
number of marked
individuals within
the sample is
counted.
Trawl net sweeps a
wide area of water
body to catch
(either in weight or
in numbers) put
unit of effort or per
unit of area is an
index of the stock
abundance to
convert absolute
measure of
biomass called
swept area method.
Population size
can be estimated
by the sum of
sequential catches
required to remove
all fish from the
population which
effect of fish
remaining in the
population are
called depletion
method.
Sampling survey
is a method of
examining the
distribution of
organisms by
taking samples
within squares of
known size where
the mean number
in each series of
quadrates can be
compared.
Other’s name Capture –
recapture method,
capture – mark –
recapture method,
sight– resight
method, mark –
release – recapture
method, Peterson
method, the
Lincoln method.
Effective path
swept method
Removal method Quadrat sampling
method
Inventor C.G Johannes
Peterson
Hilborn and
Walters
R. Pound and F.E
Clements
Estimating
equation
N =TC/R
Where, N= stock
size
T= tagged fish
C= total catch
R= recaptured
tagged fish
a= W×TV×D
where, a= swept
area
W= effective
width of the trawl
TV= towing
velocity
D= duration of the
tow
B=Cw/V×(A/a
Where, B=
biomass
Cw= mean catch
weight per tow
Nt=N∞ -∑Ct ∙∙1
Where,
Nt=numbers at
particular time
N∞=original stock
size
∑Ct=cumulative
catch
Nt=CPUEt/q∙∙…2
Where, q=
catchability
coefficient
1 and 2 →
N=A/a×∑x /n
Where,
A=total area
a=quadrant area
∑x/n= x
̄ = mean
number of
samples per
quadrate
5. V= vulnerability of
the fish
A= the total area
a= swept area
B= CPUE×A/a
Where,
B=Biomass
A= total area of
stock
a=circular area of
the traps influence
CPUEt = qN∞ -
q∑Ct
Advantage High accuracy Less time
consuming
Almost perfect
result can be
found
Low cost method
Limitation 1. Tagging
organisms may not
be distributed
themselves
randomly into the
population and
remain as a
separate shoal.
2. The tags have to
be retrieved. If
they are not easily
identified, they
won’t return.
1. Vulnerability is
difficult to
estimate by
conventional
means.
2. Expensive, trawl
net is not
applicable at any
place
3.Time consuming
and large area is
not possible
1.Either the
available fishing
effort was too
small or the
experimental area
was too large to
produce a
reduction in CPUE
over a short time,
depletion have
failed.
1.There exists
biasness in favor
of slow-moving
fish.
Mostly
applied area
Mostly in ponds River River Large area like
Bay of Bengal.
Outcomes Estimate the
individual numbers
in a particular area
Estimate the stock
biomass, not the
number of
individuals
Estimate the total
stock
Estimate the
individual
numbers
Others Anchor tag, PIT
tags are used to tag
in fishes
Trawl net is used Leslie plot, Delury
model, k-pass
processes are used
Standard
deviation process
is used
Question no;03: “Weight =0.05*Length2.5
” – What does the equation express?
6. Weight=0.05*length2.5
, this express the cubic relationship between length(L) and weight(w) which
can be represented by the cubic or power curve equation and the equation is W=aLb
.
Given equation, W=0.05*L2.5
Here,
W=weight of fish
L=length of fish
Catchability coefficient, a = 0.05 [which indicate that no matter how much we change the length,
the minimum weight will be increased at the rate of 0.05. It is a constant value.]
And Slope, b=2.5, which indicate negative allometry
We know that, b=3 is called isometric growth. b<3 fish become inadequate with increasing length
and growth will be negatively allometric. b>3 shows the positive allometric growth and reflecting
optimum condition for growth.
Since that's given here, b=2.5, which is less than 3. That means, the overall growth of the fish we
have taken as sample, are not well in that environment.
Question no;04: Mention a list of basic fish growth parameters? Compare the
Ford-Walford and von-Bertalanffy plots for growth estimation.
A list of basic growth parameters:
Growth may be described in terms of changes in length, width or any other linear dimension as
well as weight.
Growth parameters are used as input data in the estimation of mortality parameters and in
yield/recruit in fish stock assessment. Growth parameters differ from species to species, even
between the sexes and also differ from stock to stock of a species.
Growth parameters are:
• Growth coefficient or curvature parameter (K)
• Theoretical maximum length or asymptotic length (L∞)
• Age at zero length(t0)
Growth coefficient (k): K is a growth coefficient, which is a measure of the rate at which
maximum size is reached. This is a parameter of Von Bertalanffy growth function.
7. Theoretical maximum length (L∞): The length of the fish corresponding to zero increment
is called “length infinity” or asymptotic length. This is the theoretical maximum length that the
species would reach it lived indefinitely.
Age at zero length (t0): It is the initial condition parameter.t0 is the hypothetical age The fish
would have had at zero length, if they had always grown according to VBGF equation. t0 is also
called as ‘arbitrary origin of growth'.
The comparison between Ford-Walford and von-Bertalanffy plots for growth
estimation is given below:
Ford-Walford plots Von-Vertalanffy plots
The inventor of this plots is British editor
Edward Walford.
The inventor of this plots is Austrian biologist
Karl Ludwig von Bertalanffy
Equation of this plot model are
Lt = L∞(1 − exp[−Kt]) and
Lt+1 = L∞(1 − exp[−K]) + Lt exp[−K]
Equation of this plot’s models are
Lt = L∞ (1 − exp[−K(t − t0)]) and
Wt = W∞(1 − exp[−K(t − t0)])3
Parameters of this plot are maximum length,
length at age, growth coefficient and the
length at age one year later.
Parameters of this plot are maximum length,
length at age and growth coefficient.
This plot method for estimating maximum
length and growth coefficient from mean
length at age.
The function is commonly applied in ecology
to model fish growth.
Data is collected at specific times of the year. Data is collected at different times of the year
This plot model shows pseudo-cohort This plot models shows cohort.
It is simple method and growth of fish can
solve in short time.
It is a multiple method and growth of fish can
solved in lengthy time.
Question no;05: What is GSI? How does we estimate time of spawning using
GSI?
GSI: A gonad or gonosomatic index (GI or GSI) is often used to follow the reproductive cycle of
a species over the year at monthly intervals or less. This index, which assumes that an ovary
increases in size with increasing development, compares the mass of the gonad (GM) with the total
mass of the animal (TM). Gonosomatic indices vary greatly and range from less than 1% in many
fish to almost 47% in the European eel.
Gonadosomatic index calculation:
8. The Gonadosomatic Index (GSI) of fish was determined by using the formula:
GSI = 100∗GM/TW
where GSI = Gonadosomatic Index, GW = Gonad weight, TW = Total body weight
Most of the species, including 96% of all fish, are external fertilizers. The chances of sperm
meeting eggs, high larval mortality and vagaries of currents carrying larvae to suitable settling
areas all result in a very low chance of survival. The spawning event may extend over either a
short or long time period, and be at either regular or irregular intervals, but in many species, occurs
once every year. The stimulus (or combination of stimuli) which induces resting gonads to become
active may include endogenous factors (internal events related to growth and maturity), and
exogenous events in the surrounding environment. GSI is a good indicator of reproductive activity,
so the spawning season is determined by an association of the GSI and the frequency distribution
of the gonadal maturity stages.
Stages in ovary development: Often in fisheries work, only the female ovaries are studied,
as these are larger and more easily examined than male testes; it is also assumed that development
of both ovaries and testes are synchronous. Ovaries may be examined microscopically and
classified into various developmental stages. One such classification is shown in the following
table. The progress of ovarian maturation was classified into five stages
Stages Description
0 Ovary not evident, gut and muscles visible
at joint between cephalothoraxes and
abdomen.
1 Ovary milk-white, ovary not visible through
carapace, gut and muscles visible.
2 Ovary pale yellow, ovary not visible
through carapace, gut and muscle visible.
3 Ovary yellow, red chromatophores evident,
ovary visible through carapace, muscle
partially obscured.
4 Ovary orange, red chromatophores, ovary
lobes cover most internal organ, muscle
obscured.
Table 5.1: Stages of reproductive development showing the appearance of ovary and eggs.
9. Ovaries taken from samples of females collected at intervals throughout the year may be classified
into developmental stages, and the percentages of each can be plotted by month in a histogram.
Some percentages of penaeid prawn are given in this table.
Month stage 0 stage 1 stage 2 stage 3 stage 4
July
August 5%
September 8% 4% 2% 1%
October 7% 5% 10% 7%
November 4% 7% 14% 10%
December 5% 6% 12% 3%
January 7% 4% 13% 2%
February 9% 3% 7% 2%
March 1% 3% 3% 7%
April 5%
May
Jun
Table 5.2: Observation of ovary development stages of prawn
Figure 5.3: Percentage of female prawn in five different development stages
Ovary maturation stages based on macroscopic criteria for a penaeid prawn are shown in table 5.2,
with analyses summarized in the histogram in Fig. 5.3. Relatively large numbers of individuals
with highly developed ovaries in November and March suggest peaks in spawning activity during
these periods.
10. Estimation of the time of spawning using GSI: Gonadosomatic index which is an index
of gonad size relative to fish size is a good indicator of gonadal development in fish. The
percentage of body weight of fish that is used for production of eggs is determined by the
gonadosomatic index. The average GSI value of a fish at different month is given below:
Month GM TM GSI
October 5 80 6.25
November 6 85 7.05
December 5.5 81 6.7
January 5 79 6.3
February 6.1 85 7.1
March 7 90 7.7
April 8 100 8
May 10 100 10
Jun 20 120 16.66
July 16 118 13.55
August 28 160 17.5
September 30 161 18.63
October 40 162 24.69
November 7 129 5.42
December 8 140 5.7
Figure 5.4: Seasonal variation in GSI (% of body weight) at different months. This solid line
indicates the average GSI of the month.
3
0 Spawnin
g Time
2
5
2
0
1
5
1
0
5
0
O ND J F M A
M J
Mont
h
J A S 0 N D
Gonadosomatic
Index(GSI)
%
11. GSI was observed in October to March, ranging from 6.25 to 7.7 (% of body weight. From March
to June the GSI values showed a little bit forward trend. But the overall trend of GSI moved a little
bit downward from the month of July. The highest amount of GSI indicates that the breeding
season is very near, i.e., they may breed either at the end of September or anytime in October.
Relatively lower GSI was observed in November to December. Monthly observations of gonadal
development depicted the prolific breeding nature of fishes possessing all maturity stages
throughout the year but with a considerable seasonal variation.
Question no; 06: What is surplus production model? Explain one model to
estimate the MSY.
Surplus production models, sometimes called surplus yield models or biomass dynamic models
are basses on the assumption that a fish stock produces an excess or surplus abundance that can
harvested.
Surplus production models are used to assess stock status and exploitation in data-limited areas
where reliable information on age and length structure and natural mortality are not available. They
are applied not only to stocks with available commercial catch data and some index of exploitable
biomass, such as catch per unit of effort (CPUE) derived from scientific surveys, but also to
migratory stocks and crustaceans that are difficult to age. They assume that sustainable catch is a
simple function of population biomass, regardless of the size and age composition of that biomass.
The primary advantages of surplus production models are that:
(1) Model parameters can be estimated with simple statistics on aggregate abundance and
(2) the models provide a simple response between changes in abundance and changes in
productivity.
The primary disadvantages of such models are that:
(1) They lack biological realism (i.e., they require that fishing have an effect on the population
within 1 year)
(2) They cannot make use of age- or size-specific information available from many fisheries.
However, in some circumstances, surplus production models may provide better answers than age-
structured models.
Maximum sustainable yield (MSY) is a theoretical concept used extensively in fisheries science
and management. In fisheries, MSY is defined as the maximum catch (in numbers or mass) that
can be removed from a population over an indefinite period. The concept of MSY relies on the
surplus production generated by a population that is depleted below its environmental carrying
capacity. Despite many concerns about MSY, MSY remains a key paradigm in fisheries
12. management. However, MSY has evolved from a fisheries management target to a limit on fishing
mortality and biomass depletion.
MSY (also called maximum surplus production, maximum equilibrium catch, maximum constant
yield, maximum sustained yield, sustainable catch) is the highest theoretical equilibrium yield that
can be continuously taken from a stock under existing (average) environmental conditions. It is
the highest catch that still allows the population to sustain itself indefinitely through somatic
growth, spawning, and recruitment.
There are 2 models, by which we can estimate the MSY.
1) The Schaefer model
2) Fox model.
To estimate the MSY, one model is explained below:
The concept of maximum sustainable yield (MSY), the largest annual catch or yield that may be
taken from a stock continuously without affecting the catch of future years has had a fluctuating
history of favor and scorn in fisheries management.
The first model that is most associated with MSY is the surplus production model of Schaefer.
In the Schaefer model, the growth of a population or stock is assumed to increase with time in the
manner of a logistic or S- shaped
The model equation is ;
Bt+1=Bt +rBt(1-Bt/B∞)-Ct
That means the following years biomass ( Bt+1) will equal the present year biomass (Bt) plus the
surplus production minus the catch Ct.. r is the intrinsic rate of increase and B∞ is the unfished
equilibrium stock biomass.
Again
CPUE∞ is the catch per unit effort at the maximum biomass,B∞, of the stock.so that,
CPUE=CPUE∞-(CPUE∞q/r)f
[CPUE∞=a, (-CPUE∞q/r) =b, f=X, CPUE=Y]
13. Which is the straight line of the form:
CPUE=a+bf
As we know the CPUE = C/f so we can express it as,
C=af +bf2
,which is the equation for the symmetrical parabola in Schaefer’s model.
Maximum effort fMSY= -a/2b
And the Maximum sustainable yield or MSY = -a2/4b.
Now we are giving here an example:
Catch(t) Effort CPUE
382 17300 22.08
431.3 21000 20.54
656.0 22800 28.77
432.0 15700 27.52
1054.0 72000 14.64
820.0 95900 8.55
745.0 100700 7.40
531.0 71400 7.45
764.0 66900 11.42
856.1 95400 8.97
607.0 85500 7.10
632.1 71400 8.85
592.8 66300 8.94
533.9 45000 11.86
505.4 41400 12.21
507.8 34900 14.55
593.8 31300 18.97
We know that,
Y=a+bx { here,Y=CPUE,, x=effort}
So regression coefficient b= -0.0002
And a= 25.341116
So fishing effort at which yield maximized,
FMSY= -a/2b
=-25.341116/ 2×(-0.0002)
=63352.79