Download to read offline
![International Journal of Engineering Research and Development
e-ISSN: 2278-067X, p-ISSN: 2278-800X, www.ijerd.com
Volume 11, Issue 01 (January 2015), PP.46-50
46
Forming Limit Prediction of High Tensile Strength Steel using
FEA Simulation
Ryosuke Kurihara1
, Shinichi Nishida2
, Hirotaka Kamiyama3
,
Yuki Akaike4
1-4
Gunma University, 29-1 Hon-cho, Ota City, Gunma, 373-0057, Japan
Abstract:-Forming limit prediction of High Tensile Strength Steel (HTSS) sheet was carried out by using finite
element analysis. JSTAMP/NV was used in the finite element analysis. Thickness of HTSS specimen was
1.0mm, and the length was 120mm.And the width was varied from 20mm to 80mm. Stretching test was
operated by Erichsen test. In this study, the forming limit prediction method for predicting the localized necking
before the fracture was proposed.FLD of HTSS was compared between experimental results and analytical
results. Forming limit diagrams (FLD) obtained by FEAagreed well with the FLD obtained by experiment.
Keywords:-Finite Element Analysis, Sheet Metal, High Tensile Strength Steel, Forming Limit Diagram, FLD
I. INTRODUCTION
Recently, the demands for weight saving technology and improving collision safety have been
increasing in automotive industry. Especially, it is said that reducing the automotive weight 100 kg improves the
fuel consumption 1 km/l. And it is able to reduce the CO2 emissions that causes global warming. However,
weight saving of automotive generally causes decreasing collision safety. Thus, high tensile strength steels
(HTSS) are expected as substitute of common steelsbecause HTSS has high specific strength compared with
common steels.Though, it is difficult for HTSS to apply to complicated shapes, because of poor cold formability
due to the high strength. The precise estimation method for press formability is necessary for expansion of
HTSS application.Forming Limit Diagram (FLD) is one of standards indicating the formability of sheet metal.It
is required that better accuracy of the forming limit prediction, and comparative evaluation of experiment and
finite element method is carried out by many researchers [1]. Generally, a ductile fracture criterion is used to
calculate a FLD by finite element method, it is problem that ductile fracture is instability phenomenon.
Especially, the accuracy of prediction of forming limit on biaxial tensile area is poor. In this study, the forming
limit prediction method for predicting the localized necking before the fracture was proposed. The advantage of
this method is easy estimable method for forming limit comparing to other methods that is using the forming
limit as a ductile fracture criterion. FLD of HTSS was obtained by stretching test experiment and finite element
analysis. An obtained FLD was compared to find an exact point of fracture between experimental values and
analytical values. It was found that the proposed method using finite element analysis for obtaining FLD was
effective for prediction of a necking occurrence while forming of HTSS sheets.
II. EXPERIMENT
A. Erichsen Test
Erichsen testing machine, ERICHSEN GmbH & Co. KG, model 142-20, is shown in Fig. 1. Fig. 2
shows an example specimens of stretching test in this study. Erichsen testing machine was used to measure the
centerheight of stretched specimen. The punch diameter was 50mm. Maximum blank-hold force was 100
kN.Teflon sheet was used for low friction lubricant between specimen and dies. Table 1 shows the
specifications of Erichsen testing machine. Grid marking was stamped to the specimen, and the deformation of
the grid was observed with four cameras.The strain was obtained by measuring the deformation of the grid with
the three-dimensional measuring machine during the test.The strain ratio and the strain path was obtained by
changing the width of the specimen. The used three-dimensional measuring machine was ViALUX, Auto Grid.
Table 2 shows the specifications of three-dimensional measuring machine.](https://image.slidesharecdn.com/g11014650-150408051617-conversion-gate01/85/Forming-Limit-Prediction-of-High-Tensile-Strength-Steel-using-FEA-Simulation-1-320.jpg)
![International Journal of Engineering Research and Development
e-ISSN: 2278-067X, p-ISSN: 2278-800X, www.ijerd.com
Volume 11, Issue 01 (January 2015), PP.46-50
46
Forming Limit Prediction of High Tensile Strength Steel using
FEA Simulation
Ryosuke Kurihara1
, Shinichi Nishida2
, Hirotaka Kamiyama3
,
Yuki Akaike4
1-4
Gunma University, 29-1 Hon-cho, Ota City, Gunma, 373-0057, Japan
Abstract:-Forming limit prediction of High Tensile Strength Steel (HTSS) sheet was carried out by using finite
element analysis. JSTAMP/NV was used in the finite element analysis. Thickness of HTSS specimen was
1.0mm, and the length was 120mm.And the width was varied from 20mm to 80mm. Stretching test was
operated by Erichsen test. In this study, the forming limit prediction method for predicting the localized necking
before the fracture was proposed.FLD of HTSS was compared between experimental results and analytical
results. Forming limit diagrams (FLD) obtained by FEAagreed well with the FLD obtained by experiment.
Keywords:-Finite Element Analysis, Sheet Metal, High Tensile Strength Steel, Forming Limit Diagram, FLD
I. INTRODUCTION
Recently, the demands for weight saving technology and improving collision safety have been
increasing in automotive industry. Especially, it is said that reducing the automotive weight 100 kg improves the
fuel consumption 1 km/l. And it is able to reduce the CO2 emissions that causes global warming. However,
weight saving of automotive generally causes decreasing collision safety. Thus, high tensile strength steels
(HTSS) are expected as substitute of common steelsbecause HTSS has high specific strength compared with
common steels.Though, it is difficult for HTSS to apply to complicated shapes, because of poor cold formability
due to the high strength. The precise estimation method for press formability is necessary for expansion of
HTSS application.Forming Limit Diagram (FLD) is one of standards indicating the formability of sheet metal.It
is required that better accuracy of the forming limit prediction, and comparative evaluation of experiment and
finite element method is carried out by many researchers [1]. Generally, a ductile fracture criterion is used to
calculate a FLD by finite element method, it is problem that ductile fracture is instability phenomenon.
Especially, the accuracy of prediction of forming limit on biaxial tensile area is poor. In this study, the forming
limit prediction method for predicting the localized necking before the fracture was proposed. The advantage of
this method is easy estimable method for forming limit comparing to other methods that is using the forming
limit as a ductile fracture criterion. FLD of HTSS was obtained by stretching test experiment and finite element
analysis. An obtained FLD was compared to find an exact point of fracture between experimental values and
analytical values. It was found that the proposed method using finite element analysis for obtaining FLD was
effective for prediction of a necking occurrence while forming of HTSS sheets.
II. EXPERIMENT
A. Erichsen Test
Erichsen testing machine, ERICHSEN GmbH & Co. KG, model 142-20, is shown in Fig. 1. Fig. 2
shows an example specimens of stretching test in this study. Erichsen testing machine was used to measure the
centerheight of stretched specimen. The punch diameter was 50mm. Maximum blank-hold force was 100
kN.Teflon sheet was used for low friction lubricant between specimen and dies. Table 1 shows the
specifications of Erichsen testing machine. Grid marking was stamped to the specimen, and the deformation of
the grid was observed with four cameras.The strain was obtained by measuring the deformation of the grid with
the three-dimensional measuring machine during the test.The strain ratio and the strain path was obtained by
changing the width of the specimen. The used three-dimensional measuring machine was ViALUX, Auto Grid.
Table 2 shows the specifications of three-dimensional measuring machine.](https://image.slidesharecdn.com/g11014650-150408051617-conversion-gate01/75/Forming-Limit-Prediction-of-High-Tensile-Strength-Steel-using-FEA-Simulation-1-2048.jpg)
![Forming Limit Prediction of High Tensile Strength Steel using FEA Simulation
47
Fig. 1:Erichsen testing machine and measuring cameras
Fig. 2:Specimens of stretching test
Stamped Streched
Table 1: Specifications of the Erichsen Testing Machine
Machine model 142-20
Manufacturer Erichsen
Diameter of Punch [mm] 50
Blank Holding Force [kN] 100
Table 2: Specifications of the Three-dimensional Measuring Machine
Machine Model AutoGrid
Manufacturer ViALUX
Measuring Area x×y×z [mm] 500×500×200
B. Test Material
In this study, 980MPa class high tensile strength steel sheet was used. Table 3 shows the material
properties of 980MPa class HTSS. Specimen length was 120mm, and the thickness was 1.0mm. Specimen
widths were 20mm, 40mm, 60mm and 80mm, respectively. The elongation of this material after necking was
littlein uniaxial tensile test.](https://image.slidesharecdn.com/g11014650-150408051617-conversion-gate01/85/Forming-Limit-Prediction-of-High-Tensile-Strength-Steel-using-FEA-Simulation-2-320.jpg)
![Forming Limit Prediction of High Tensile Strength Steel using FEA Simulation
48
Fig. 3:Experimental FLD (Fracture)
Fig. 4:Experimental FLD (Necking)
Table 3:Material Properties of 980 MPa Class
High Tensile Strength Steel
Tensile strength [MPa] 1018
Yield stress [MPa] 644
Elongation % 18
Poisson’s ratio 0.30
K-value 1522
r-value Average
0°
45°
90°
0.83
0.81
0.87
0.77
n-value 0.12
C. Forming Limit Diagram
Forming limit diagram (FLD) of 980MPa class HTSS sheet obtained by experiment is shown in Fig.3
and Fig. 4. Fig. 3 shows the conventional fracture FLD, and Fig. 4 shows the Necking FLD. The distributions of
the fracture and necking strains obtained from uniaxial tensile side to plane tensile side were the linear
downward-sloping. And the distributions of the fracture and necking strains obtained from plane tensile side to
biaxial tensile side were the linear upward-sloping. Necking strains were distributed under the fracture strain
distributions. In this study, it was defined that the localized necking occurred when the difference of thickness
reduction rate between adjacent grid strains was reached up to 5 %.
III. FINITE ELEMENT ANALYSIS
Analytical Erichsen test was operated by using finite element method. Analysis software is from JSOL,
JSTAMP/NV. Element size was 1mm × 1mm, and the element type was shell type with 5 integration point in
the thickness direction. Friction coefficient was 0.05 between blank and punch, and was 0.15 between blank and
top die respectively. Stress strain curve was approximated with Swift’s formula. Analytical model was applied
quarter model considering the symmetry. The model was constructed by simple shaped die in order to eliminate](https://image.slidesharecdn.com/g11014650-150408051617-conversion-gate01/85/Forming-Limit-Prediction-of-High-Tensile-Strength-Steel-using-FEA-Simulation-3-320.jpg)
![Forming Limit Prediction of High Tensile Strength Steel using FEA Simulation
50
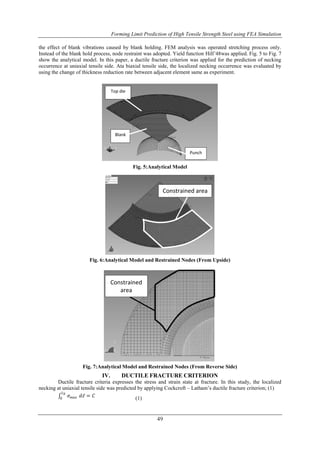
Fig. 8:Comparison between Analytical Results and Experimental Results
where, 𝜀 𝑁 is equivalent strain of necking, 𝜎 𝑚𝑎𝑥 is max principal stress, 𝑑𝜀 is increment of effective strain, and 𝐶
is material constant. In addition, 𝜎 𝑚𝑎𝑥 is expressed the relation (2) in tensile state [2].
𝜎 𝑚𝑎𝑥 = 𝜎 𝑚 +
2
3
𝑌
(2)
where, 𝜎 𝑚 is mean normal stress, and 𝑌 is yield stress. In this paper, 127 is used as the 𝐶 value from the result of
tensile test.
V. ANALYSIS RESULTS AND DISCUSSION
FLD comparison between experimental results and analytical results is shown in Fig. 8. The ductile
fracture criterion was applied in the analytical FLD at the uniaxial tensile side (plots of FEM-1). The change of
thickness reduction rate was used as a reference of necking occurrence same as the experiment in the biaxial
tensile side (plots of FEM-2). Analytical FLD agreed well with experimental FLD. In the case of applying only
a ductile fracture criterion in the biaxial tensile side, forming limit was underestimated. It is supposed that the
highly accurate forming limit is obtained to apply the appropriate change of thickness reduction rate at from
plane strain deformation area to biaxial tensile area.
VI. CONSLUSION
Forming limit diagram (FLD) of 980MPa class high tensile strength steel sheet (HTSS) was obtained
by Erichsen stretching test and finite element method. JSTAMP/NV was used in the finite element analysis. The
Cockcroft – Latham’s ductile fracture criterion was applied for the prediction of localized necking in the
uniaxial tensile state, and the change of thickness reduction rate was used as a reference for localized necking
occurrence in the biaxial tensile state. Analytical FLD agreed well with experimental FLD.
REFERENCES
[1]. F. Ozturk, “Analysis of forming limits using ductile fracture criteria”, Journal of Materials Processing
Technology, vol. 147, pp 397–404, 2004.
[2]. H. Hayashi, “Stamping process of hard-to-form material High tensile strength steel”, Nikkan Kogyo
Shimbun Ltd., Japan, 2010.](https://image.slidesharecdn.com/g11014650-150408051617-conversion-gate01/85/Forming-Limit-Prediction-of-High-Tensile-Strength-Steel-using-FEA-Simulation-5-320.jpg)

The document discusses a study on forming limit prediction for high tensile strength steel (HTSS) sheets using finite element analysis (FEA) and the Erichsen stretching test. A new method for predicting localized necking before fracture was proposed and demonstrated effective, with results showing good agreement between FEA and experimental forming limit diagrams (FLD). The study suggests that accurate forming limit predictions are essential for expanding HTSS applications in automotive design while maintaining safety standards.