SlideShare a Scribd company logo
1 of 28
Download to read offline
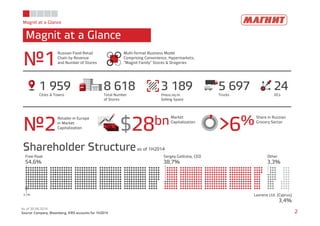
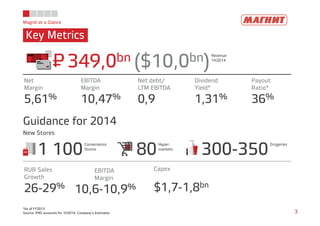
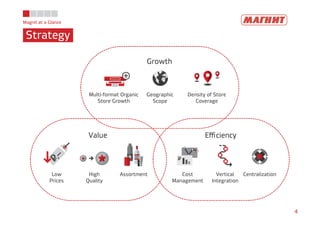
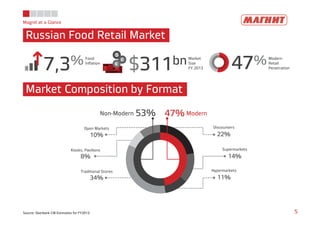
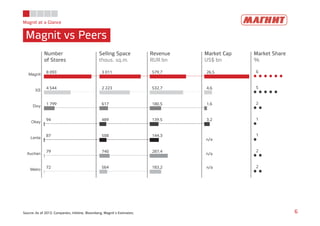
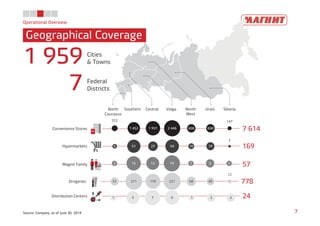
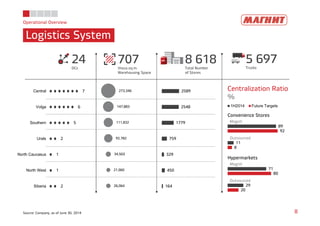
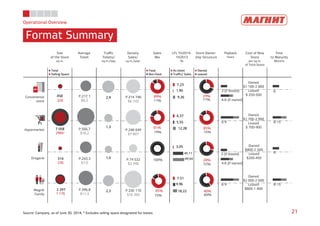
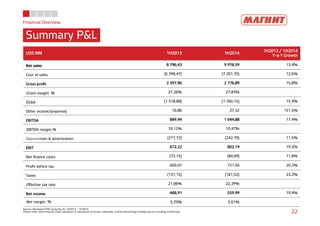
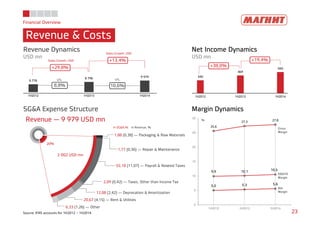
1
Financial Results
1H 2014
Magnit at a Glance
Magnit at a Glance
As of 30.06.2014
Source: Company, Bloomberg, IFRS accounts for 1H2014 2
1 959Cities & Towns
№1
Russian Food Retail
Chain by Revenue
and Number of Stores
8 618Total Number
of Stores
3 189thous.sq.m.
Selling Space
24DCs
5 697Trucks
Multi-format Business Model
Comprising Convenience, Hypermarkets,
“Magnit Family” Stores & Drogeries
№2
Retailer in Europe
in Market
Capitalization $28bnMarket
Capitalization
>6%Share in Russian
Grocery Sector
Shareholder Structureas of 1H2014
54,6%
Free-float
38,7%
Sergey Galitskiy, CEO
3,3%
Other
3,4%
Lavreno Ltd. (Cyprus)0,1%
Magnit at a Glance
Key Metrics
3
*As of FY2013
Source: IFRS accounts for 1H2014, Company’s Estimates
Guidance for 2014
New Stores
349,0bn ($10,0bn)
Revenue
1H2014
5,61%
Net
Margin
10,47%
EBITDA
Margin
0,9
Net debt/
LTM EBITDA
1,31%
Dividend
Yield*
36%
Payout
Ratio*
1 100
Convenience
Stores
80
Hyper-
markets
300-350
Drogeries
26-29%
RUR Sales
Growth
10,6-10,9%
EBITDA
Margin
$1,7-1,8bn
Capex
P=
Magnit at a Glance
Strategy
4
Growth
Value Efficiency
Multi-format Organic
Store Growth
Geographic
Scope
Density of Store
Coverage
Low
Prices
High
Quality
Assortment Cost
Management
Vertical
Integration
Centralization
47
47%53%
Discounters
22%
Supermarkets
14%
Hypermarkets
11%
Traditional Stores
34%
Kiosks, Pavilions
8%
Open Markets
10%
Magnit at a Glance
Russian Food Retail Market
5
Market Composition by Format
7,3%Food
Inflation
$311bnMarket
Size
FY 2013
%Modern
Retail
Penetration
Non-Modern Modern
Source: Sberbank CIB Estimates for FY2013
Magnit at a Glance
Magnit vs Peers
6Source: As of 2013; Companies, Infoline, Bloomberg, Magnit’s Estimates;
Number
of Stores
Selling Space
thous. sq.m.
Revenue
RUR bn
Market Cap
US$ bn
Market Share
%
8 093
4 544
1 799
94
87
79
72
Magnit
XS
Dixy
Okey
Lenta
Auchan
Metro
3 011
2 223
617
489
508
740
564
579,7
532,7
180,5
139,5
144,3
287,4
183,2
26,5
4,6
1,6
3,2
n/a
n/a
n/a
6
5
2
1
1
2
2
778Drogeries
7 614Convenience Stores
169Hypermarkets
57Magnit Family
24Distribution Centers 1 5 7 6 1 2 2
51 211 170 221 68 45
12
2 15 12 19 2 5 2
6 51 27 54 10 19
2
322
1 452 1 931 2 446 658 658
147
Operational Overview
Geographical Coverage
7Source: Company, as of June 30, 2014
1 959 Cities
& Towns
7 Federal
Districts
North
Caucasus
Southern Volga North
West
Urals SiberiaCentral
Operational Overview
Logistics System
8Source: Company, as of June 30, 2014
8 618Total Number
of Stores
707thous.sq.m.
Warehousing Space
24DCs
5 697Trucks
7
6
5
2
1
1
2
Central
Volga
Southern
Urals
North Caucasus
North West
Siberia
2589
2548
1779
759
329
450
164
273,346
147,883
111,832
92,782
34,503
21,060
26,064
Centralization Ratio
%
Magnit
Outsourced
89
11
92
8
Convenience Stores
1H2014 Future Targets
Magnit
Outsourced
71
29
80
20
Hypermarkets
Operational Overview
Suppliers
9Source: Company, as of December 31, 2013
5000
Domestic
Suppliers
4000Local Suppliers
1000Federal Suppliers
Assortment
55-60% 40-45%
200 Big International
Corporations
Operational Overview
Direct Import
10
Source: Company,
Direct Import – as of FY2013; Private Label - as of June 30, 2014
12%Share
of Revenue
627
PL
SKUs
M 86%Food
Items
Private Label
10%International
Direct Import
800
Open
Contracts
Operational Overview
Employees
11Source: Company, as of June 30, 2014
229 272
Employees
0
Foreign
Workers
27 376
Average
Monthly
Salary
10%Wage Rate
Increase
P=
161 438In-store
Personnel
42 144
People Engaged
in Distribution
17 034People in Regional
Branches
8 656People Employed
by Head Office
1000 employees
Average Weighted Number of Employees – 197 251
Operational Overview
Competitive Attributes
12
35%of Family
Budget
Spent on Food
Location Quality
(of Products)
Assortment Reliability AtmospherePrices
5 000
People —
Minimum
Population
(1 500–1 600 Families)
4 000-9 500
Monthly
Family Food
Budget
P=
Overlap “Good”
Cannibalization
Magnit #1
Magnit #2
500m
Competitor #1 Competitor #2
Competitor #3
500m
Sales Catchment Area
Source: Company’s Estimates
Convenience Store
Operational Overview
Convenience Store
14Source: Company, as of June 30, 2014
458
sq.m.
Total
320
sq.m.
Selling Space
89% Food
11% Non-food
29% Owned
71% Leased
Format Description Key Operational Statistics Opening
Size of the Store Average Ticket Payback
Store Ownership Structure
Sales Mix
Traffic
tickets/sq.m./day
Sales Density
sales/sq.m./year
LFL 1H2014-1H2013,%
217,1P=
$6,2
214 746P=
$6 743
7,23
Average
Ticket, RUR
1,90
Traffic
9,26
Sales
2,9
3 years
If Leased
If Owned
Cost of New Store
per sq.m. of Total Space
Time to Maturity
6 months
Owned $1 100-2 800
Leased $250-500
4-6 years
Hypermarket
Operational Overview
Hypermarket
16Source: Company, as of June 30, 2014
81% Food
19% Non-food
85% Owned
15% Leased
Format Description Key Operational Statistics
Size of the Store Average Ticket
Store Ownership Structure
Sales Mix
Traffic
tickets/sq.m./day
Sales Density
sales/sq.m./year
LFL 1H2014-1H2013,%
566,7P=
$16,2
248 649P=
$7 807
1,3
7 058
sq.m.
Total
2 985
sq.m.
Selling Space
6,37
Average
Ticket, RUR
5,55
Traffic
12,28
Sales
Opening
Payback
6-9 years
Cost of New Store
per sq.m. of Total Space
Owned $1 700-2900
Leased $700-900
8-15 months
Time to Maturity
S: up to 3 000
M: 3 000-6 000
L: over 6 000
Magnit Family
Operational Overview
Magnit Family
18Source: Company, as of June 30, 2014
2 297
sq.m.
Total
1 176
sq.m.
Selling Space
85% Food
15% Non-food
40% Owned
60% Leased
Format Description Key Operational Statistics Opening
Size of the Store Average Ticket Payback
Store Ownership Structure
Sales Mix
Traffic
tickets/sq.m./day
Sales Density
sales/sq.m./year
LFL 1H2014 -1H2013,%
396,8P=
$11,3
330 110P=
$10 365
2,3
6-9 years
Cost of New Store
per sq.m. of Total Space
Owned $2 000-2 600
Leased $800-1 400
8-15 months
7,51
Average
Ticket, RUR
9,96
Traffic
18,22
Sales
Time to Maturity
Drogerie
Operational Overview
Drogerie
20Source: Company, as of June 30, 2014
314
sq.m.
Total
236
sq.m.
Selling Space
100% Non-food
28% Owned
72% Leased
Format Description Key Operational Statistics Opening
Size of the Store Average Ticket Payback
Store Ownership Structure
Sales Mix
Traffic
tickets/sq.m./day
Sales Density
sales/sq.m./year
LFL 1H2014 – 1H2013,%
243,3P=
$7,0
74 532P=
$2 340
3,05
Average
Ticket, RUR
45,11
Traffic
49,54
Sales
1,0
3 years
If Leased
If Owned
Cost of New Store
per sq.m. of Total Space
Time to Maturity
6 months
Owned $800-2 500
Leased $200-450
4-6 years
Size
of the Store
sq.m.
Average
Ticket
Traffic
Tickets/
sq.m./day
Density
Sales/
sq.m./year
Sales
Mix
LFL 1H2014-
1H2013
%
Store Owner-
ship Structure
Payback
Years
Cost of New
Store
per sq.m.
of Total Space
Time
to Maturity
Months
• Total
• Selling Space
• Food
• Non-food
• Av.ticket
• Traffic/ Sales
• Owned
• Leased
28%
72%
40%
60%
85%
15%
29%
71%
Operational Overview
Format Summary
21Source: Company, as of June 30, 2014; * Excludes selling space designated for leases
Hypermarket
Drogerie
Magnit
Family
458
7 058
314
2 297
320
2985*
236
1 176
Owned
$1 100-2 800
Leased
$ 250-500
2,9
1,3
1,0
2,3
P.217,1
$6,2
P.566,7
$16,2
P.243,3
$7,0
P.396,8
$11,3
P.214 746
$6 743
P.248 649
$7 807
P.74 532
$2 340
P.330 110
$10 365
81%
19%
100%
85%
15%
89%
11%
Convenience
store
6
8-15
6
8-15
3 (if leased)
6-9
3 (if leased)
6-9
4-6 (if owned)
4-6 (if owned)
7,23
6,37
3,05
7,51
1,90
5,55
45,11
9,96
9,26
12,28
49,54
18,22
Owned
$1 700-2 900
Leased
$ 700-900
Owned
$800-2 500
Leased
$200-450
Owned
$2 000-2 600
Leased
$800-1 400
Financial Overview
Summary P&L
Source: Reviewed IFRS accounts for 1H2013 – 1H2014
Please note: there may be small variations in calculation of totals, subtotals, and/or percentage change due to rounding of decimals 22
USD MMUSD MMUSD MMUSD MM 1H20131H20131H20131H2013 1H20141H20141H20141H2014
1H2013 / 1H20141H2013 / 1H20141H2013 / 1H20141H2013 / 1H2014
YYYY----oooo----Y GrowthY GrowthY GrowthY Growth
Net salesNet salesNet salesNet sales 8 796,438 796,438 796,438 796,43 9 978,599 978,599 978,599 978,59 13,4%
Cost of sales (6 398,47) (7 201,70) 12,6%
Gross profitGross profitGross profitGross profit 2 397,962 397,962 397,962 397,96 2 776,892 776,892 776,892 776,89 15,8%
Gross margin, % 27,26% 27,83%
SG&A (1 518,88) (1 760,15) 15,9%
Other income/(expense) 10,86 27,32 151,5%
EBITDAEBITDAEBITDAEBITDA 889,94889,94889,94889,94 1 044,881 044,881 044,881 044,88 17,4%
EBITDA margin,% 10,12% 10,47%
Depreciation & amortization (217,72) (242,70) 11,5%
EBITEBITEBITEBIT 672,22672,22672,22672,22 802,19802,19802,19802,19 19,3%
Net finance costs (72,15) (80,69) 11,8%
Profit before tax 600,07 721,50 20,2%
Taxes (131,15) (161,52) 23,2%
Effective tax rate 21,86% 22,39%
Net incomeNet incomeNet incomeNet income 468,91468,91468,91468,91 559,99559,99559,99559,99 19,4%
Net margin, % 5,33% 5,61%
Financial Overview
Revenue & Costs
23Source: IFRS accounts for 1H2012 – 1H2014
25,6
27,3 27,8
9,9 10,1 10,5
5,0 5,3 5,6
0
5
10
15
20
25
30
1H2012 1H2013 1H2014
Revenue Dynamics
USD mn
Net Income Dynamics
USD mn
Margin DynamicsSG&A Expense Structure
Revenue — 9 979 USD mn
Gross
Margin
EBIDTA
Margin
Net
Margin
%
+29,8%
8,8% 10,6%
+13,4%
+38,0%
+19,4%
LFLLFL
Sales Growth, USD
Sales Growth, USD
6 776
8 796 9 979
1H2012 1H2013 1H2014
340
469
560
1H2012 1H2013 1H2014
20%
2 002 USD mn
1,88 (0,38) ― Packaging & Raw Materials
1,77 (0,36) ― Repair & Maintenance
55,18 (11,07) ― Payroll & Related Taxes
2,09 (0,42) ― Taxes, Other than Income Tax
12,08 (2,42) ― Deprecation & Amortization
20,67 (4,15) ― Rent & Utilities
6,33 (1,26) ― Other
in SG&A,% in Revenue, %
25,61
27,26
27,83
-0,11 -0,01 -0,031,77 0,26 0,34
15
17
19
21
23
25
27
29
31
33
GM
1H2012
Trading Margin Transport Losses GM
1H2013
Trading Margin Transport Losses GM
1H2014
Financial Overview
Gross Margin Bridge
24Source: IFRS accounts for 1H2012 – 1H2014
EBITDA Margin Bridge
% of Sales
% of Sales
+165 b.p.
+57 b.p.
+22 b.p.
+35 b.p.
9,90 10,12 10,47-1,00
-0,35 -0,05 -0,03
-0,19
-0,24
1,65
0,57 0,21
0
2
4
6
8
10
12
14
EBIDTA
1H2012
Gross
Margin
Salaries Rent & Utilites Repair &
Maintenance
Other EBIDTA
1H2013
Gross
Margin
Rent & Utilites Advertising Other EBIDTA
1H2014
Financial Overview
Free Cash Flow
25Source: IFRS accounts for 1H2013 – 1H2014
Working Capital Analysis
The Average Days Payable to
Suppliers is 36 Days.
Inventory Management Days is 44
Days
Working Capital: -120 mn USD as of
30.06.2014
USD mn
1H2013
1H2014
Adjusted for loss from disposal of PPE, provision
for doubtful receivables, foreign exchange gain,
finance costs, gain on disposal of subsidiary and
investment income
Calculated as additions
+ transfers of PP&E
during the respective
period
Does not include cash flow from
financing activities
1 056
945
364
-64
-87
-111
-581
-245
-183
87
Adjusted
EBIDTA
Change in
Working
capital
Net Interest
Expense
Taxes
Paid
OCF Capex Other Cash
Flow
from
Investing
Activities
FCF Payment of
Dividents
Other Cash
Flow
from
Financing
Activities
CF
901
755
103
-130
-63 -100
-666
-158
17
14
-75
Financial Overview
Balance Sheet
Source: Audited IFRS accounts for FY2012 – 1H2014
Please note: there may be small variations in calculation of totals, subtotals, and/or percentage change due to rounding of decimals 26
USD MMUSD MMUSD MMUSD MM 2012201220122012 2013201320132013 1H20141H20141H20141H2014
ASSETSASSETSASSETSASSETS
Property plant and equipment 5 226,8 5 962,8 6 144,5
Other non-current assets 130,0 176,1 169,5
Cash and cash equivalents 410,0 181,2 110,9
Inventories 1 350,7 1 713,9 1 769,4
Trade and other receivables 19,2 19,3 16,0
Advances paid 88,1 96,9 70,5
Taxes receivable 1,0 0,9 2,5
Short-term financial assets 28,9 35,1 41,9
Prepaid expenses 6,0 7,7 6,5
TOTAL ASSETSTOTAL ASSETSTOTAL ASSETSTOTAL ASSETS 7 260,77 260,77 260,77 260,7 8 193,98 193,98 193,98 193,9 8 331,78 331,78 331,78 331,7
EQUITY AND LIABILITIESEQUITY AND LIABILITIESEQUITY AND LIABILITIESEQUITY AND LIABILITIES
Equity 3 267,3 3 854,7 4 070,1
Long-term debt 1 259,2 1 144,0 1 618,4
Other long-term liabilities 202,8 258,6 270,5
Trade and other payables 1 413,1 1 471,8 1 489,9
Short-term debt 827,1 1 109,7 394,8
Dividends payable - - -
Other current liabilities 291,2 355,1 488,0
TOTAL EQUITY AND LIABILITIESTOTAL EQUITY AND LIABILITIESTOTAL EQUITY AND LIABILITIESTOTAL EQUITY AND LIABILITIES 7 260,77 260,77 260,77 260,7 8 193,98 193,98 193,98 193,9 8 331,78 331,78 331,78 331,7
Financial Overview
Capex Analysis
27
¹CAPEX for 1H2014 amounts to $581 mn
Source: Company, as of December 31, 2013; Company’s Estimates
Construction in Progress
& Buildings
Machinery &
Equipment
Other Assets Land Acquisition of
Subsidiaries
906 362 258 68 53
FY2013¹
$1,647 bn
FY2014 (plan)
$1,775 bn
Hyper Markets Trucks Distribution
Centres
Convenience
Stores
Acquisition &
Construction
of Conv.Stores
Buy-out of
Leased
Conv.Stores
Greenhouses Land for
HyperMarkets
Store
Renovation
Maintenance Drogeries
80 400 4 1 100 350
700 85 240 220 140 60 100 50 50 30 100
Financial Overview
Debt Burden
28Source: IFRS accounts for FY2012 – 1H2014
11,7
13,0
12,2
0
2
4
6
8
10
12
14
2012 2013 1H2014
1,1
1
0,9
0
0,5
1
1,5
2
2012 2013 1H2014
Debt Level Dynamics
USD mn
Credit Metrics Credit Profile
EBIDTA / Finance Expenses
Net Debt / LTM EBITDA
The Company Has
an Impeccable Credit History
Collaboration with
the Largest Banks
Low Debt Burden:
Net Debt / EBITDA Ratio of 0,9
No Currency Risk:No Currency Risk:No Currency Risk:No Currency Risk: 100%
of Debt is Rub Denominated
Matching Revenue Structure
No Interest Rate Risk:No Interest Rate Risk:No Interest Rate Risk:No Interest Rate Risk:
Interest Payments are Made
at Fixed Rates
2 086
2 254
2 013
1 676
2 073
1 902
827
1 110
395
1 259
1 144
1 618
2012 2013 1H2014
Net Debt
Short-term Debt
Long-term Debt
%
39,6%
49,2%
19,6%
80%80%80%80% of Debt is Long-term
Approximately 38%38%38%38%
of LT Debt is Rub Bonds

More Related Content

What's hot (19)

Magnit fy2015
Magnit fy2015Magnit fy2015
Magnit fy2015
 
Magnit fy2015 audited
Magnit fy2015 audited Magnit fy2015 audited
Magnit fy2015 audited
 
Magnit 1 h2016_unaudited
Magnit 1 h2016_unauditedMagnit 1 h2016_unaudited
Magnit 1 h2016_unaudited
 
Magnit 1 h2015
Magnit 1 h2015Magnit 1 h2015
Magnit 1 h2015
 
Magnit 1 h2015
Magnit 1 h2015Magnit 1 h2015
Magnit 1 h2015
 
Magnit 1 h2015
Magnit 1 h2015Magnit 1 h2015
Magnit 1 h2015
 
FY 2010 Results
FY 2010 ResultsFY 2010 Results
FY 2010 Results
 
FY2015 audited results
FY2015 audited resultsFY2015 audited results
FY2015 audited results
 
1Q 2015 Results
1Q 2015 Results1Q 2015 Results
1Q 2015 Results
 
Magnit 1 h2016_reviewed
Magnit 1 h2016_reviewedMagnit 1 h2016_reviewed
Magnit 1 h2016_reviewed
 
Magnit 1 q2016_unaudited
Magnit 1 q2016_unauditedMagnit 1 q2016_unaudited
Magnit 1 q2016_unaudited
 
Magnit 1 q2016_unaudited
Magnit 1 q2016_unauditedMagnit 1 q2016_unaudited
Magnit 1 q2016_unaudited
 
Magnit 1 h2016_unaudited
Magnit 1 h2016_unauditedMagnit 1 h2016_unaudited
Magnit 1 h2016_unaudited
 
1Q 2011 Results
1Q 2011 Results1Q 2011 Results
1Q 2011 Results
 
Magnit fy2015 audited
Magnit fy2015 auditedMagnit fy2015 audited
Magnit fy2015 audited
 
Magnit 1 h2014_reviewed_newx
Magnit 1 h2014_reviewed_newxMagnit 1 h2014_reviewed_newx
Magnit 1 h2014_reviewed_newx
 
Magnit 1 q2016_unaudited
Magnit 1 q2016_unauditedMagnit 1 q2016_unaudited
Magnit 1 q2016_unaudited
 
Magnit fy2015
Magnit fy2015Magnit fy2015
Magnit fy2015
 
Magnit 1 h2014_reviewed_newx
Magnit 1 h2014_reviewed_newxMagnit 1 h2014_reviewed_newx
Magnit 1 h2014_reviewed_newx
 

Viewers also liked

Magnit fy2015 audited_rus
Magnit fy2015 audited_rusMagnit fy2015 audited_rus
Magnit fy2015 audited_rusMagnit IR Team
 
Retailing in Russia.ptt
Retailing in Russia.pttRetailing in Russia.ptt
Retailing in Russia.pttNana Amako
 
Карта России - PowerPoint шаблон для создания профессиональных презентаций
Карта России - PowerPoint шаблон для создания профессиональных презентацийКарта России - PowerPoint шаблон для создания профессиональных презентаций
Карта России - PowerPoint шаблон для создания профессиональных презентацийSlidestore
 

Viewers also liked (6)

1H2007 Results Full
1H2007 Results Full1H2007 Results Full
1H2007 Results Full
 
Magnit fy2015 audited_rus
Magnit fy2015 audited_rusMagnit fy2015 audited_rus
Magnit fy2015 audited_rus
 
Template_ver3
Template_ver3Template_ver3
Template_ver3
 
Retailing in Russia.ptt
Retailing in Russia.pttRetailing in Russia.ptt
Retailing in Russia.ptt
 
Карта России - PowerPoint шаблон для создания профессиональных презентаций
Карта России - PowerPoint шаблон для создания профессиональных презентацийКарта России - PowerPoint шаблон для создания профессиональных презентаций
Карта России - PowerPoint шаблон для создания профессиональных презентаций
 
Magnit 9 m2016_rus
Magnit 9 m2016_rusMagnit 9 m2016_rus
Magnit 9 m2016_rus
 

Similar to 1H 2014 Results

Similar to 1H 2014 Results (17)

Magnit 1 q2014_newx
Magnit 1 q2014_newxMagnit 1 q2014_newx
Magnit 1 q2014_newx
 
1H 2014 Results
1H 2014 Results1H 2014 Results
1H 2014 Results
 
Magnit 1H2015 Operating Results
Magnit 1H2015 Operating ResultsMagnit 1H2015 Operating Results
Magnit 1H2015 Operating Results
 
FY 2013 Results
FY 2013 ResultsFY 2013 Results
FY 2013 Results
 
Magnit 1 h2016_unaudited
Magnit 1 h2016_unauditedMagnit 1 h2016_unaudited
Magnit 1 h2016_unaudited
 
Magnit 1 h2016_unaudited
Magnit 1 h2016_unauditedMagnit 1 h2016_unaudited
Magnit 1 h2016_unaudited
 
Magnit 1 h2016_unaudited
Magnit 1 h2016_unauditedMagnit 1 h2016_unaudited
Magnit 1 h2016_unaudited
 
1H2015 Financial Results
1H2015 Financial Results1H2015 Financial Results
1H2015 Financial Results
 
Magnit 1 q2016_unaudited
Magnit 1 q2016_unauditedMagnit 1 q2016_unaudited
Magnit 1 q2016_unaudited
 
Magnit 1 h2016_reviewed
Magnit 1 h2016_reviewedMagnit 1 h2016_reviewed
Magnit 1 h2016_reviewed
 
Magnit 1 q2016_unaudited
Magnit 1 q2016_unauditedMagnit 1 q2016_unaudited
Magnit 1 q2016_unaudited
 
Magnit 9 m_2016
Magnit 9 m_2016Magnit 9 m_2016
Magnit 9 m_2016
 
Magnit 9 m_2016
Magnit 9 m_2016Magnit 9 m_2016
Magnit 9 m_2016
 
Magnit fy2015
Magnit fy2015Magnit fy2015
Magnit fy2015
 
Magnit fy2015
Magnit fy2015Magnit fy2015
Magnit fy2015
 
Magnit fy2015
Magnit fy2015Magnit fy2015
Magnit fy2015
 
Magnit fy2015
Magnit fy2015Magnit fy2015
Magnit fy2015
 

More from Magnit IR Team

Magnit 1 h2016_reviewed_rus
Magnit 1 h2016_reviewed_rusMagnit 1 h2016_reviewed_rus
Magnit 1 h2016_reviewed_rusMagnit IR Team
 
Magnit 1 h2016_unaudited_rus
Magnit 1 h2016_unaudited_rusMagnit 1 h2016_unaudited_rus
Magnit 1 h2016_unaudited_rusMagnit IR Team
 
Magnit 1 h2016_unaudited_rus
Magnit 1 h2016_unaudited_rusMagnit 1 h2016_unaudited_rus
Magnit 1 h2016_unaudited_rusMagnit IR Team
 
Magnit fy2015 audited_rus
Magnit fy2015 audited_rusMagnit fy2015 audited_rus
Magnit fy2015 audited_rusMagnit IR Team
 

More from Magnit IR Team (6)

Magnit 1 h2016_reviewed_rus
Magnit 1 h2016_reviewed_rusMagnit 1 h2016_reviewed_rus
Magnit 1 h2016_reviewed_rus
 
Magnit 1 h2016_unaudited_rus
Magnit 1 h2016_unaudited_rusMagnit 1 h2016_unaudited_rus
Magnit 1 h2016_unaudited_rus
 
Magnit 1 h2016_unaudited_rus
Magnit 1 h2016_unaudited_rusMagnit 1 h2016_unaudited_rus
Magnit 1 h2016_unaudited_rus
 
Magnit fy2015 audited_rus
Magnit fy2015 audited_rusMagnit fy2015 audited_rus
Magnit fy2015 audited_rus
 
Magnit fy2015 rus
Magnit fy2015 rusMagnit fy2015 rus
Magnit fy2015 rus
 
Magnit fy2015 rus
Magnit fy2015 rusMagnit fy2015 rus
Magnit fy2015 rus
 

Recently uploaded

High Profile Call Girls Kolkata Gayatri 🤌 8250192130 🚀 Vip Call Girls Kolkata
High Profile Call Girls Kolkata Gayatri 🤌  8250192130 🚀 Vip Call Girls KolkataHigh Profile Call Girls Kolkata Gayatri 🤌  8250192130 🚀 Vip Call Girls Kolkata
High Profile Call Girls Kolkata Gayatri 🤌 8250192130 🚀 Vip Call Girls Kolkataanamikaraghav4
 
Malad Escorts, (Pooja 09892124323), Malad Call Girls Service
Malad Escorts, (Pooja 09892124323), Malad Call Girls ServiceMalad Escorts, (Pooja 09892124323), Malad Call Girls Service
Malad Escorts, (Pooja 09892124323), Malad Call Girls ServicePooja Nehwal
 
如何办理密苏里大学堪萨斯分校毕业证(文凭)UMKC学位证书
如何办理密苏里大学堪萨斯分校毕业证(文凭)UMKC学位证书如何办理密苏里大学堪萨斯分校毕业证(文凭)UMKC学位证书
如何办理密苏里大学堪萨斯分校毕业证(文凭)UMKC学位证书Fir La
 
OKC Thunder Reveal Game 2 Playoff T Shirts
OKC Thunder Reveal Game 2 Playoff T ShirtsOKC Thunder Reveal Game 2 Playoff T Shirts
OKC Thunder Reveal Game 2 Playoff T Shirtsrahman018755
 
Russian Call Girls Kolkata Amaira 🤌 8250192130 🚀 Vip Call Girls Kolkata
Russian Call Girls Kolkata Amaira 🤌  8250192130 🚀 Vip Call Girls KolkataRussian Call Girls Kolkata Amaira 🤌  8250192130 🚀 Vip Call Girls Kolkata
Russian Call Girls Kolkata Amaira 🤌 8250192130 🚀 Vip Call Girls Kolkataanamikaraghav4
 
Nicola Mining Inc. Corporate Presentation April 2024
Nicola Mining Inc. Corporate Presentation April 2024Nicola Mining Inc. Corporate Presentation April 2024
Nicola Mining Inc. Corporate Presentation April 2024nicola_mining
 
Call Girl Kolkata Sia 🤌 8250192130 🚀 Vip Call Girls Kolkata
Call Girl Kolkata Sia 🤌  8250192130 🚀 Vip Call Girls KolkataCall Girl Kolkata Sia 🤌  8250192130 🚀 Vip Call Girls Kolkata
Call Girl Kolkata Sia 🤌 8250192130 🚀 Vip Call Girls Kolkataanamikaraghav4
 
VIP Kolkata Call Girls Bidhannagar 8250192130 Available With Room
VIP Kolkata Call Girls Bidhannagar 8250192130 Available With RoomVIP Kolkata Call Girls Bidhannagar 8250192130 Available With Room
VIP Kolkata Call Girls Bidhannagar 8250192130 Available With Roomrran7532
 
VIP Kolkata Call Girl Rishra 👉 8250192130 Available With Room
VIP Kolkata Call Girl Rishra 👉 8250192130  Available With RoomVIP Kolkata Call Girl Rishra 👉 8250192130  Available With Room
VIP Kolkata Call Girl Rishra 👉 8250192130 Available With Roomdivyansh0kumar0
 
VIP Kolkata Call Girl Entally 👉 8250192130 Available With Room
VIP Kolkata Call Girl Entally 👉 8250192130  Available With RoomVIP Kolkata Call Girl Entally 👉 8250192130  Available With Room
VIP Kolkata Call Girl Entally 👉 8250192130 Available With Roomdivyansh0kumar0
 
Osisko Gold Royalties Ltd - Corporate Presentation, April 23, 2024
Osisko Gold Royalties Ltd - Corporate Presentation, April 23, 2024Osisko Gold Royalties Ltd - Corporate Presentation, April 23, 2024
Osisko Gold Royalties Ltd - Corporate Presentation, April 23, 2024Osisko Gold Royalties Ltd
 
VIP 7001035870 Find & Meet Hyderabad Call Girls Shamshabad high-profile Call ...
VIP 7001035870 Find & Meet Hyderabad Call Girls Shamshabad high-profile Call ...VIP 7001035870 Find & Meet Hyderabad Call Girls Shamshabad high-profile Call ...
VIP 7001035870 Find & Meet Hyderabad Call Girls Shamshabad high-profile Call ...aditipandeya
 
Teck Investor Presentation, April 24, 2024
Teck Investor Presentation, April 24, 2024Teck Investor Presentation, April 24, 2024
Teck Investor Presentation, April 24, 2024TeckResourcesLtd
 

Recently uploaded (20)

High Profile Call Girls Kolkata Gayatri 🤌 8250192130 🚀 Vip Call Girls Kolkata
High Profile Call Girls Kolkata Gayatri 🤌  8250192130 🚀 Vip Call Girls KolkataHigh Profile Call Girls Kolkata Gayatri 🤌  8250192130 🚀 Vip Call Girls Kolkata
High Profile Call Girls Kolkata Gayatri 🤌 8250192130 🚀 Vip Call Girls Kolkata
 
Malad Escorts, (Pooja 09892124323), Malad Call Girls Service
Malad Escorts, (Pooja 09892124323), Malad Call Girls ServiceMalad Escorts, (Pooja 09892124323), Malad Call Girls Service
Malad Escorts, (Pooja 09892124323), Malad Call Girls Service
 
如何办理密苏里大学堪萨斯分校毕业证(文凭)UMKC学位证书
如何办理密苏里大学堪萨斯分校毕业证(文凭)UMKC学位证书如何办理密苏里大学堪萨斯分校毕业证(文凭)UMKC学位证书
如何办理密苏里大学堪萨斯分校毕业证(文凭)UMKC学位证书
 
OKC Thunder Reveal Game 2 Playoff T Shirts
OKC Thunder Reveal Game 2 Playoff T ShirtsOKC Thunder Reveal Game 2 Playoff T Shirts
OKC Thunder Reveal Game 2 Playoff T Shirts
 
(👉゚9999965857 ゚)👉 VIP Call Girls Greater Noida 👉 Delhi 👈 : 9999 Cash Payment...
(👉゚9999965857 ゚)👉 VIP Call Girls Greater Noida  👉 Delhi 👈 : 9999 Cash Payment...(👉゚9999965857 ゚)👉 VIP Call Girls Greater Noida  👉 Delhi 👈 : 9999 Cash Payment...
(👉゚9999965857 ゚)👉 VIP Call Girls Greater Noida 👉 Delhi 👈 : 9999 Cash Payment...
 
Call Girls In South Delhi 📱 9999965857 🤩 Delhi 🫦 HOT AND SEXY VVIP 🍎 SERVICE
Call Girls In South Delhi 📱  9999965857  🤩 Delhi 🫦 HOT AND SEXY VVIP 🍎 SERVICECall Girls In South Delhi 📱  9999965857  🤩 Delhi 🫦 HOT AND SEXY VVIP 🍎 SERVICE
Call Girls In South Delhi 📱 9999965857 🤩 Delhi 🫦 HOT AND SEXY VVIP 🍎 SERVICE
 
Russian Call Girls Kolkata Amaira 🤌 8250192130 🚀 Vip Call Girls Kolkata
Russian Call Girls Kolkata Amaira 🤌  8250192130 🚀 Vip Call Girls KolkataRussian Call Girls Kolkata Amaira 🤌  8250192130 🚀 Vip Call Girls Kolkata
Russian Call Girls Kolkata Amaira 🤌 8250192130 🚀 Vip Call Girls Kolkata
 
Rohini Sector 17 Call Girls Delhi 9999965857 @Sabina Saikh No Advance
Rohini Sector 17 Call Girls Delhi 9999965857 @Sabina Saikh No AdvanceRohini Sector 17 Call Girls Delhi 9999965857 @Sabina Saikh No Advance
Rohini Sector 17 Call Girls Delhi 9999965857 @Sabina Saikh No Advance
 
@9999965857 🫦 Sexy Desi Call Girls Vaishali 💓 High Profile Escorts Delhi 🫶
@9999965857 🫦 Sexy Desi Call Girls Vaishali 💓 High Profile Escorts Delhi 🫶@9999965857 🫦 Sexy Desi Call Girls Vaishali 💓 High Profile Escorts Delhi 🫶
@9999965857 🫦 Sexy Desi Call Girls Vaishali 💓 High Profile Escorts Delhi 🫶
 
Nicola Mining Inc. Corporate Presentation April 2024
Nicola Mining Inc. Corporate Presentation April 2024Nicola Mining Inc. Corporate Presentation April 2024
Nicola Mining Inc. Corporate Presentation April 2024
 
Call Girl Kolkata Sia 🤌 8250192130 🚀 Vip Call Girls Kolkata
Call Girl Kolkata Sia 🤌  8250192130 🚀 Vip Call Girls KolkataCall Girl Kolkata Sia 🤌  8250192130 🚀 Vip Call Girls Kolkata
Call Girl Kolkata Sia 🤌 8250192130 🚀 Vip Call Girls Kolkata
 
VIP Kolkata Call Girls Bidhannagar 8250192130 Available With Room
VIP Kolkata Call Girls Bidhannagar 8250192130 Available With RoomVIP Kolkata Call Girls Bidhannagar 8250192130 Available With Room
VIP Kolkata Call Girls Bidhannagar 8250192130 Available With Room
 
VIP Kolkata Call Girl Rishra 👉 8250192130 Available With Room
VIP Kolkata Call Girl Rishra 👉 8250192130  Available With RoomVIP Kolkata Call Girl Rishra 👉 8250192130  Available With Room
VIP Kolkata Call Girl Rishra 👉 8250192130 Available With Room
 
VIP Kolkata Call Girl Entally 👉 8250192130 Available With Room
VIP Kolkata Call Girl Entally 👉 8250192130  Available With RoomVIP Kolkata Call Girl Entally 👉 8250192130  Available With Room
VIP Kolkata Call Girl Entally 👉 8250192130 Available With Room
 
Call Girls 🫤 Mahipalpur ➡️ 9999965857 ➡️ Delhi 🫦 Russian Escorts FULL ENJOY
Call Girls 🫤 Mahipalpur ➡️ 9999965857  ➡️ Delhi 🫦  Russian Escorts FULL ENJOYCall Girls 🫤 Mahipalpur ➡️ 9999965857  ➡️ Delhi 🫦  Russian Escorts FULL ENJOY
Call Girls 🫤 Mahipalpur ➡️ 9999965857 ➡️ Delhi 🫦 Russian Escorts FULL ENJOY
 
Rohini Sector 15 Call Girls Delhi 9999965857 @Sabina Saikh No Advance
Rohini Sector 15 Call Girls Delhi 9999965857 @Sabina Saikh No AdvanceRohini Sector 15 Call Girls Delhi 9999965857 @Sabina Saikh No Advance
Rohini Sector 15 Call Girls Delhi 9999965857 @Sabina Saikh No Advance
 
Call Girls 🫤 Nehru Place ➡️ 9999965857 ➡️ Delhi 🫦 Russian Escorts FULL ENJOY
Call Girls 🫤 Nehru Place ➡️ 9999965857  ➡️ Delhi 🫦  Russian Escorts FULL ENJOYCall Girls 🫤 Nehru Place ➡️ 9999965857  ➡️ Delhi 🫦  Russian Escorts FULL ENJOY
Call Girls 🫤 Nehru Place ➡️ 9999965857 ➡️ Delhi 🫦 Russian Escorts FULL ENJOY
 
Osisko Gold Royalties Ltd - Corporate Presentation, April 23, 2024
Osisko Gold Royalties Ltd - Corporate Presentation, April 23, 2024Osisko Gold Royalties Ltd - Corporate Presentation, April 23, 2024
Osisko Gold Royalties Ltd - Corporate Presentation, April 23, 2024
 
VIP 7001035870 Find & Meet Hyderabad Call Girls Shamshabad high-profile Call ...
VIP 7001035870 Find & Meet Hyderabad Call Girls Shamshabad high-profile Call ...VIP 7001035870 Find & Meet Hyderabad Call Girls Shamshabad high-profile Call ...
VIP 7001035870 Find & Meet Hyderabad Call Girls Shamshabad high-profile Call ...
 
Teck Investor Presentation, April 24, 2024
Teck Investor Presentation, April 24, 2024Teck Investor Presentation, April 24, 2024
Teck Investor Presentation, April 24, 2024
 

1H 2014 Results

  • 2. Magnit at a Glance Magnit at a Glance As of 30.06.2014 Source: Company, Bloomberg, IFRS accounts for 1H2014 2 1 959Cities & Towns №1 Russian Food Retail Chain by Revenue and Number of Stores 8 618Total Number of Stores 3 189thous.sq.m. Selling Space 24DCs 5 697Trucks Multi-format Business Model Comprising Convenience, Hypermarkets, “Magnit Family” Stores & Drogeries №2 Retailer in Europe in Market Capitalization $28bnMarket Capitalization >6%Share in Russian Grocery Sector Shareholder Structureas of 1H2014 54,6% Free-float 38,7% Sergey Galitskiy, CEO 3,3% Other 3,4% Lavreno Ltd. (Cyprus)0,1%
  • 3. Magnit at a Glance Key Metrics 3 *As of FY2013 Source: IFRS accounts for 1H2014, Company’s Estimates Guidance for 2014 New Stores 349,0bn ($10,0bn) Revenue 1H2014 5,61% Net Margin 10,47% EBITDA Margin 0,9 Net debt/ LTM EBITDA 1,31% Dividend Yield* 36% Payout Ratio* 1 100 Convenience Stores 80 Hyper- markets 300-350 Drogeries 26-29% RUR Sales Growth 10,6-10,9% EBITDA Margin $1,7-1,8bn Capex P=
  • 4. Magnit at a Glance Strategy 4 Growth Value Efficiency Multi-format Organic Store Growth Geographic Scope Density of Store Coverage Low Prices High Quality Assortment Cost Management Vertical Integration Centralization
  • 5. 47 47%53% Discounters 22% Supermarkets 14% Hypermarkets 11% Traditional Stores 34% Kiosks, Pavilions 8% Open Markets 10% Magnit at a Glance Russian Food Retail Market 5 Market Composition by Format 7,3%Food Inflation $311bnMarket Size FY 2013 %Modern Retail Penetration Non-Modern Modern Source: Sberbank CIB Estimates for FY2013
  • 6. Magnit at a Glance Magnit vs Peers 6Source: As of 2013; Companies, Infoline, Bloomberg, Magnit’s Estimates; Number of Stores Selling Space thous. sq.m. Revenue RUR bn Market Cap US$ bn Market Share % 8 093 4 544 1 799 94 87 79 72 Magnit XS Dixy Okey Lenta Auchan Metro 3 011 2 223 617 489 508 740 564 579,7 532,7 180,5 139,5 144,3 287,4 183,2 26,5 4,6 1,6 3,2 n/a n/a n/a 6 5 2 1 1 2 2
  • 7. 778Drogeries 7 614Convenience Stores 169Hypermarkets 57Magnit Family 24Distribution Centers 1 5 7 6 1 2 2 51 211 170 221 68 45 12 2 15 12 19 2 5 2 6 51 27 54 10 19 2 322 1 452 1 931 2 446 658 658 147 Operational Overview Geographical Coverage 7Source: Company, as of June 30, 2014 1 959 Cities & Towns 7 Federal Districts North Caucasus Southern Volga North West Urals SiberiaCentral
  • 8. Operational Overview Logistics System 8Source: Company, as of June 30, 2014 8 618Total Number of Stores 707thous.sq.m. Warehousing Space 24DCs 5 697Trucks 7 6 5 2 1 1 2 Central Volga Southern Urals North Caucasus North West Siberia 2589 2548 1779 759 329 450 164 273,346 147,883 111,832 92,782 34,503 21,060 26,064 Centralization Ratio % Magnit Outsourced 89 11 92 8 Convenience Stores 1H2014 Future Targets Magnit Outsourced 71 29 80 20 Hypermarkets
  • 9. Operational Overview Suppliers 9Source: Company, as of December 31, 2013 5000 Domestic Suppliers 4000Local Suppliers 1000Federal Suppliers Assortment 55-60% 40-45% 200 Big International Corporations
  • 10. Operational Overview Direct Import 10 Source: Company, Direct Import – as of FY2013; Private Label - as of June 30, 2014 12%Share of Revenue 627 PL SKUs M 86%Food Items Private Label 10%International Direct Import 800 Open Contracts
  • 11. Operational Overview Employees 11Source: Company, as of June 30, 2014 229 272 Employees 0 Foreign Workers 27 376 Average Monthly Salary 10%Wage Rate Increase P= 161 438In-store Personnel 42 144 People Engaged in Distribution 17 034People in Regional Branches 8 656People Employed by Head Office 1000 employees Average Weighted Number of Employees – 197 251
  • 12. Operational Overview Competitive Attributes 12 35%of Family Budget Spent on Food Location Quality (of Products) Assortment Reliability AtmospherePrices 5 000 People — Minimum Population (1 500–1 600 Families) 4 000-9 500 Monthly Family Food Budget P= Overlap “Good” Cannibalization Magnit #1 Magnit #2 500m Competitor #1 Competitor #2 Competitor #3 500m Sales Catchment Area Source: Company’s Estimates
  • 14. Operational Overview Convenience Store 14Source: Company, as of June 30, 2014 458 sq.m. Total 320 sq.m. Selling Space 89% Food 11% Non-food 29% Owned 71% Leased Format Description Key Operational Statistics Opening Size of the Store Average Ticket Payback Store Ownership Structure Sales Mix Traffic tickets/sq.m./day Sales Density sales/sq.m./year LFL 1H2014-1H2013,% 217,1P= $6,2 214 746P= $6 743 7,23 Average Ticket, RUR 1,90 Traffic 9,26 Sales 2,9 3 years If Leased If Owned Cost of New Store per sq.m. of Total Space Time to Maturity 6 months Owned $1 100-2 800 Leased $250-500 4-6 years
  • 16. Operational Overview Hypermarket 16Source: Company, as of June 30, 2014 81% Food 19% Non-food 85% Owned 15% Leased Format Description Key Operational Statistics Size of the Store Average Ticket Store Ownership Structure Sales Mix Traffic tickets/sq.m./day Sales Density sales/sq.m./year LFL 1H2014-1H2013,% 566,7P= $16,2 248 649P= $7 807 1,3 7 058 sq.m. Total 2 985 sq.m. Selling Space 6,37 Average Ticket, RUR 5,55 Traffic 12,28 Sales Opening Payback 6-9 years Cost of New Store per sq.m. of Total Space Owned $1 700-2900 Leased $700-900 8-15 months Time to Maturity S: up to 3 000 M: 3 000-6 000 L: over 6 000
  • 18. Operational Overview Magnit Family 18Source: Company, as of June 30, 2014 2 297 sq.m. Total 1 176 sq.m. Selling Space 85% Food 15% Non-food 40% Owned 60% Leased Format Description Key Operational Statistics Opening Size of the Store Average Ticket Payback Store Ownership Structure Sales Mix Traffic tickets/sq.m./day Sales Density sales/sq.m./year LFL 1H2014 -1H2013,% 396,8P= $11,3 330 110P= $10 365 2,3 6-9 years Cost of New Store per sq.m. of Total Space Owned $2 000-2 600 Leased $800-1 400 8-15 months 7,51 Average Ticket, RUR 9,96 Traffic 18,22 Sales Time to Maturity
  • 20. Operational Overview Drogerie 20Source: Company, as of June 30, 2014 314 sq.m. Total 236 sq.m. Selling Space 100% Non-food 28% Owned 72% Leased Format Description Key Operational Statistics Opening Size of the Store Average Ticket Payback Store Ownership Structure Sales Mix Traffic tickets/sq.m./day Sales Density sales/sq.m./year LFL 1H2014 – 1H2013,% 243,3P= $7,0 74 532P= $2 340 3,05 Average Ticket, RUR 45,11 Traffic 49,54 Sales 1,0 3 years If Leased If Owned Cost of New Store per sq.m. of Total Space Time to Maturity 6 months Owned $800-2 500 Leased $200-450 4-6 years
  • 21. Size of the Store sq.m. Average Ticket Traffic Tickets/ sq.m./day Density Sales/ sq.m./year Sales Mix LFL 1H2014- 1H2013 % Store Owner- ship Structure Payback Years Cost of New Store per sq.m. of Total Space Time to Maturity Months • Total • Selling Space • Food • Non-food • Av.ticket • Traffic/ Sales • Owned • Leased 28% 72% 40% 60% 85% 15% 29% 71% Operational Overview Format Summary 21Source: Company, as of June 30, 2014; * Excludes selling space designated for leases Hypermarket Drogerie Magnit Family 458 7 058 314 2 297 320 2985* 236 1 176 Owned $1 100-2 800 Leased $ 250-500 2,9 1,3 1,0 2,3 P.217,1 $6,2 P.566,7 $16,2 P.243,3 $7,0 P.396,8 $11,3 P.214 746 $6 743 P.248 649 $7 807 P.74 532 $2 340 P.330 110 $10 365 81% 19% 100% 85% 15% 89% 11% Convenience store 6 8-15 6 8-15 3 (if leased) 6-9 3 (if leased) 6-9 4-6 (if owned) 4-6 (if owned) 7,23 6,37 3,05 7,51 1,90 5,55 45,11 9,96 9,26 12,28 49,54 18,22 Owned $1 700-2 900 Leased $ 700-900 Owned $800-2 500 Leased $200-450 Owned $2 000-2 600 Leased $800-1 400
  • 22. Financial Overview Summary P&L Source: Reviewed IFRS accounts for 1H2013 – 1H2014 Please note: there may be small variations in calculation of totals, subtotals, and/or percentage change due to rounding of decimals 22 USD MMUSD MMUSD MMUSD MM 1H20131H20131H20131H2013 1H20141H20141H20141H2014 1H2013 / 1H20141H2013 / 1H20141H2013 / 1H20141H2013 / 1H2014 YYYY----oooo----Y GrowthY GrowthY GrowthY Growth Net salesNet salesNet salesNet sales 8 796,438 796,438 796,438 796,43 9 978,599 978,599 978,599 978,59 13,4% Cost of sales (6 398,47) (7 201,70) 12,6% Gross profitGross profitGross profitGross profit 2 397,962 397,962 397,962 397,96 2 776,892 776,892 776,892 776,89 15,8% Gross margin, % 27,26% 27,83% SG&A (1 518,88) (1 760,15) 15,9% Other income/(expense) 10,86 27,32 151,5% EBITDAEBITDAEBITDAEBITDA 889,94889,94889,94889,94 1 044,881 044,881 044,881 044,88 17,4% EBITDA margin,% 10,12% 10,47% Depreciation & amortization (217,72) (242,70) 11,5% EBITEBITEBITEBIT 672,22672,22672,22672,22 802,19802,19802,19802,19 19,3% Net finance costs (72,15) (80,69) 11,8% Profit before tax 600,07 721,50 20,2% Taxes (131,15) (161,52) 23,2% Effective tax rate 21,86% 22,39% Net incomeNet incomeNet incomeNet income 468,91468,91468,91468,91 559,99559,99559,99559,99 19,4% Net margin, % 5,33% 5,61%
  • 23. Financial Overview Revenue & Costs 23Source: IFRS accounts for 1H2012 – 1H2014 25,6 27,3 27,8 9,9 10,1 10,5 5,0 5,3 5,6 0 5 10 15 20 25 30 1H2012 1H2013 1H2014 Revenue Dynamics USD mn Net Income Dynamics USD mn Margin DynamicsSG&A Expense Structure Revenue — 9 979 USD mn Gross Margin EBIDTA Margin Net Margin % +29,8% 8,8% 10,6% +13,4% +38,0% +19,4% LFLLFL Sales Growth, USD Sales Growth, USD 6 776 8 796 9 979 1H2012 1H2013 1H2014 340 469 560 1H2012 1H2013 1H2014 20% 2 002 USD mn 1,88 (0,38) ― Packaging & Raw Materials 1,77 (0,36) ― Repair & Maintenance 55,18 (11,07) ― Payroll & Related Taxes 2,09 (0,42) ― Taxes, Other than Income Tax 12,08 (2,42) ― Deprecation & Amortization 20,67 (4,15) ― Rent & Utilities 6,33 (1,26) ― Other in SG&A,% in Revenue, %
  • 24. 25,61 27,26 27,83 -0,11 -0,01 -0,031,77 0,26 0,34 15 17 19 21 23 25 27 29 31 33 GM 1H2012 Trading Margin Transport Losses GM 1H2013 Trading Margin Transport Losses GM 1H2014 Financial Overview Gross Margin Bridge 24Source: IFRS accounts for 1H2012 – 1H2014 EBITDA Margin Bridge % of Sales % of Sales +165 b.p. +57 b.p. +22 b.p. +35 b.p. 9,90 10,12 10,47-1,00 -0,35 -0,05 -0,03 -0,19 -0,24 1,65 0,57 0,21 0 2 4 6 8 10 12 14 EBIDTA 1H2012 Gross Margin Salaries Rent & Utilites Repair & Maintenance Other EBIDTA 1H2013 Gross Margin Rent & Utilites Advertising Other EBIDTA 1H2014
  • 25. Financial Overview Free Cash Flow 25Source: IFRS accounts for 1H2013 – 1H2014 Working Capital Analysis The Average Days Payable to Suppliers is 36 Days. Inventory Management Days is 44 Days Working Capital: -120 mn USD as of 30.06.2014 USD mn 1H2013 1H2014 Adjusted for loss from disposal of PPE, provision for doubtful receivables, foreign exchange gain, finance costs, gain on disposal of subsidiary and investment income Calculated as additions + transfers of PP&E during the respective period Does not include cash flow from financing activities 1 056 945 364 -64 -87 -111 -581 -245 -183 87 Adjusted EBIDTA Change in Working capital Net Interest Expense Taxes Paid OCF Capex Other Cash Flow from Investing Activities FCF Payment of Dividents Other Cash Flow from Financing Activities CF 901 755 103 -130 -63 -100 -666 -158 17 14 -75
  • 26. Financial Overview Balance Sheet Source: Audited IFRS accounts for FY2012 – 1H2014 Please note: there may be small variations in calculation of totals, subtotals, and/or percentage change due to rounding of decimals 26 USD MMUSD MMUSD MMUSD MM 2012201220122012 2013201320132013 1H20141H20141H20141H2014 ASSETSASSETSASSETSASSETS Property plant and equipment 5 226,8 5 962,8 6 144,5 Other non-current assets 130,0 176,1 169,5 Cash and cash equivalents 410,0 181,2 110,9 Inventories 1 350,7 1 713,9 1 769,4 Trade and other receivables 19,2 19,3 16,0 Advances paid 88,1 96,9 70,5 Taxes receivable 1,0 0,9 2,5 Short-term financial assets 28,9 35,1 41,9 Prepaid expenses 6,0 7,7 6,5 TOTAL ASSETSTOTAL ASSETSTOTAL ASSETSTOTAL ASSETS 7 260,77 260,77 260,77 260,7 8 193,98 193,98 193,98 193,9 8 331,78 331,78 331,78 331,7 EQUITY AND LIABILITIESEQUITY AND LIABILITIESEQUITY AND LIABILITIESEQUITY AND LIABILITIES Equity 3 267,3 3 854,7 4 070,1 Long-term debt 1 259,2 1 144,0 1 618,4 Other long-term liabilities 202,8 258,6 270,5 Trade and other payables 1 413,1 1 471,8 1 489,9 Short-term debt 827,1 1 109,7 394,8 Dividends payable - - - Other current liabilities 291,2 355,1 488,0 TOTAL EQUITY AND LIABILITIESTOTAL EQUITY AND LIABILITIESTOTAL EQUITY AND LIABILITIESTOTAL EQUITY AND LIABILITIES 7 260,77 260,77 260,77 260,7 8 193,98 193,98 193,98 193,9 8 331,78 331,78 331,78 331,7
  • 27. Financial Overview Capex Analysis 27 ¹CAPEX for 1H2014 amounts to $581 mn Source: Company, as of December 31, 2013; Company’s Estimates Construction in Progress & Buildings Machinery & Equipment Other Assets Land Acquisition of Subsidiaries 906 362 258 68 53 FY2013¹ $1,647 bn FY2014 (plan) $1,775 bn Hyper Markets Trucks Distribution Centres Convenience Stores Acquisition & Construction of Conv.Stores Buy-out of Leased Conv.Stores Greenhouses Land for HyperMarkets Store Renovation Maintenance Drogeries 80 400 4 1 100 350 700 85 240 220 140 60 100 50 50 30 100
  • 28. Financial Overview Debt Burden 28Source: IFRS accounts for FY2012 – 1H2014 11,7 13,0 12,2 0 2 4 6 8 10 12 14 2012 2013 1H2014 1,1 1 0,9 0 0,5 1 1,5 2 2012 2013 1H2014 Debt Level Dynamics USD mn Credit Metrics Credit Profile EBIDTA / Finance Expenses Net Debt / LTM EBITDA The Company Has an Impeccable Credit History Collaboration with the Largest Banks Low Debt Burden: Net Debt / EBITDA Ratio of 0,9 No Currency Risk:No Currency Risk:No Currency Risk:No Currency Risk: 100% of Debt is Rub Denominated Matching Revenue Structure No Interest Rate Risk:No Interest Rate Risk:No Interest Rate Risk:No Interest Rate Risk: Interest Payments are Made at Fixed Rates 2 086 2 254 2 013 1 676 2 073 1 902 827 1 110 395 1 259 1 144 1 618 2012 2013 1H2014 Net Debt Short-term Debt Long-term Debt % 39,6% 49,2% 19,6% 80%80%80%80% of Debt is Long-term Approximately 38%38%38%38% of LT Debt is Rub Bonds