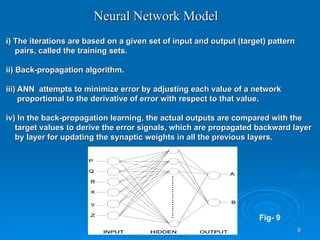
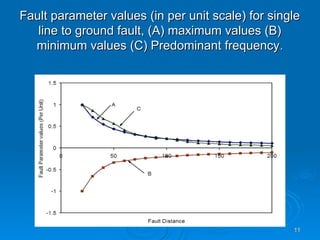
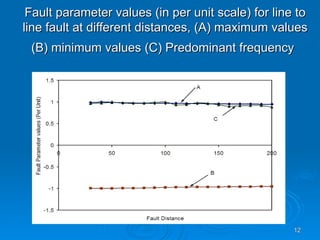
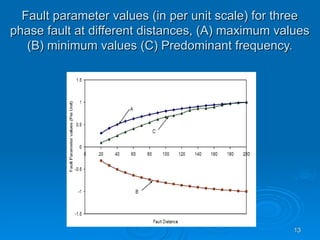
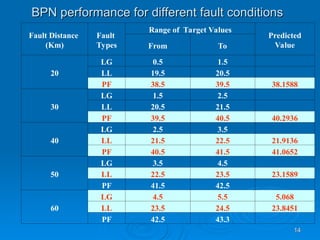
Wavelet Assisted Neural Network for
Transmission Line Fault Analysis
Purpose of Fault Analysis:
 To determine the abnormal values of voltages and currents.
To determine the abnormal values of voltages and currents.
 To select appropriate protective scheme, relay and circuit
To select appropriate protective scheme, relay and circuit
breaker in order to save the system from the abnormal
condition within minimum time.
3
3
Effects of Faults:
Effects of Faults:
 Faults gives rise to abnormal operating condition.
Faults gives rise to abnormal operating condition.
 Insulation breakdown beyond their rated value due to over
Insulation breakdown beyond their rated value due to over
voltage.
voltage.
 Large current result in overheating of power system component.
Large current result in overheating of power system component.
 Damage or disrupt power supply.
Damage or disrupt power supply.
4
4
Fig. 2 : Power Transmission Network Under Study
 KTPS - Kolaghat Thermal Power Station
KTPS - Kolaghat Thermal Power Station
 HPCL - Haldia Petrochemical Limited
HPCL - Haldia Petrochemical Limited
 FCI - Food Corporation India
FCI - Food Corporation India
Prototype Power System and Fault Simulation
5
5
Discrete Wavelet Transform
 In DWT, a time scale representation of a signal is obtained using
In DWT, a time scale representation of a signal is obtained using
digital filtering techniques.
 Different Cutoff Frequencies are used to analyze the signal at different
Different Cutoff Frequencies are used to analyze the signal at different
scales.
scales.
 The approximation is the high-scale, low-frequency component of the
The approximation is the high-scale, low-frequency component of the
signal. The detail is the low-scale, high-frequency components.
 Decompositions are done on higher levels, lower frequency
Decompositions are done on higher levels, lower frequency
components are filtered out progressively
Fig-1
6
6
Use of DWT in this work
 In this study, the line transient signals are used as the input
In this study, the line transient signals are used as the input
signals of the wavelet analysis.
 Daubechies db3 wavelet is used.
Daubechies db3 wavelet is used.
 The fault transients of the study cases are analyzed through
The fault transients of the study cases are analyzed through
discrete wavelet transform at the level three.
 Both approximation and details information related fault
Both approximation and details information related fault
voltages are extracted from the original signal with the multi-
resolution analysis.
7
7
Original time-domain signal for transient 3-phase
fault under studied.
Fig-3
8
8
Fig. 6, Fig.7 and Fig. 8 show transient signals for SLG, L-L
and 3-phase faults at 80 km distance respectively
Voltage waveform for 3-phase fault
at 80 km distance
Voltage waveform for SLG fault at
80 km distance
Voltage waveform for L-L fault at
80 km distance
Fig-8
Fig-7
Fig-6
JU
JU 9
9
i) The iterations are based on a given set of input and output (target) pattern
pairs, called the training sets.
ii) Back-propagation algorithm.
iii) ANN attempts to minimize error by adjusting each value of a network
proportional to the derivative of error with respect to that value.
iv) In the back-propagation learning, the actual outputs are compared with the
target values to derive the error signals, which are propagated backward layer
by layer for updating the synaptic weights in all the previous layers.
Neural Network Model
Fig- 9
10
10
 The number of inputs is 3 and at the output, a range of target values were set as
The number of inputs is 3 and at the output, a range of target values were set as
fault indicator index.
 MATLAB is used for the entire operation.
MATLAB is used for the entire operation.
 45 training patterns were generated combining all the three fault types.
45 training patterns were generated combining all the three fault types.
 Total 33 testing (predicting) patterns were generated at fault distances different
Total 33 testing (predicting) patterns were generated at fault distances different
from those used for training after the training process was over.
11
11
Fault parameter values (in per unit scale) for single
line to ground fault, (A) maximum values (B)
minimum values (C) Predominant frequency
minimum values (C) Predominant frequency.
.
12
12
Fault parameter values (in per unit scale) for line to
line fault at different distances, (A) maximum values
(B) minimum values (C) Predominant frequency
13
13
Fault parameter values (in per unit scale) for three
phase fault at different distances, (A) maximum values
(B) minimum values (C) Predominant frequency.
14
14
BPN performance for different fault conditions
Fault Distance
(Km)
Fault
Types
Range of Target Values
Predicted
Value
From To
20
LG 0.5 1.5
LL 19.5 20.5
PF 38.5 39.5 38.1588
30
LG 1.5 2.5
LL 20.5 21.5
PF 39.5 40.5 40.2936
40
LG 2.5 3.5
LL 21.5 22.5 21.9136
PF 40.5 41.5 41.0652
50
LG 3.5 4.5
LL 22.5 23.5 23.1589
PF 41.5 42.5
60
LG 4.5 5.5 5.068
LL 23.5 24.5 23.8451
PF 42.5 43.3
15
15
THANK YOU
THANK YOU

Fundamentals Wavelet Assisted Neural Network.ppt

  • 1.
    Wavelet Assisted NeuralNetwork for Wavelet Assisted Neural Network for Transmission Line Fault Analysis Transmission Line Fault Analysis
  • 2.
    Purpose of FaultAnalysis: Purpose of Fault Analysis:  To determine the abnormal values of voltages and currents. To determine the abnormal values of voltages and currents.  To select appropriate protective scheme, relay and circuit To select appropriate protective scheme, relay and circuit breaker in order to save the system from the abnormal breaker in order to save the system from the abnormal condition within minimum time. condition within minimum time.
  • 3.
    3 3 Effects of Faults: Effectsof Faults:  Faults gives rise to abnormal operating condition. Faults gives rise to abnormal operating condition.  Insulation breakdown beyond their rated value due to over Insulation breakdown beyond their rated value due to over voltage. voltage.  Large current result in overheating of power system component. Large current result in overheating of power system component.  Damage or disrupt power supply. Damage or disrupt power supply.
  • 4.
    4 4 Fig. 2 :Power Transmission Network Under Study Fig. 2 : Power Transmission Network Under Study  KTPS - Kolaghat Thermal Power Station KTPS - Kolaghat Thermal Power Station  HPCL - Haldia Petrochemical Limited HPCL - Haldia Petrochemical Limited  FCI - Food Corporation India FCI - Food Corporation India Prototype Power System and Fault Simulation Prototype Power System and Fault Simulation
  • 5.
    5 5 Discrete Wavelet Transform DiscreteWavelet Transform  In DWT, a time scale representation of a signal is obtained using In DWT, a time scale representation of a signal is obtained using digital filtering techniques. digital filtering techniques.  Different Cutoff Frequencies are used to analyze the signal at different Different Cutoff Frequencies are used to analyze the signal at different scales. scales.  The approximation is the high-scale, low-frequency component of the The approximation is the high-scale, low-frequency component of the signal. The detail is the low-scale, high-frequency components. signal. The detail is the low-scale, high-frequency components.  Decompositions are done on higher levels, lower frequency Decompositions are done on higher levels, lower frequency components are filtered out progressively components are filtered out progressively Fig-1
  • 6.
    6 6 Use of DWTin this work Use of DWT in this work  In this study, the line transient signals are used as the input In this study, the line transient signals are used as the input signals of the wavelet analysis. signals of the wavelet analysis.  Daubechies db3 wavelet is used. Daubechies db3 wavelet is used.  The fault transients of the study cases are analyzed through The fault transients of the study cases are analyzed through discrete wavelet transform at the level three. discrete wavelet transform at the level three.  Both approximation and details information related fault Both approximation and details information related fault voltages are extracted from the original signal with the multi- voltages are extracted from the original signal with the multi- resolution analysis. resolution analysis.
  • 7.
    7 7 Original time-domain signalfor transient 3-phase Original time-domain signal for transient 3-phase fault under studied. fault under studied. Fig-3
  • 8.
    8 8 Fig. 6, Fig.7and Fig. 8 show transient signals for SLG, L-L Fig. 6, Fig.7 and Fig. 8 show transient signals for SLG, L-L and 3-phase faults at 80 km distance respectively and 3-phase faults at 80 km distance respectively Voltage waveform for 3-phase fault at 80 km distance Voltage waveform for SLG fault at 80 km distance Voltage waveform for L-L fault at 80 km distance Fig-8 Fig-7 Fig-6
  • 9.
    JU JU 9 9 i) Theiterations are based on a given set of input and output (target) pattern i) The iterations are based on a given set of input and output (target) pattern pairs, called the training sets. pairs, called the training sets. ii) Back-propagation algorithm. ii) Back-propagation algorithm. iii) ANN attempts to minimize error by adjusting each value of a network iii) ANN attempts to minimize error by adjusting each value of a network proportional to the derivative of error with respect to that value. proportional to the derivative of error with respect to that value. iv) In the back-propagation learning, the actual outputs are compared with the iv) In the back-propagation learning, the actual outputs are compared with the target values to derive the error signals, which are propagated backward layer target values to derive the error signals, which are propagated backward layer by layer for updating the synaptic weights in all the previous layers. by layer for updating the synaptic weights in all the previous layers. Neural Network Model Neural Network Model Fig- 9
  • 10.
    10 10  The numberof inputs is 3 and at the output, a range of target values were set as The number of inputs is 3 and at the output, a range of target values were set as fault indicator index. fault indicator index.  MATLAB is used for the entire operation. MATLAB is used for the entire operation.  45 training patterns were generated combining all the three fault types. 45 training patterns were generated combining all the three fault types.  Total 33 testing (predicting) patterns were generated at fault distances different Total 33 testing (predicting) patterns were generated at fault distances different from those used for training after the training process was over. from those used for training after the training process was over.
  • 11.
    11 11 Fault parameter values(in per unit scale) for single Fault parameter values (in per unit scale) for single line to ground fault, (A) maximum values (B) line to ground fault, (A) maximum values (B) minimum values (C) Predominant frequency minimum values (C) Predominant frequency. .
  • 12.
    12 12 Fault parameter values(in per unit scale) for line to Fault parameter values (in per unit scale) for line to line fault at different distances, (A) maximum values line fault at different distances, (A) maximum values (B) minimum values (C) Predominant frequency (B) minimum values (C) Predominant frequency
  • 13.
    13 13 Fault parameter values(in per unit scale) for three Fault parameter values (in per unit scale) for three phase fault at different distances, (A) maximum values phase fault at different distances, (A) maximum values (B) minimum values (C) Predominant frequency. (B) minimum values (C) Predominant frequency.
  • 14.
    14 14 BPN performance fordifferent fault conditions BPN performance for different fault conditions Fault Distance (Km) Fault Types Range of Target Values Predicted Value From To 20 LG 0.5 1.5 LL 19.5 20.5 PF 38.5 39.5 38.1588 30 LG 1.5 2.5 LL 20.5 21.5 PF 39.5 40.5 40.2936 40 LG 2.5 3.5 LL 21.5 22.5 21.9136 PF 40.5 41.5 41.0652 50 LG 3.5 4.5 LL 22.5 23.5 23.1589 PF 41.5 42.5 60 LG 4.5 5.5 5.068 LL 23.5 24.5 23.8451 PF 42.5 43.3
  • 15.