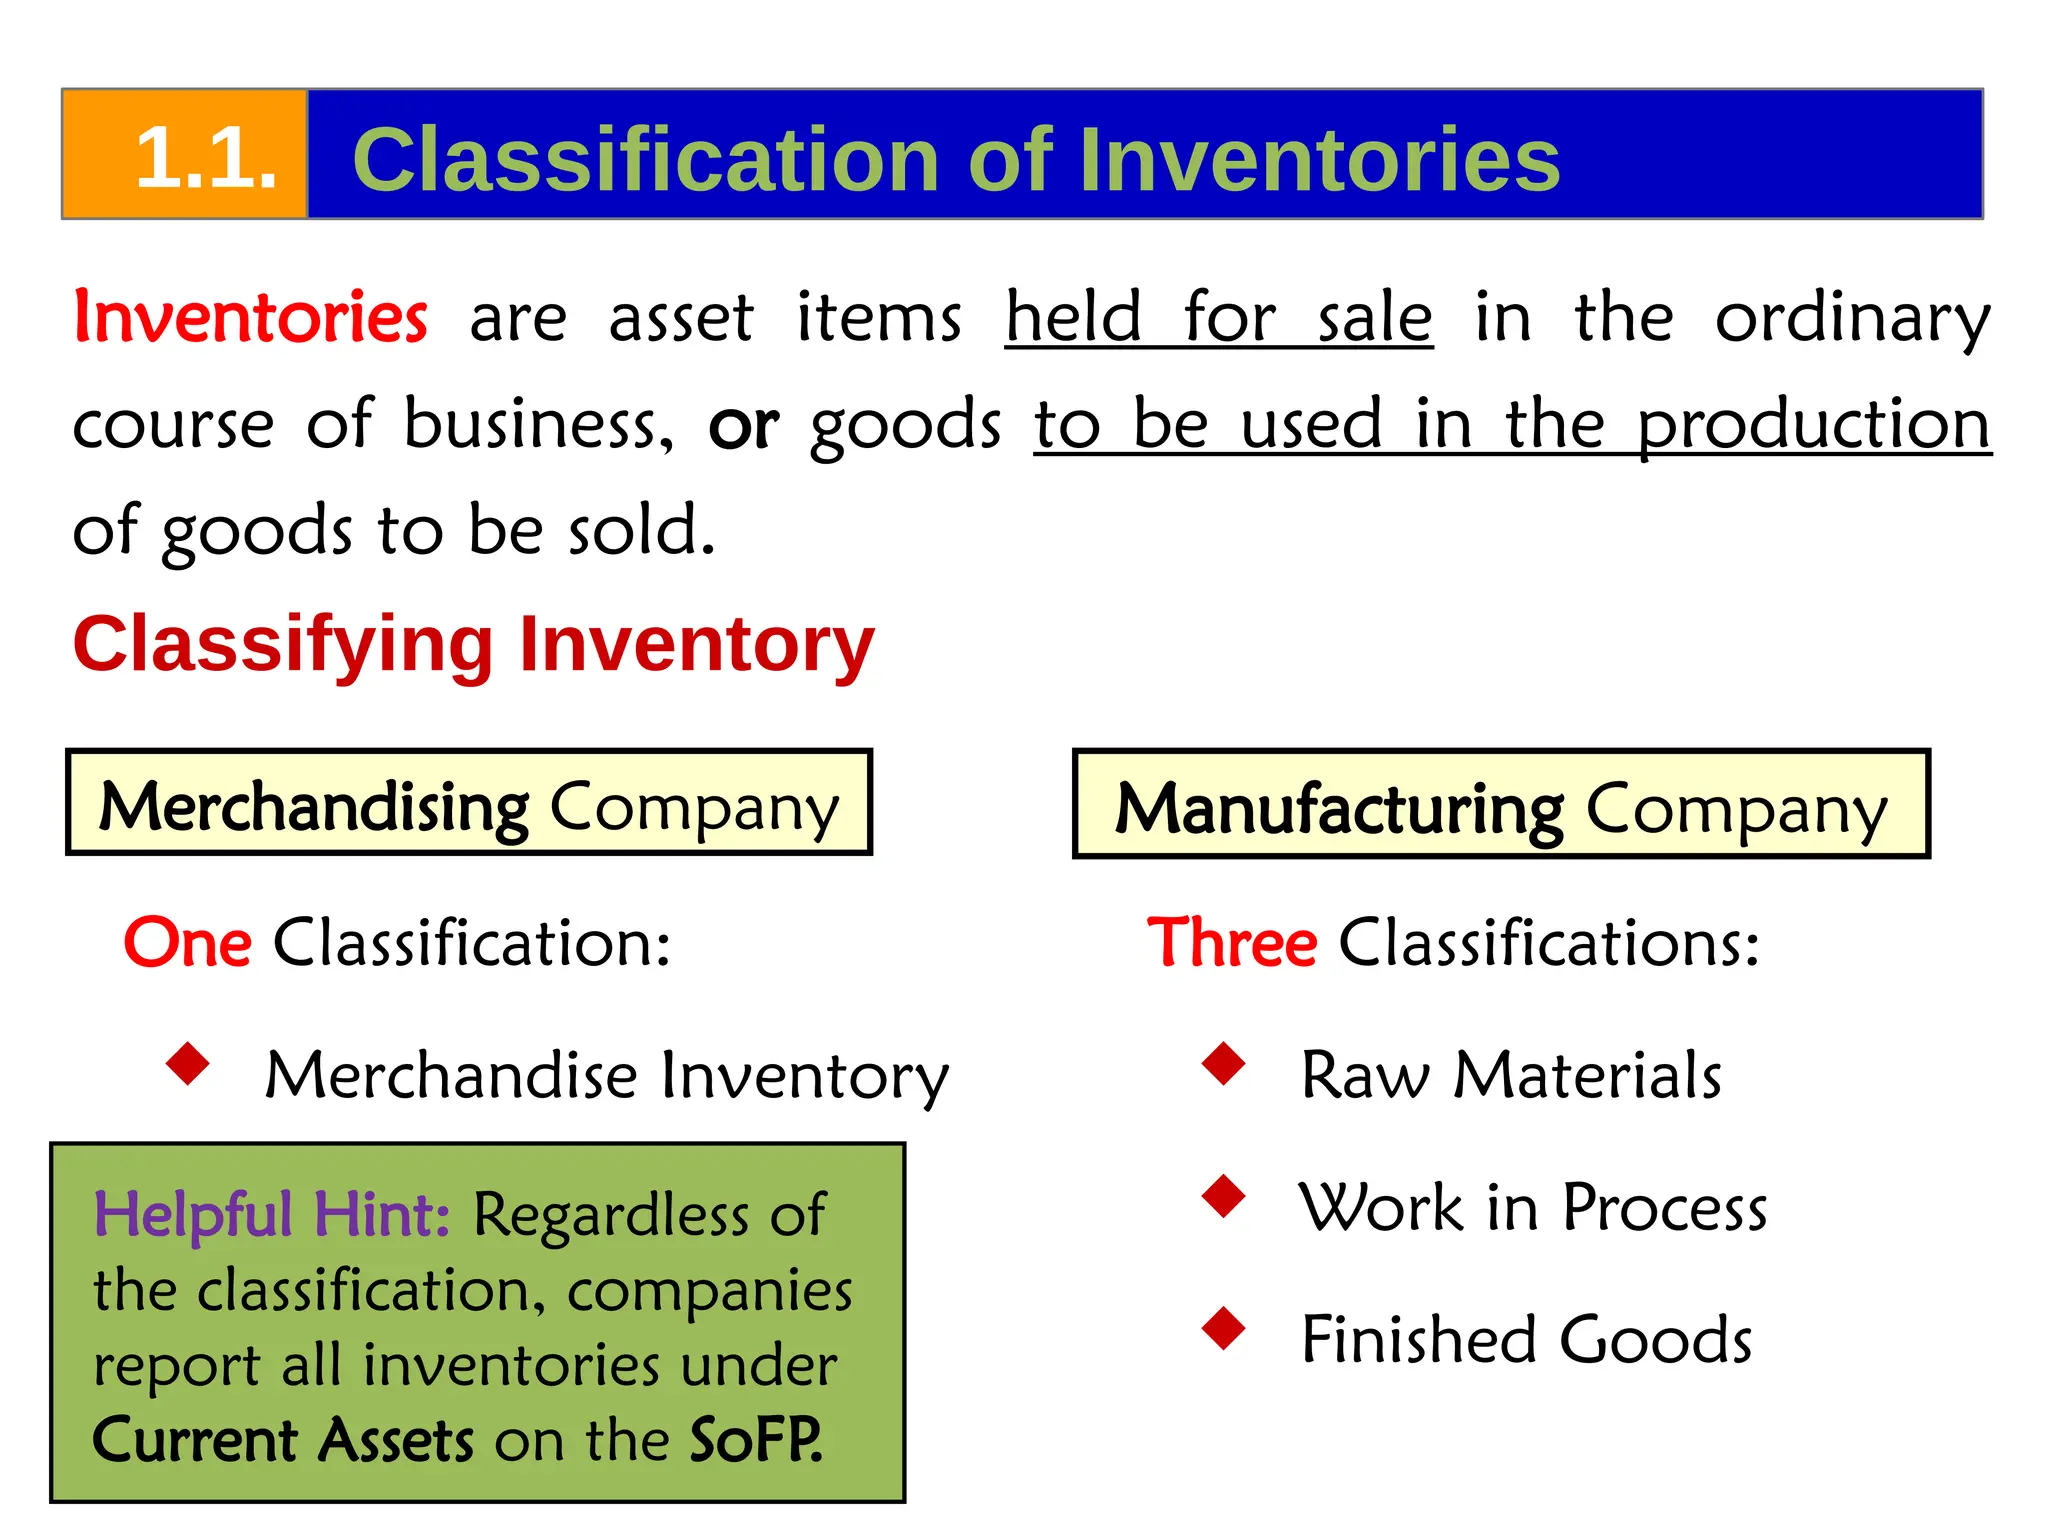
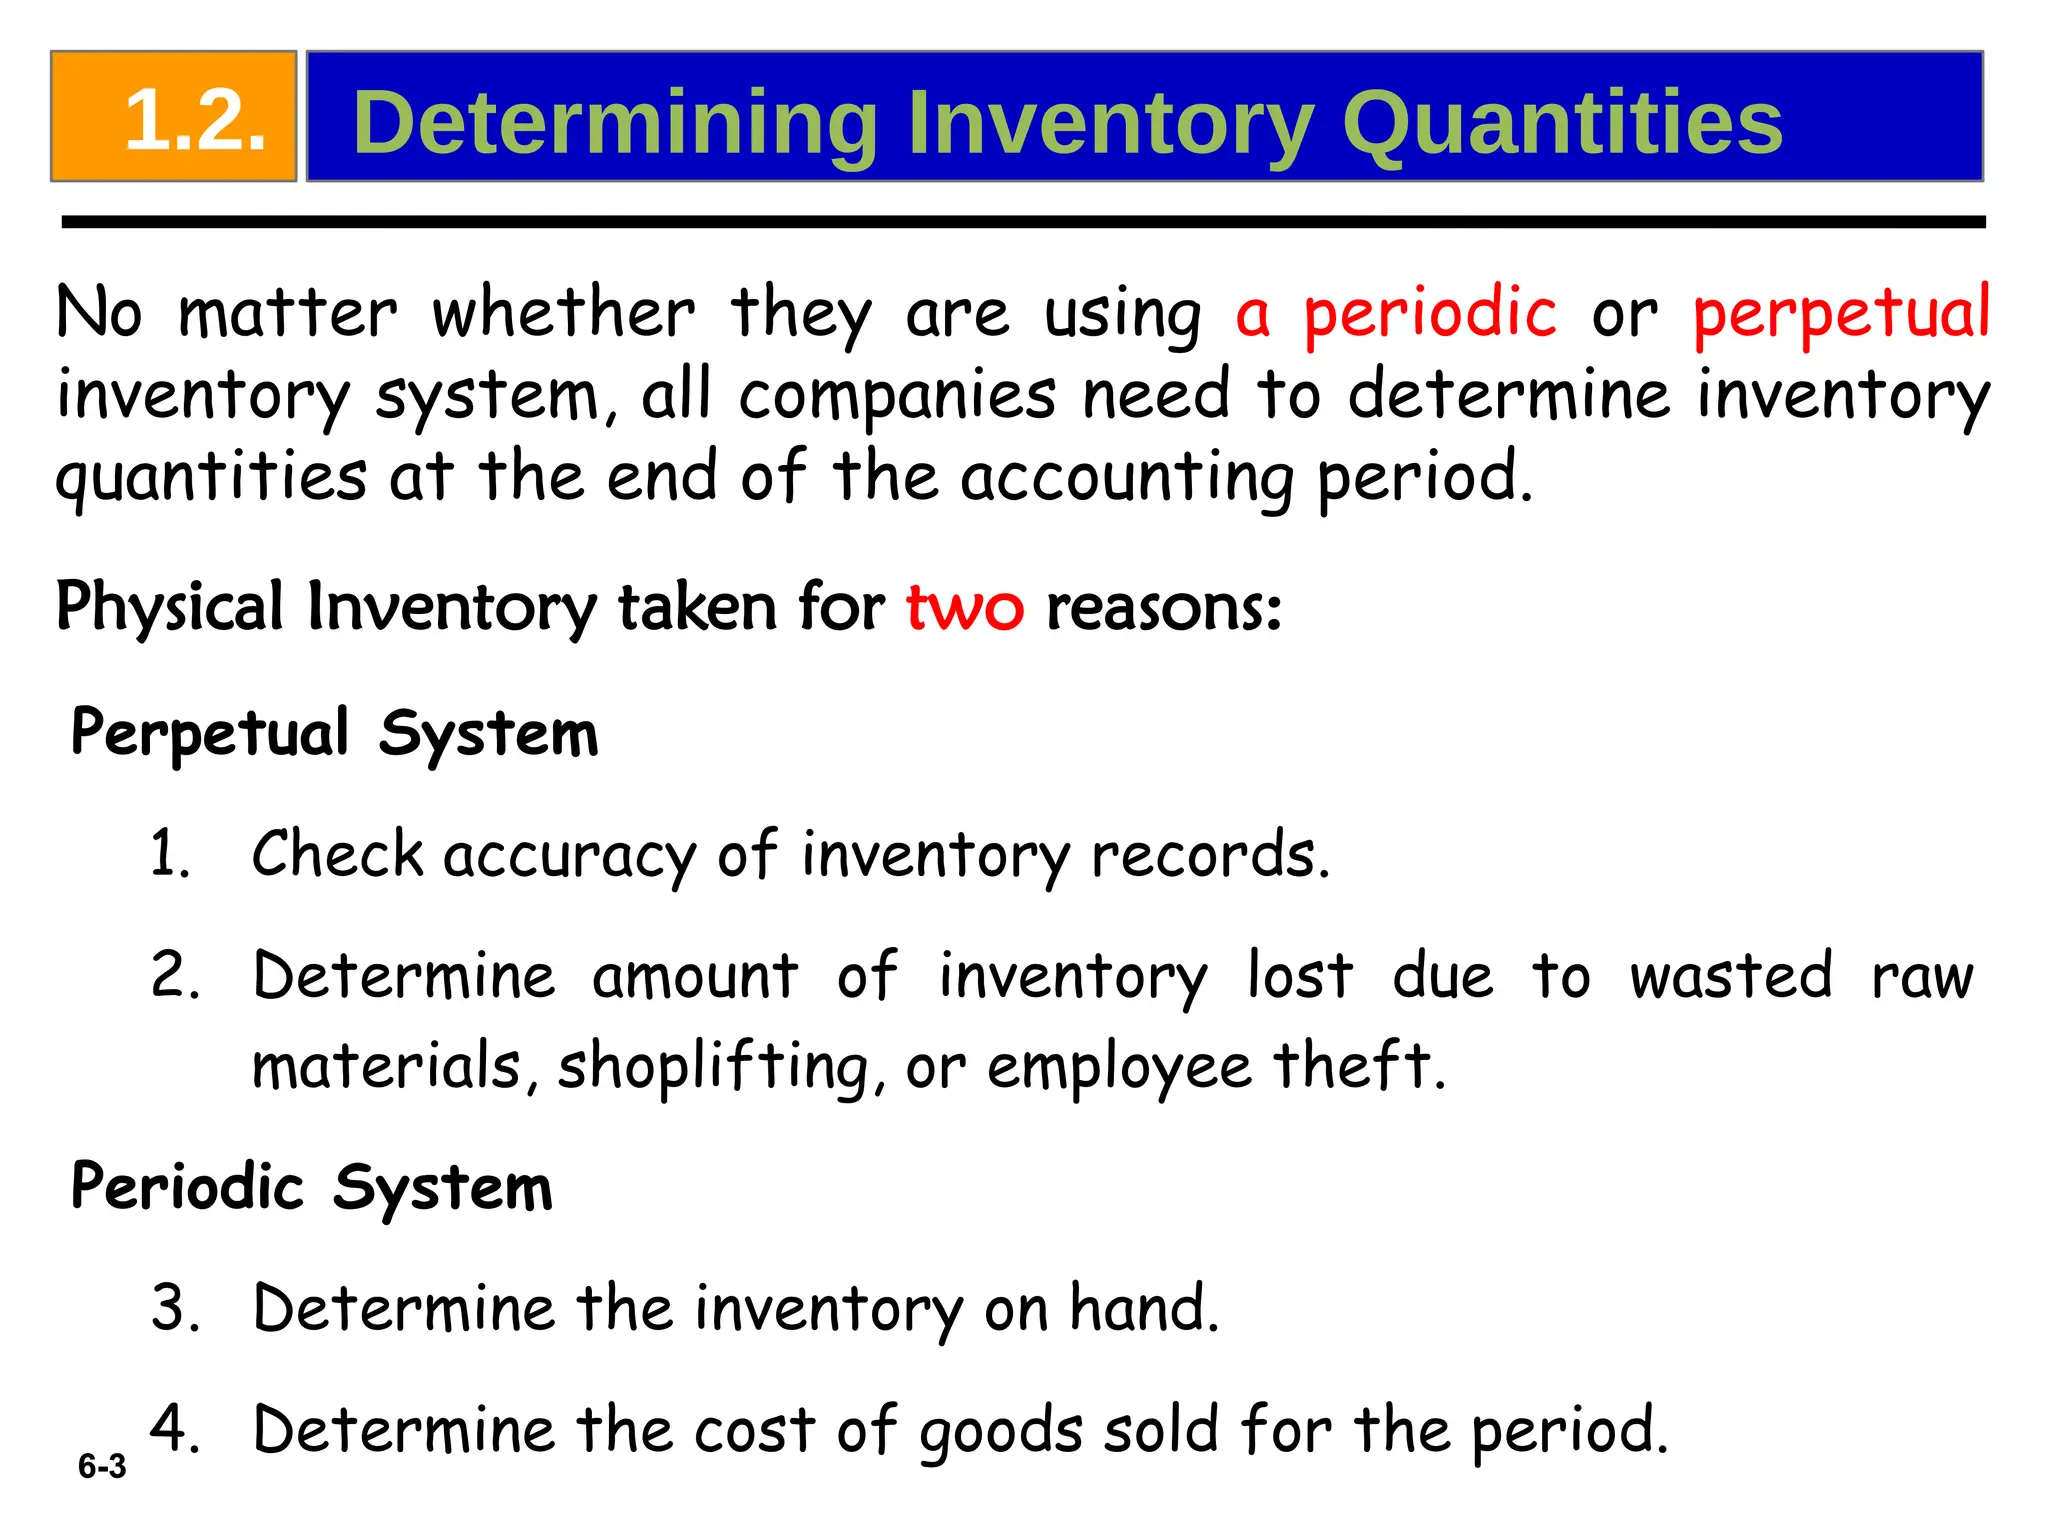
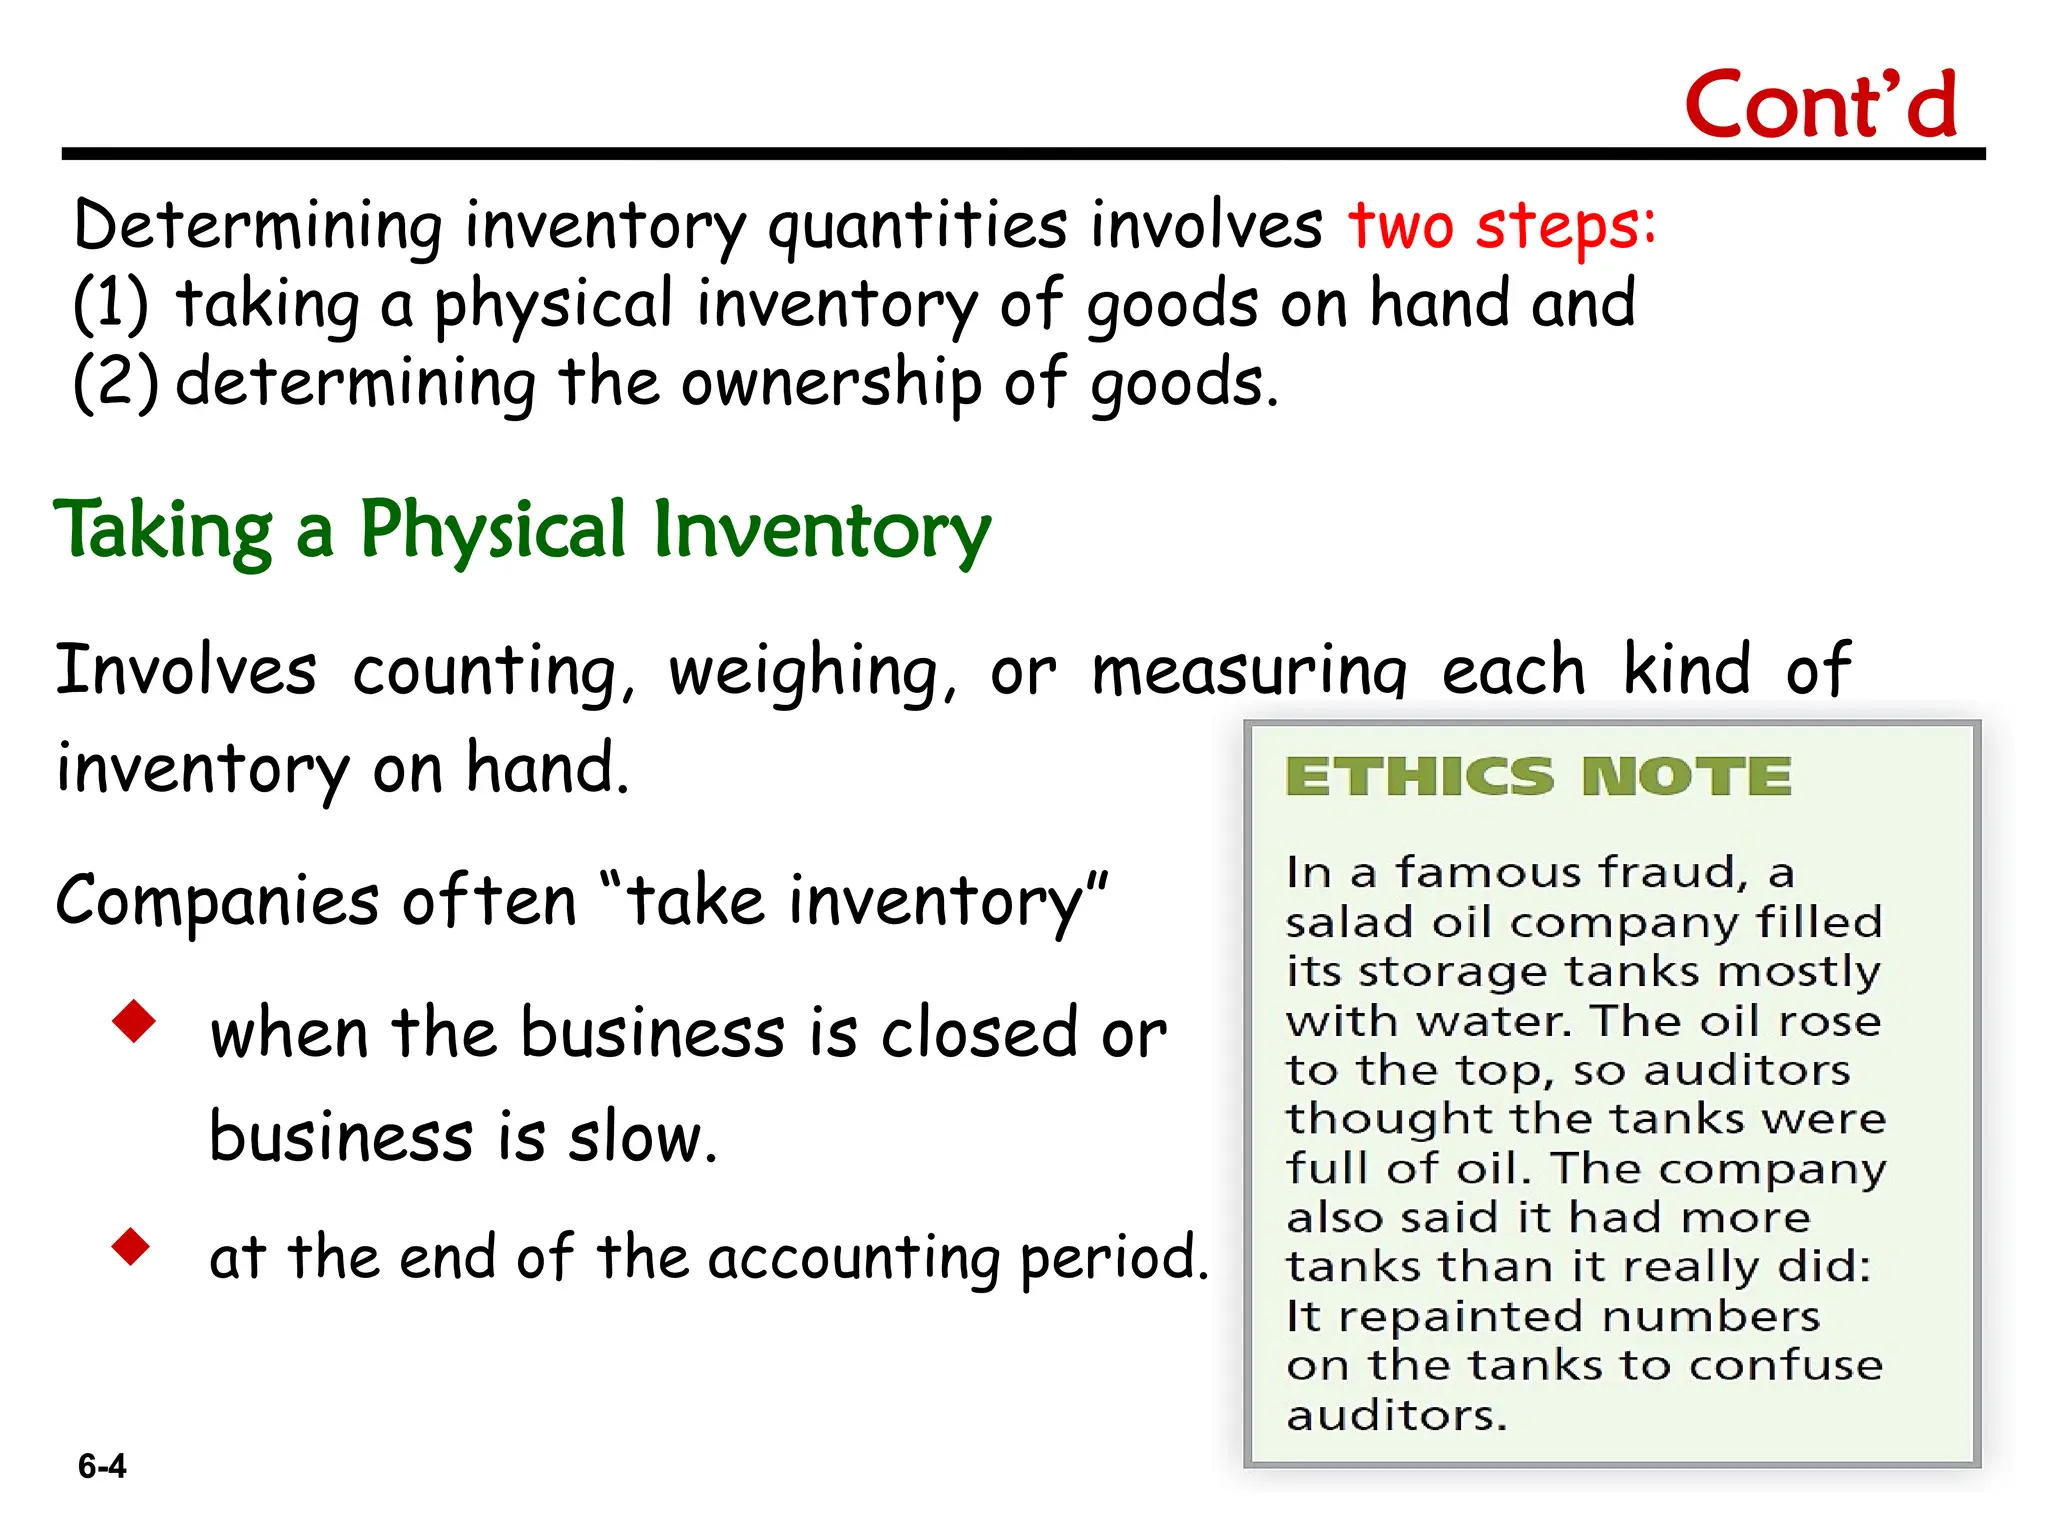
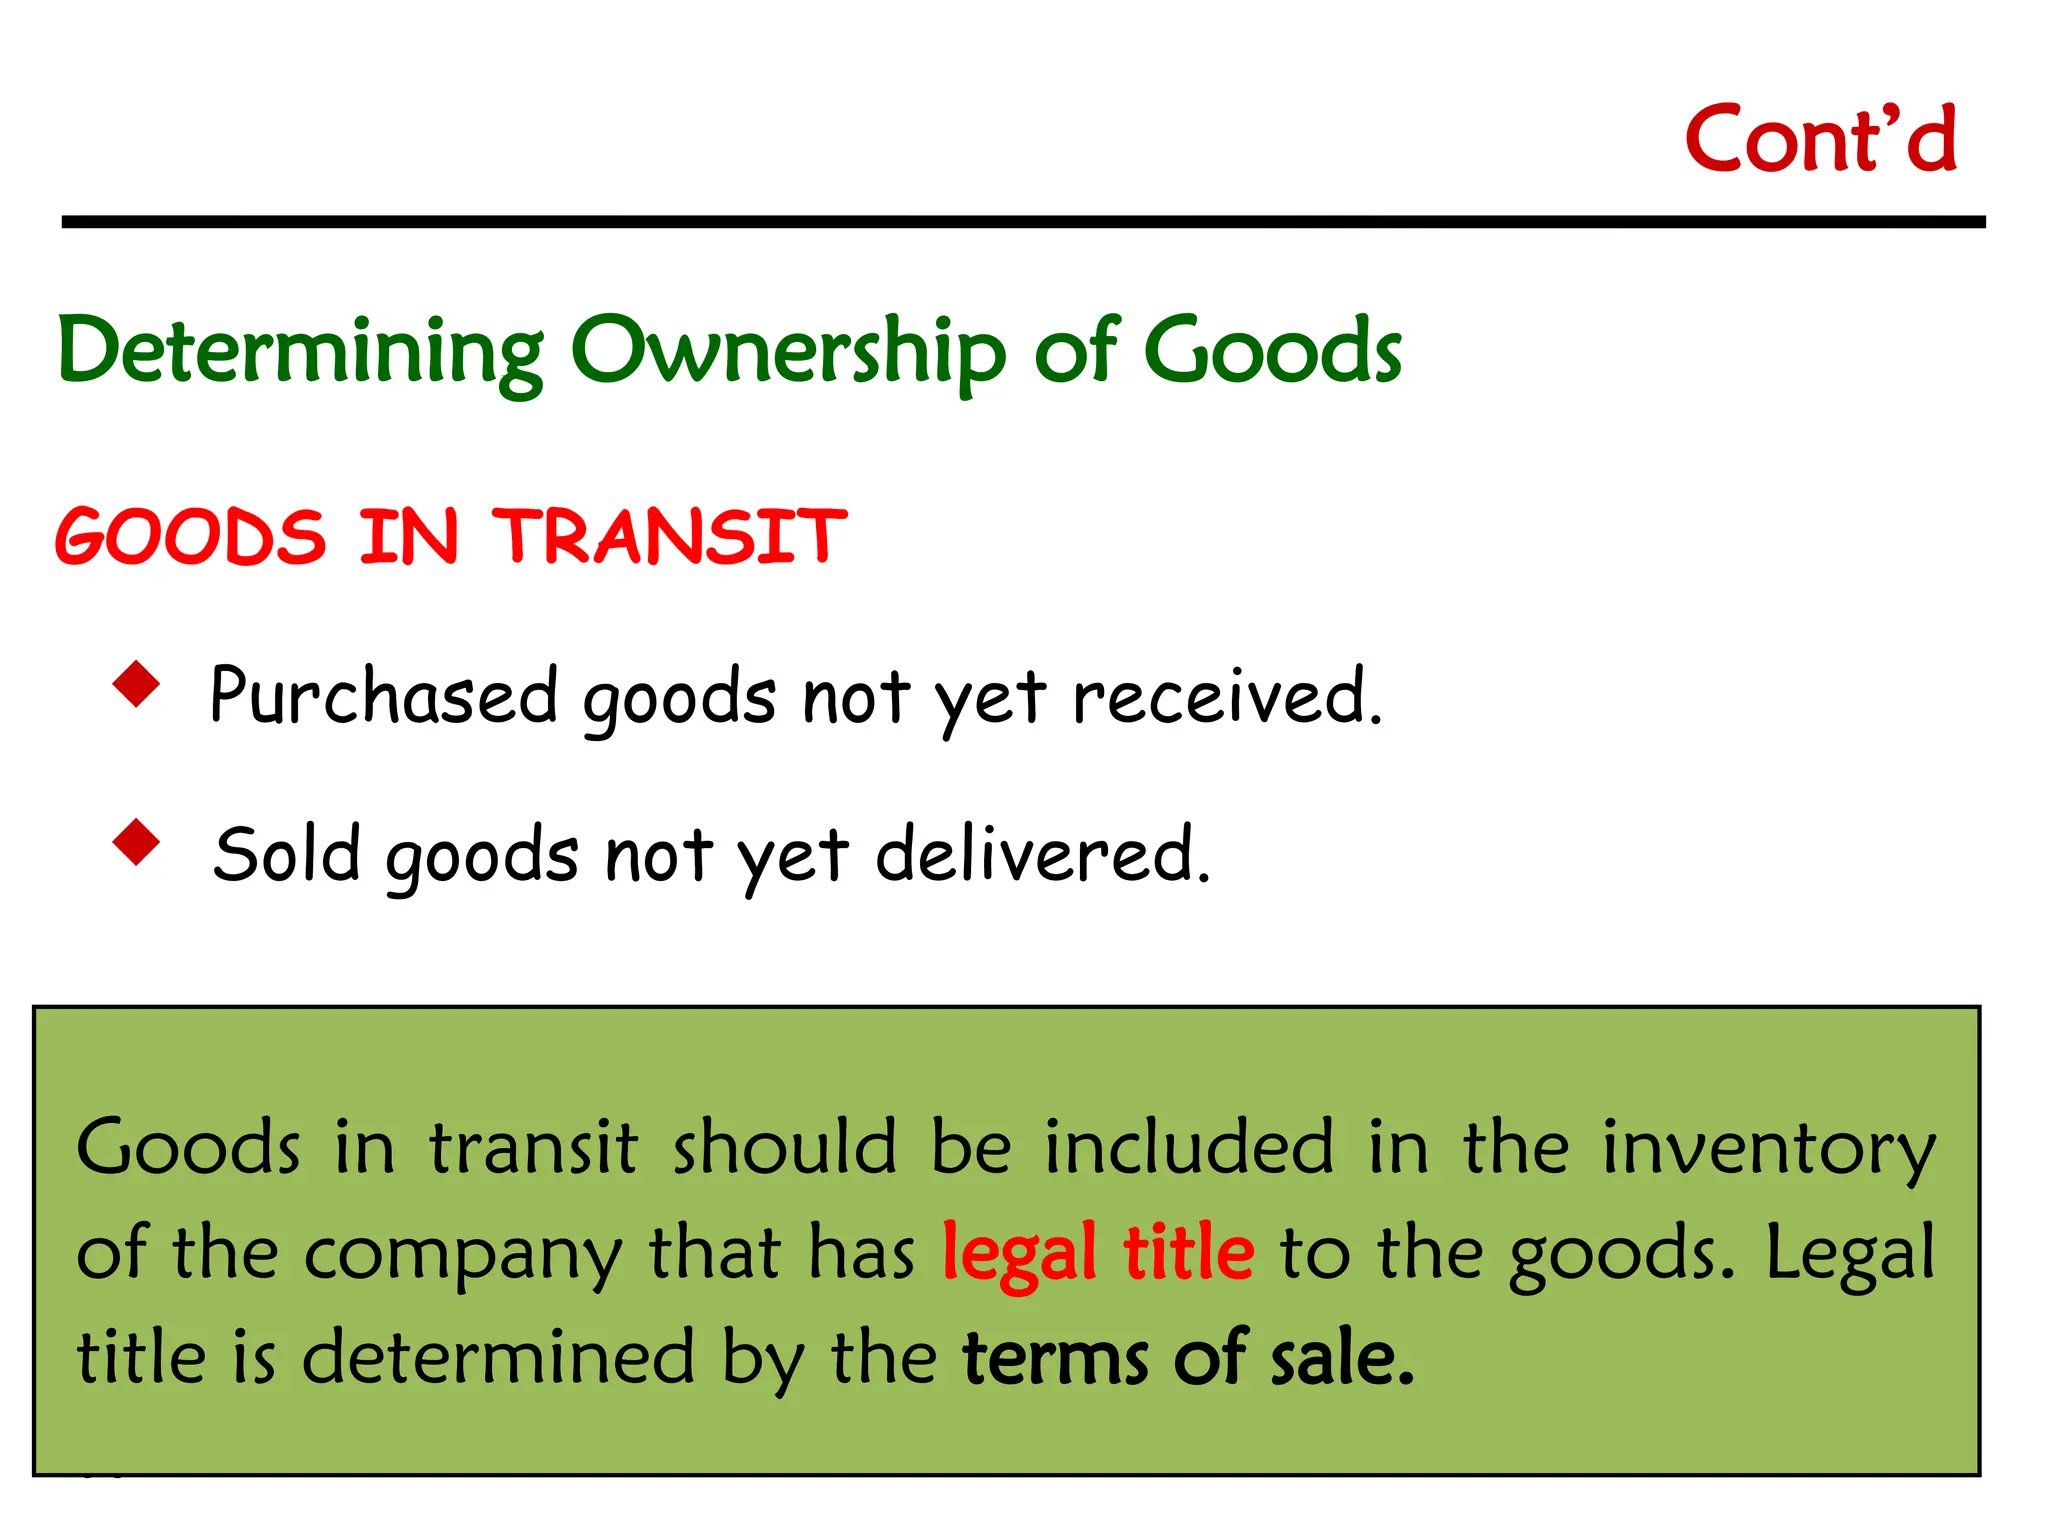
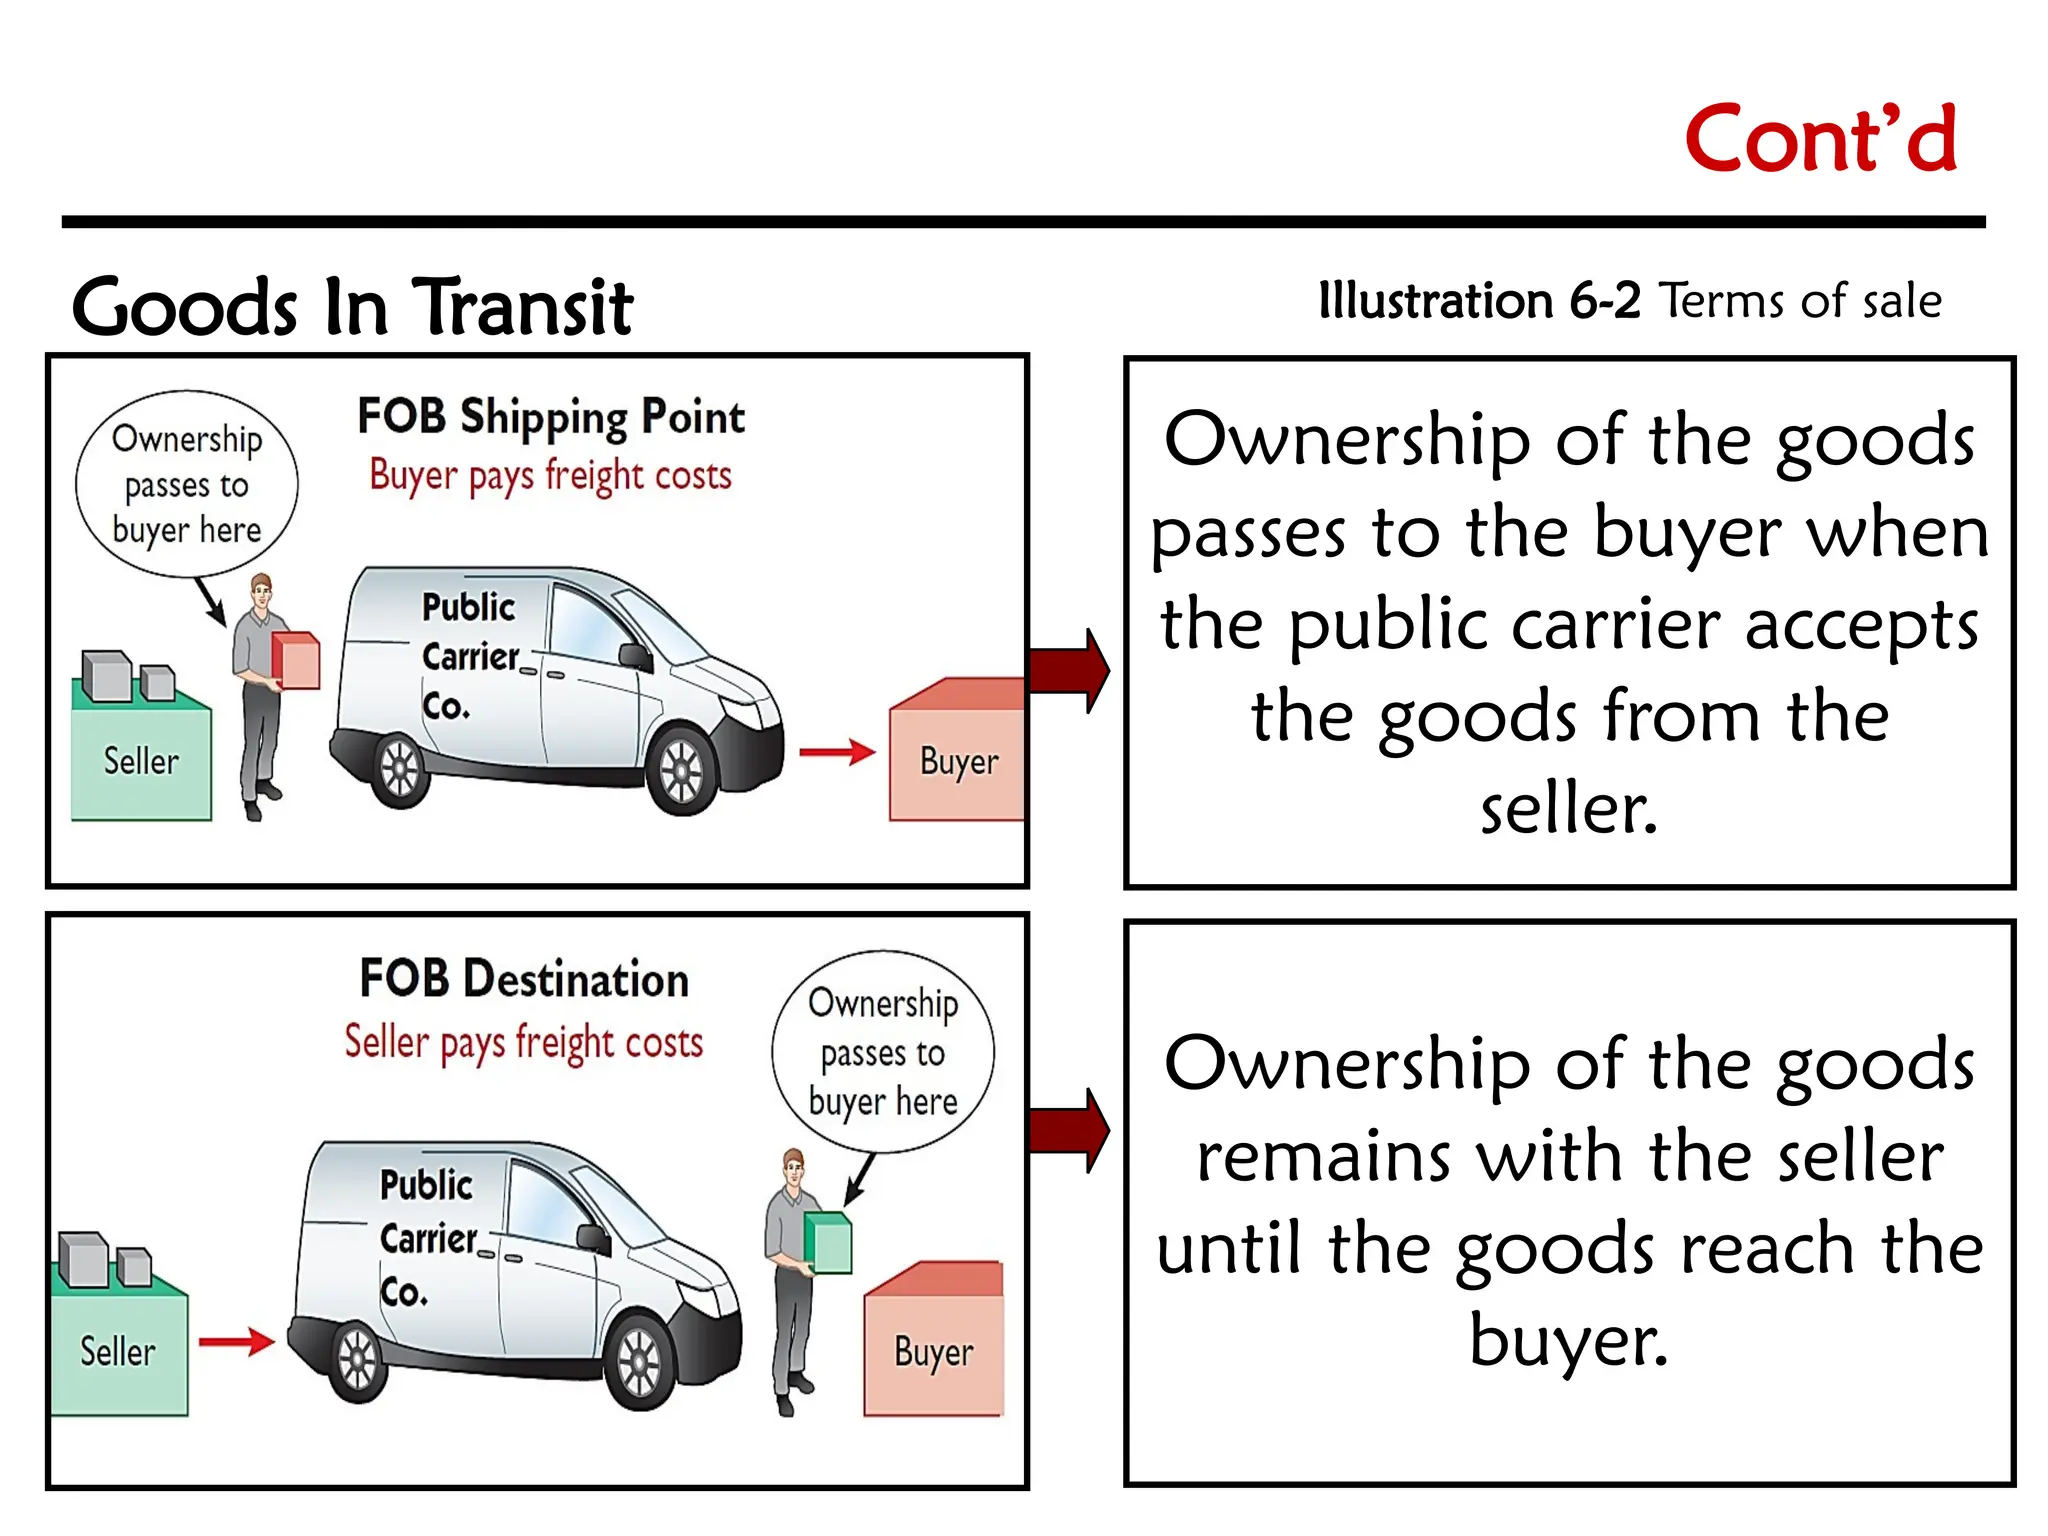
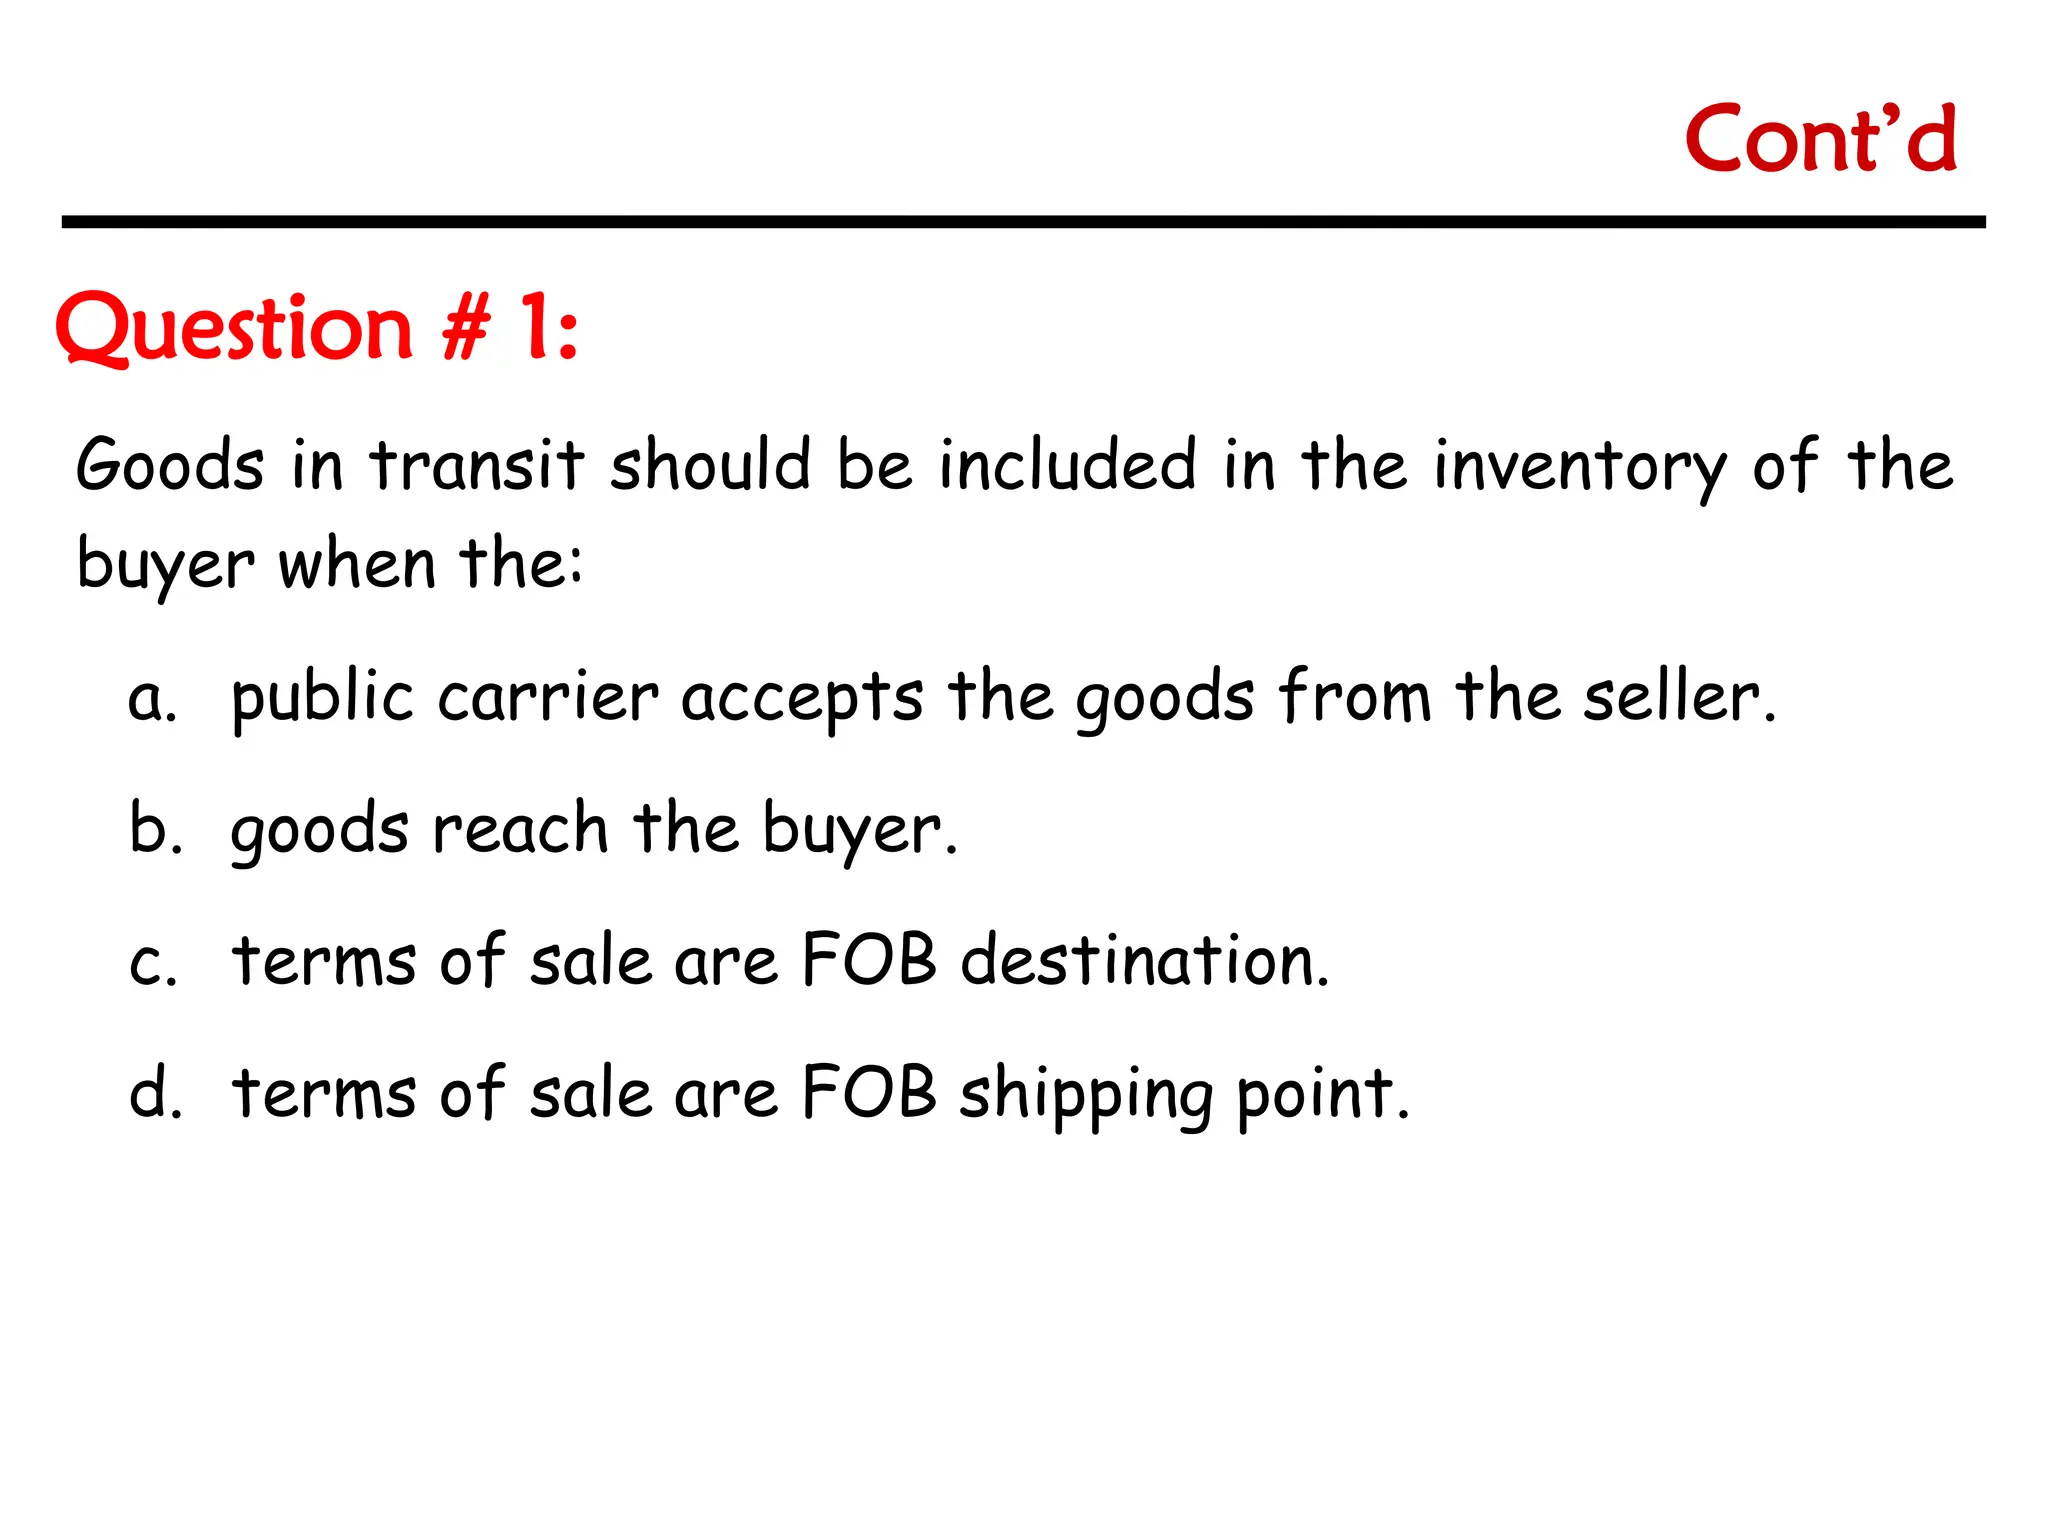
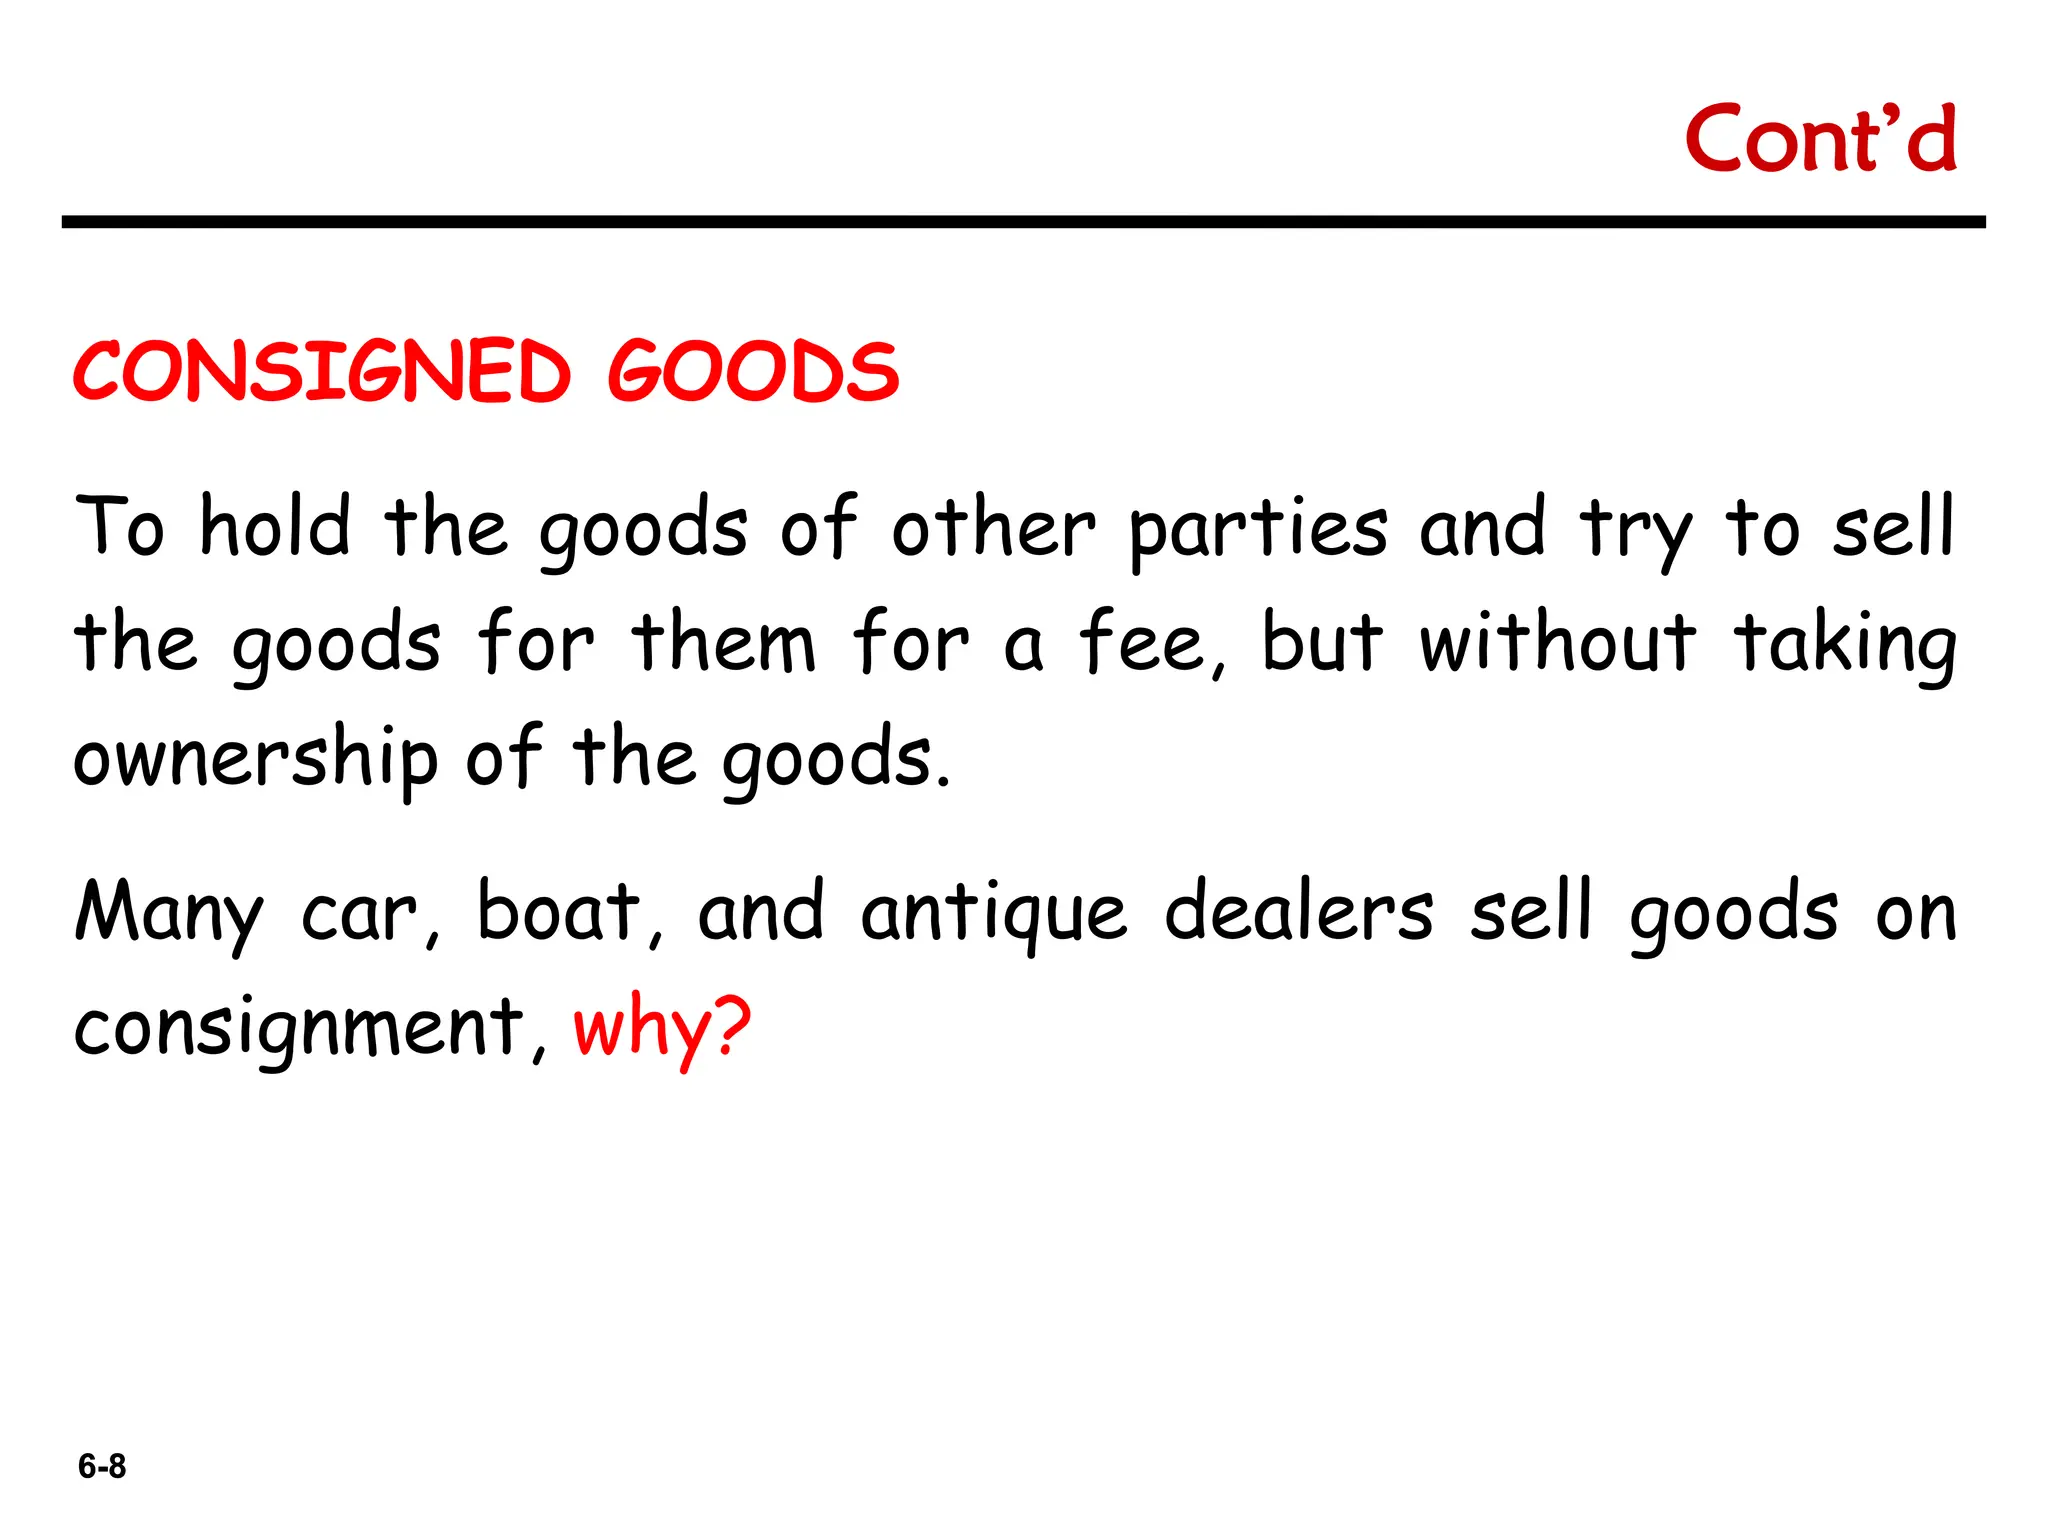
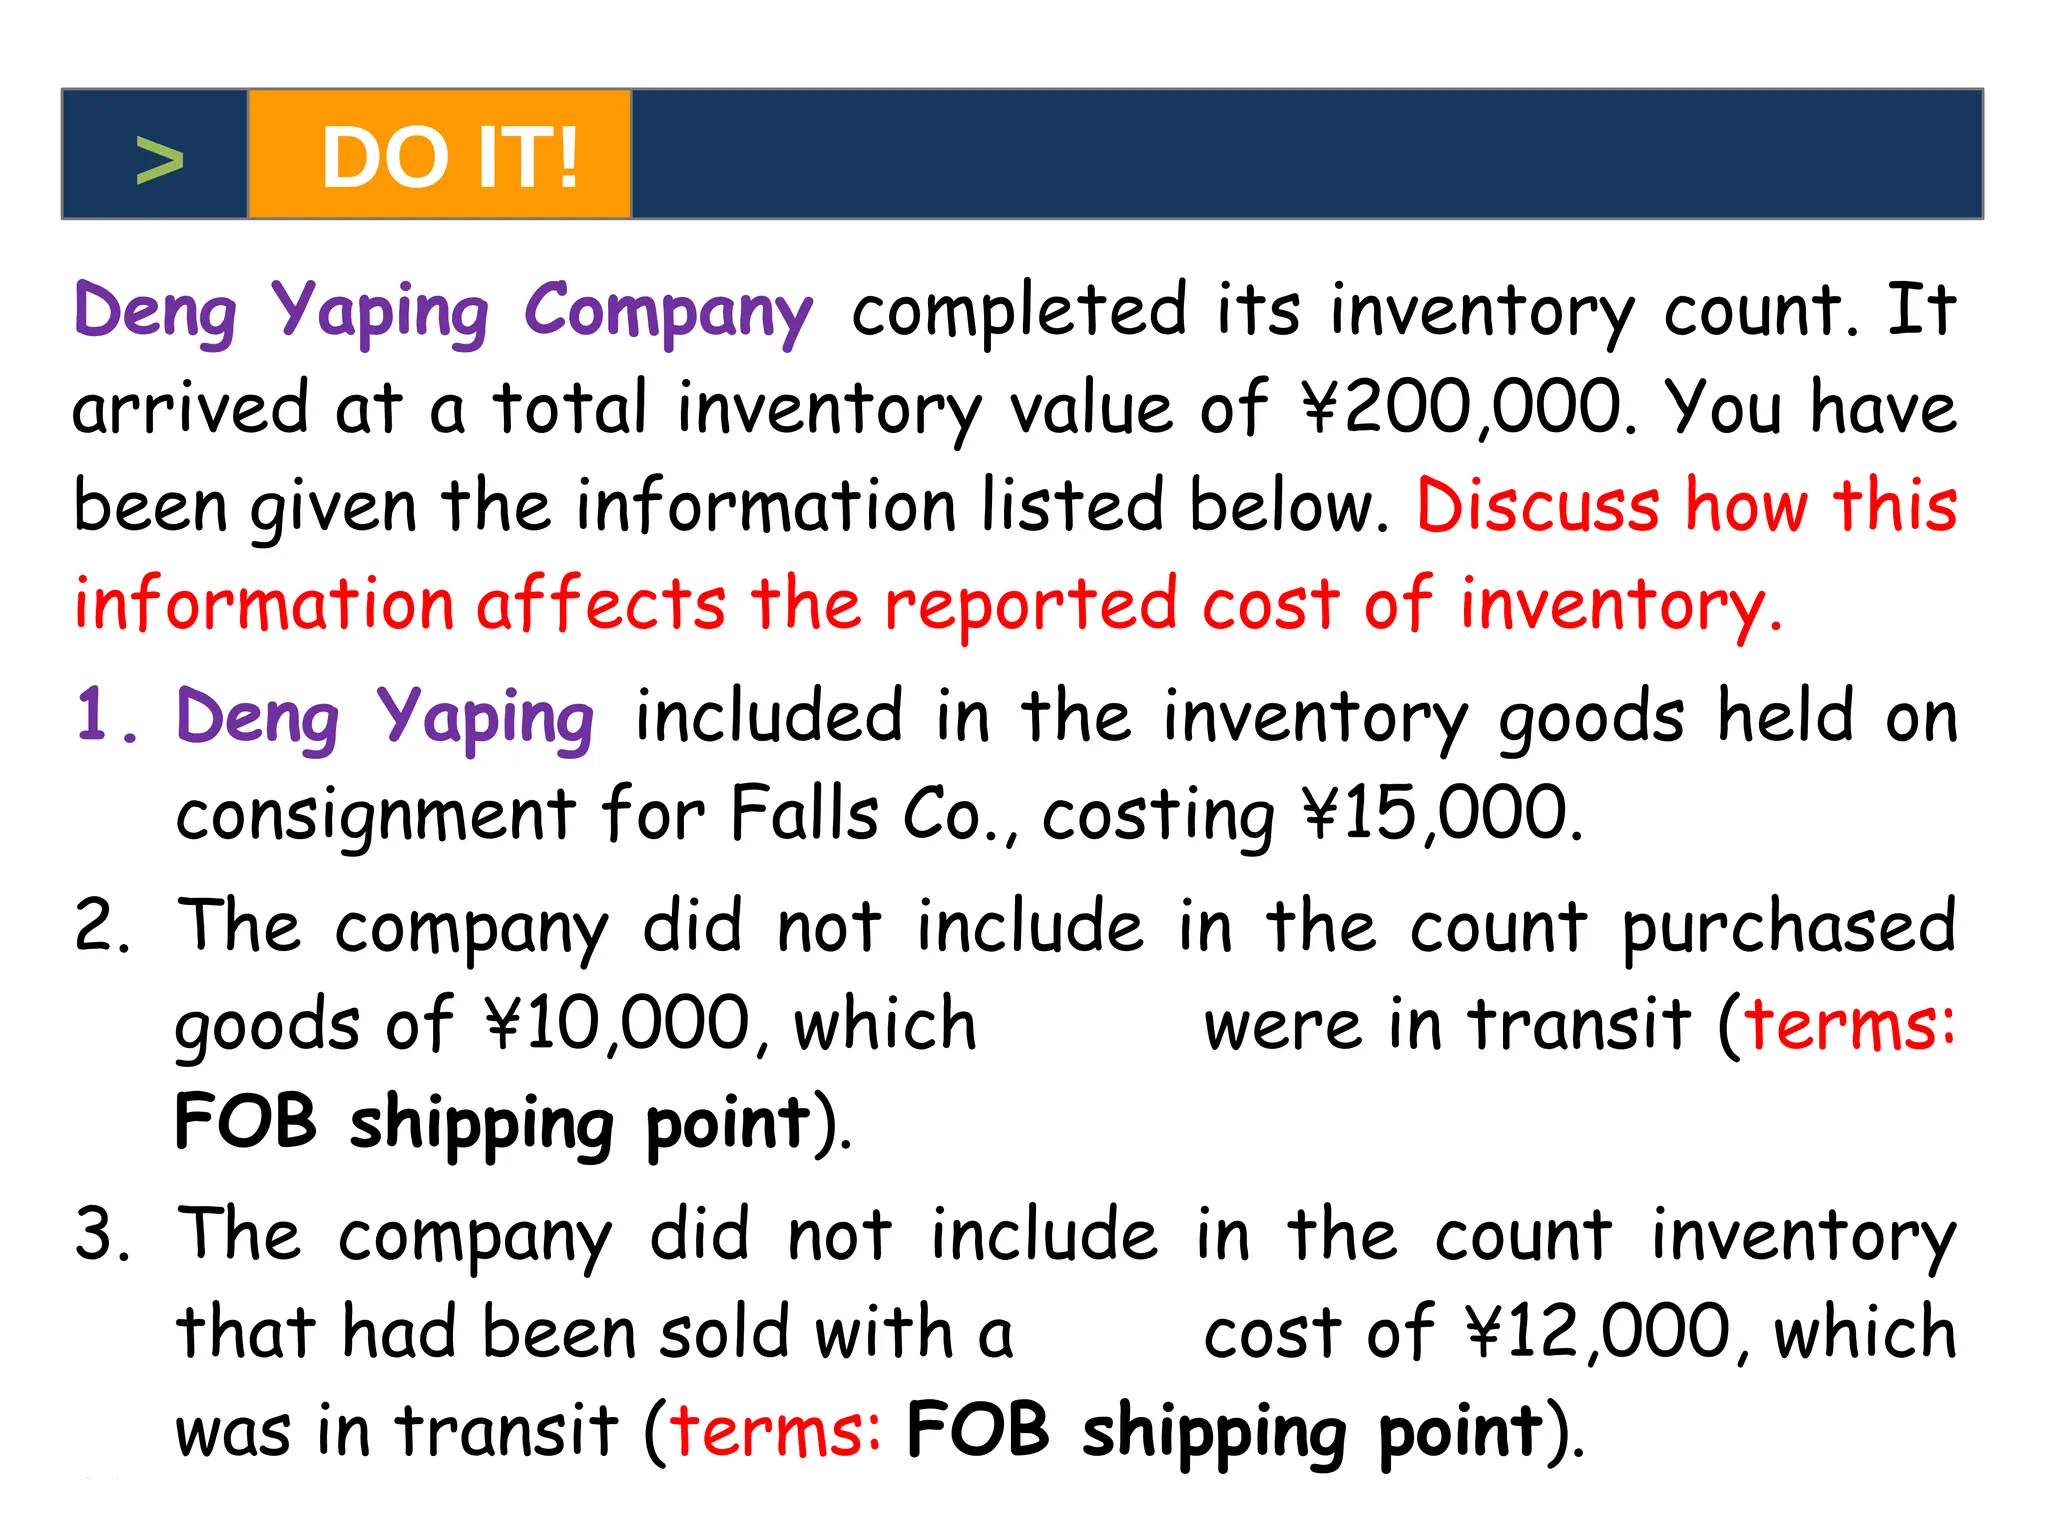
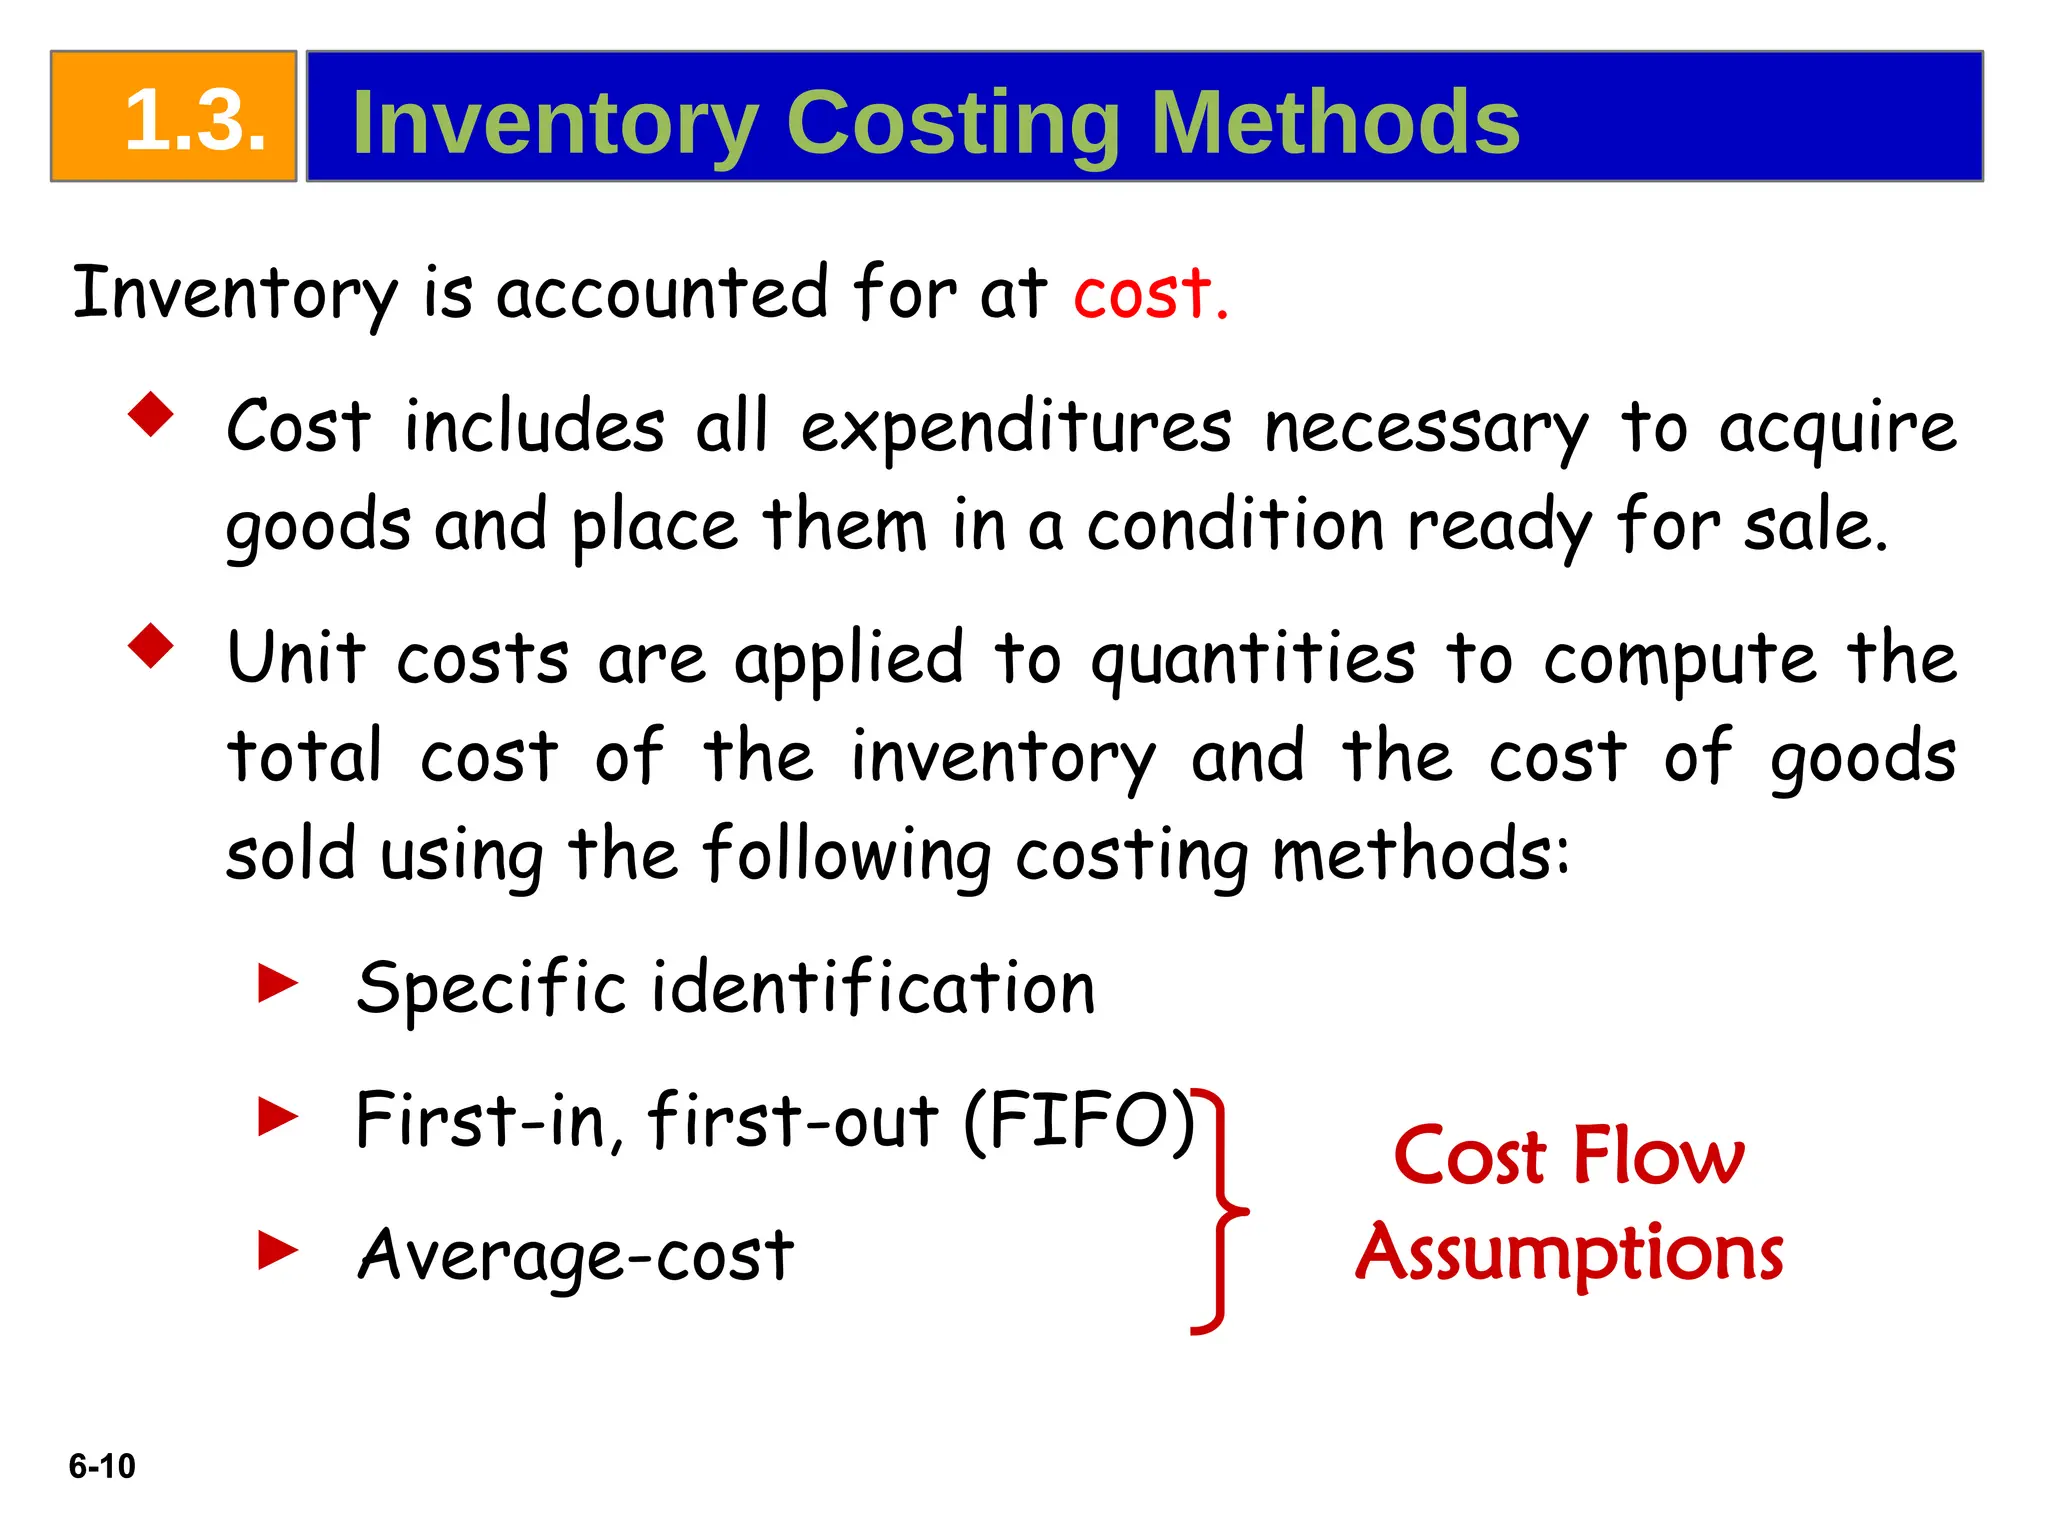
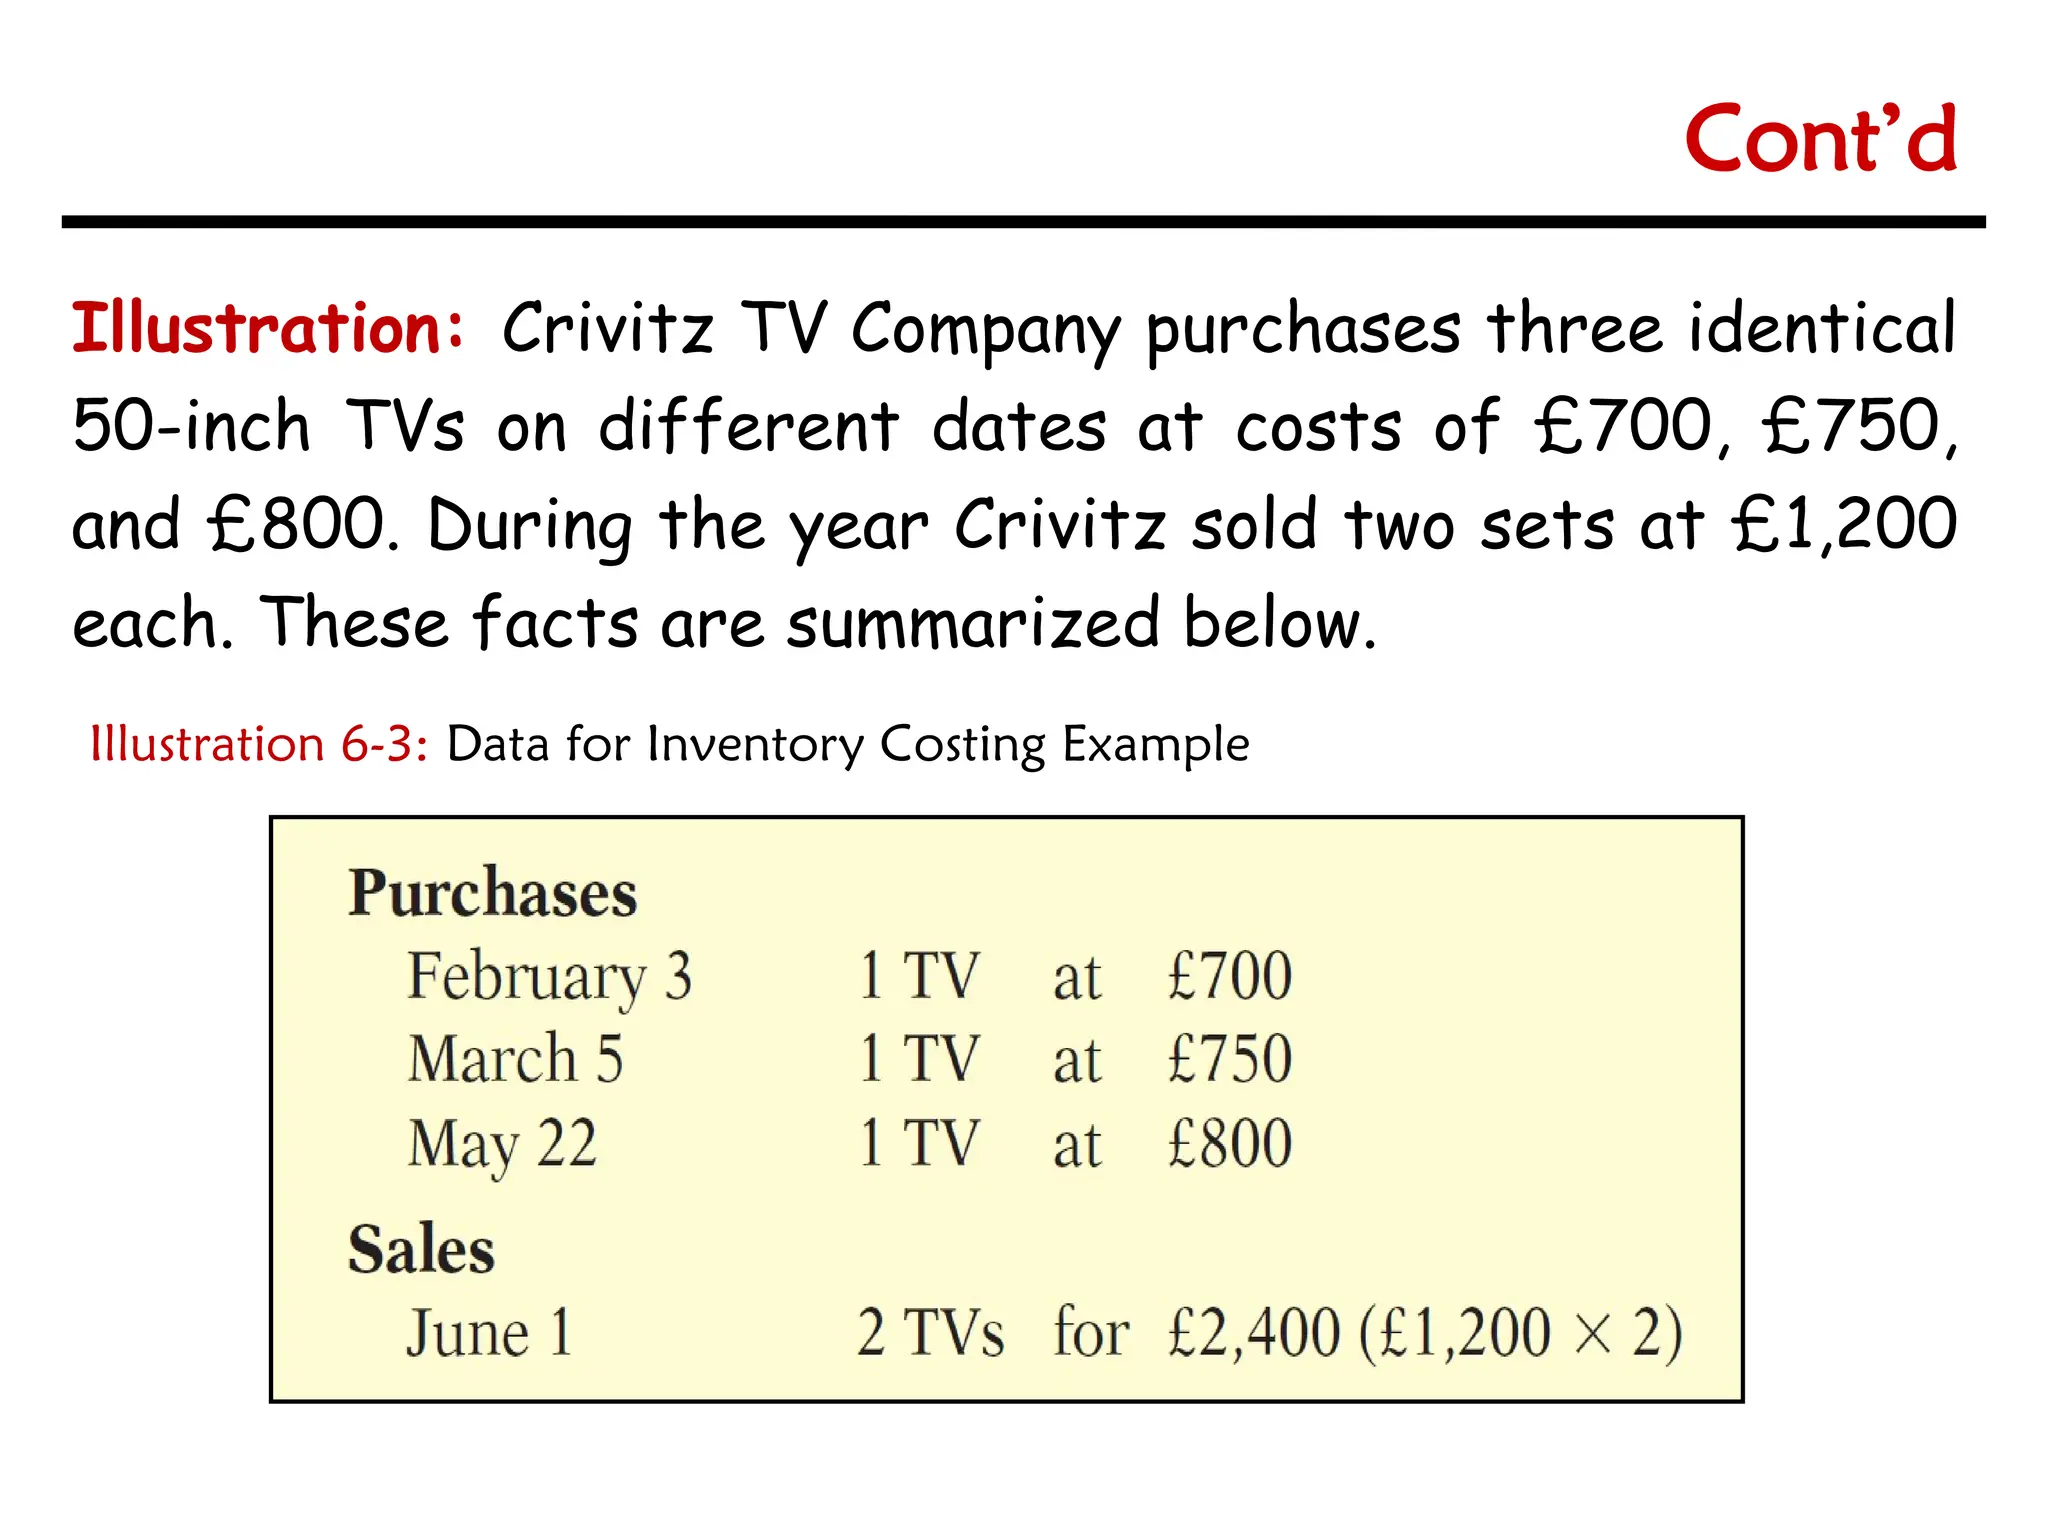
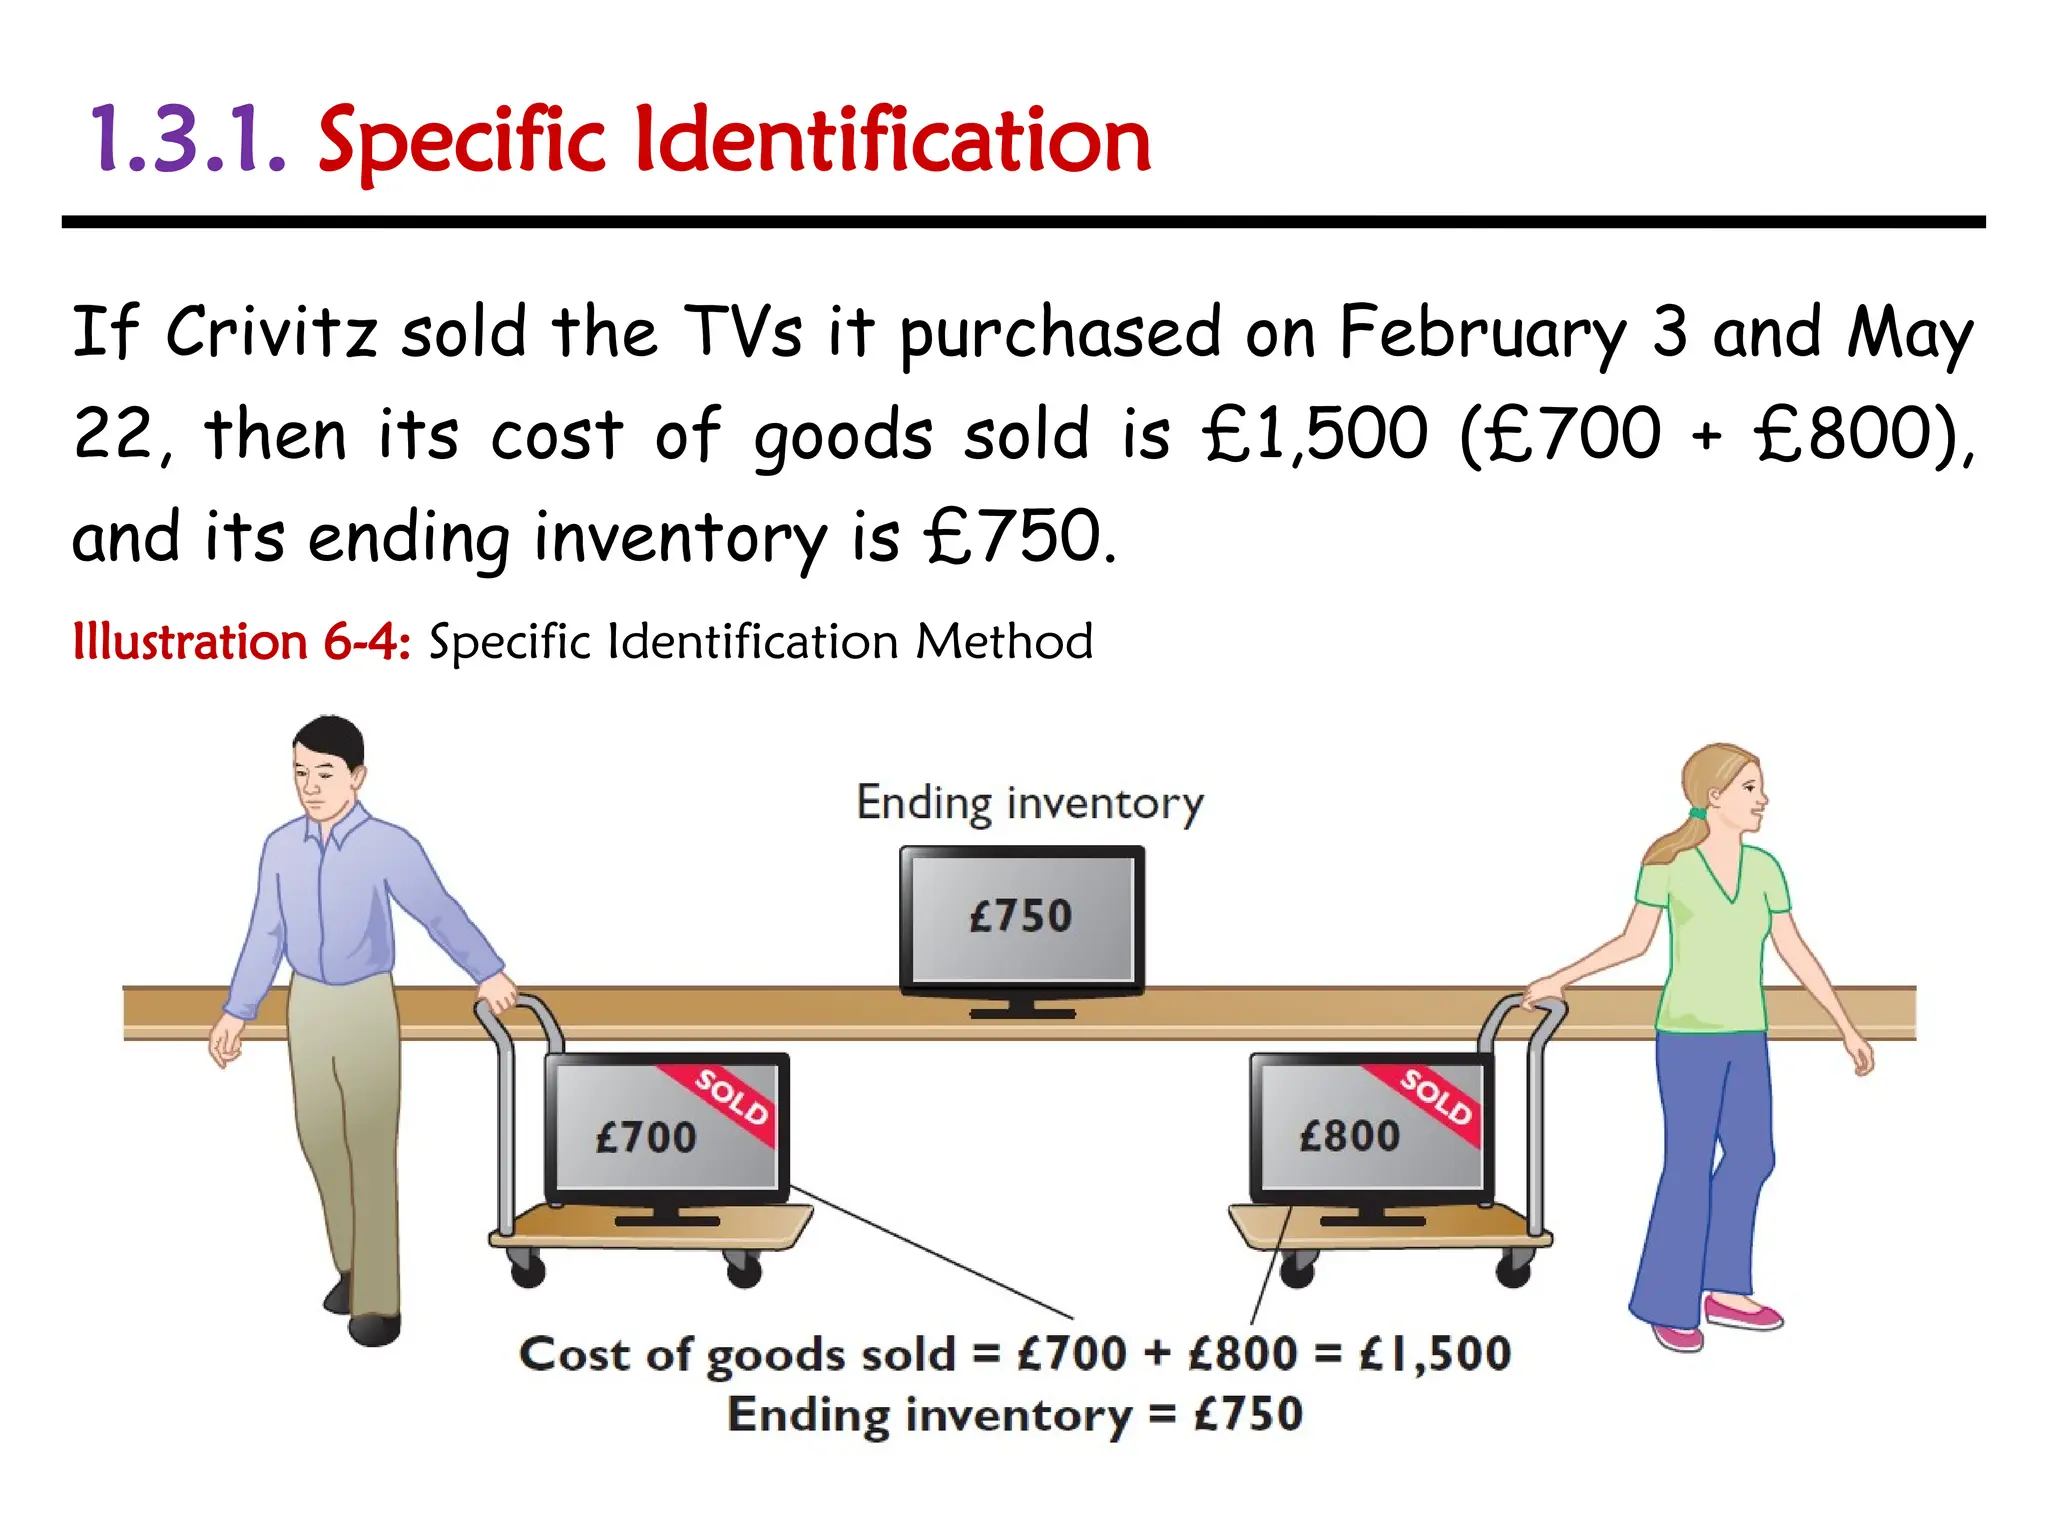
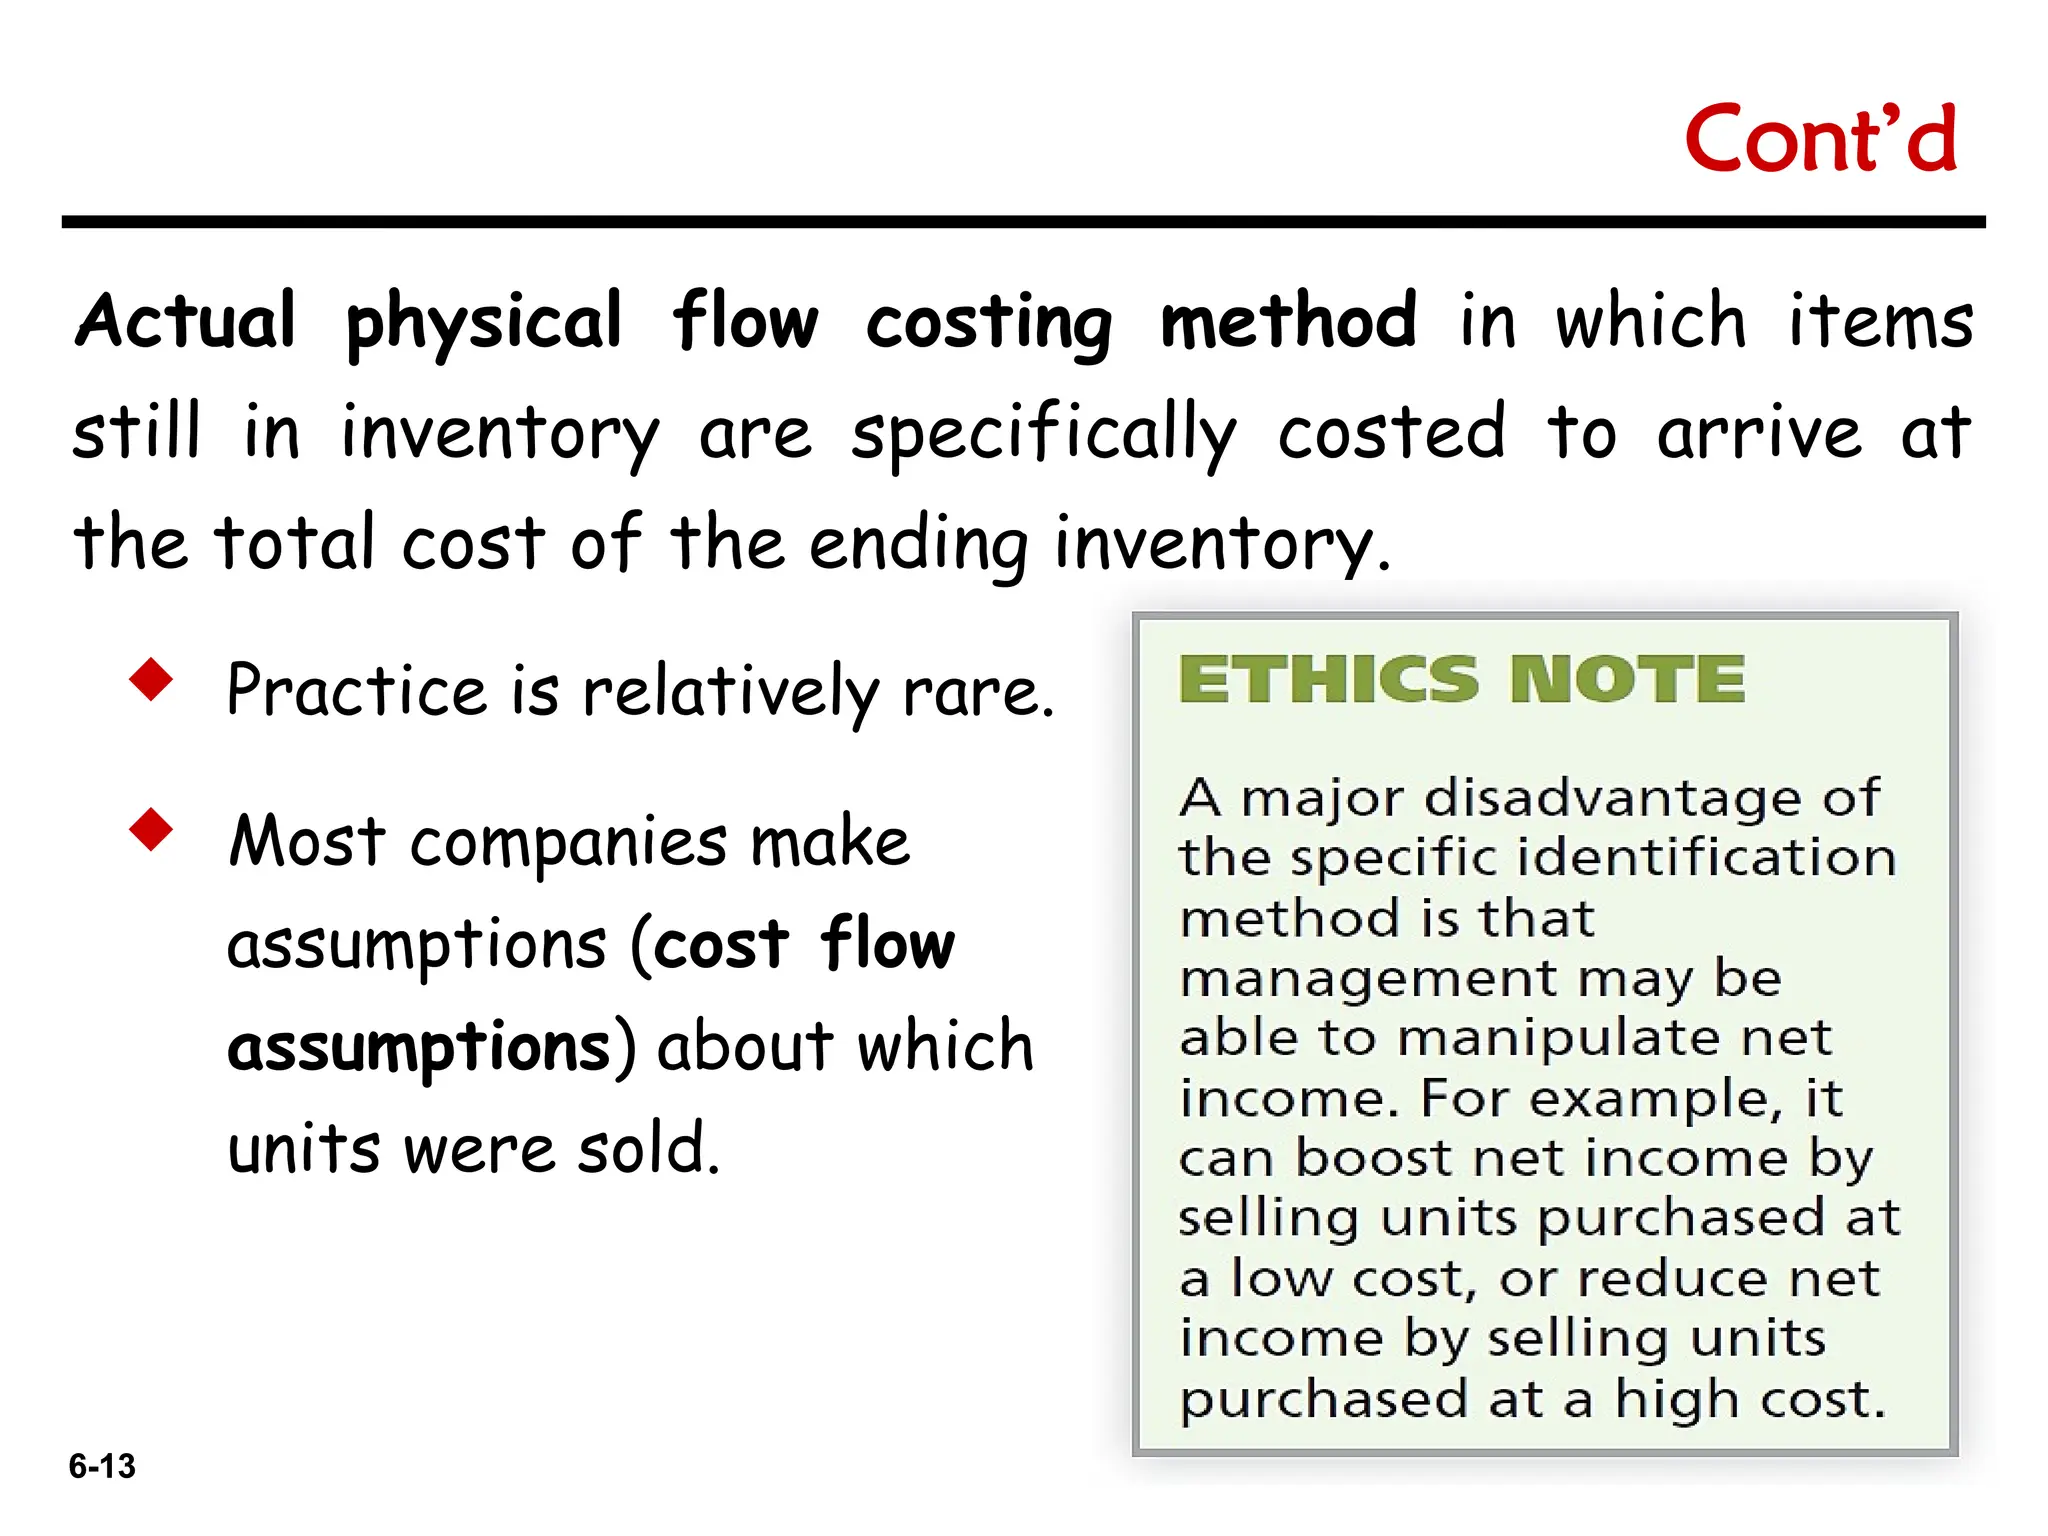
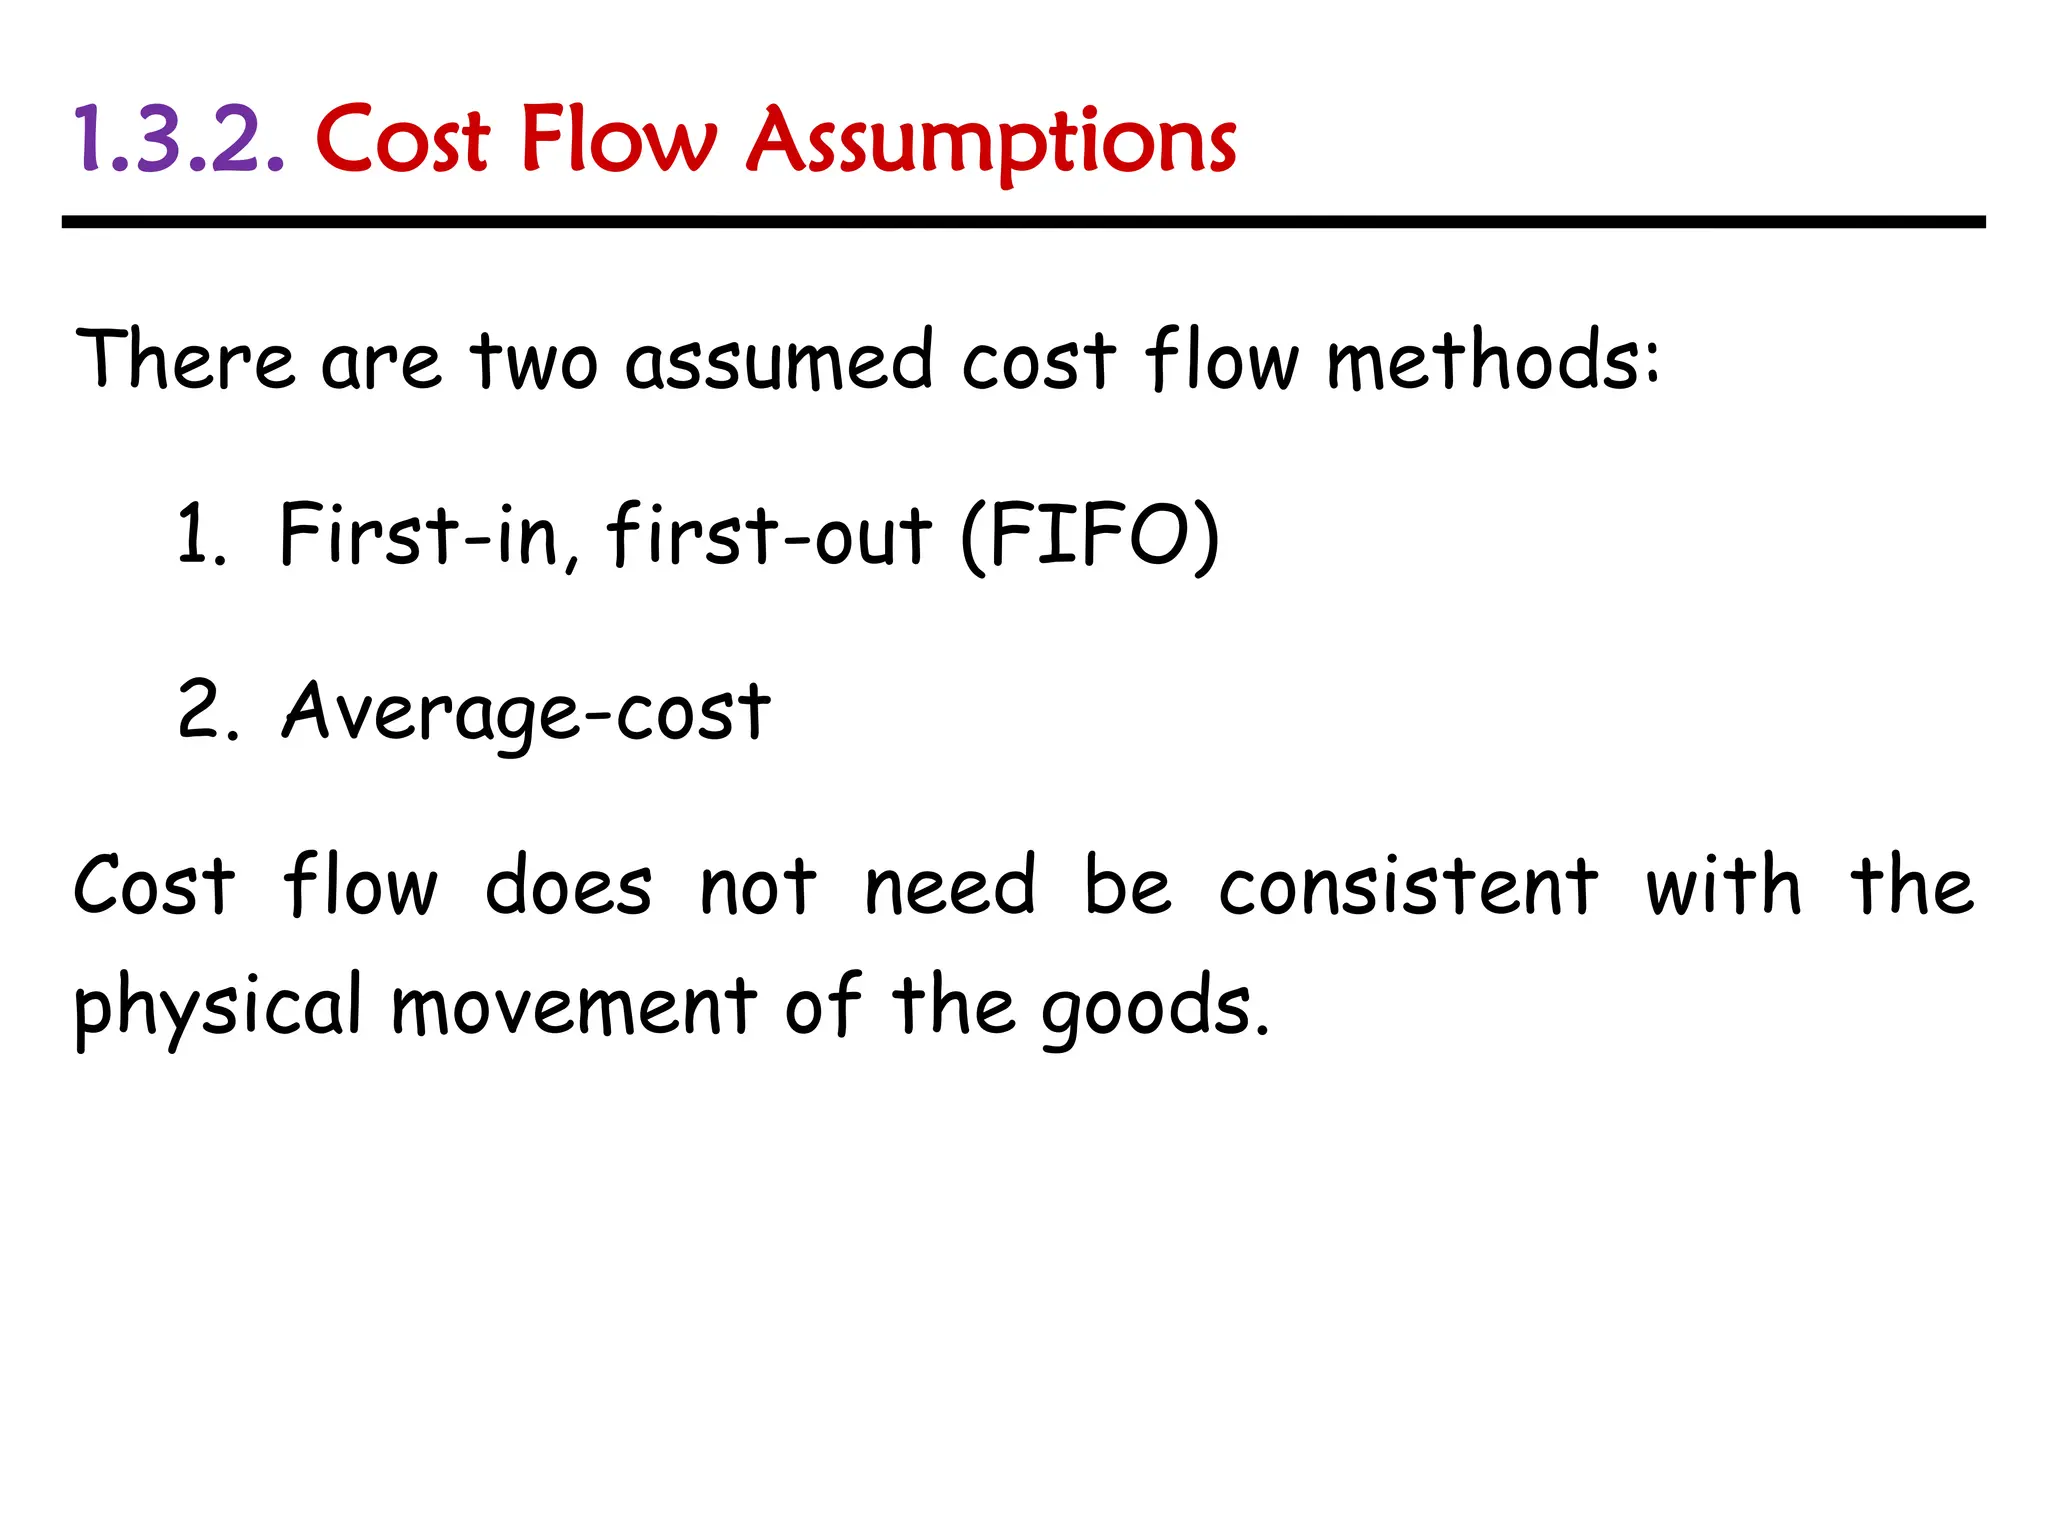
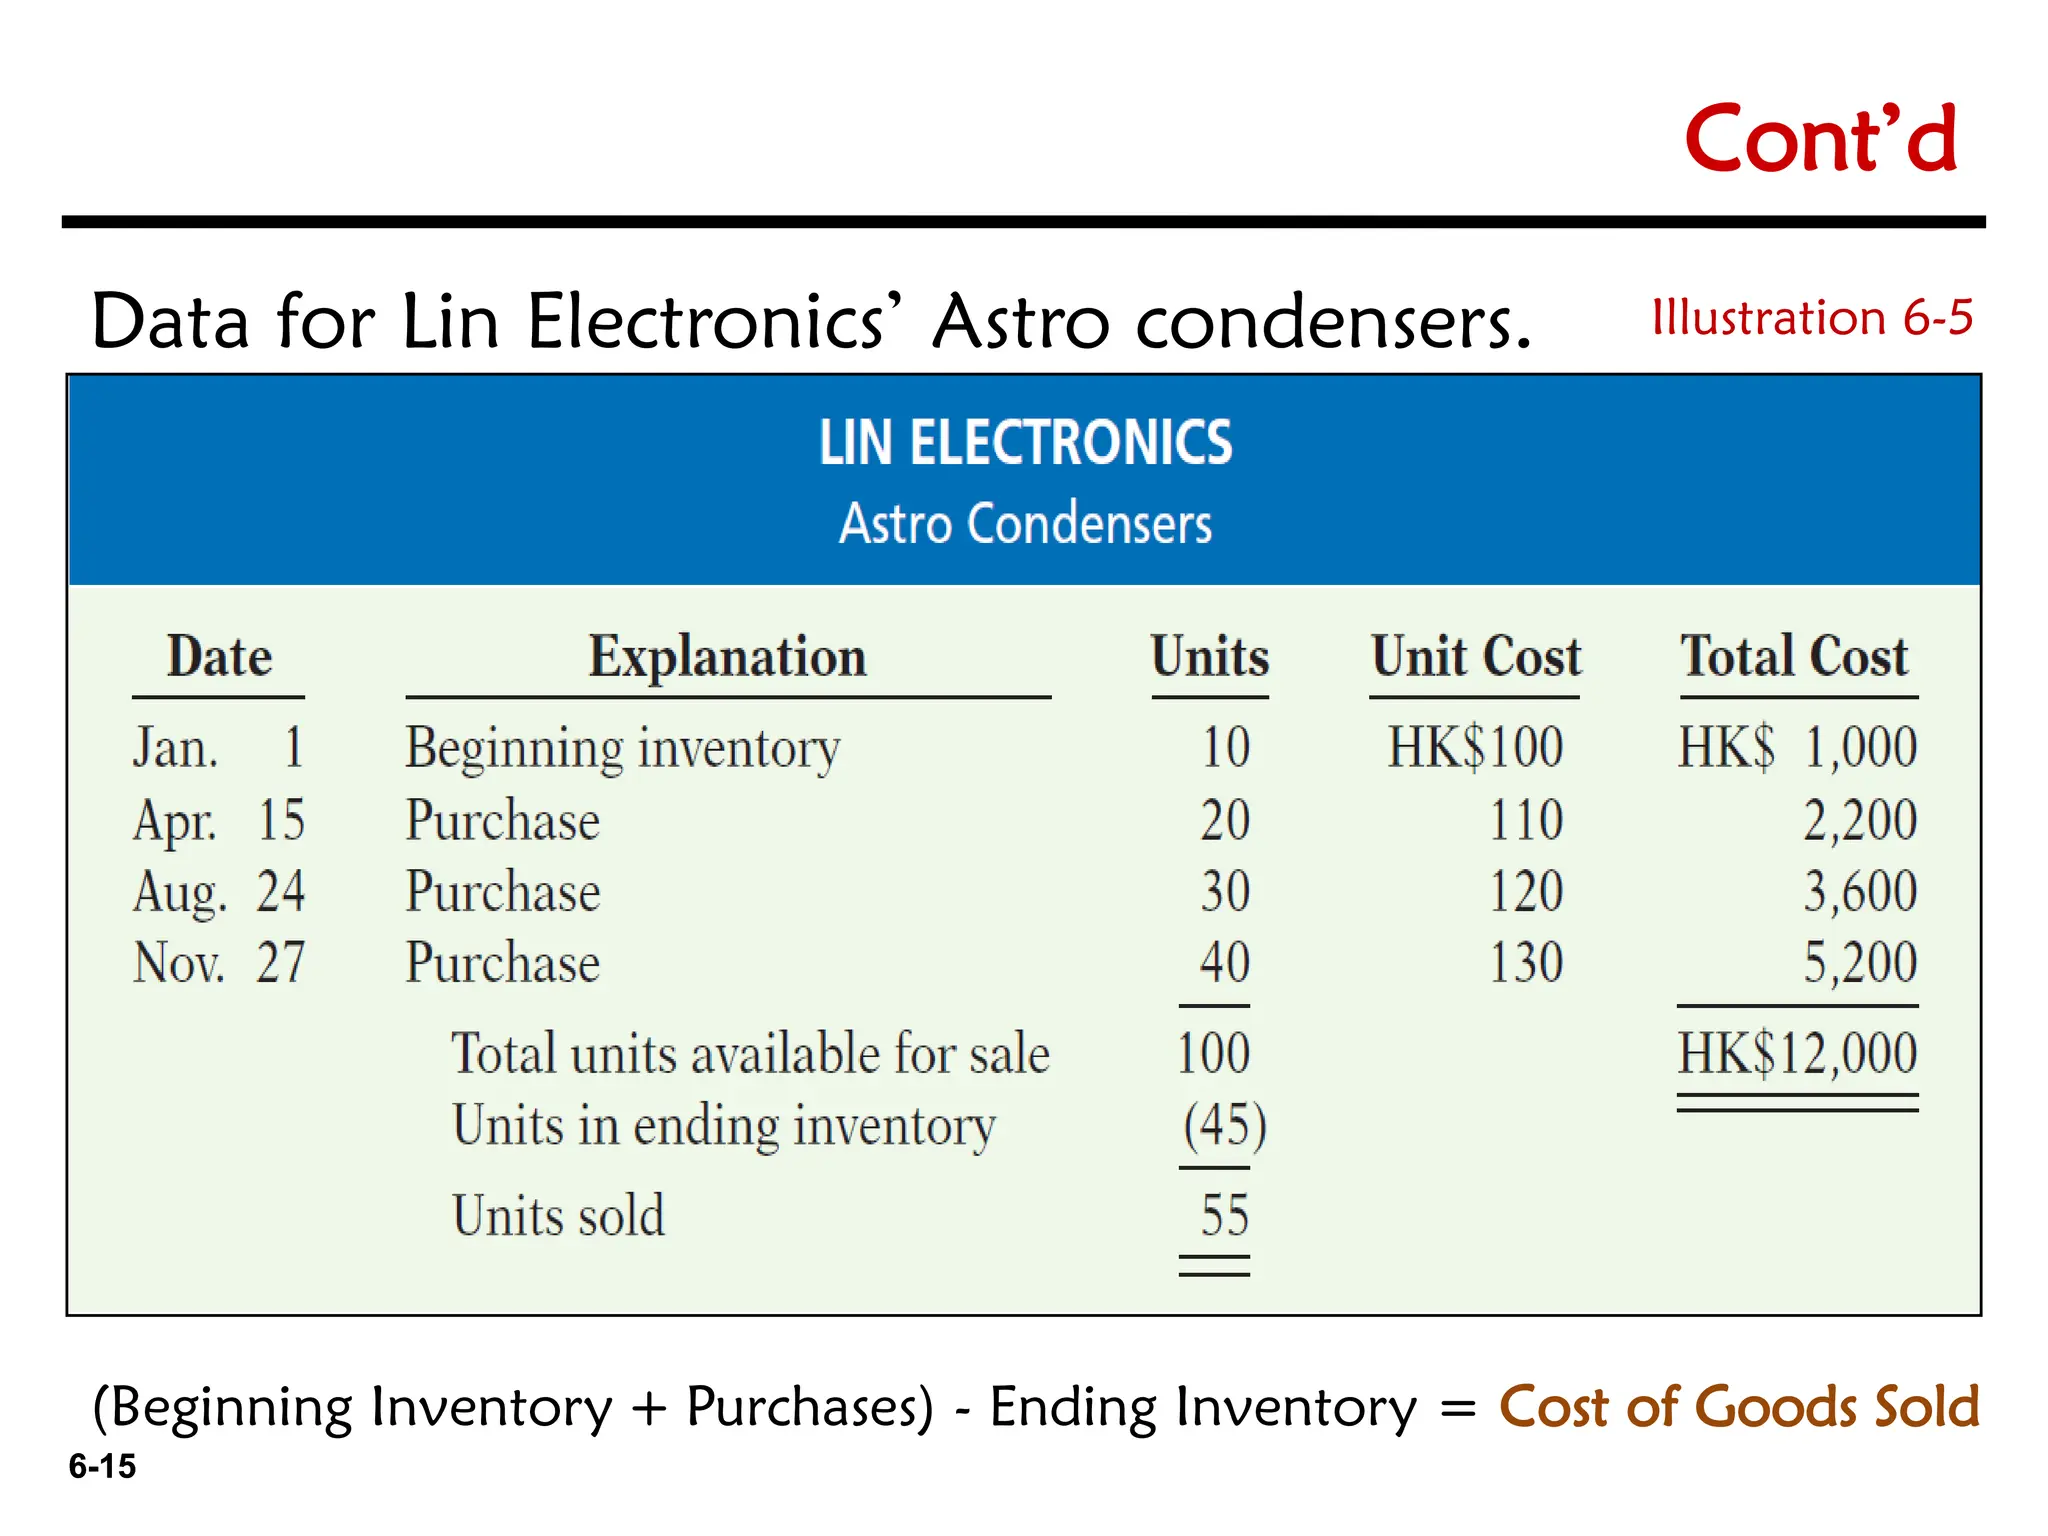
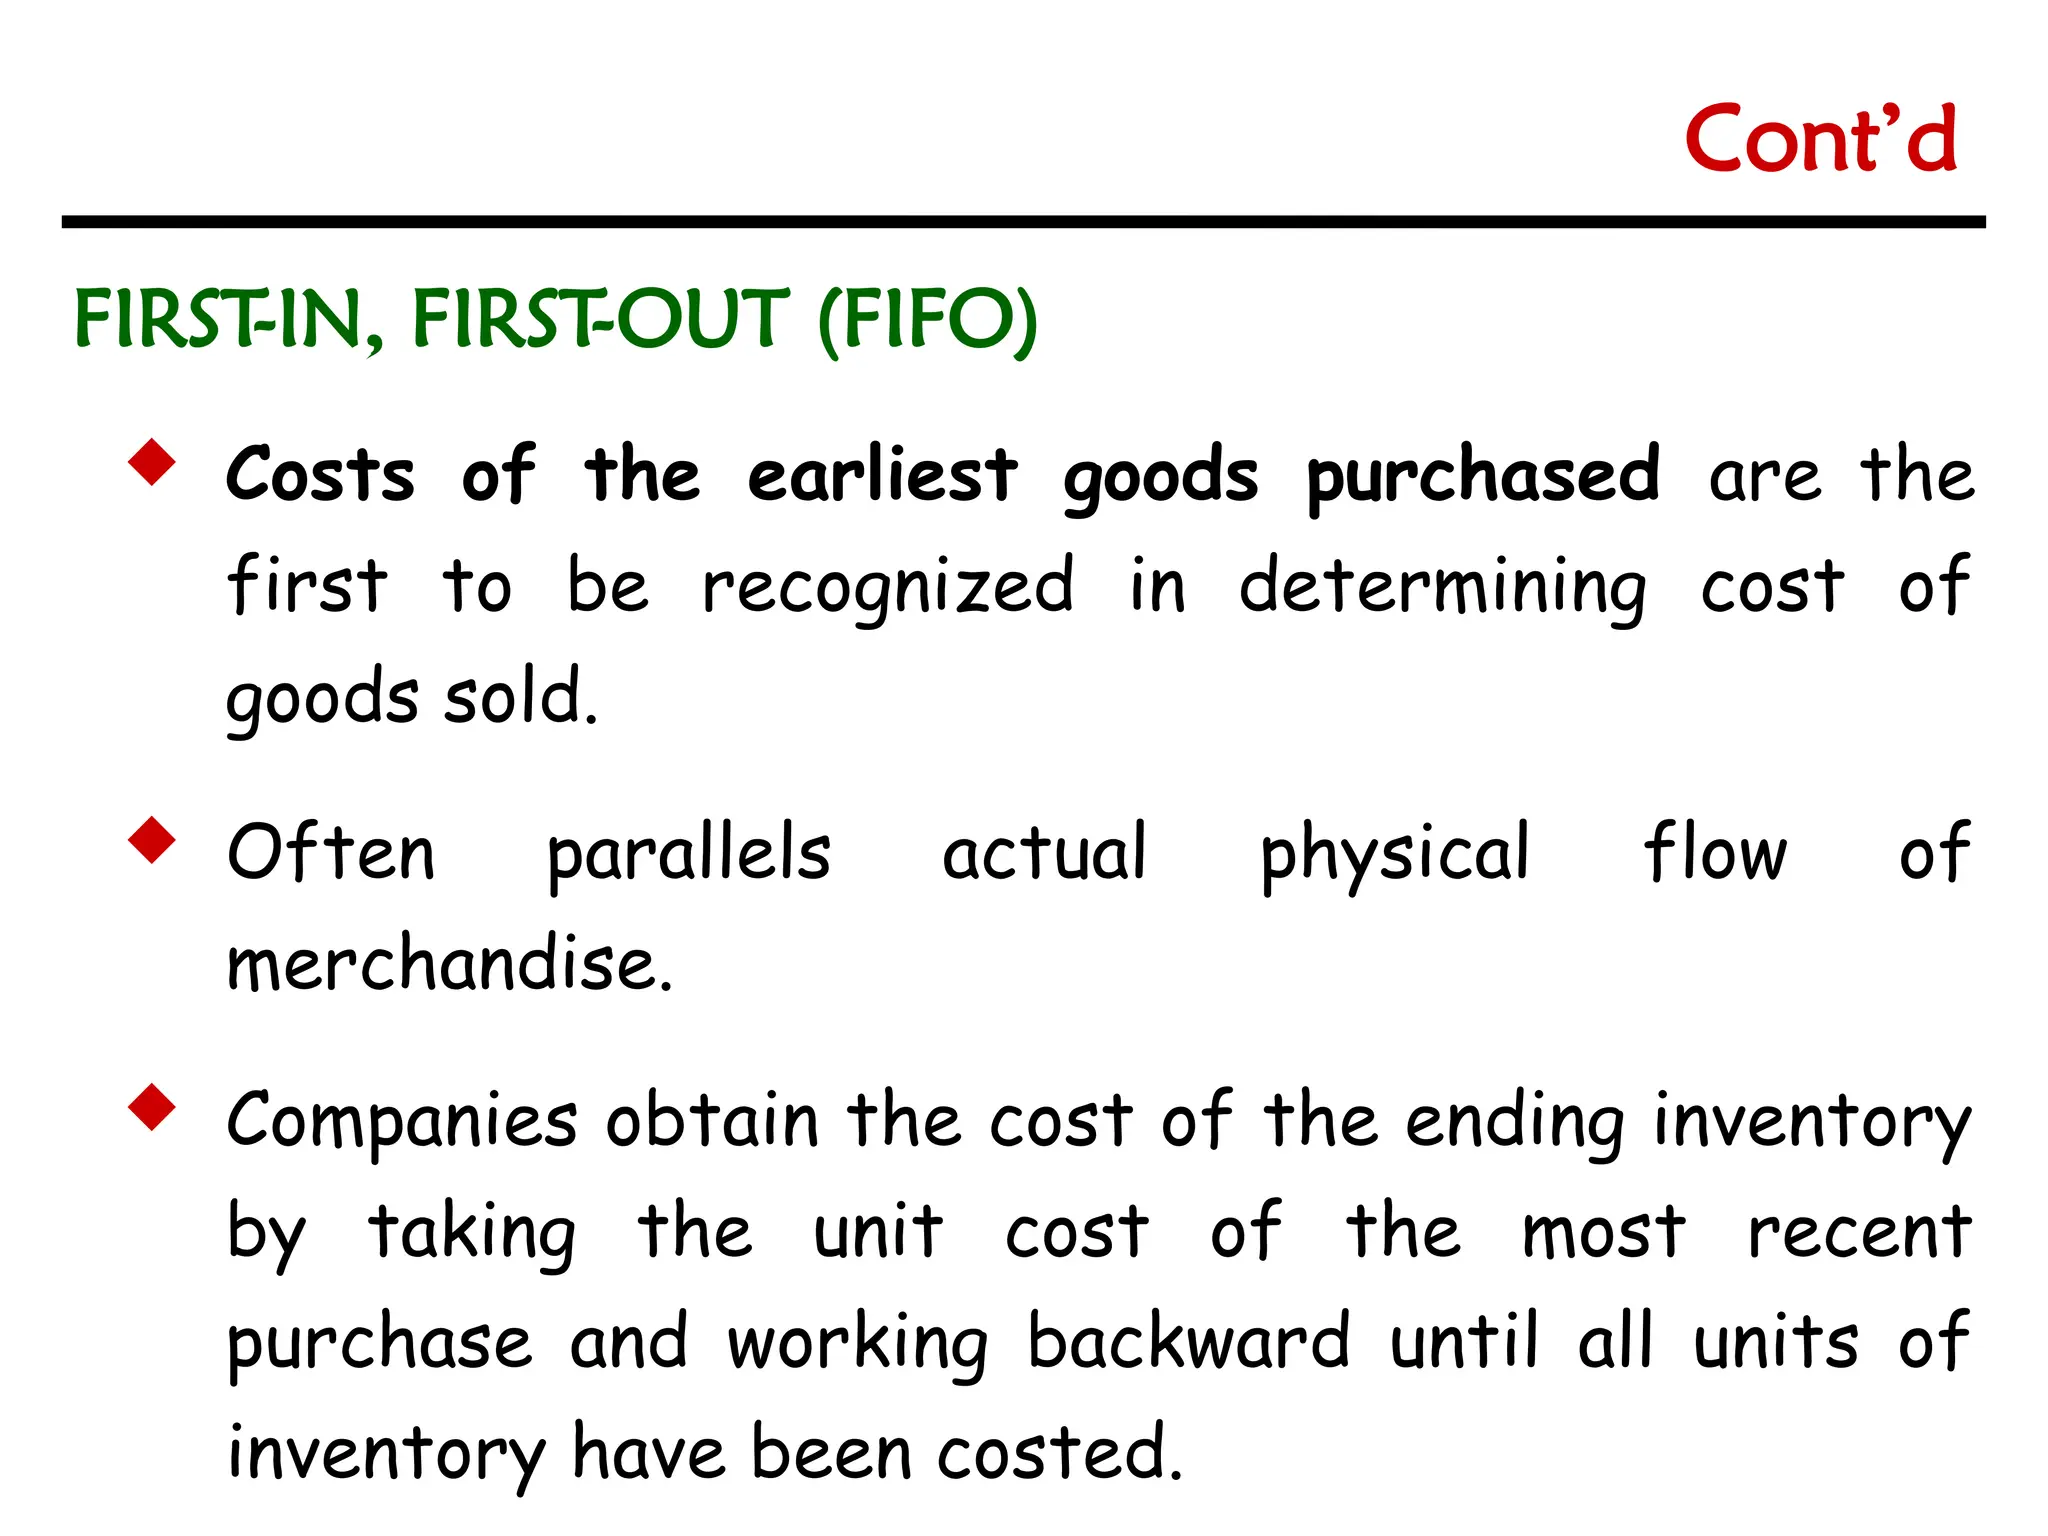
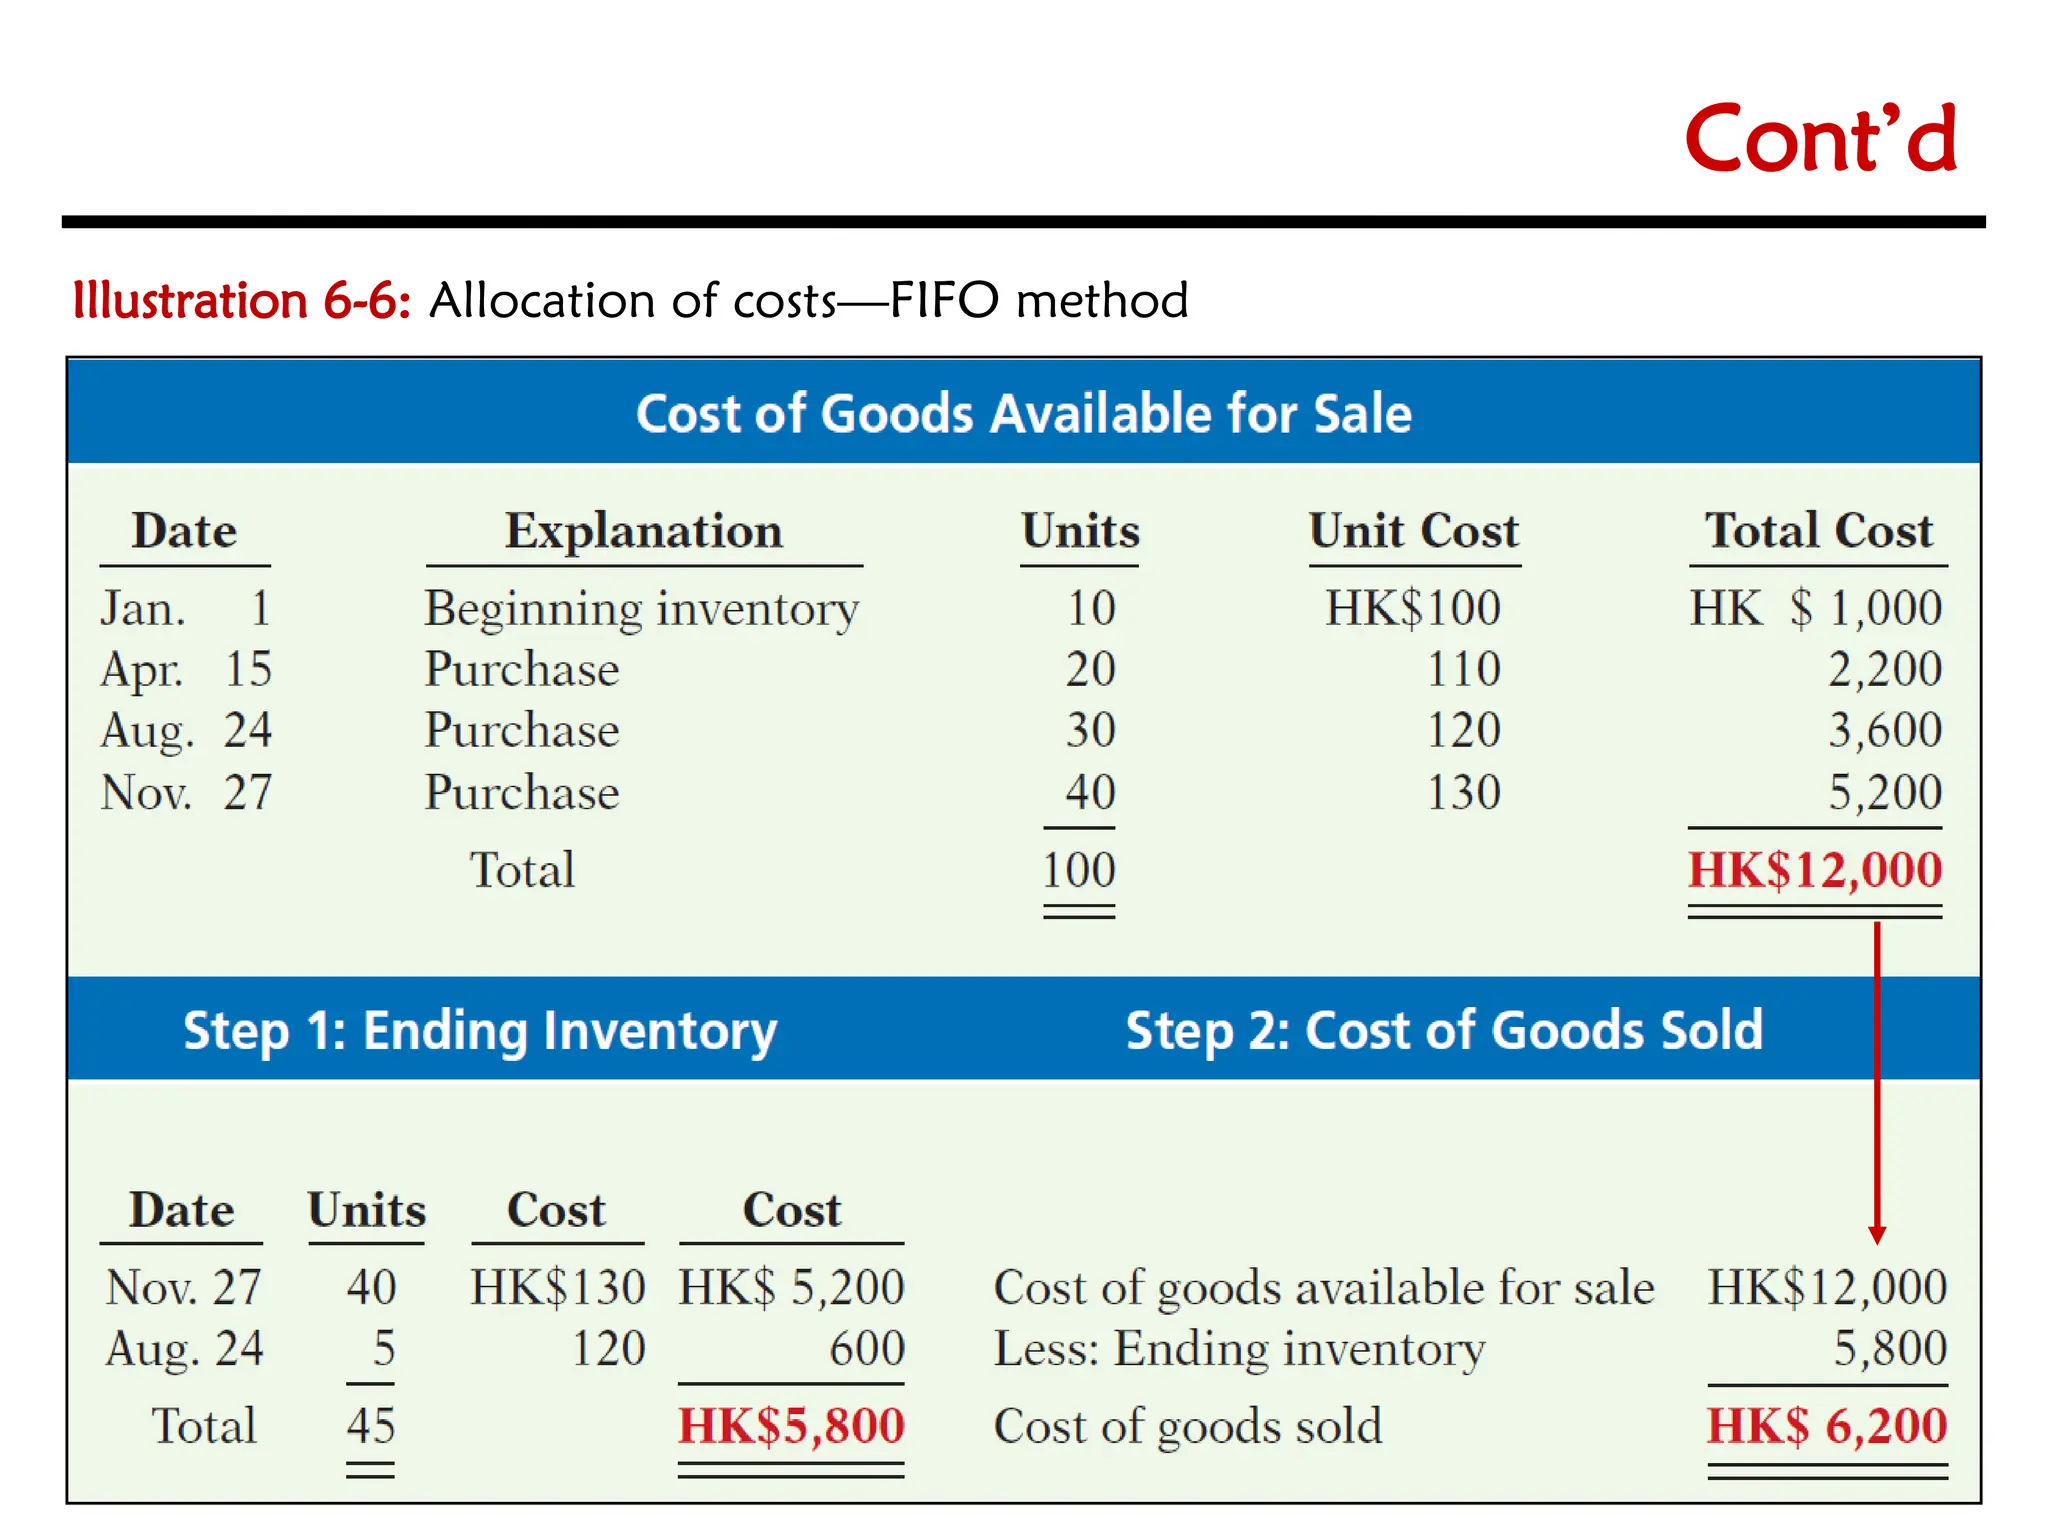
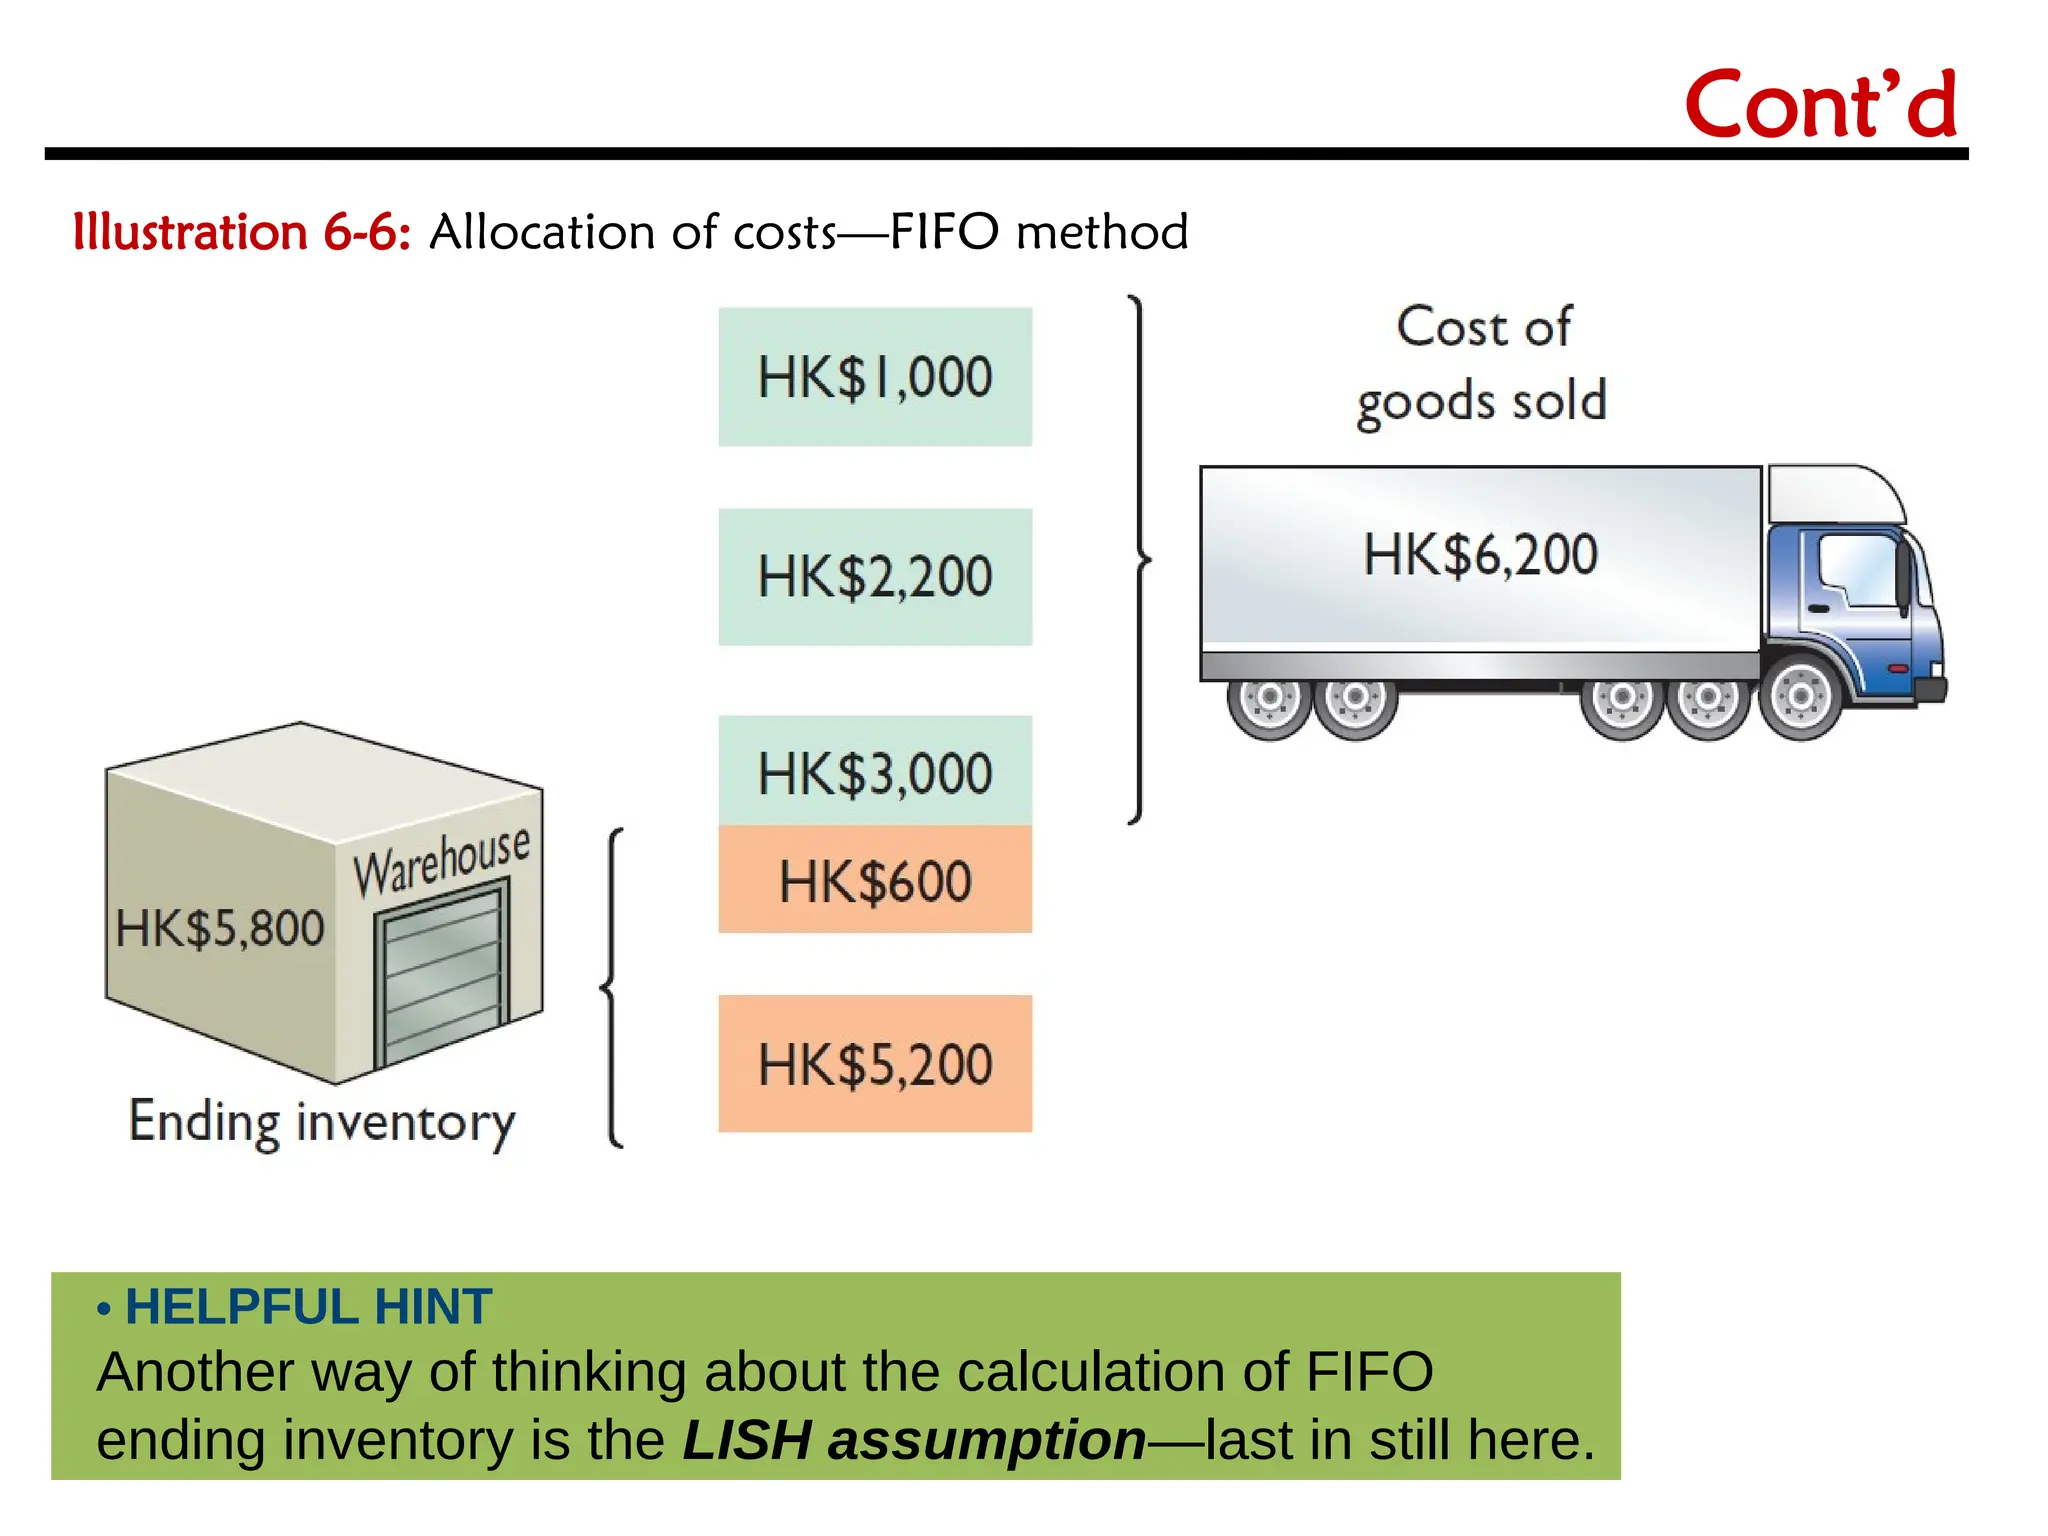
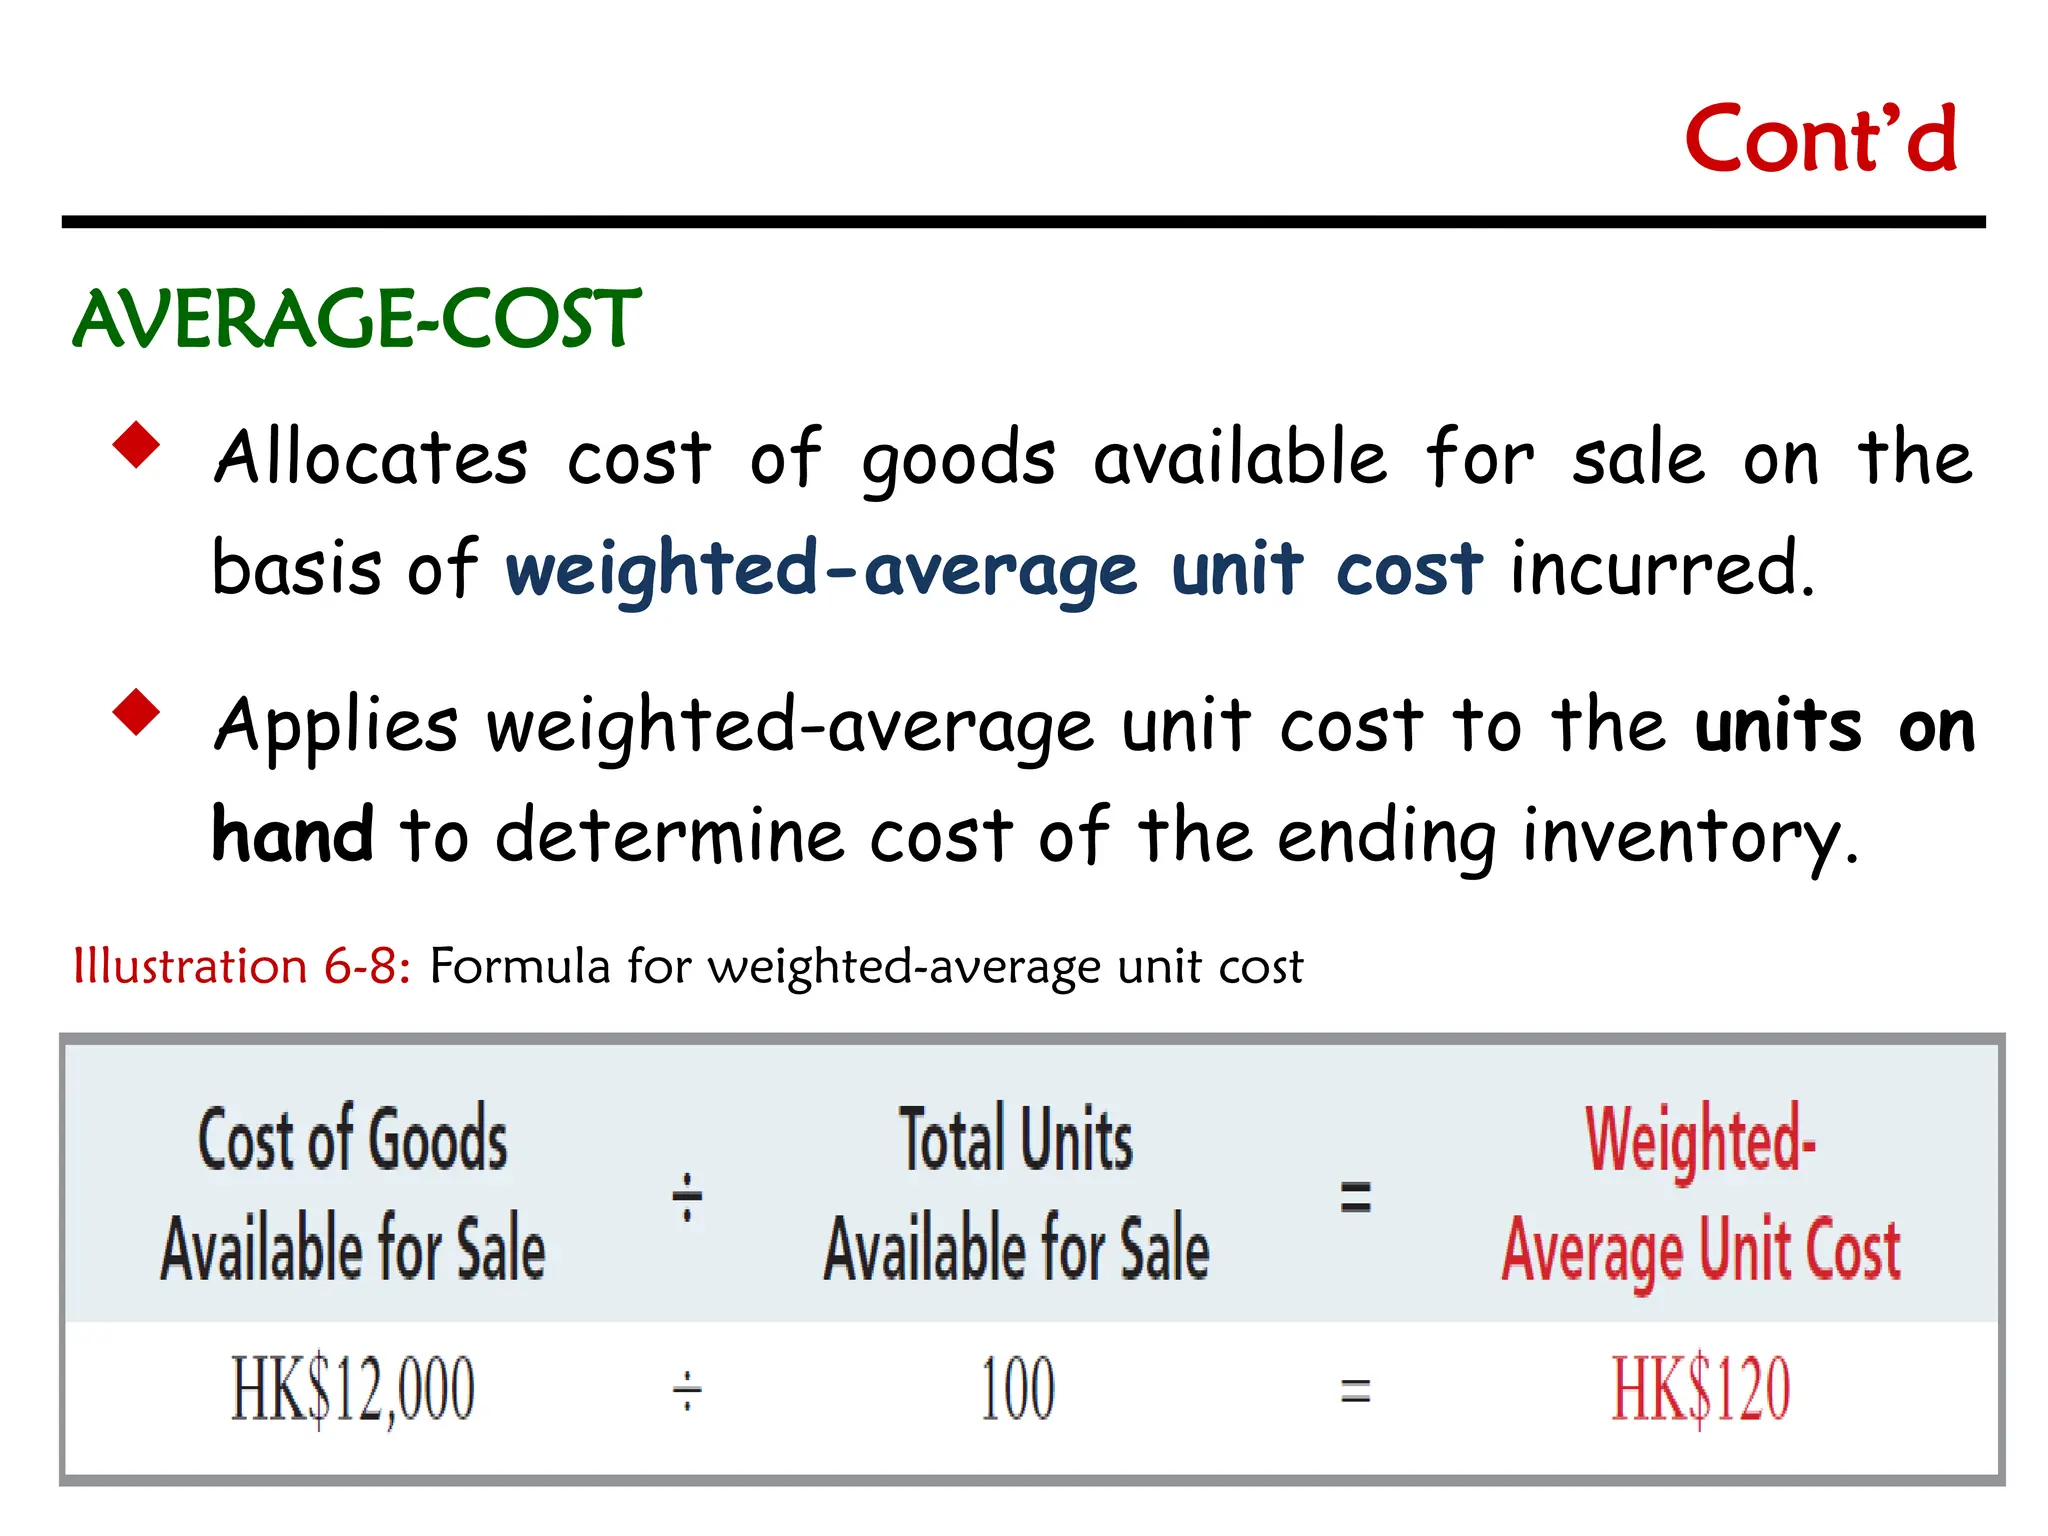
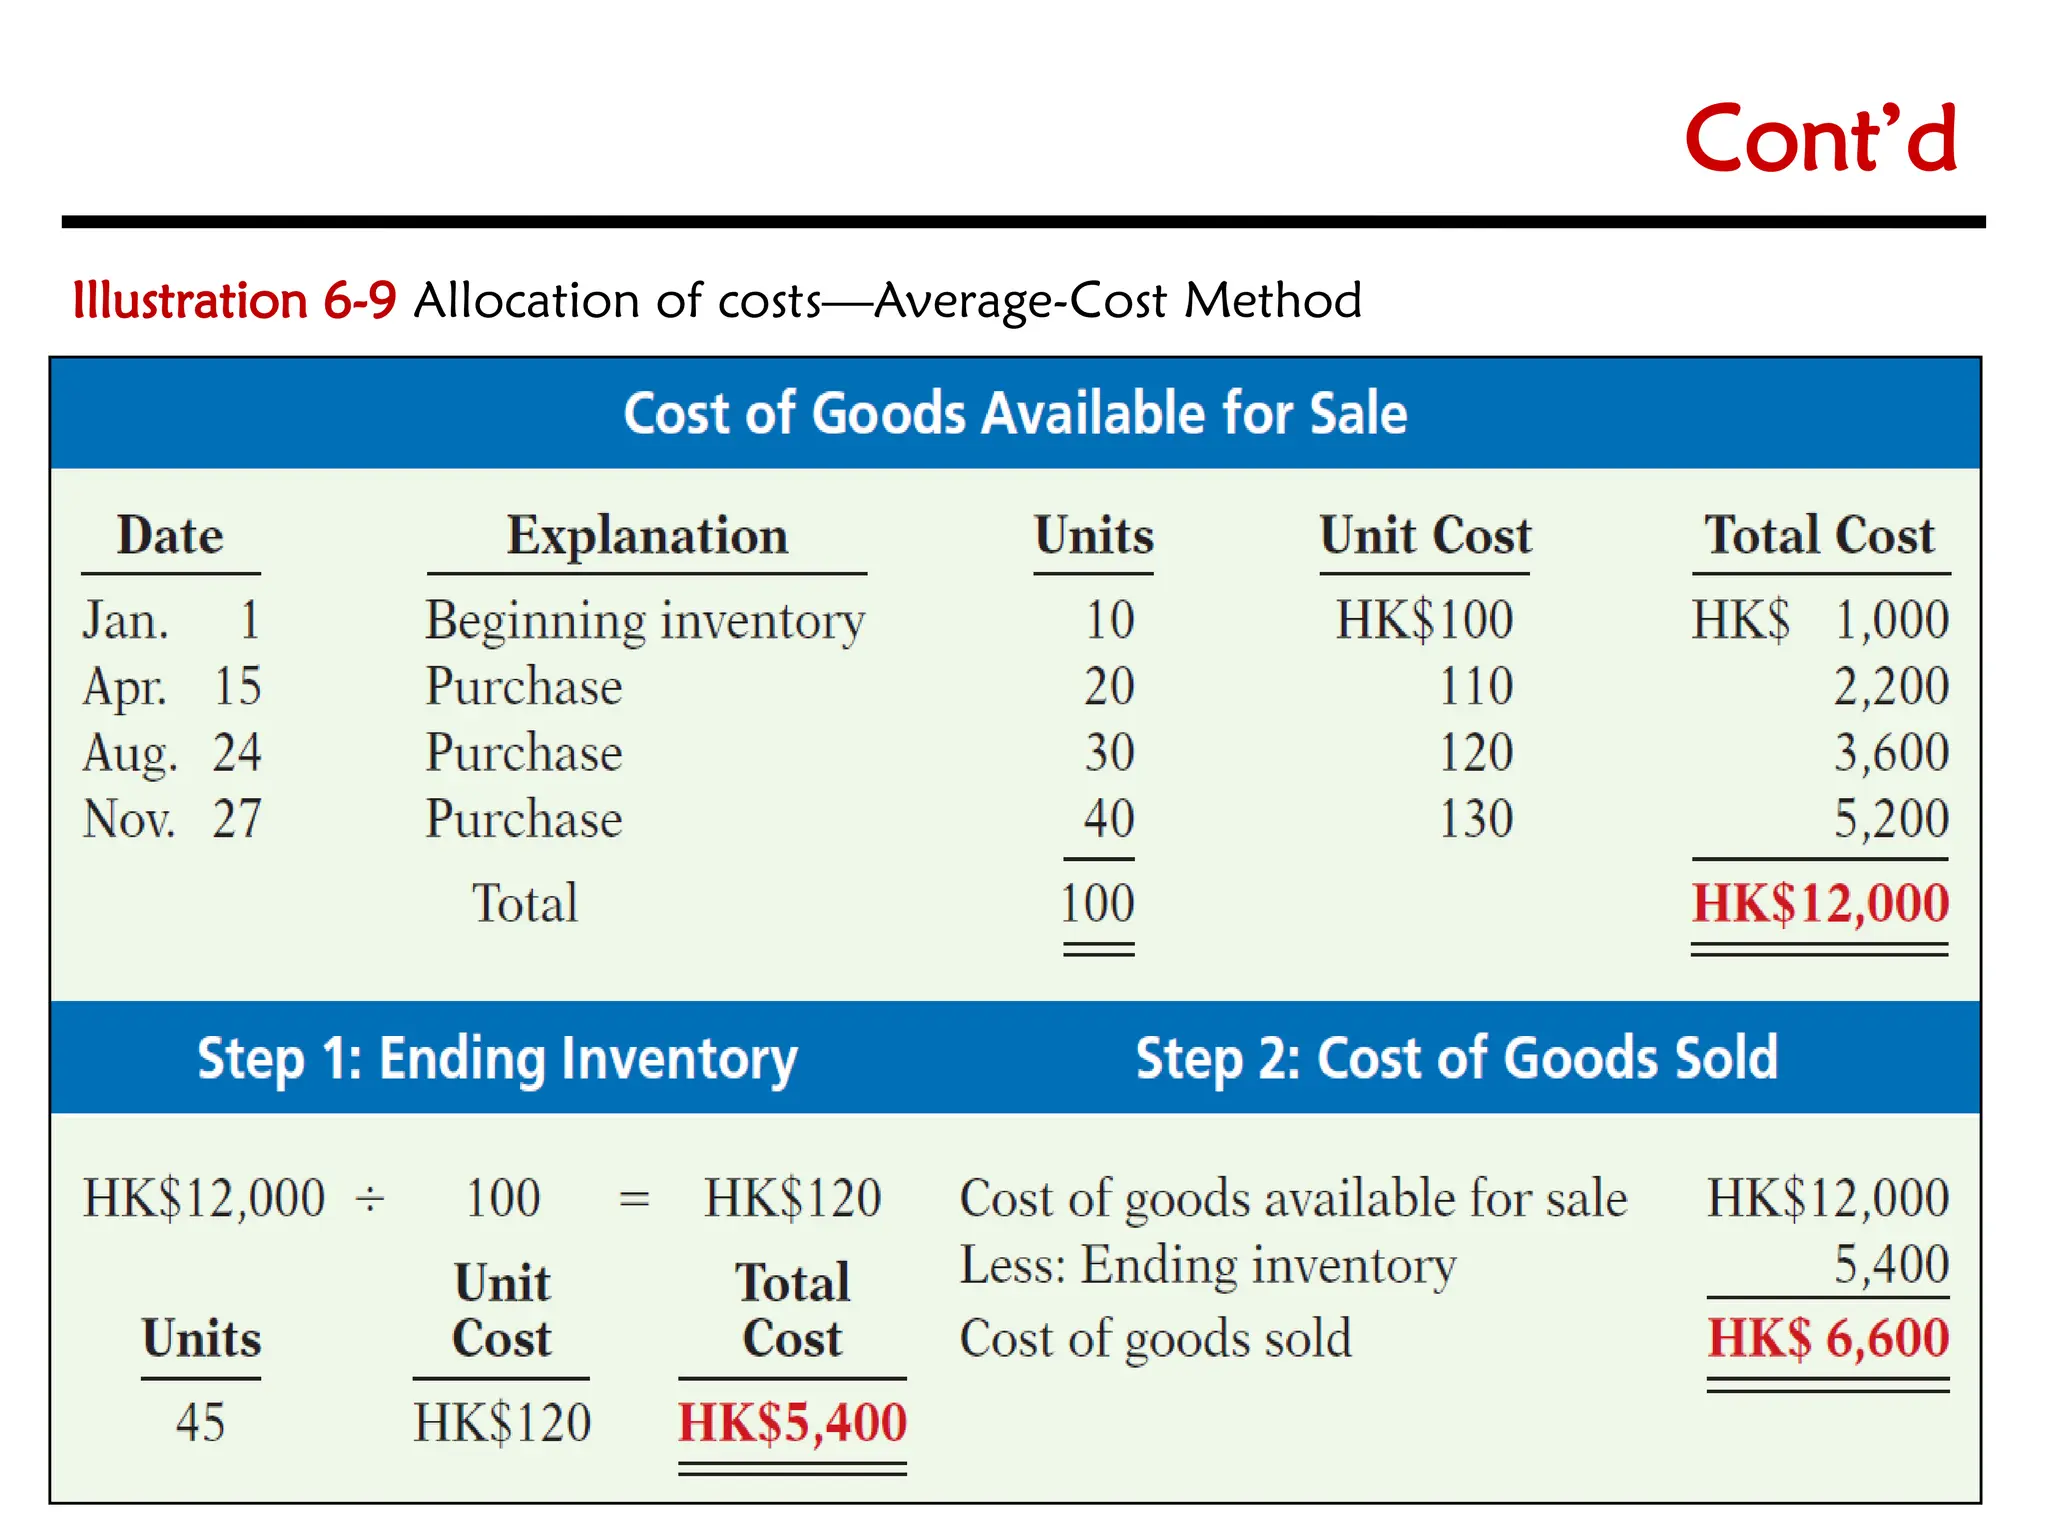
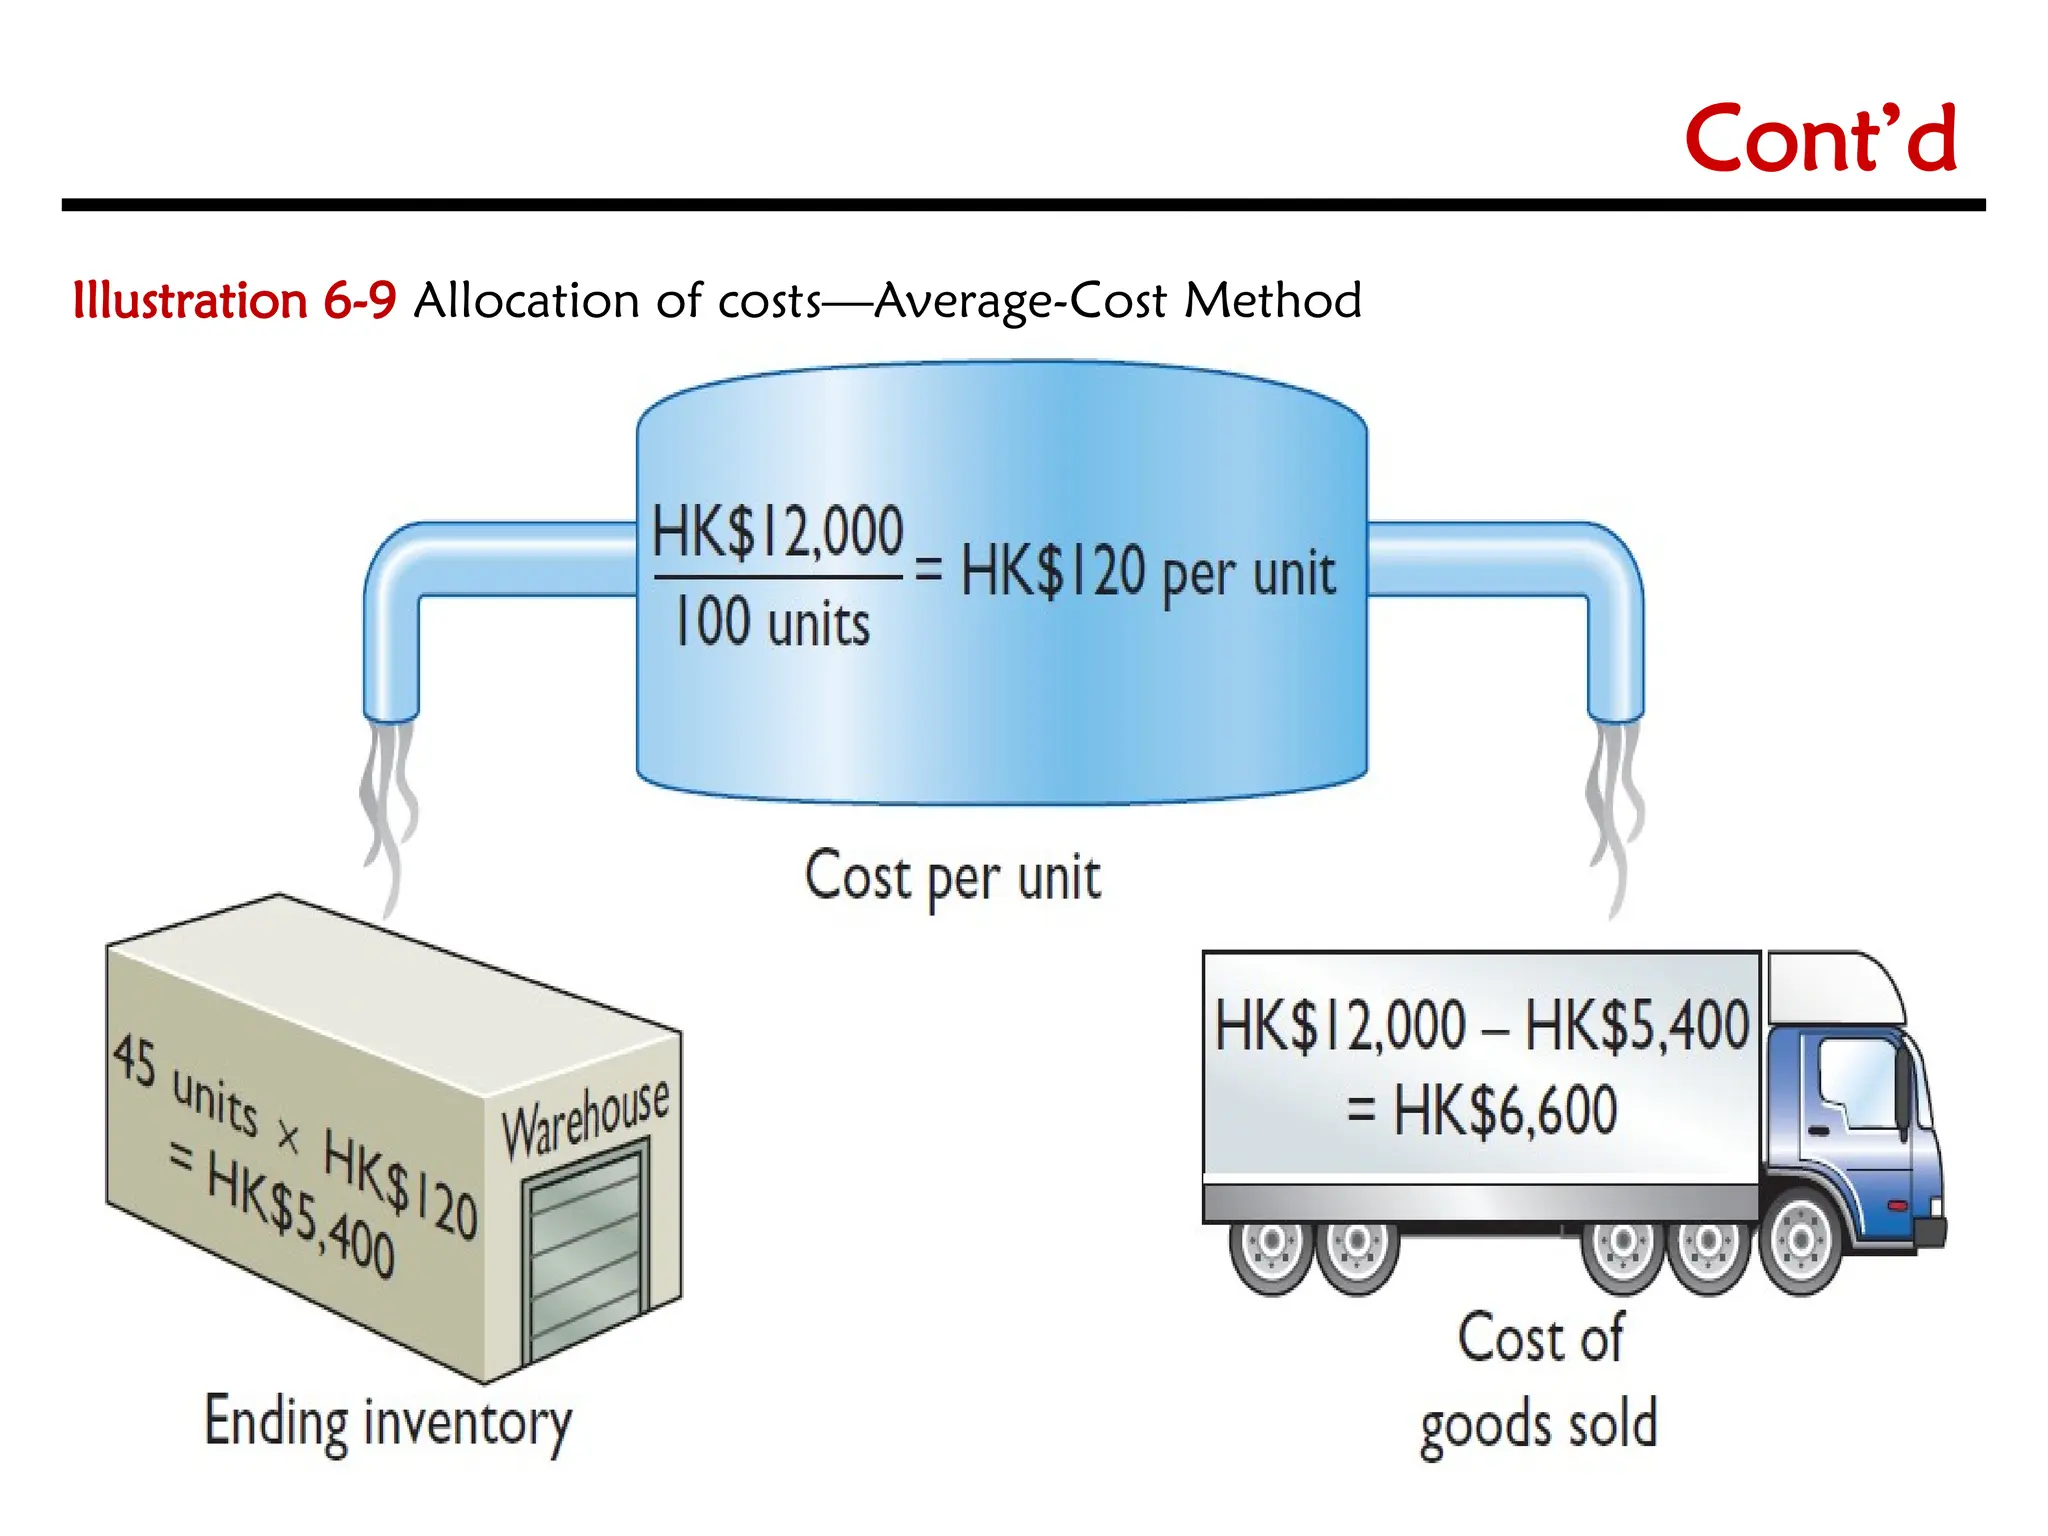
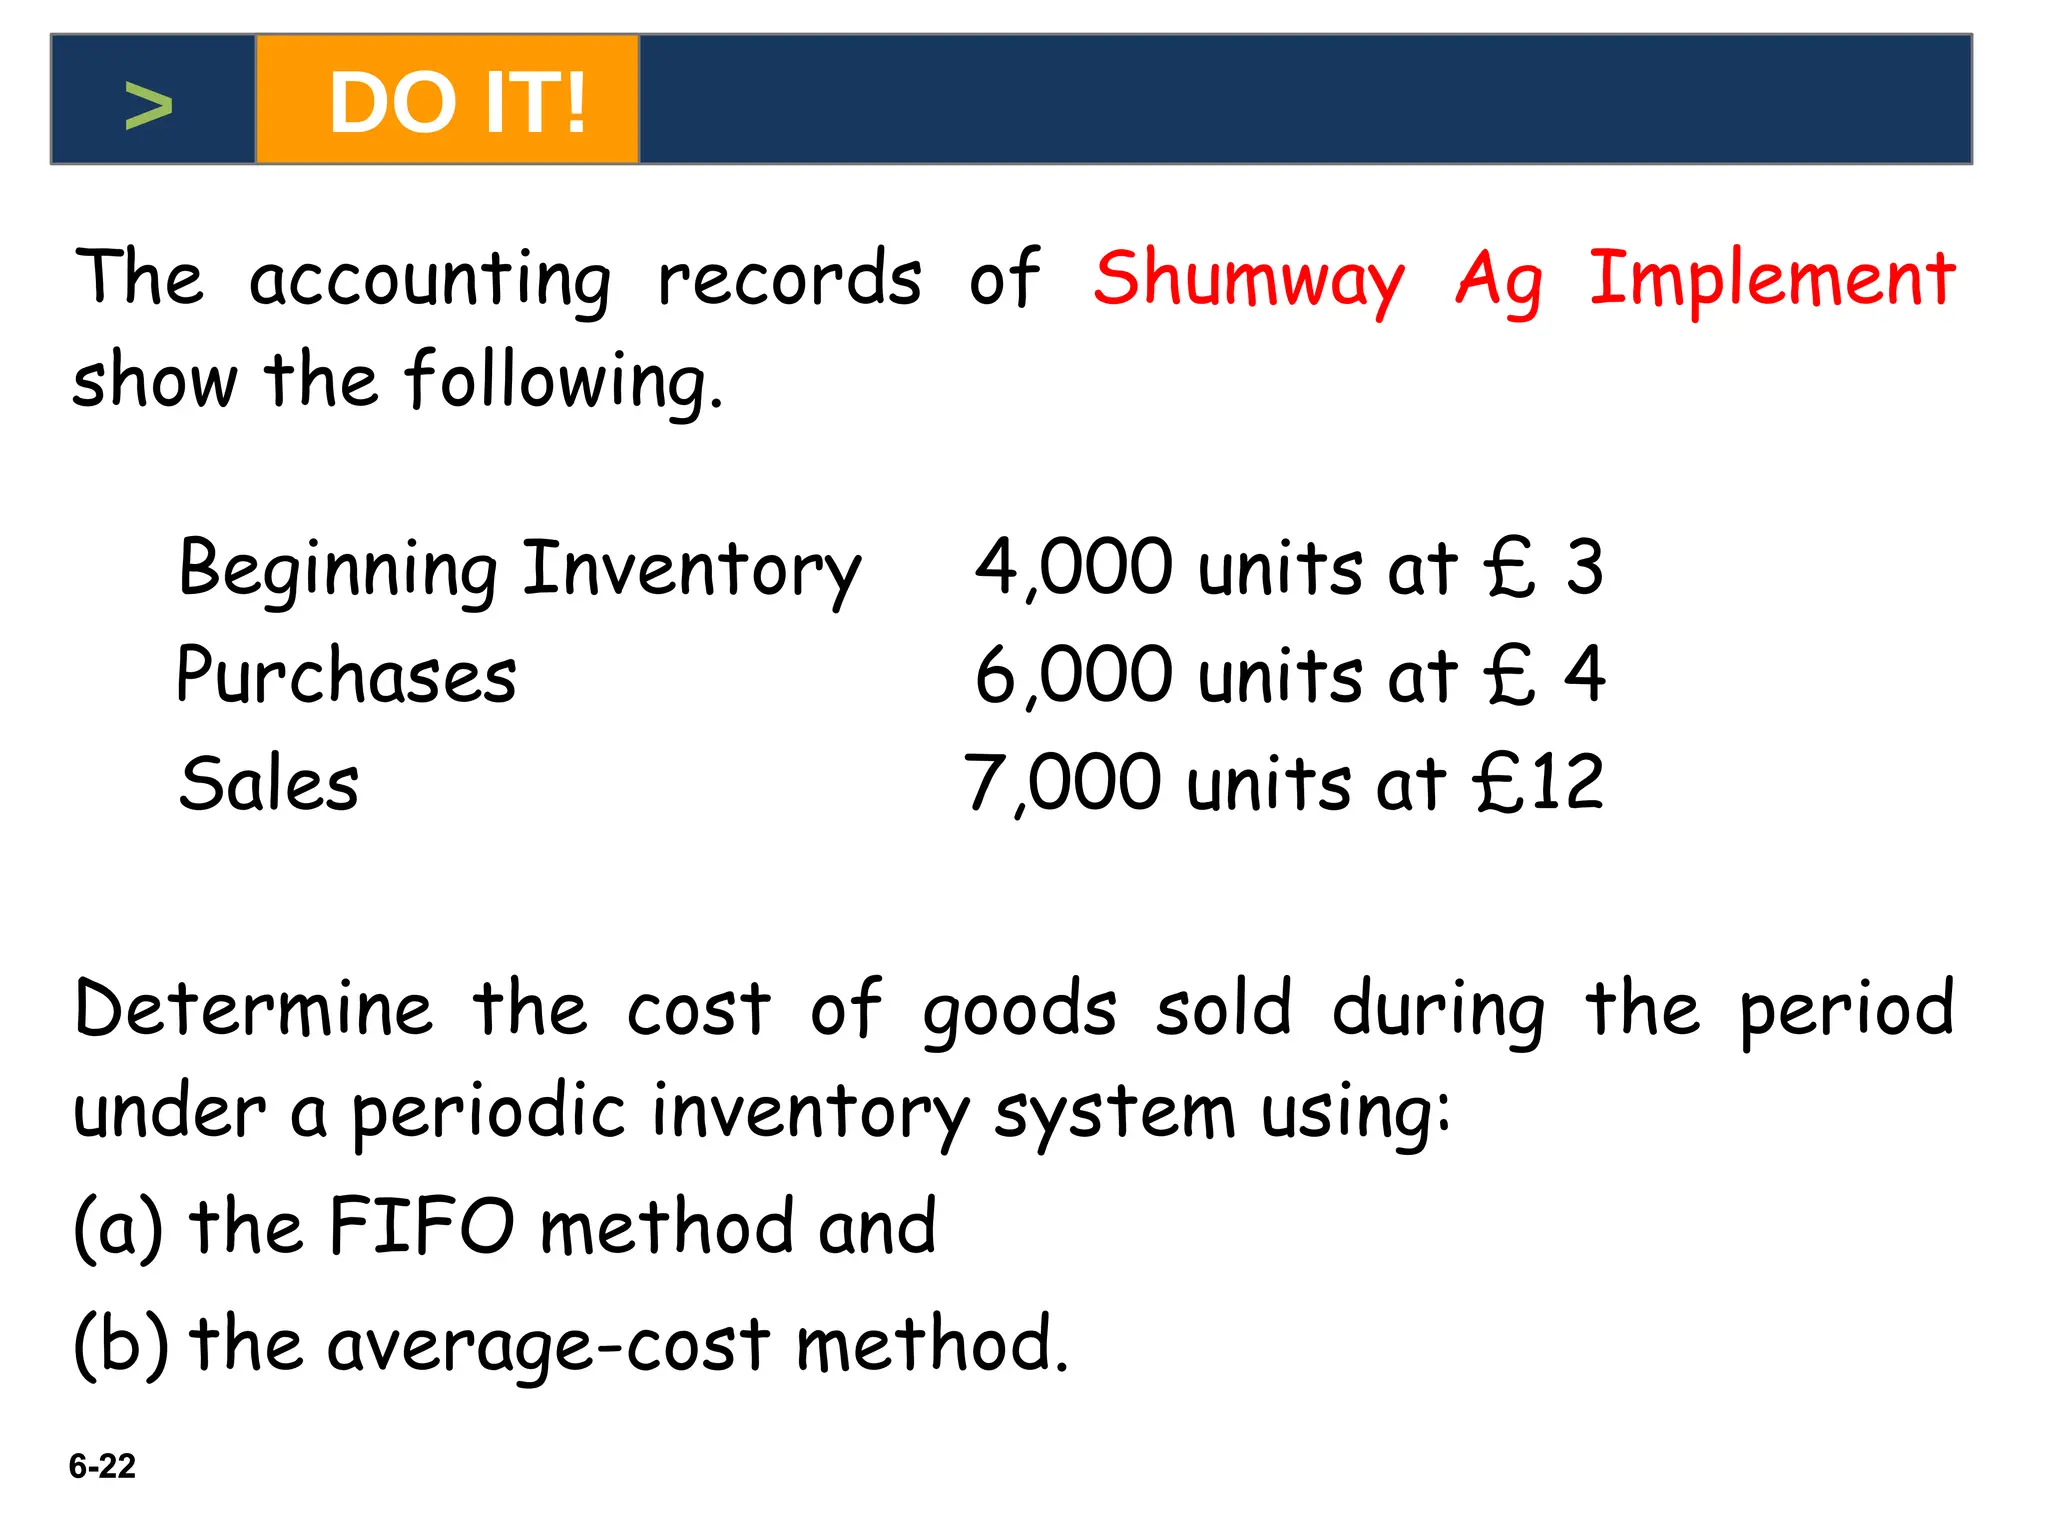
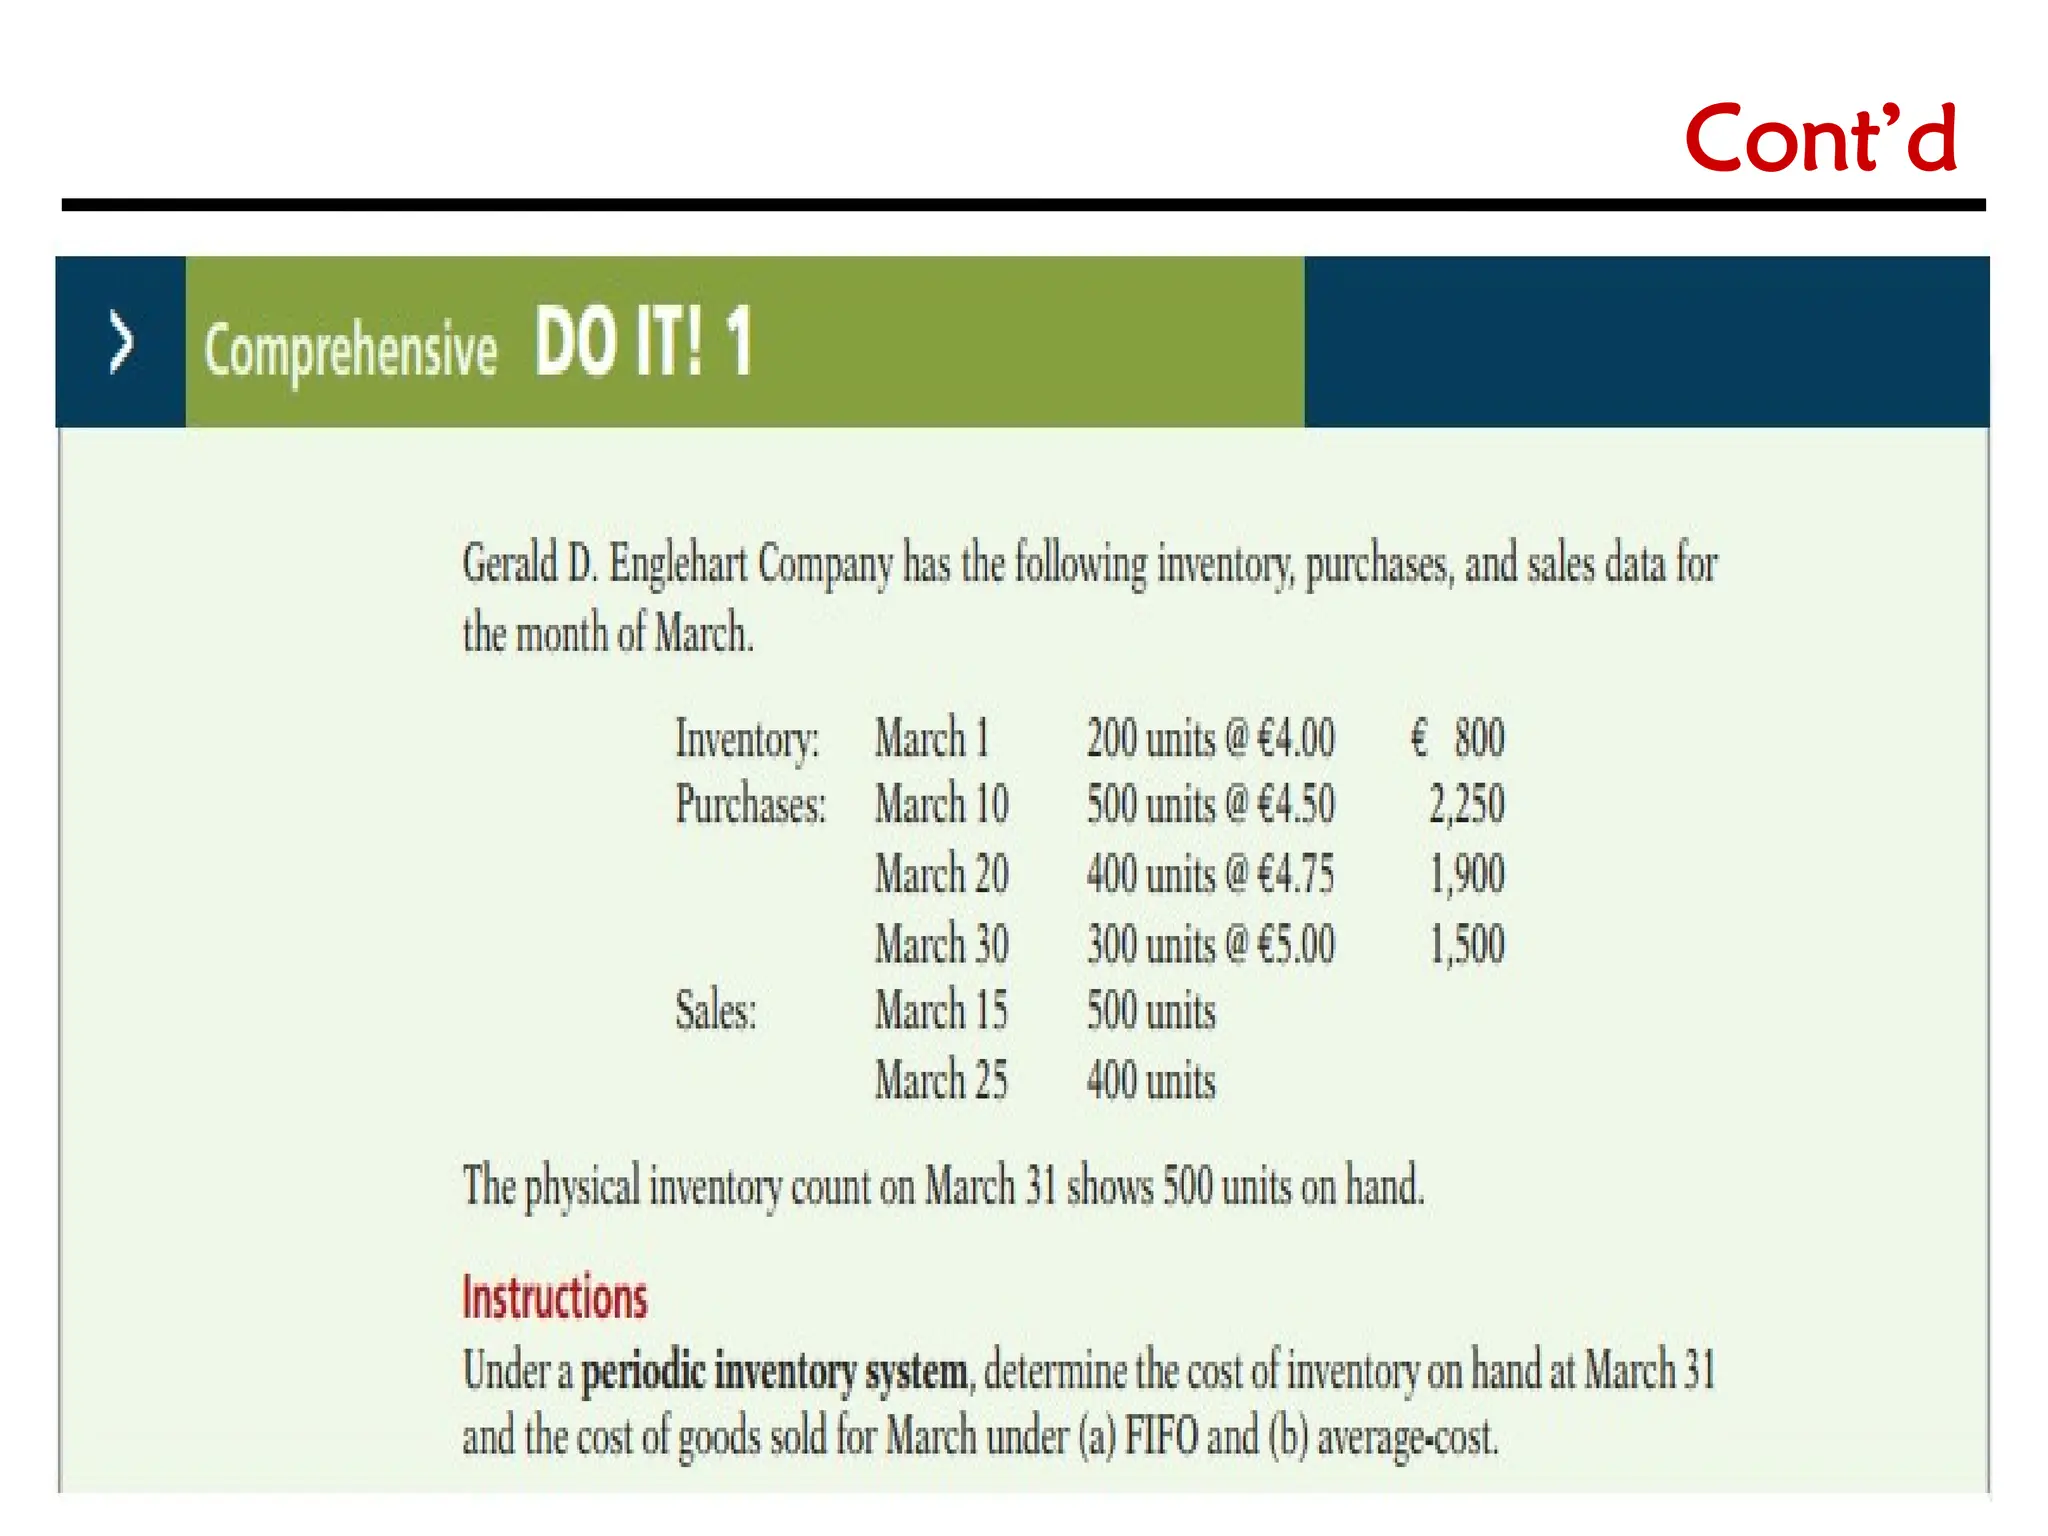
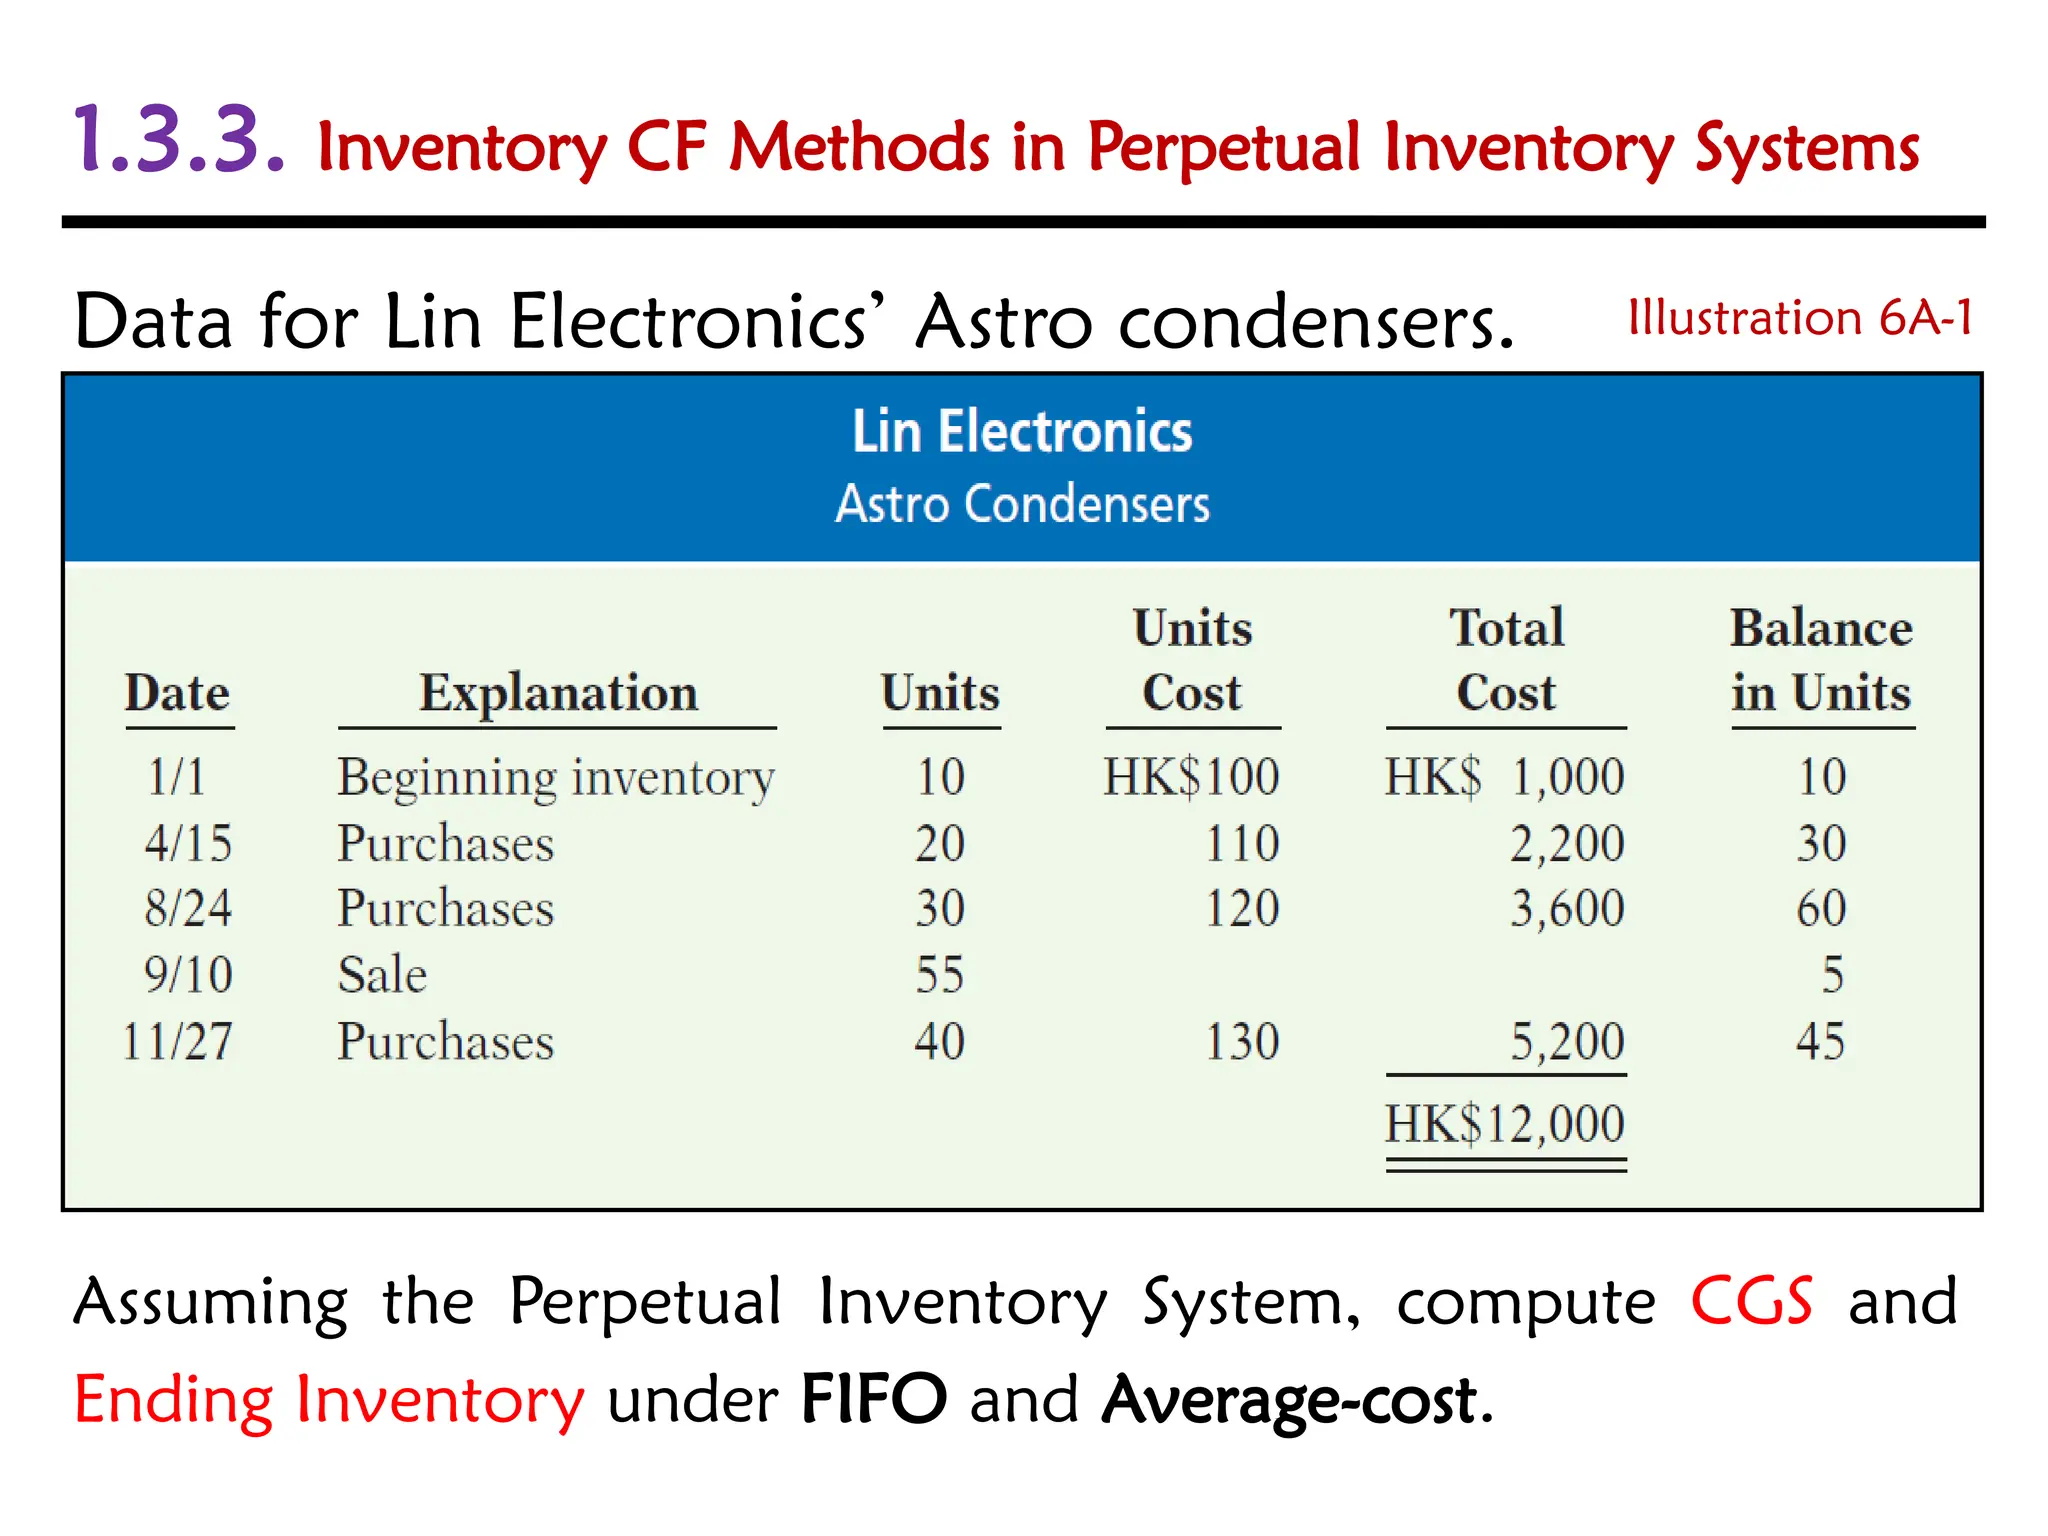
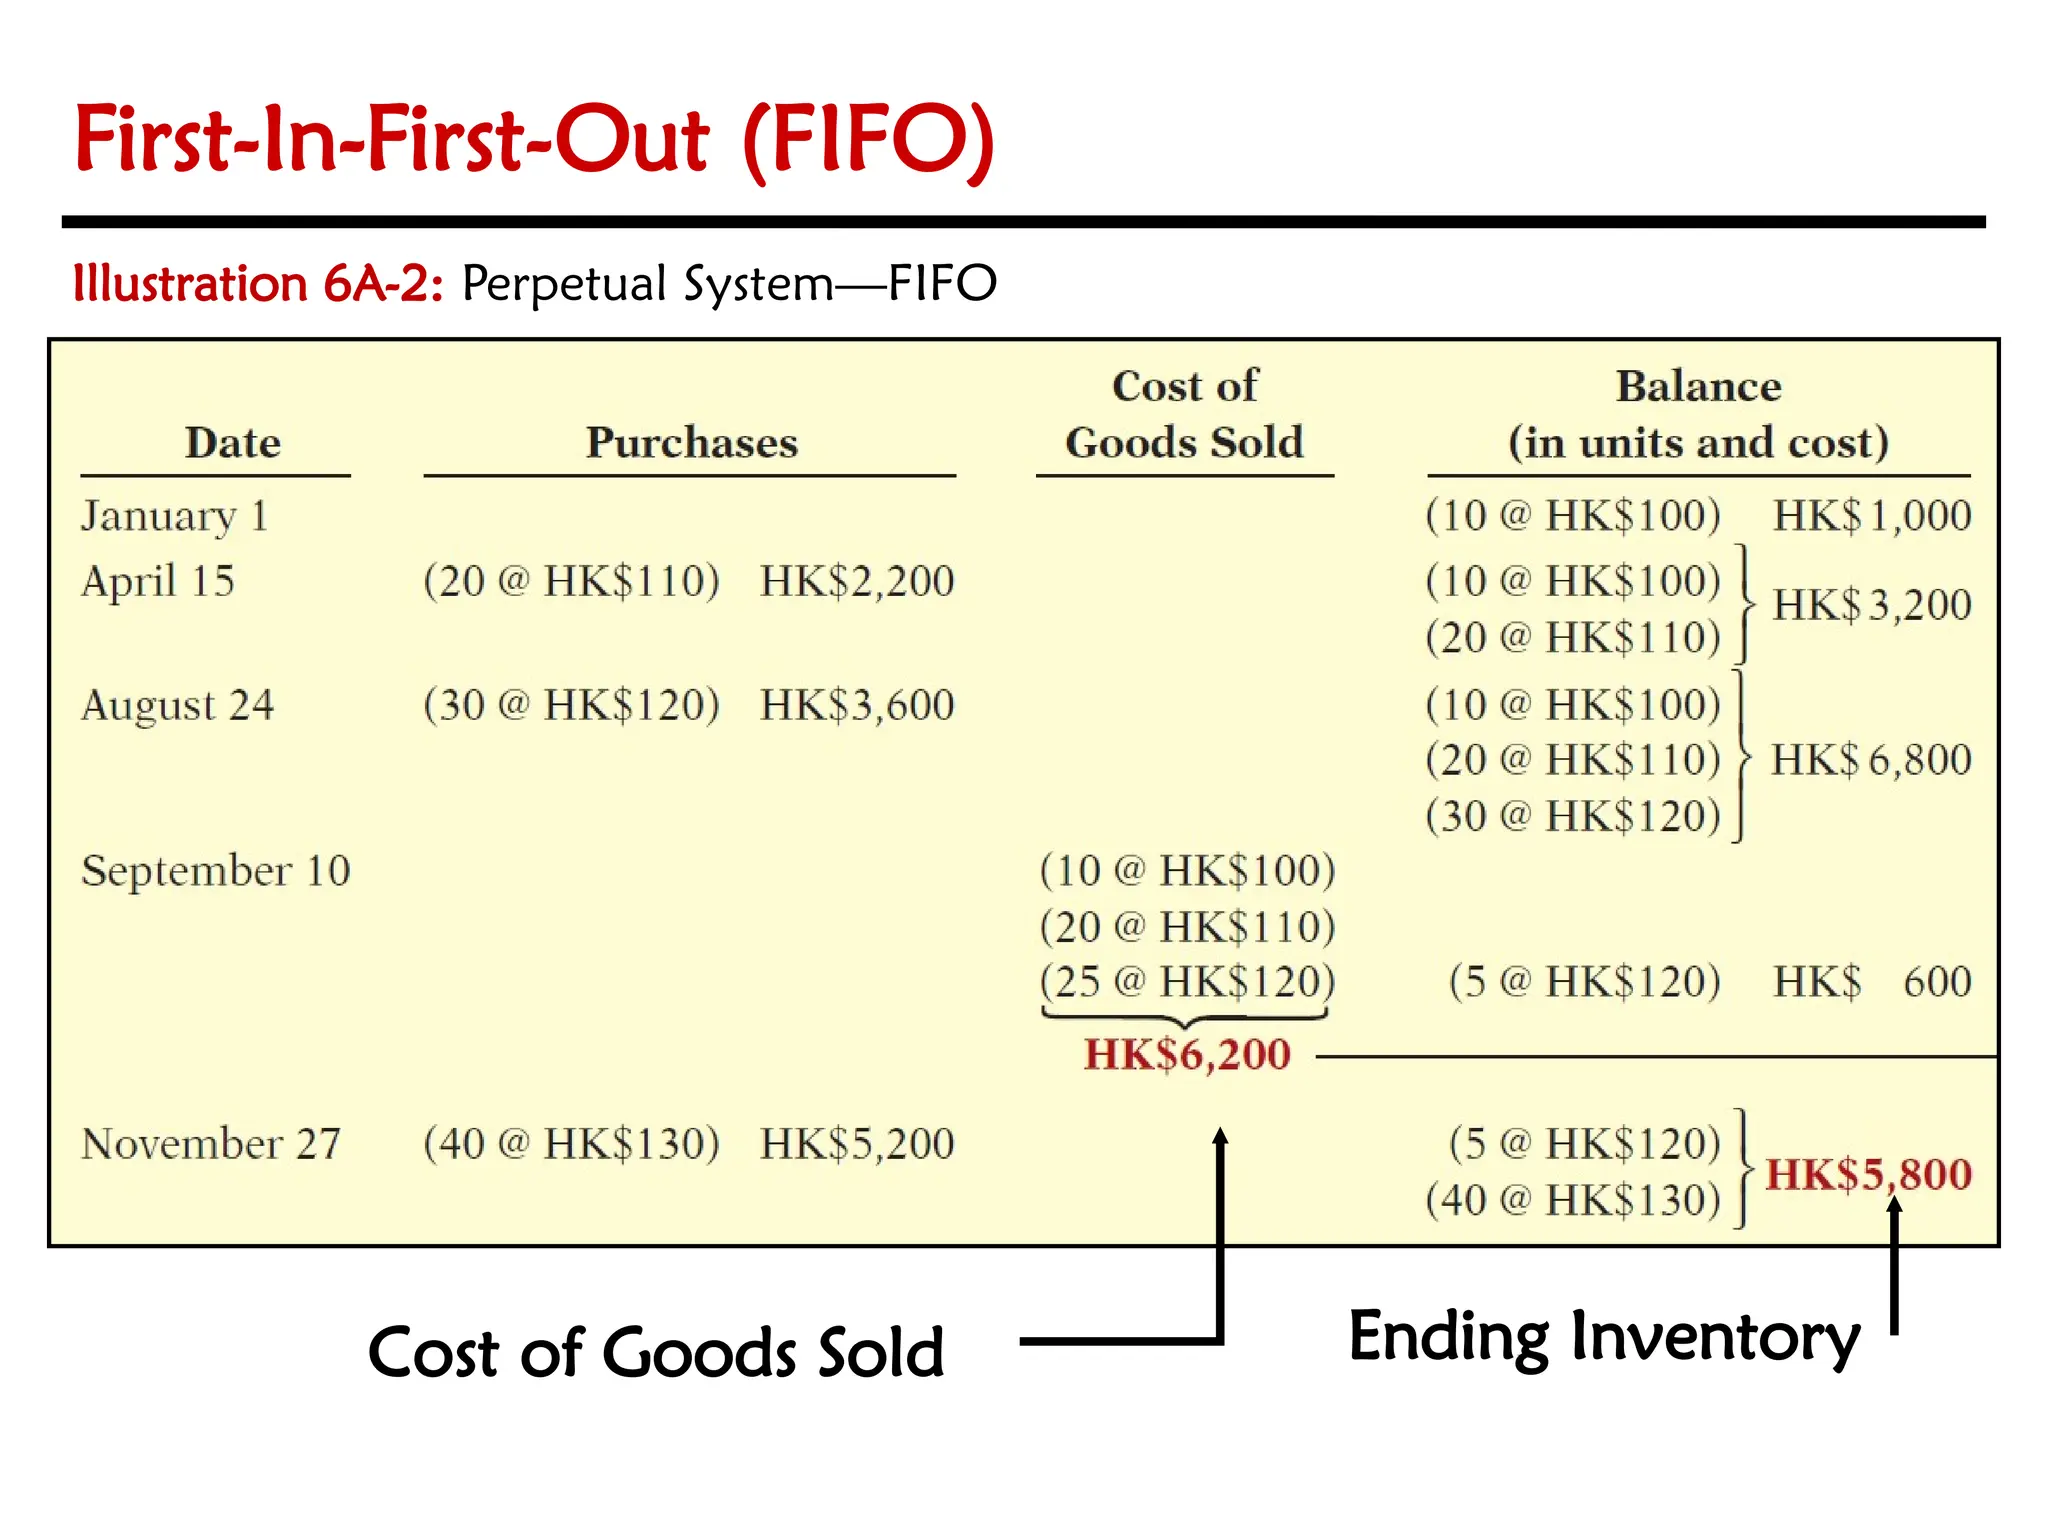
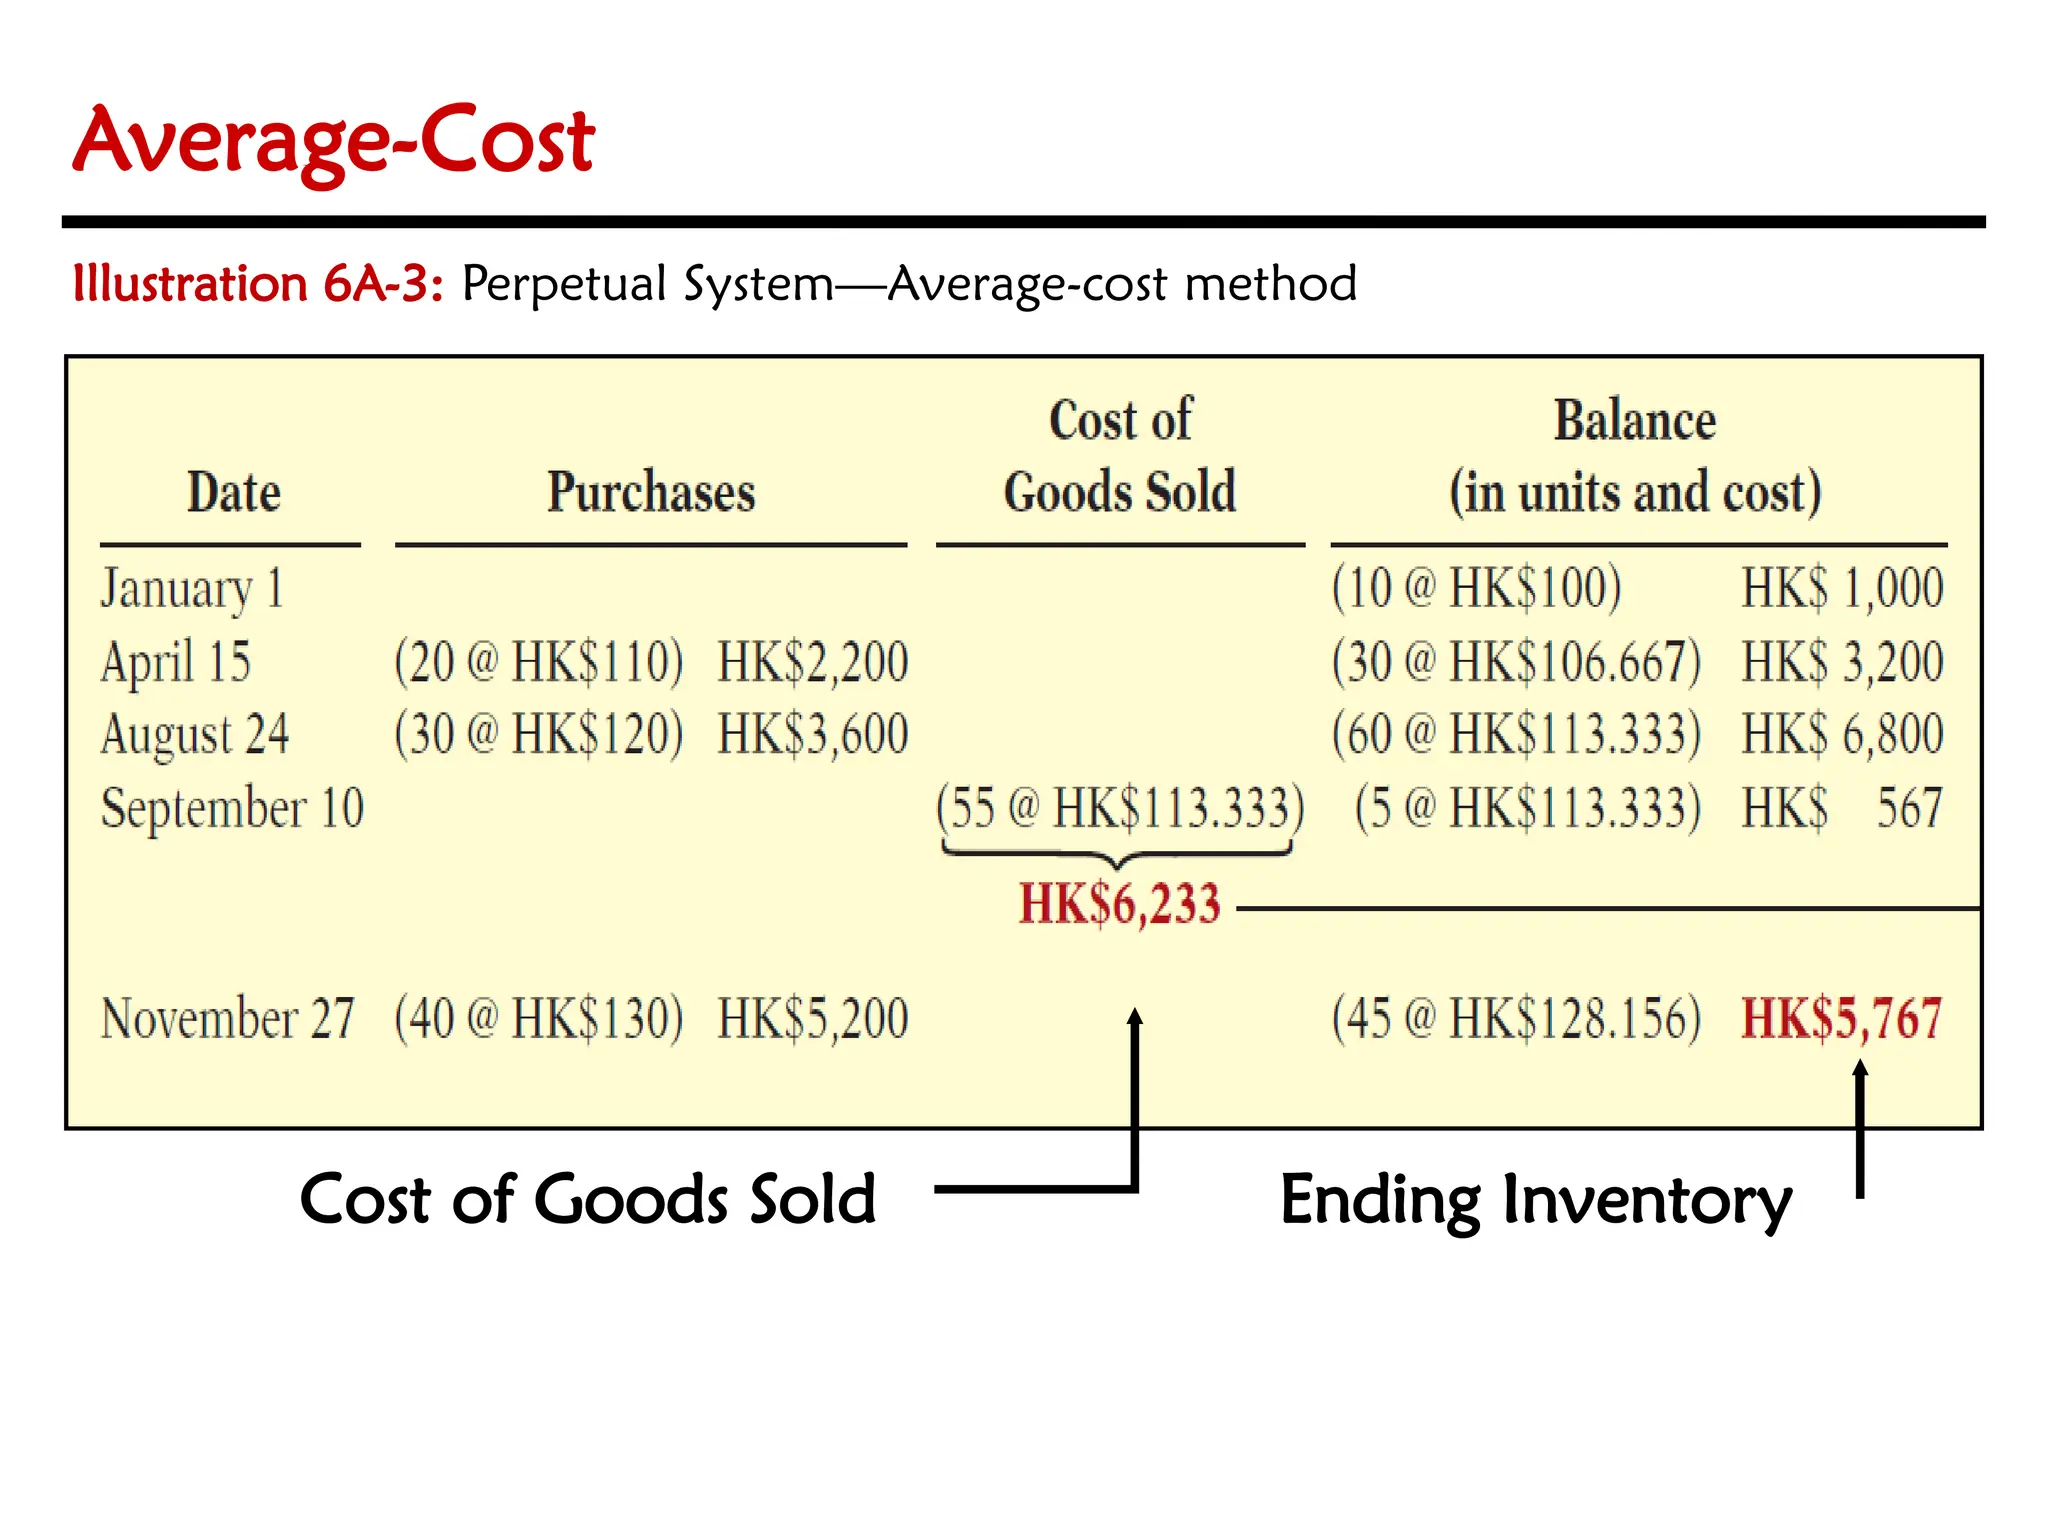
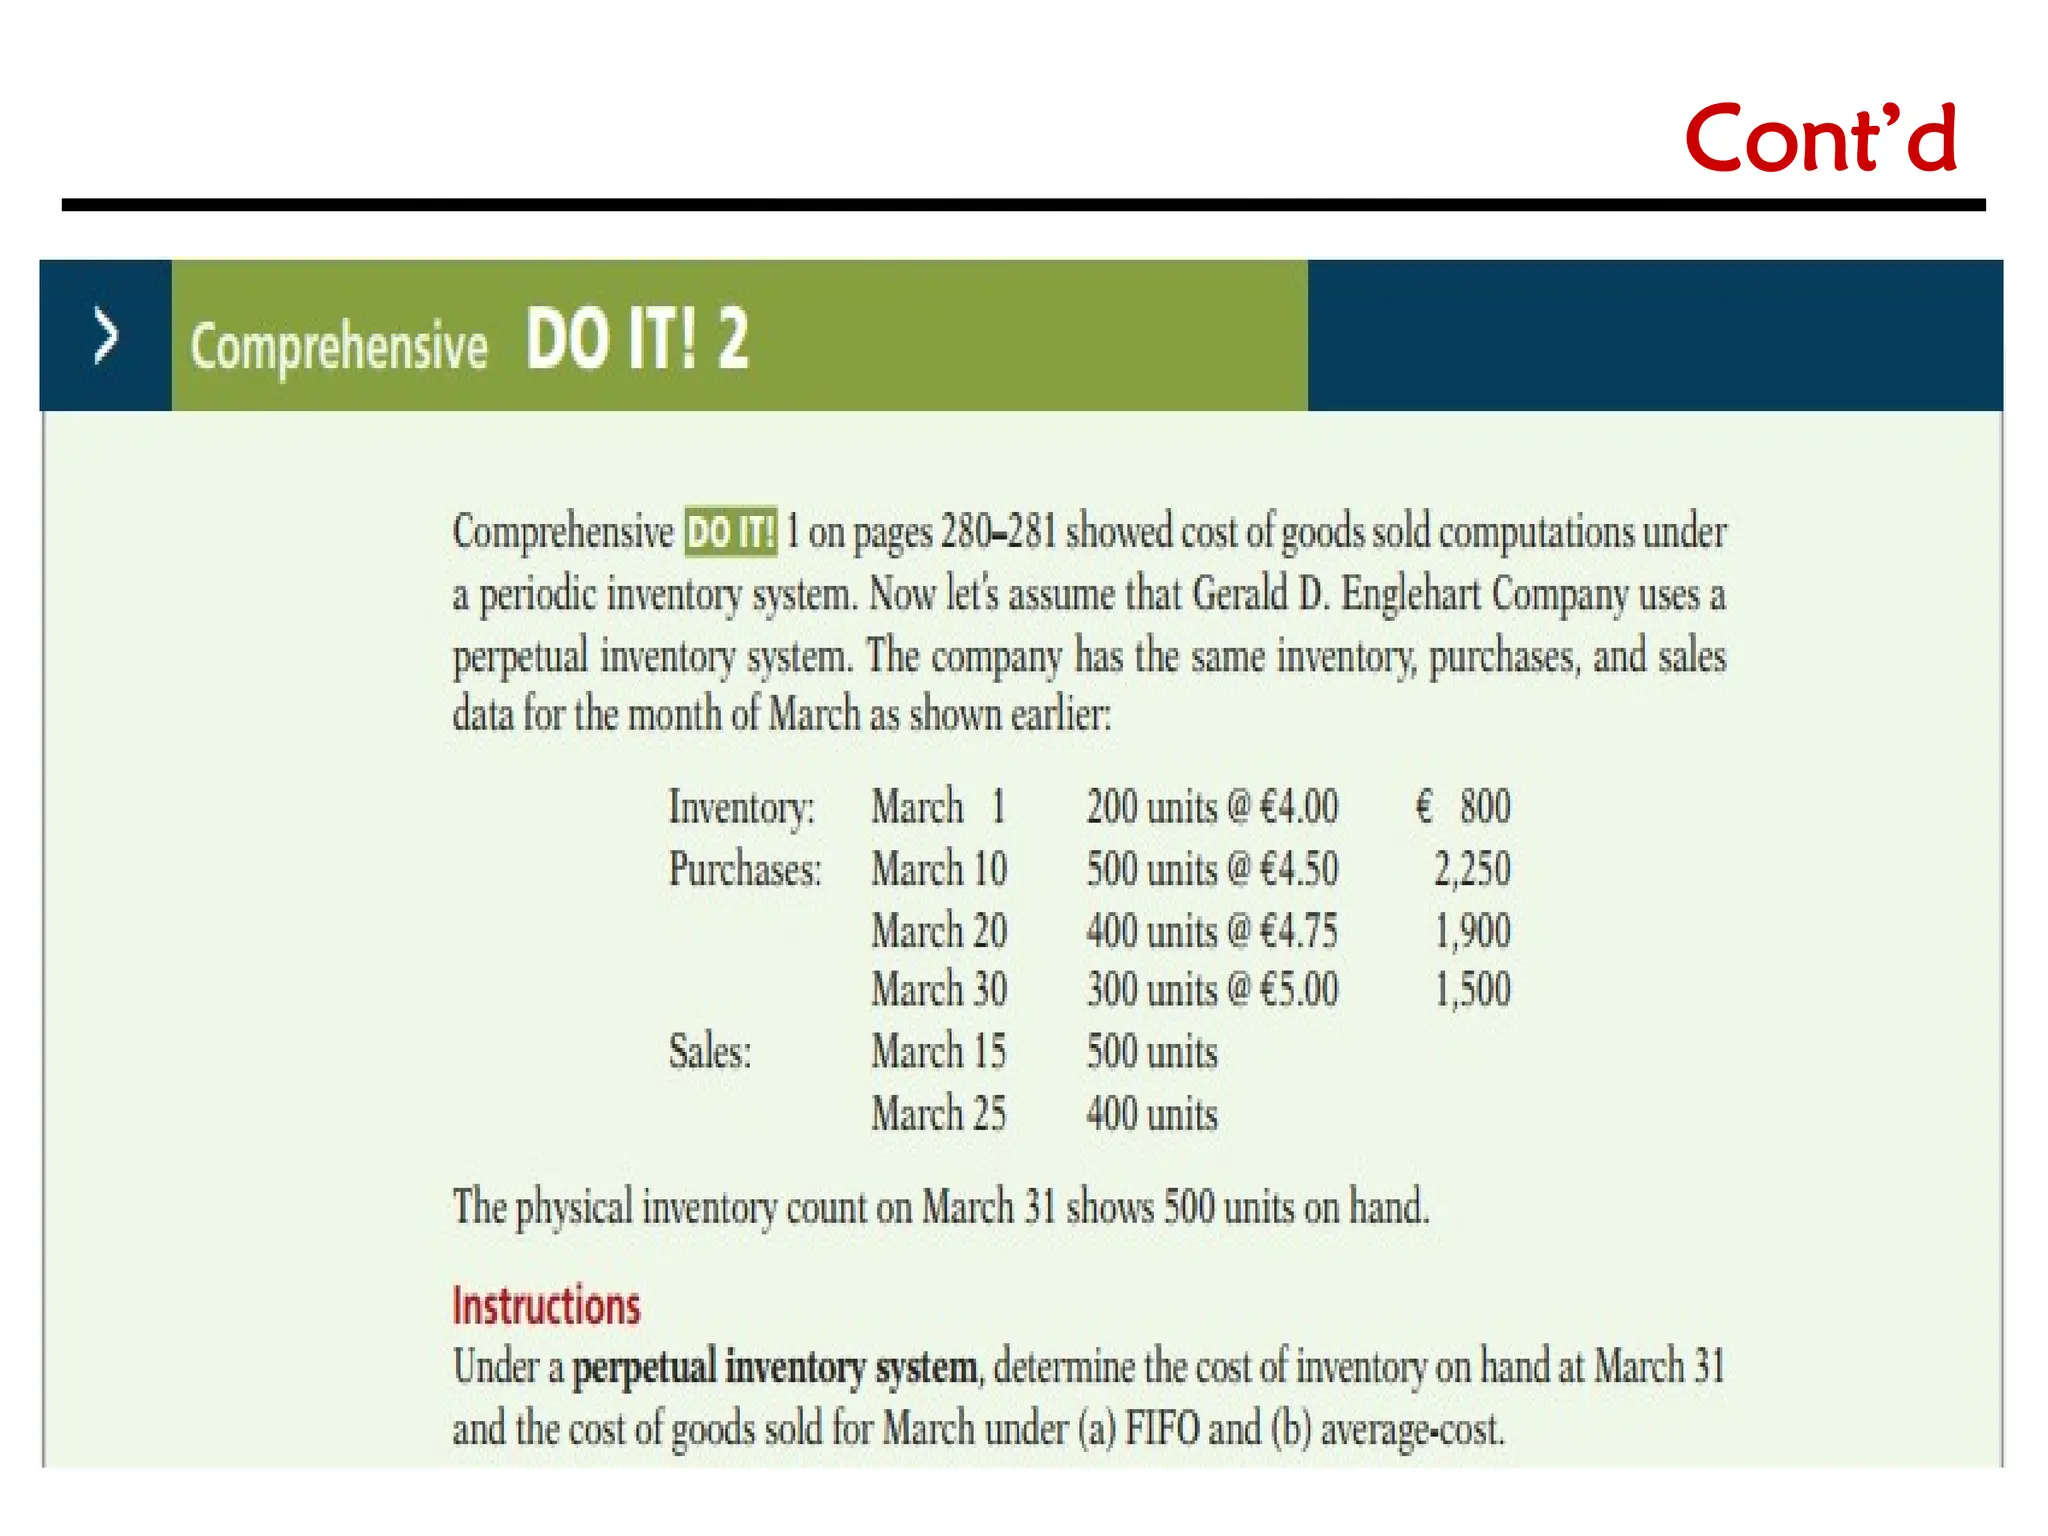
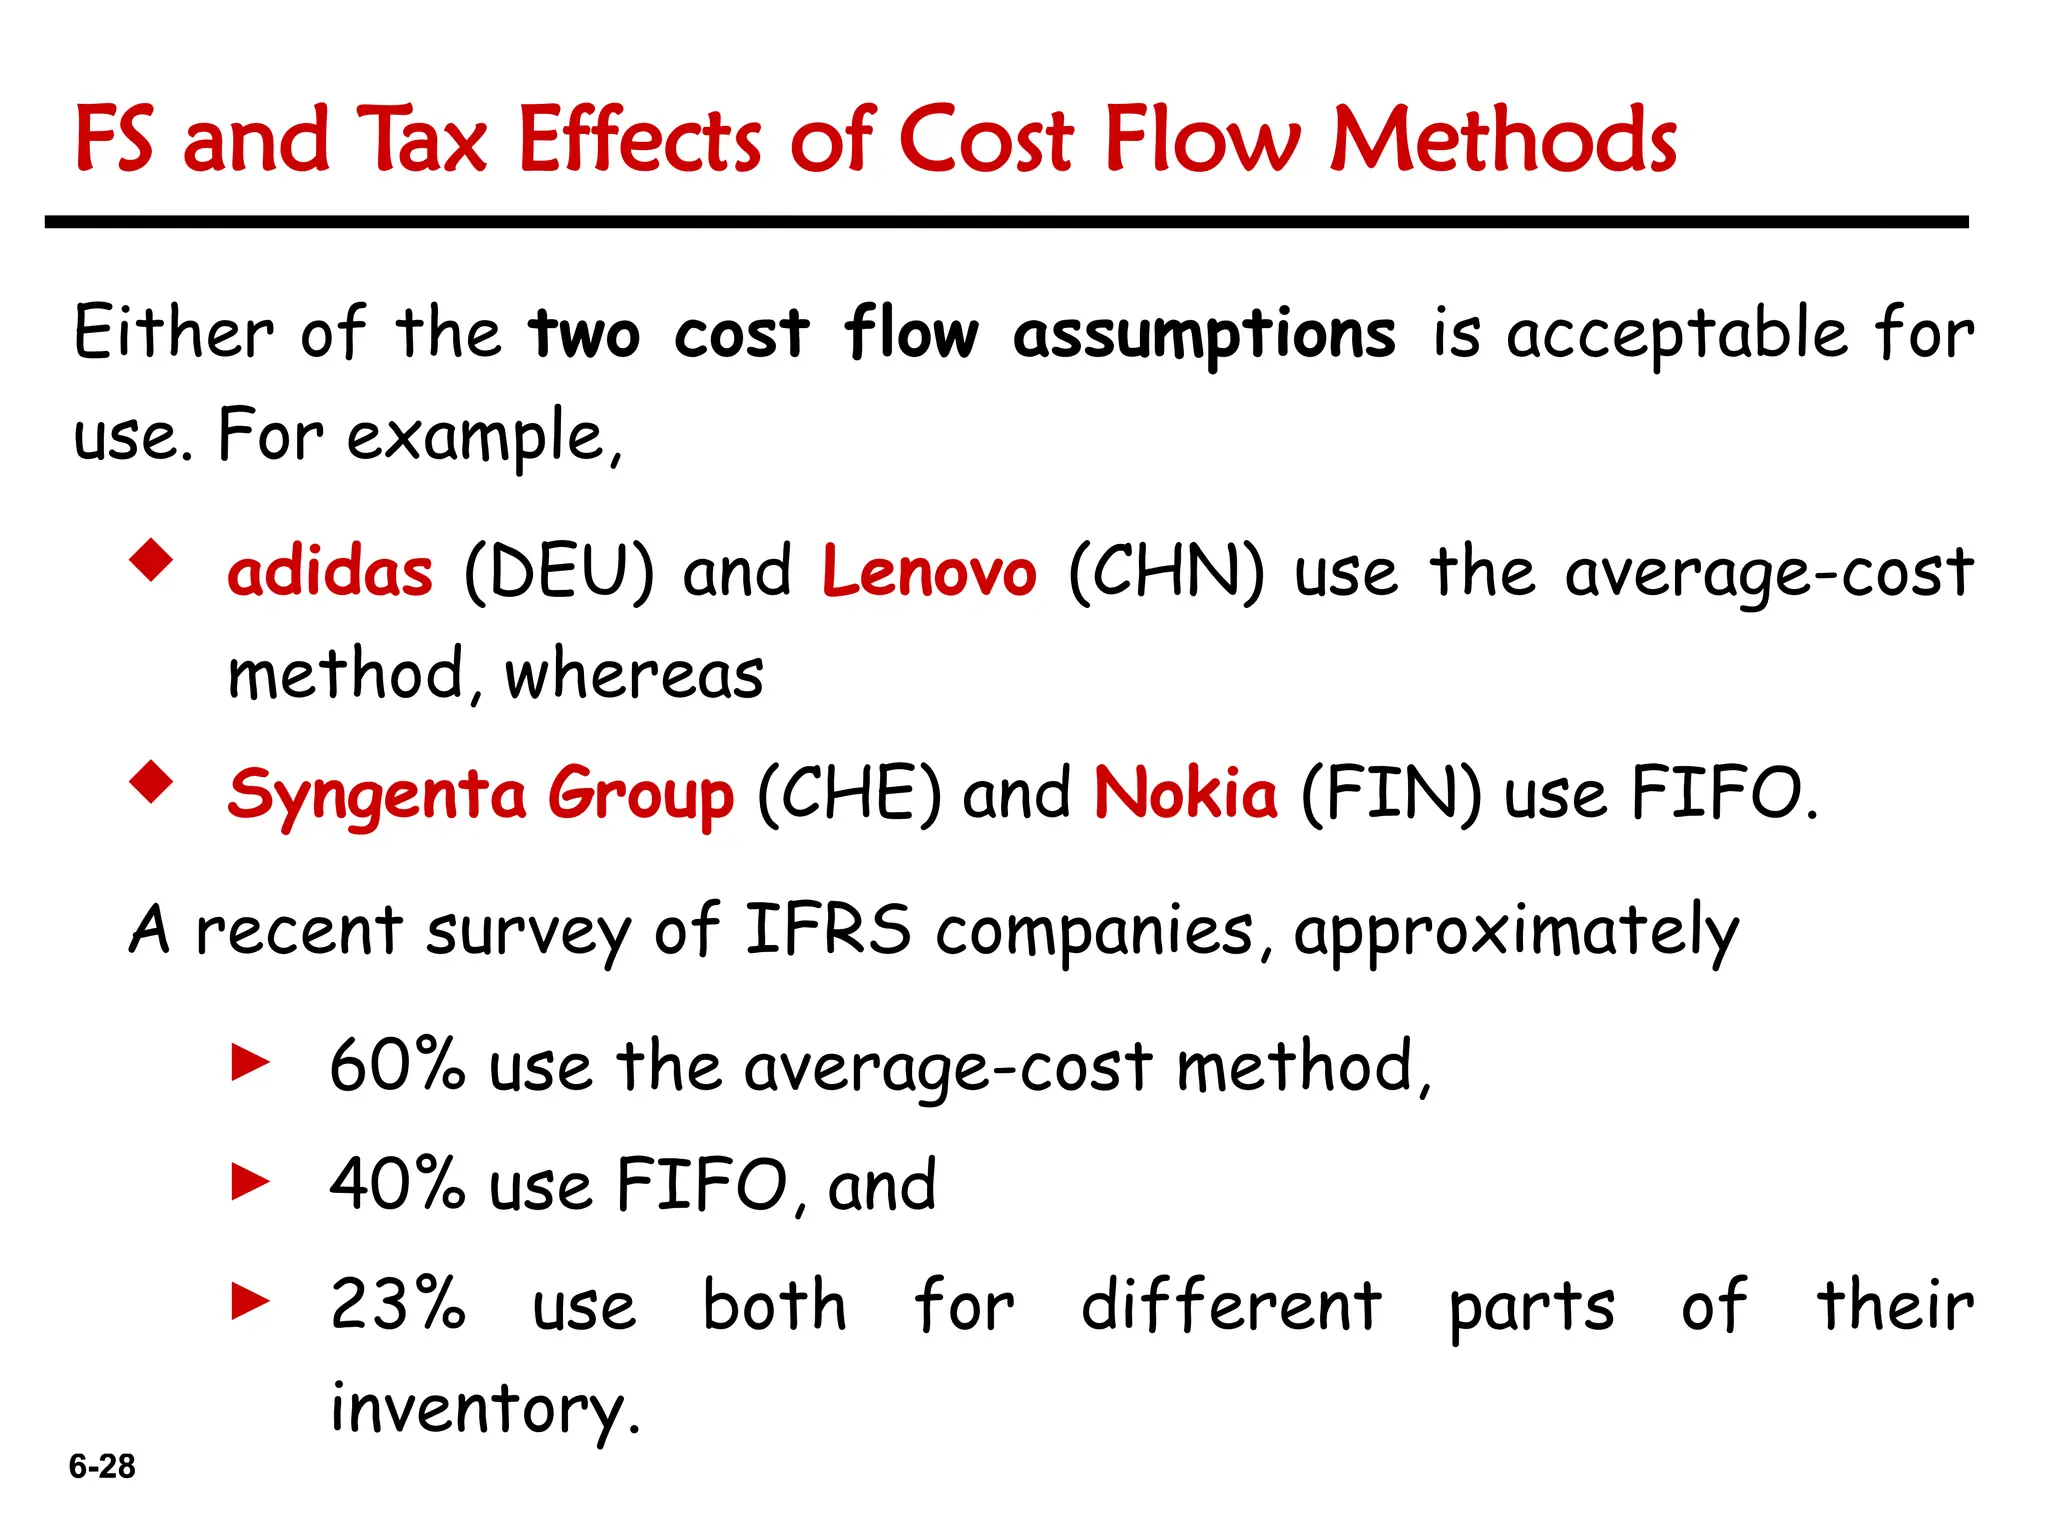
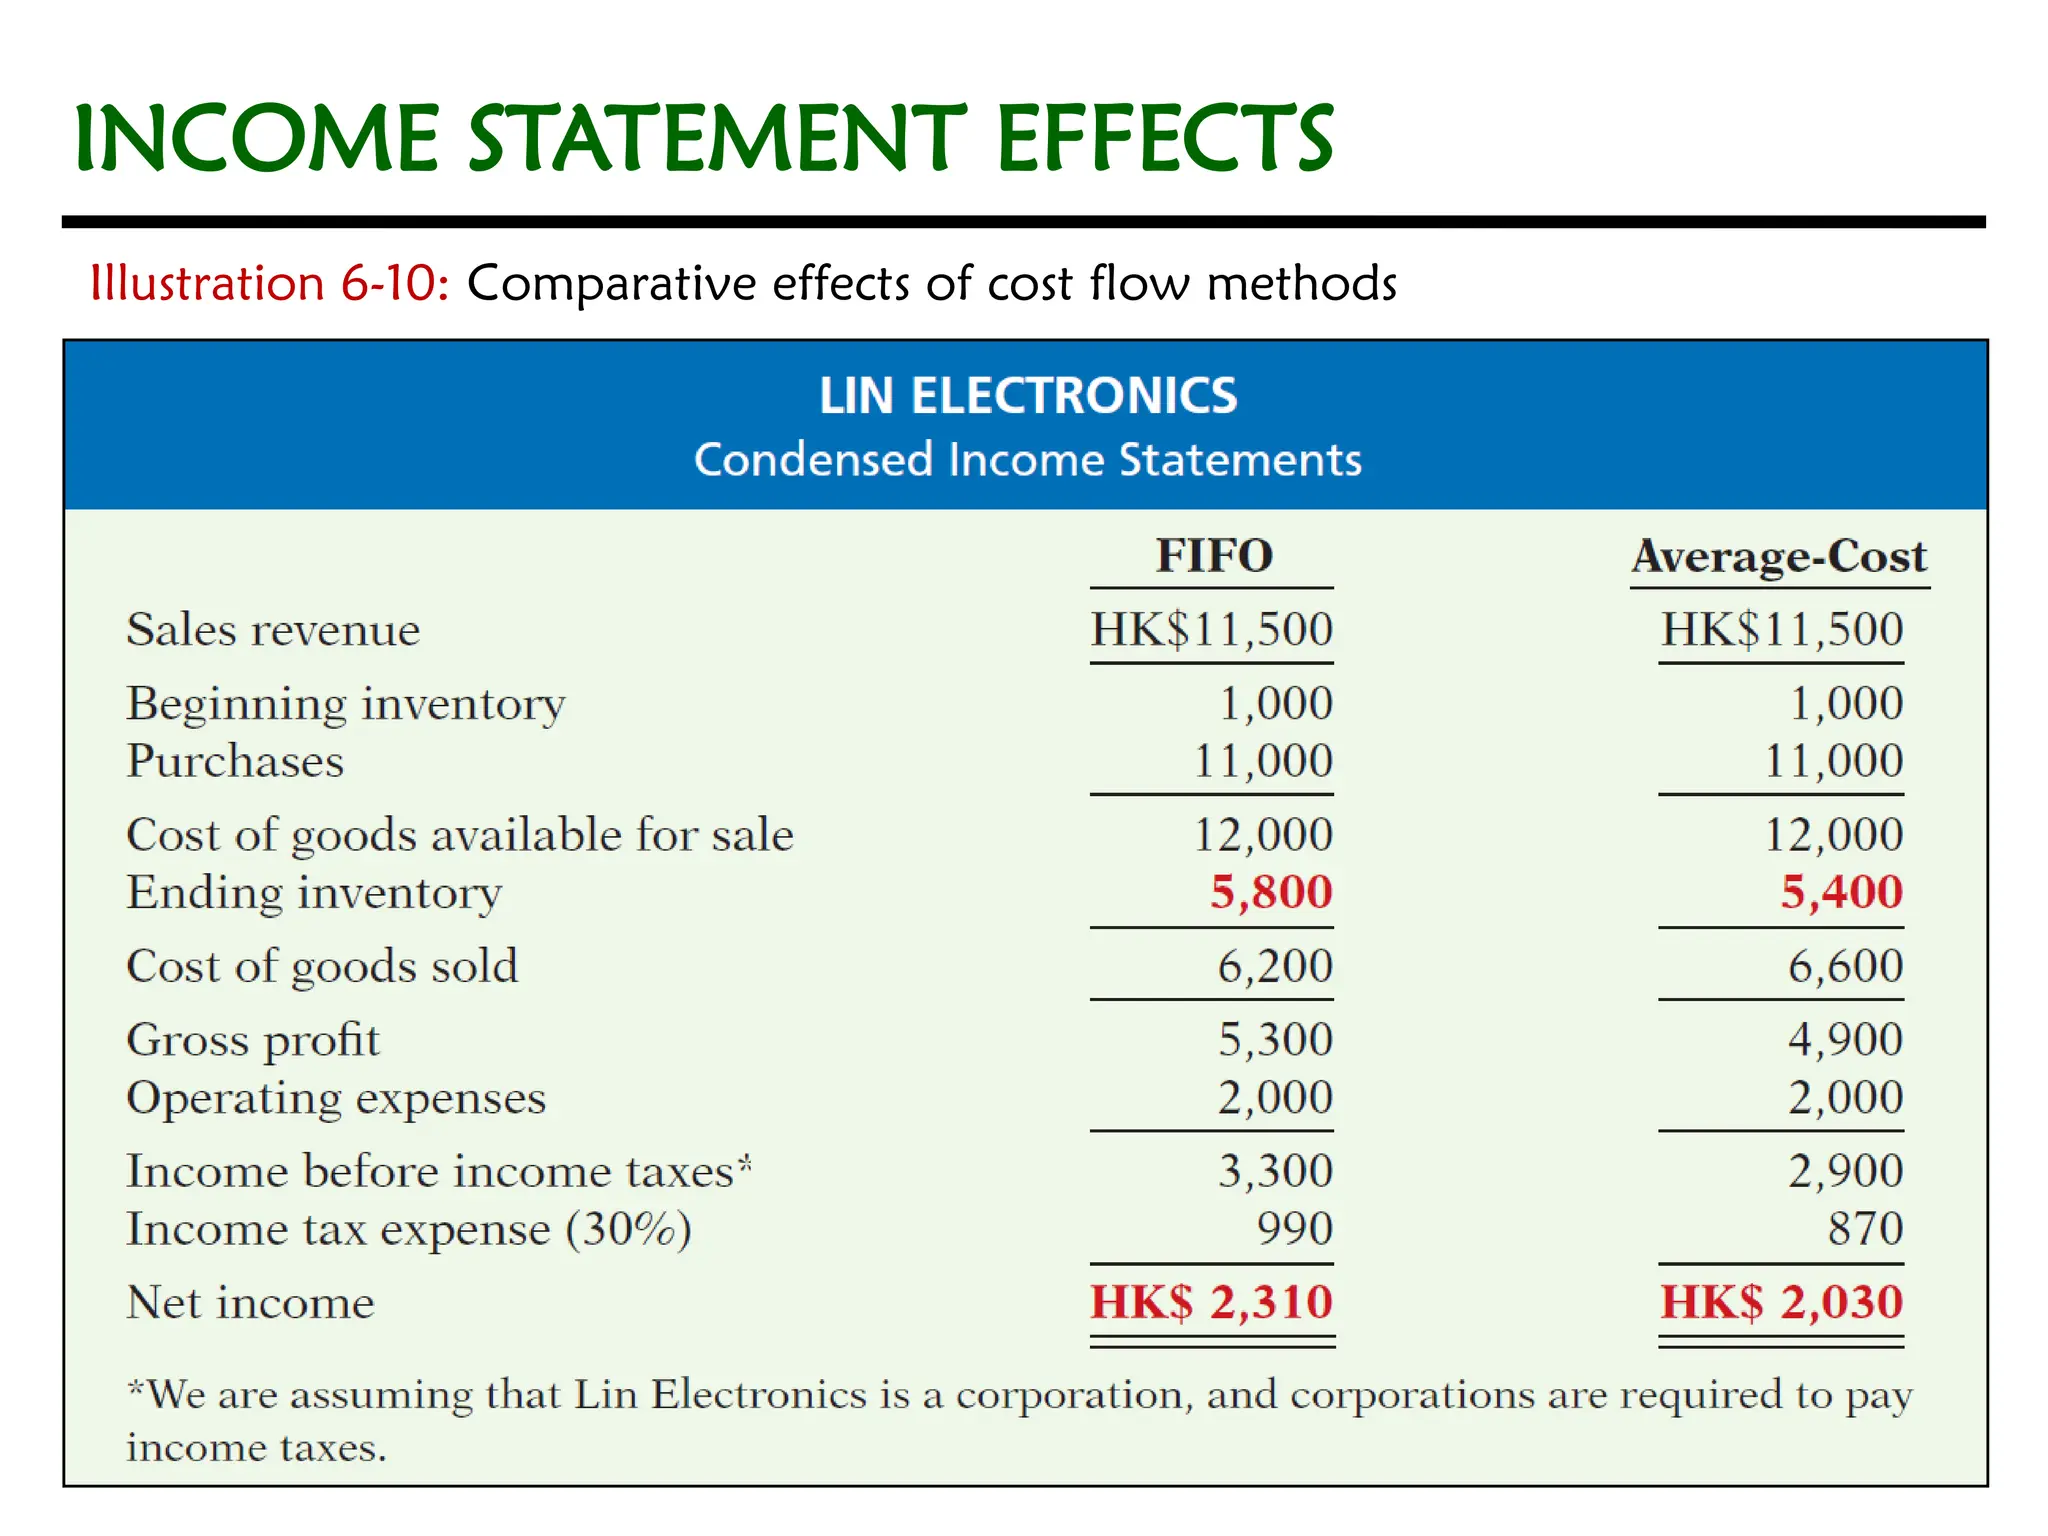
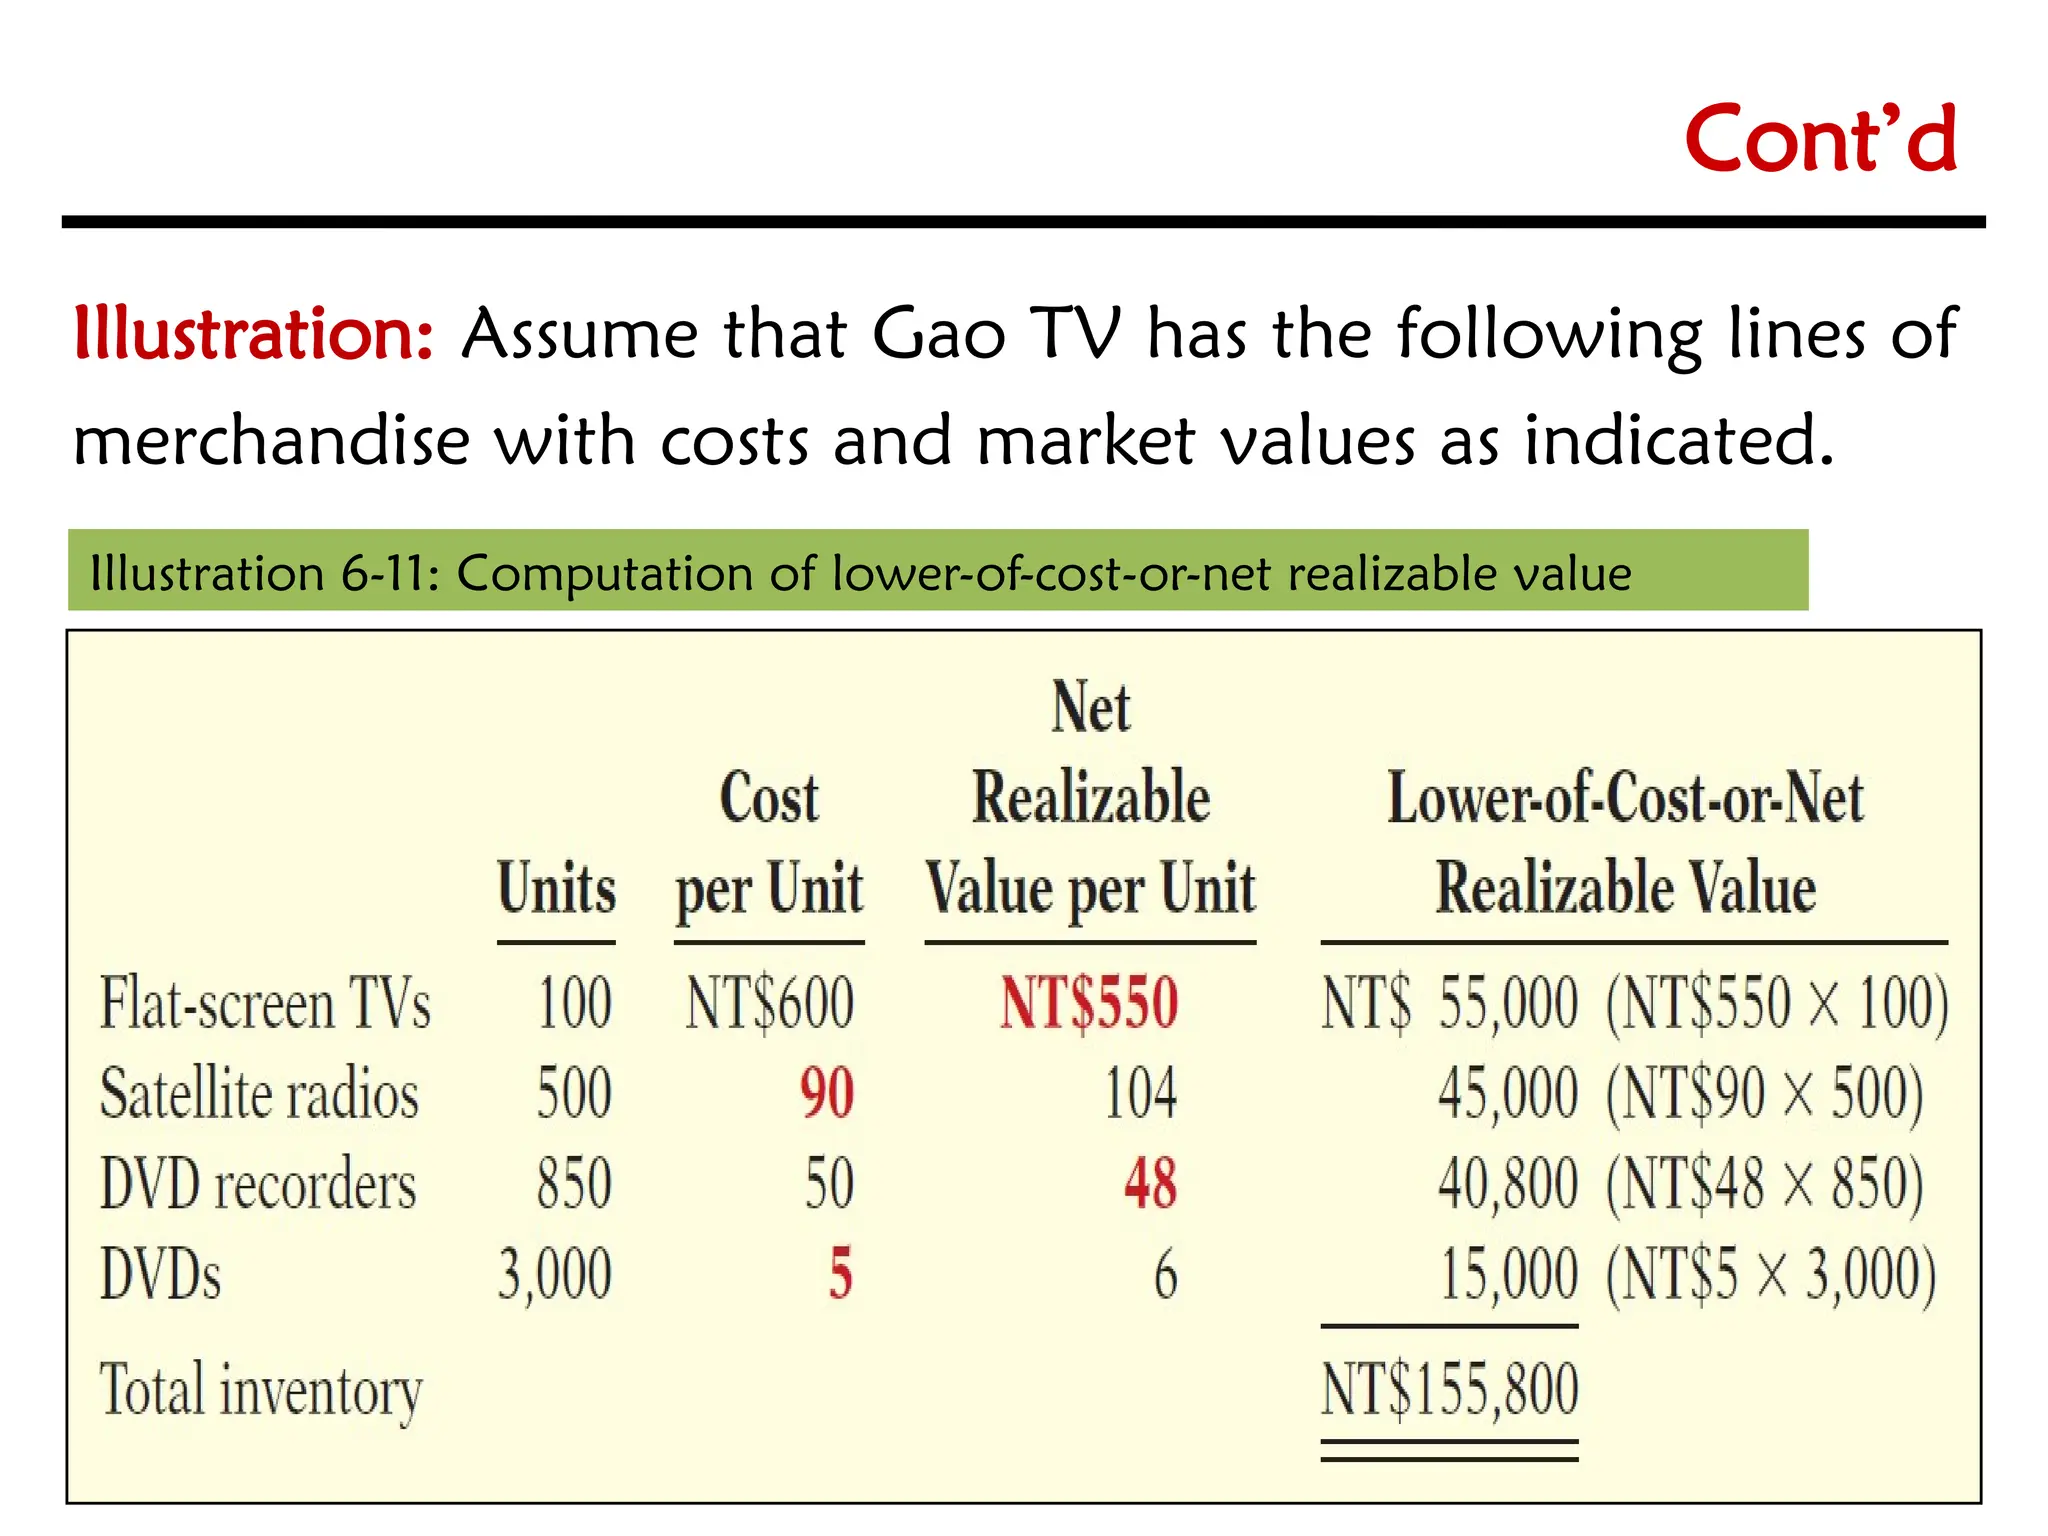
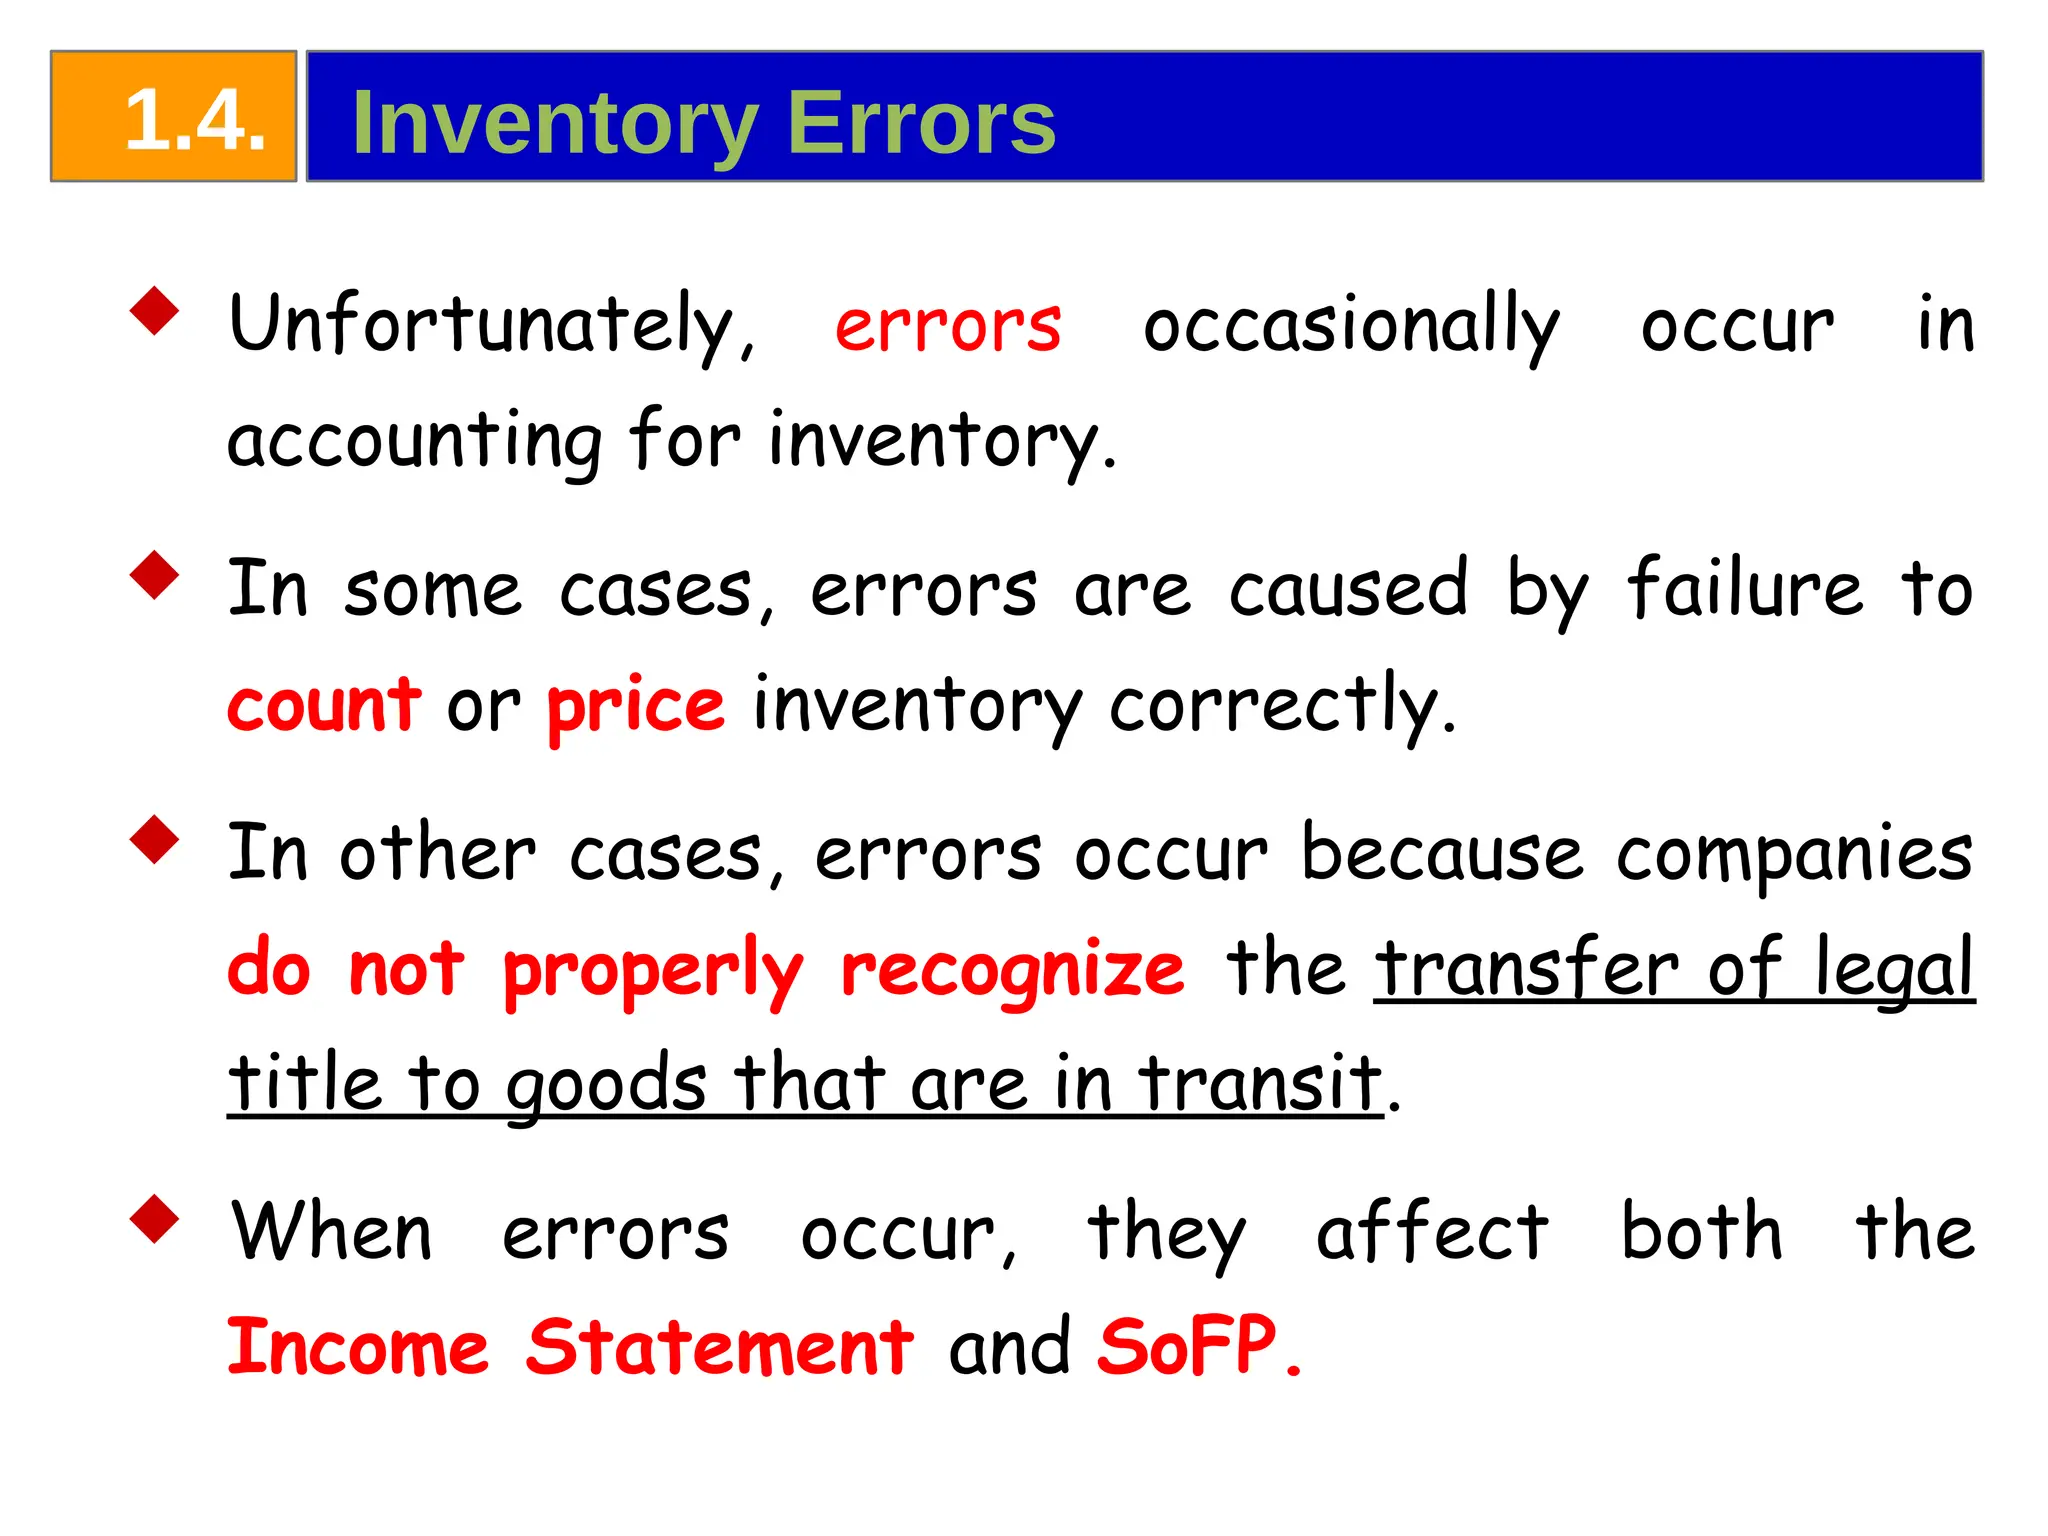
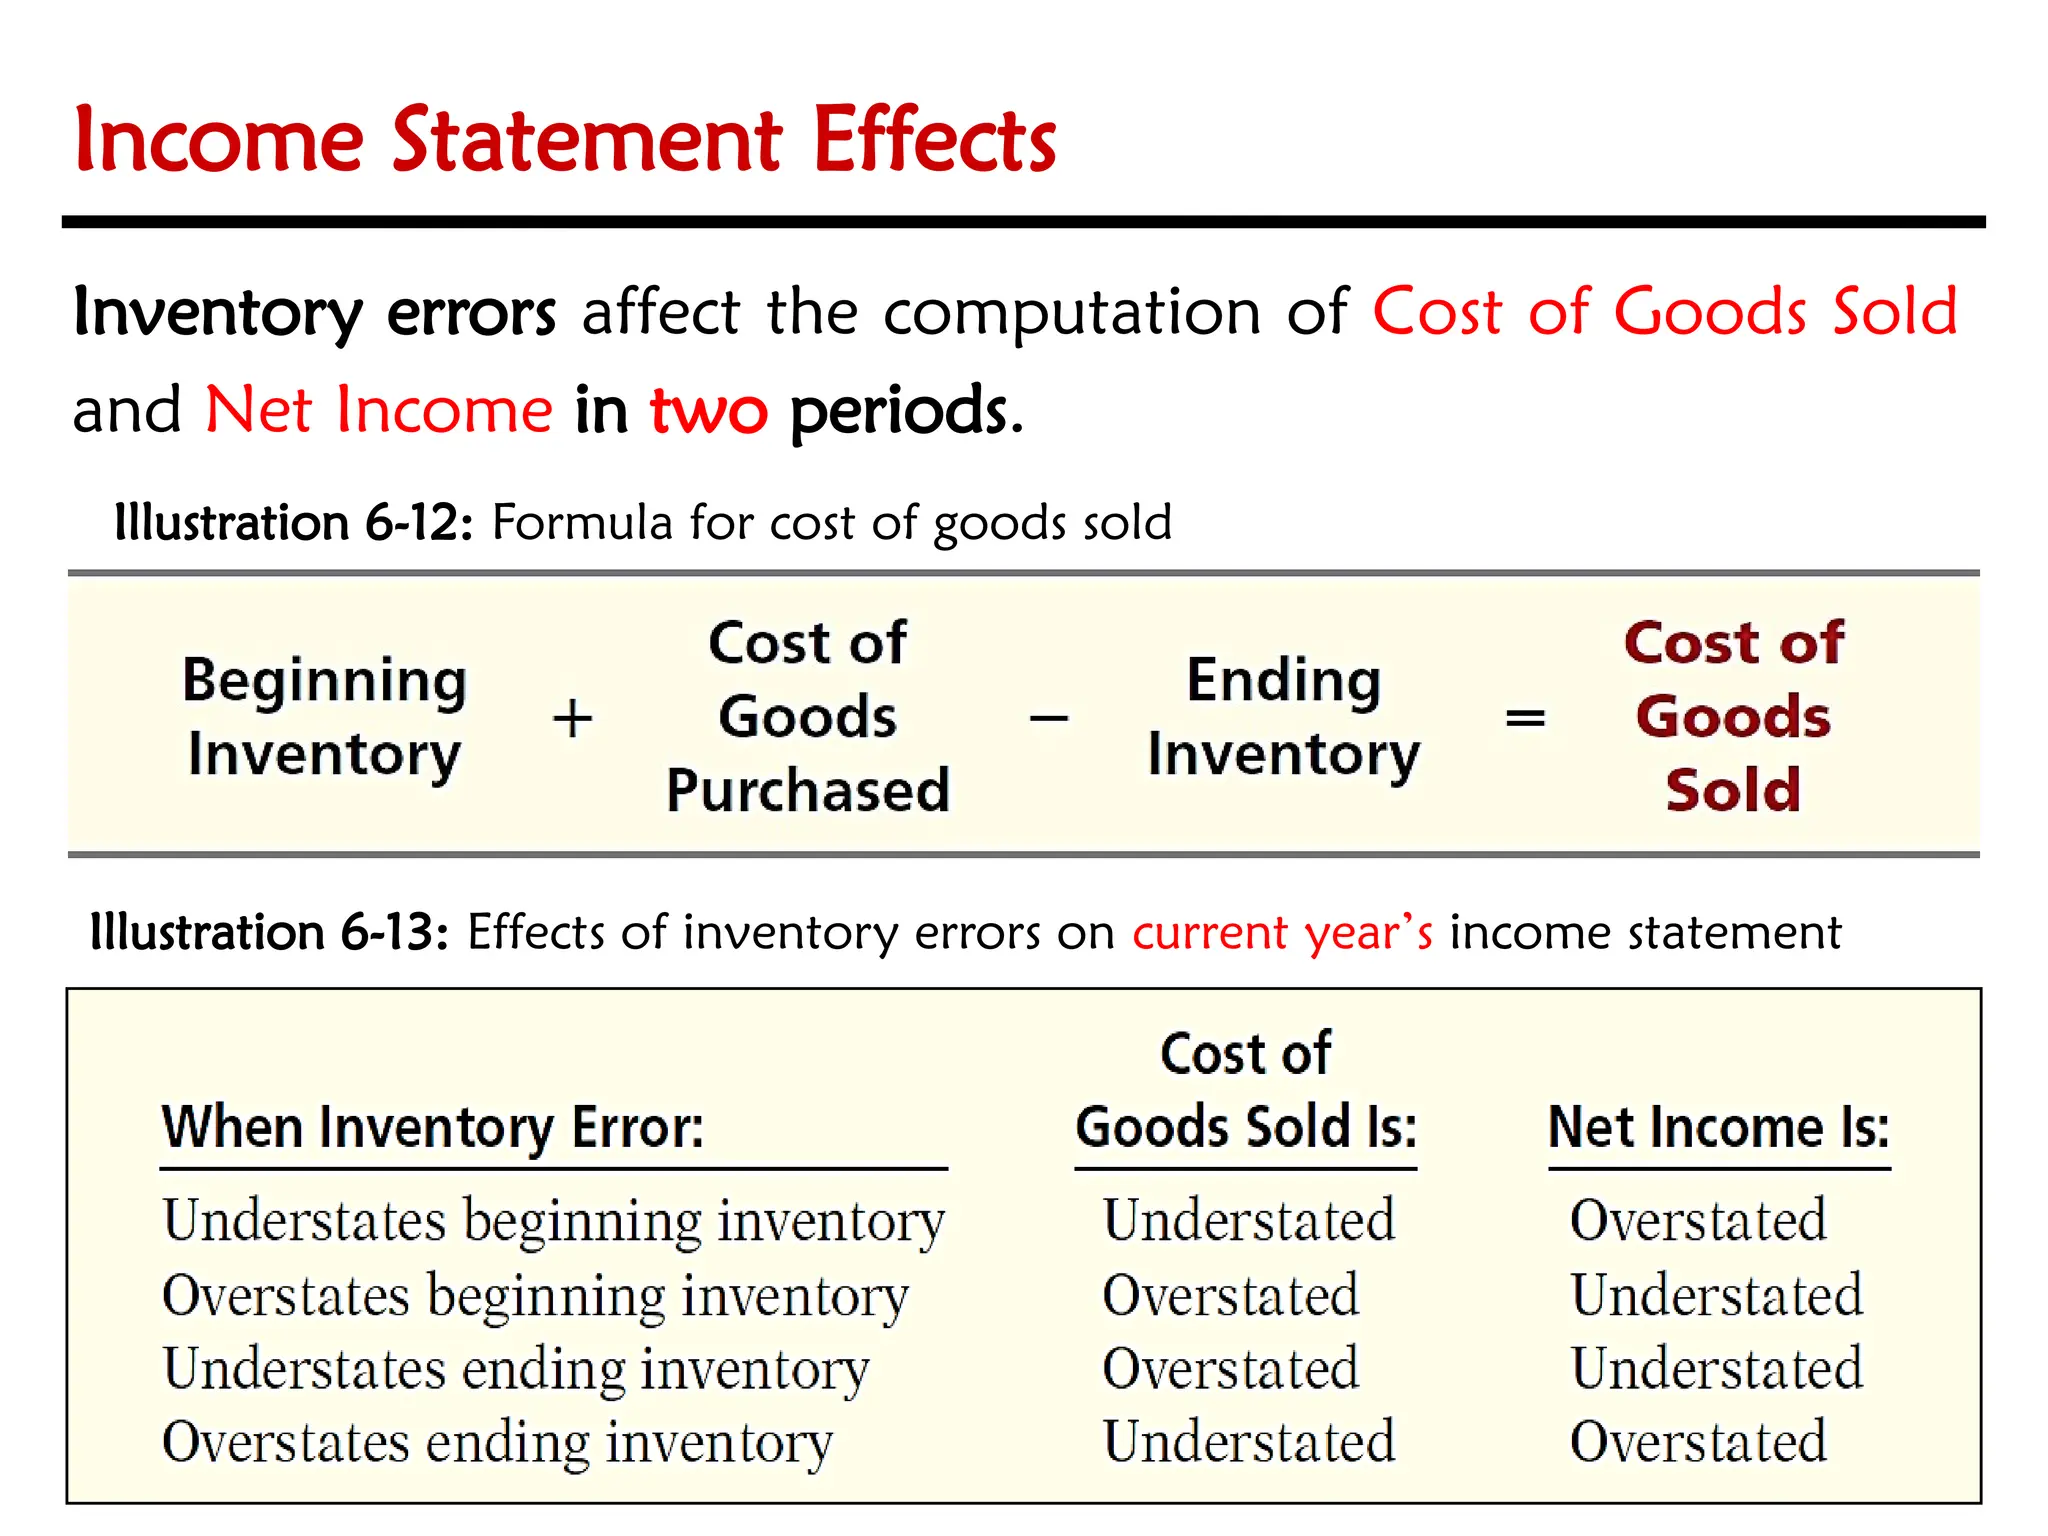
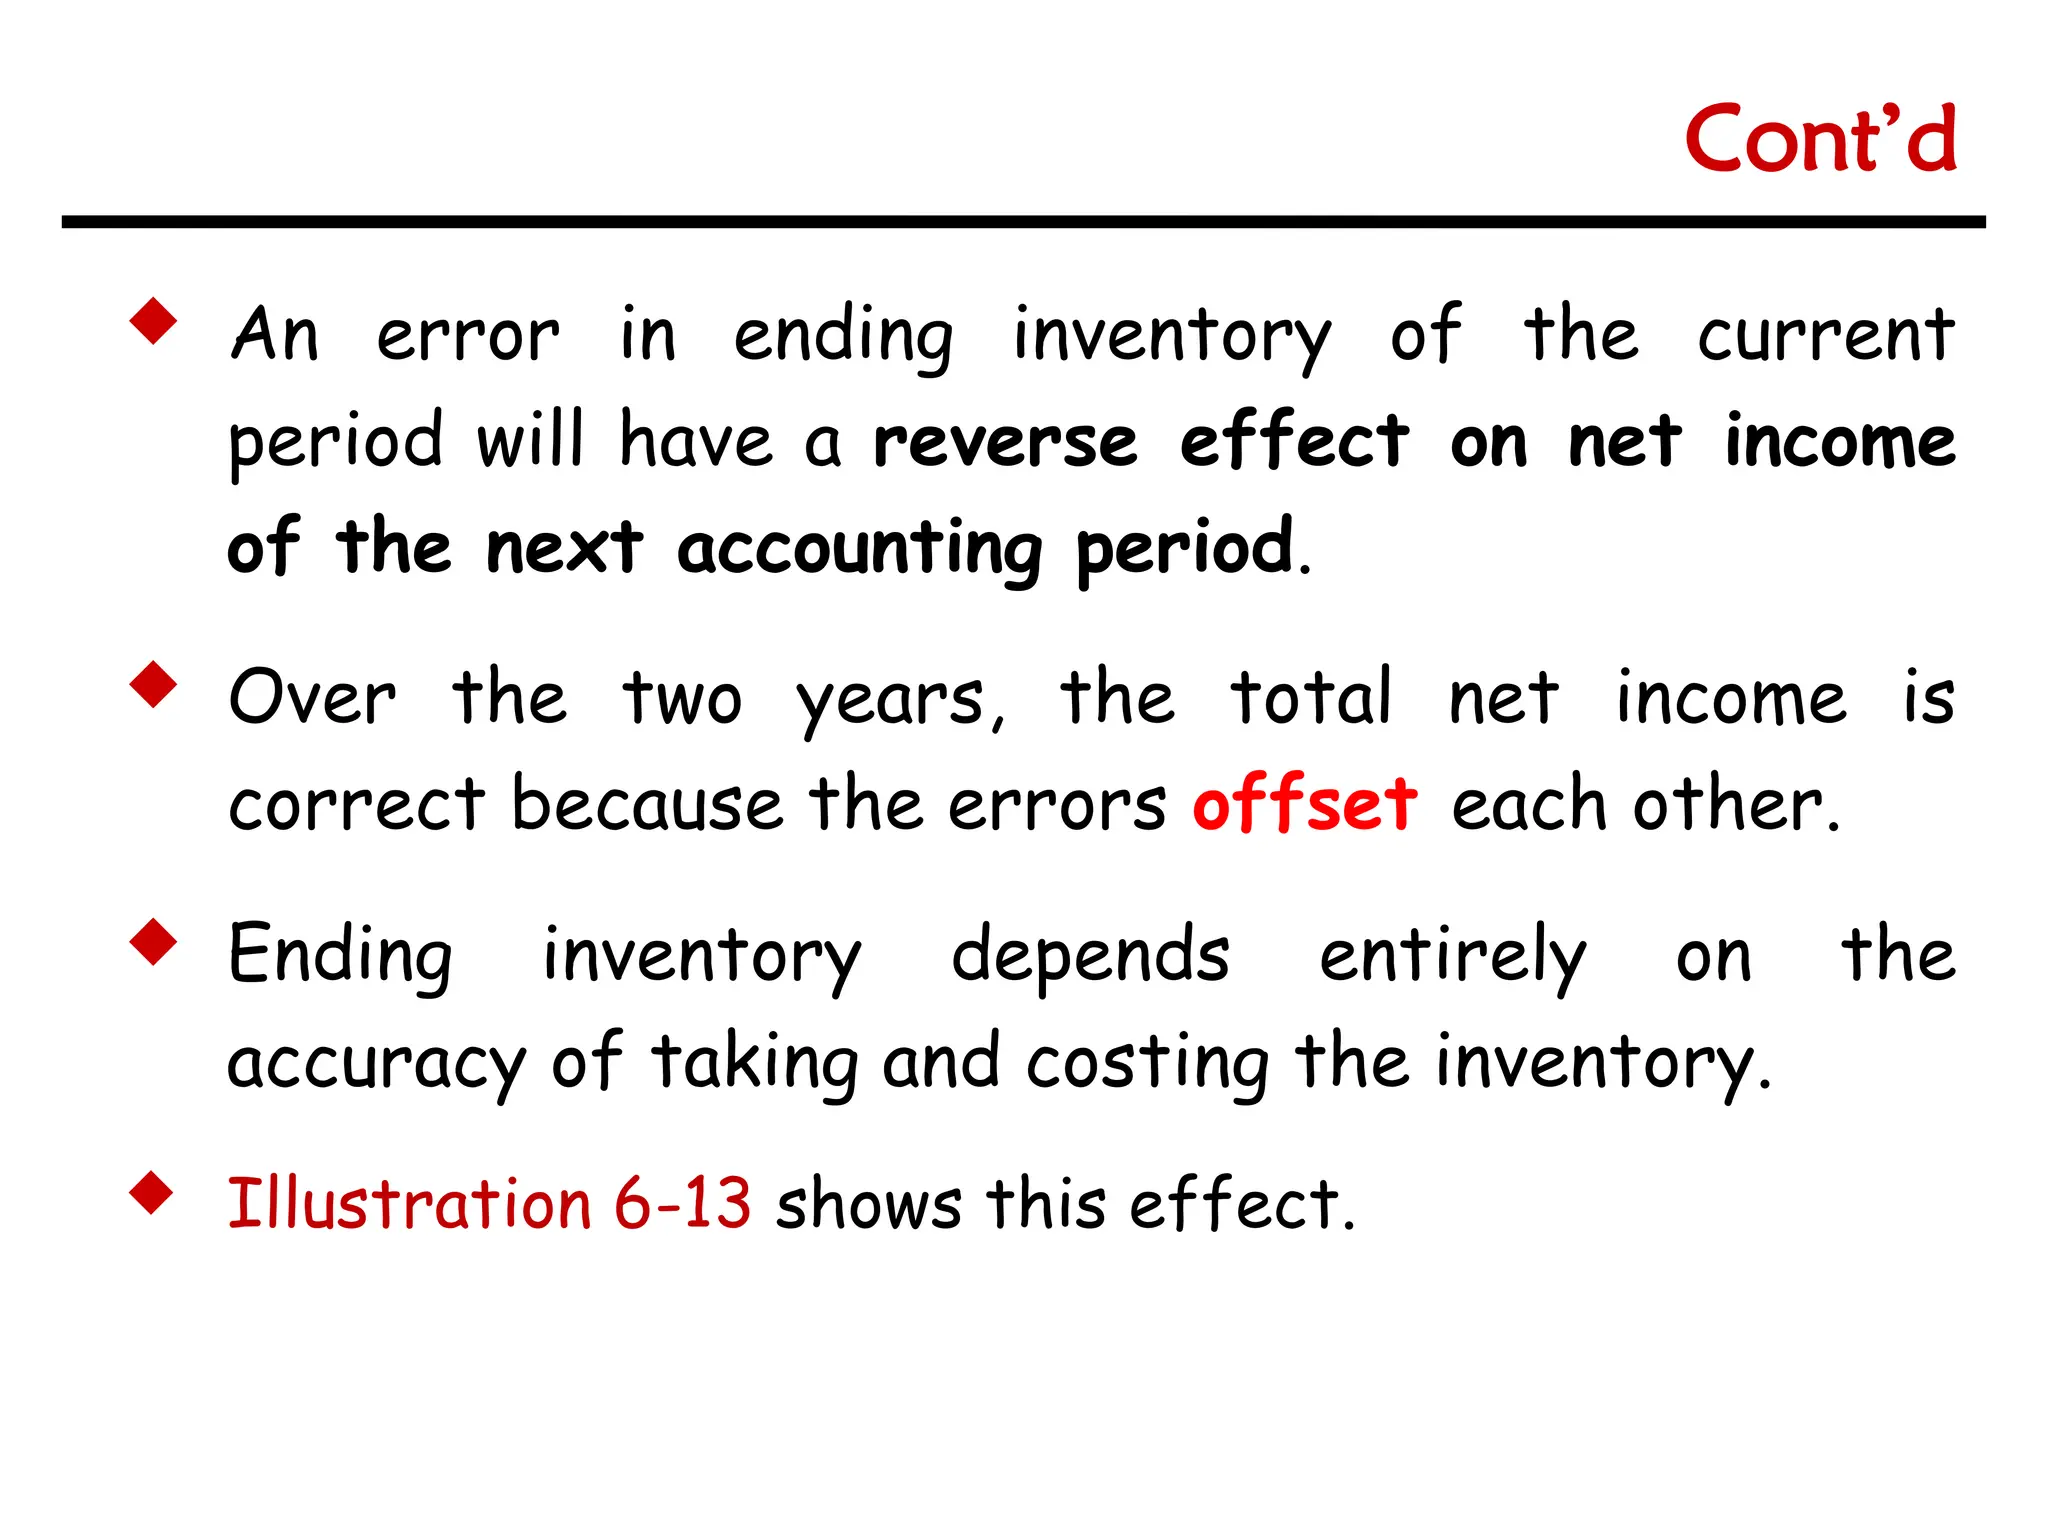
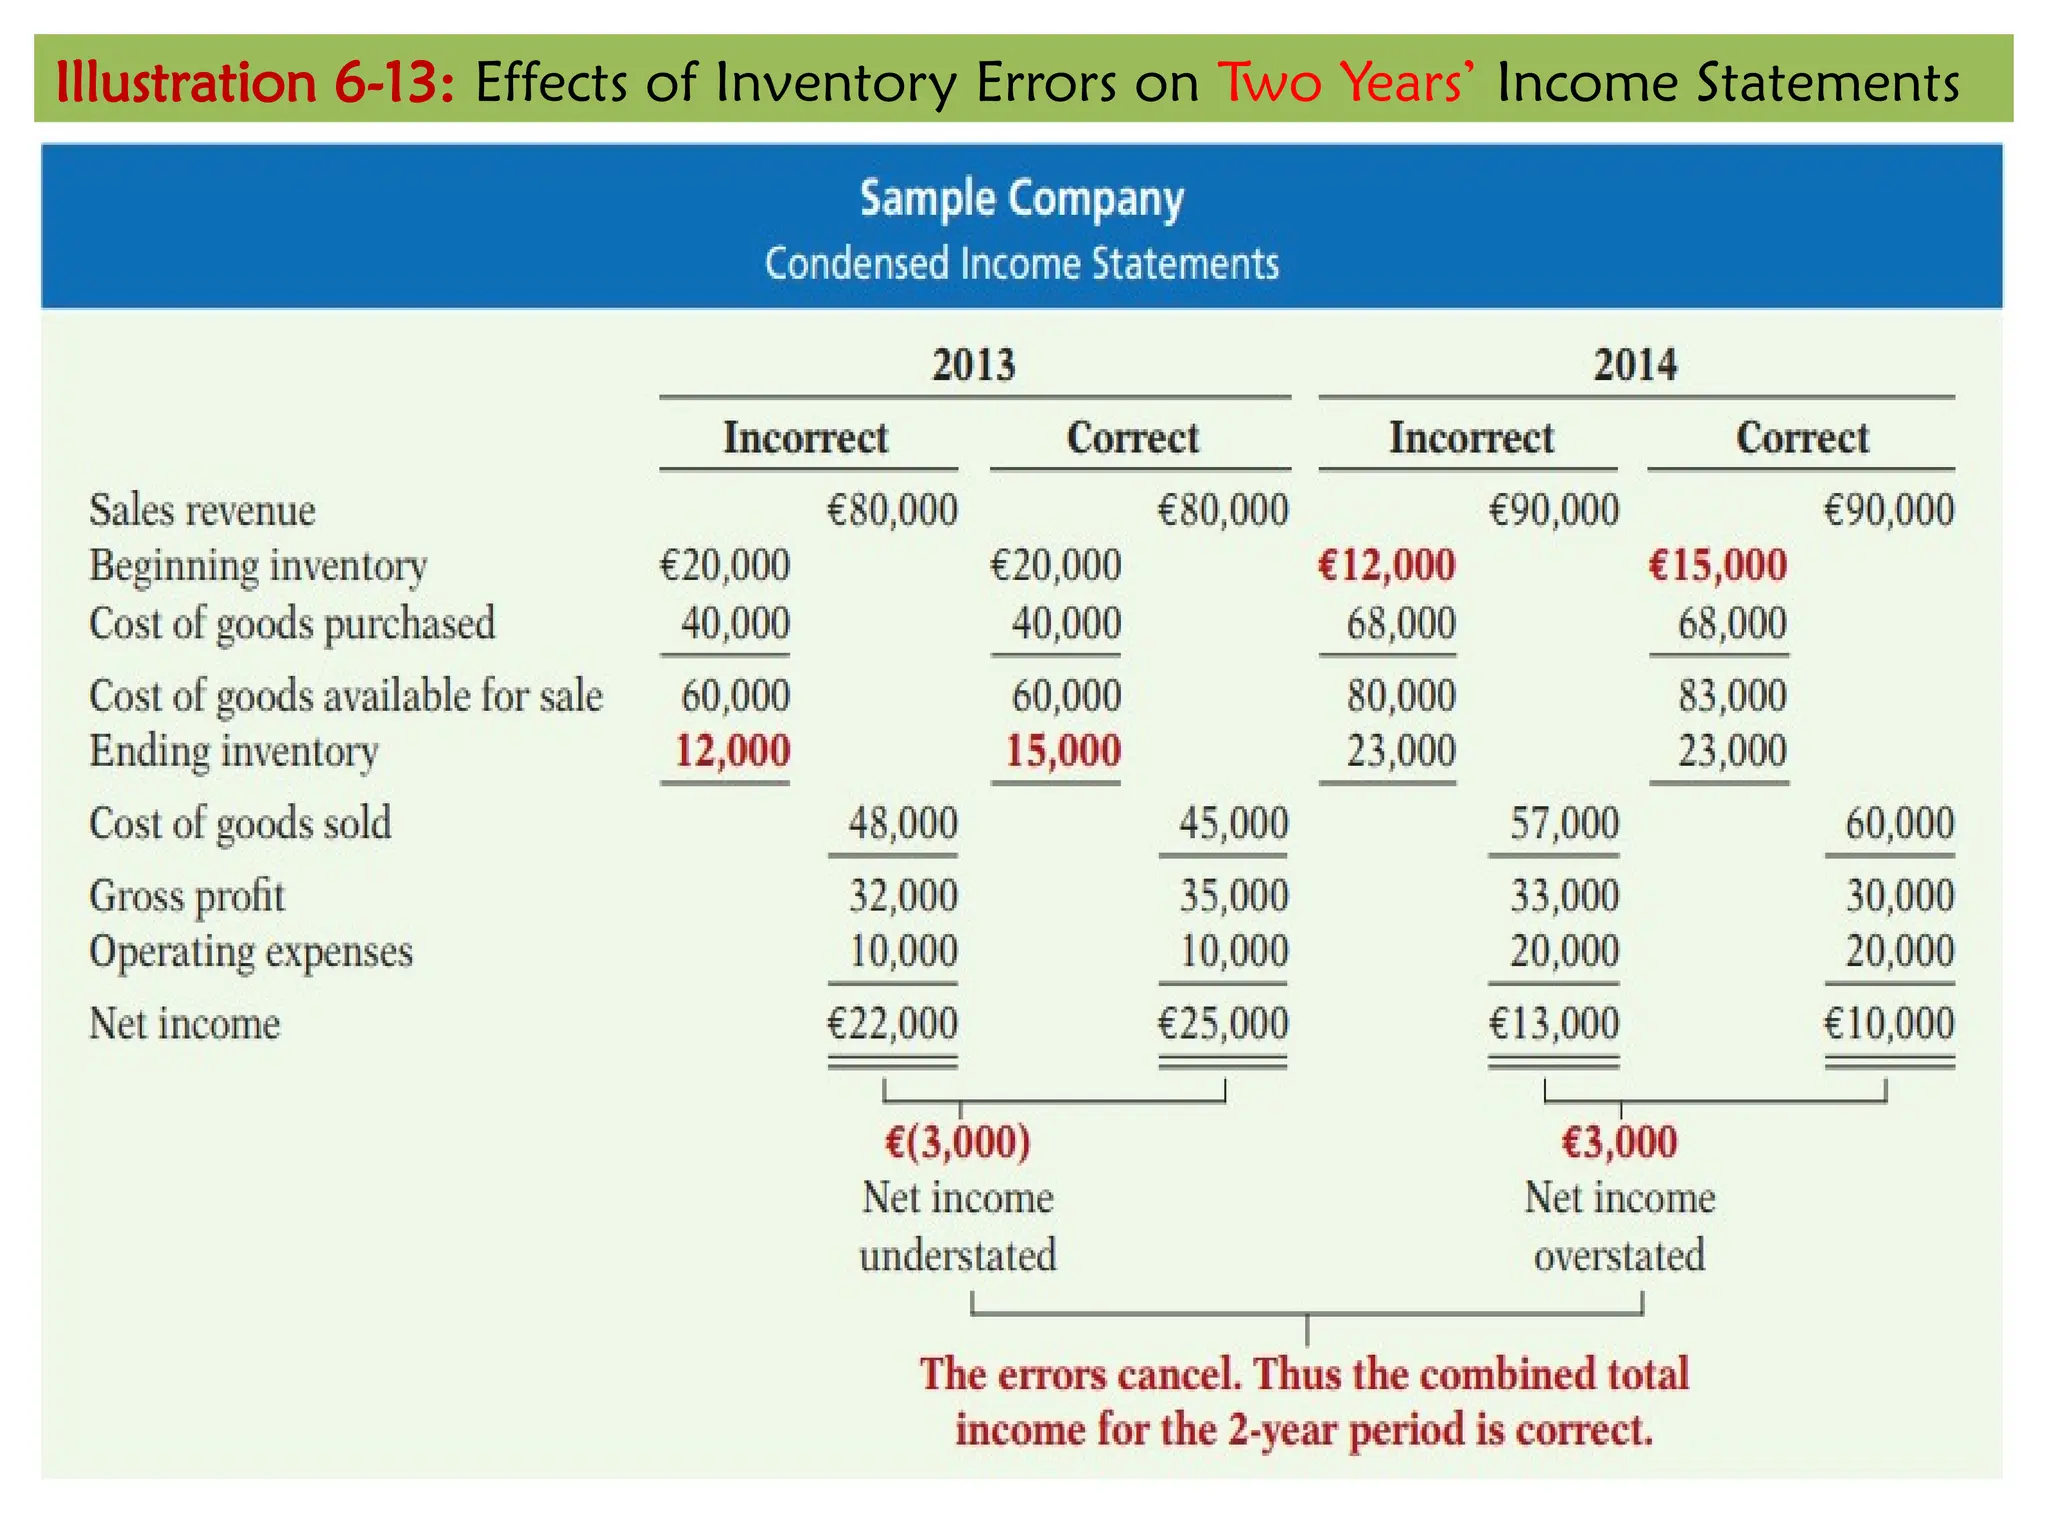
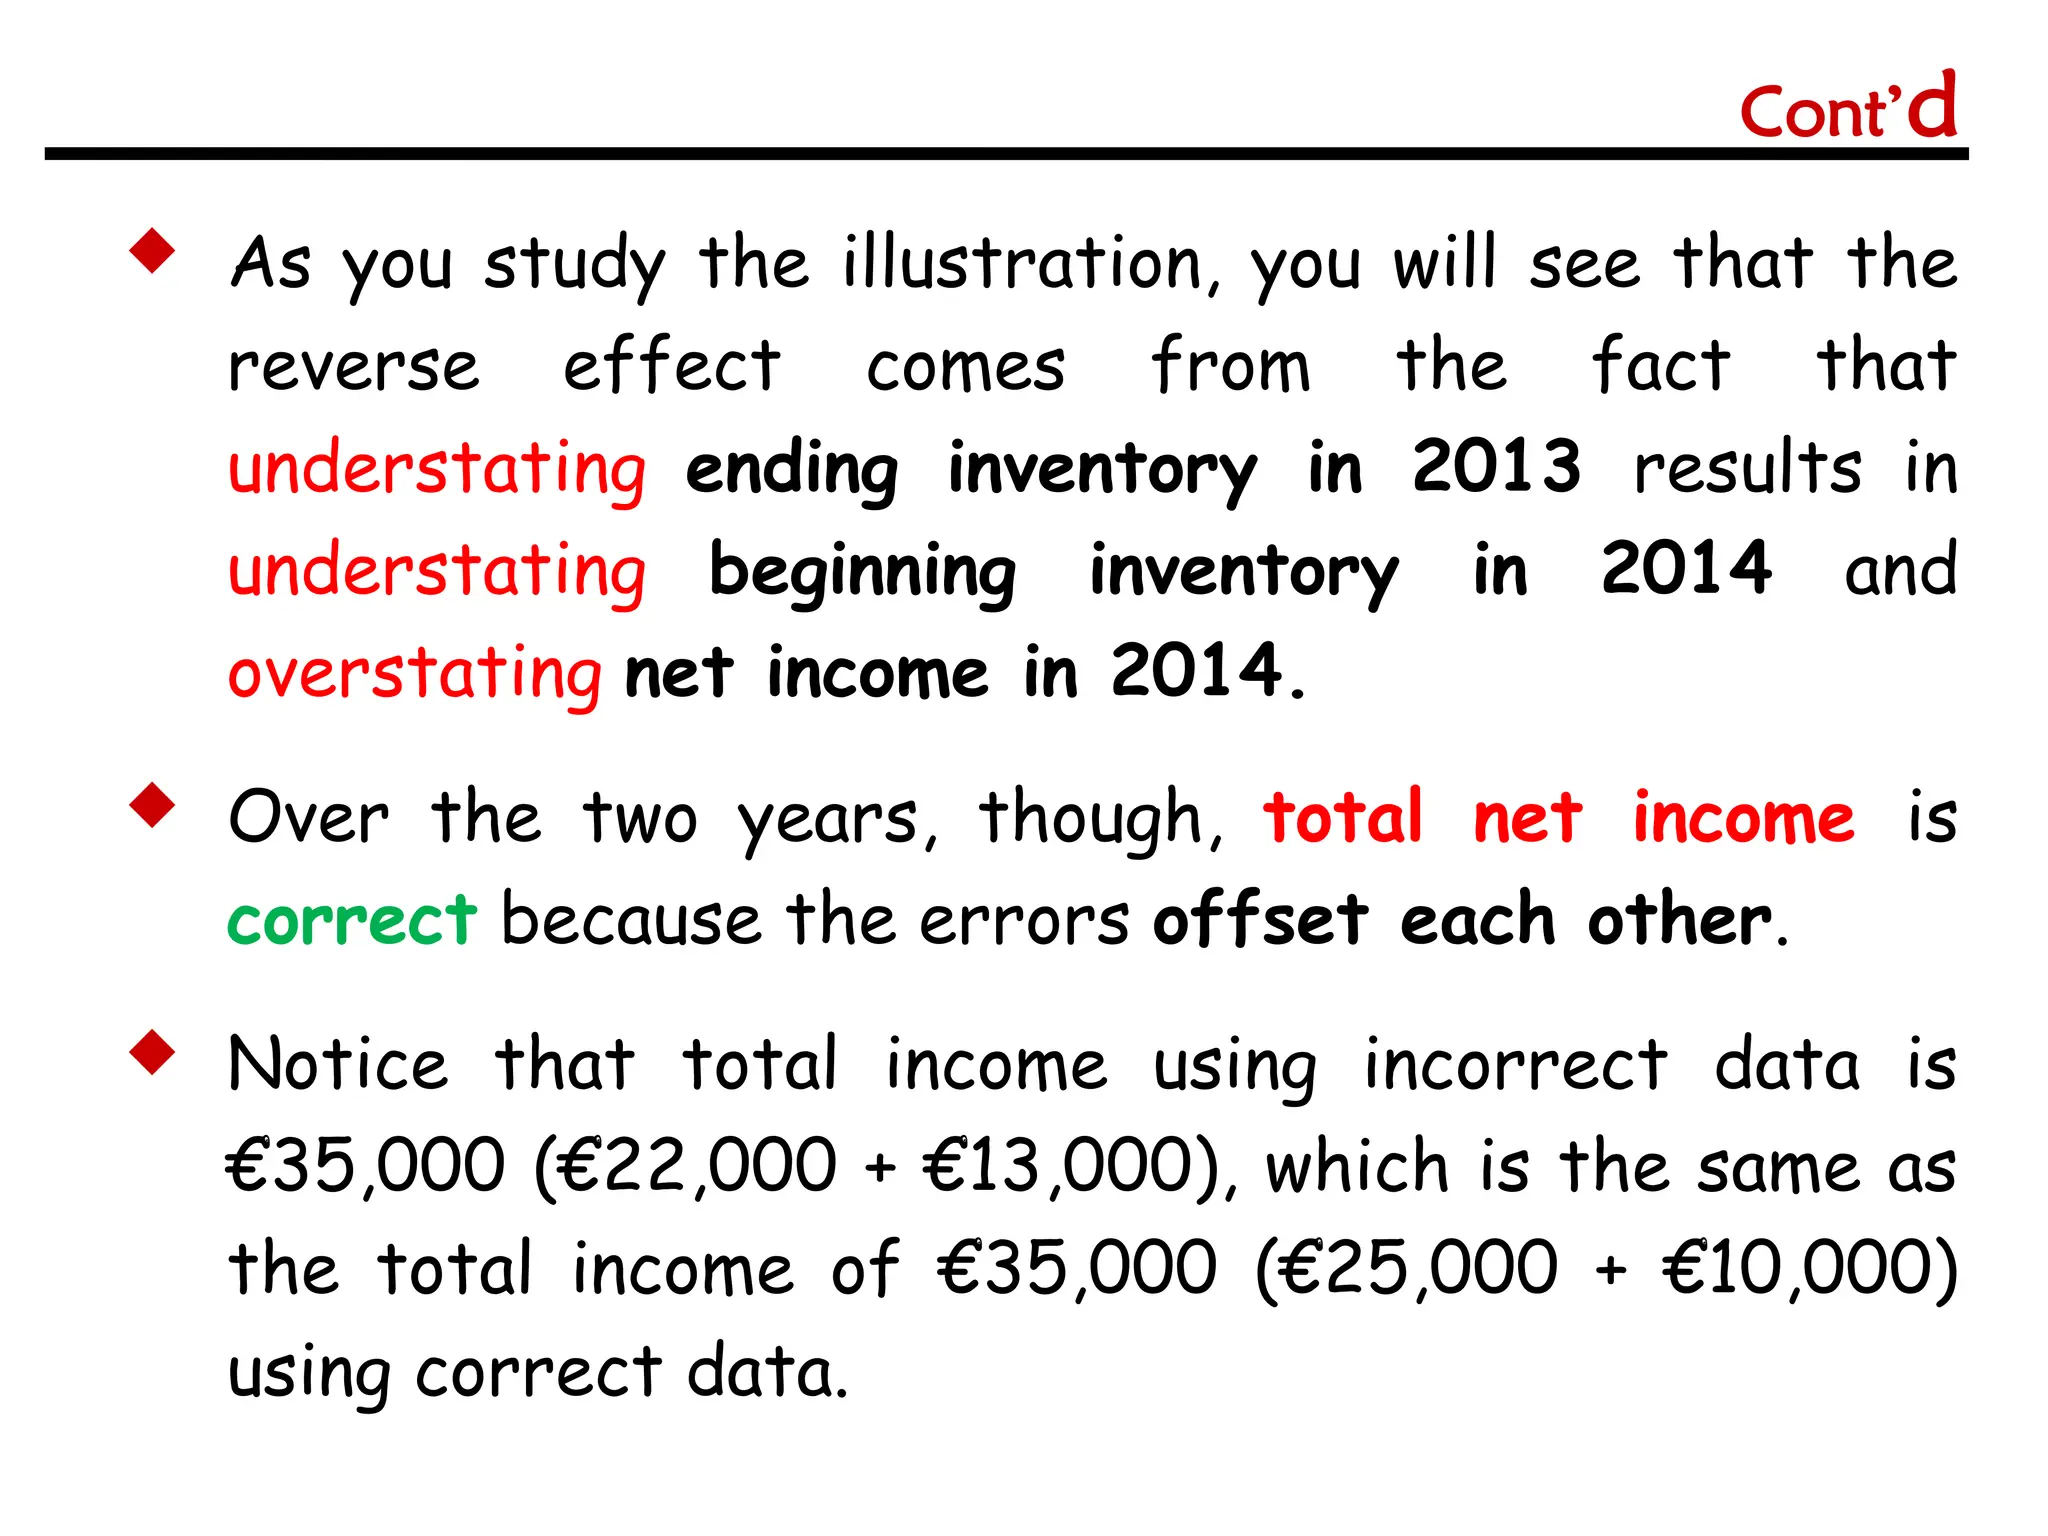
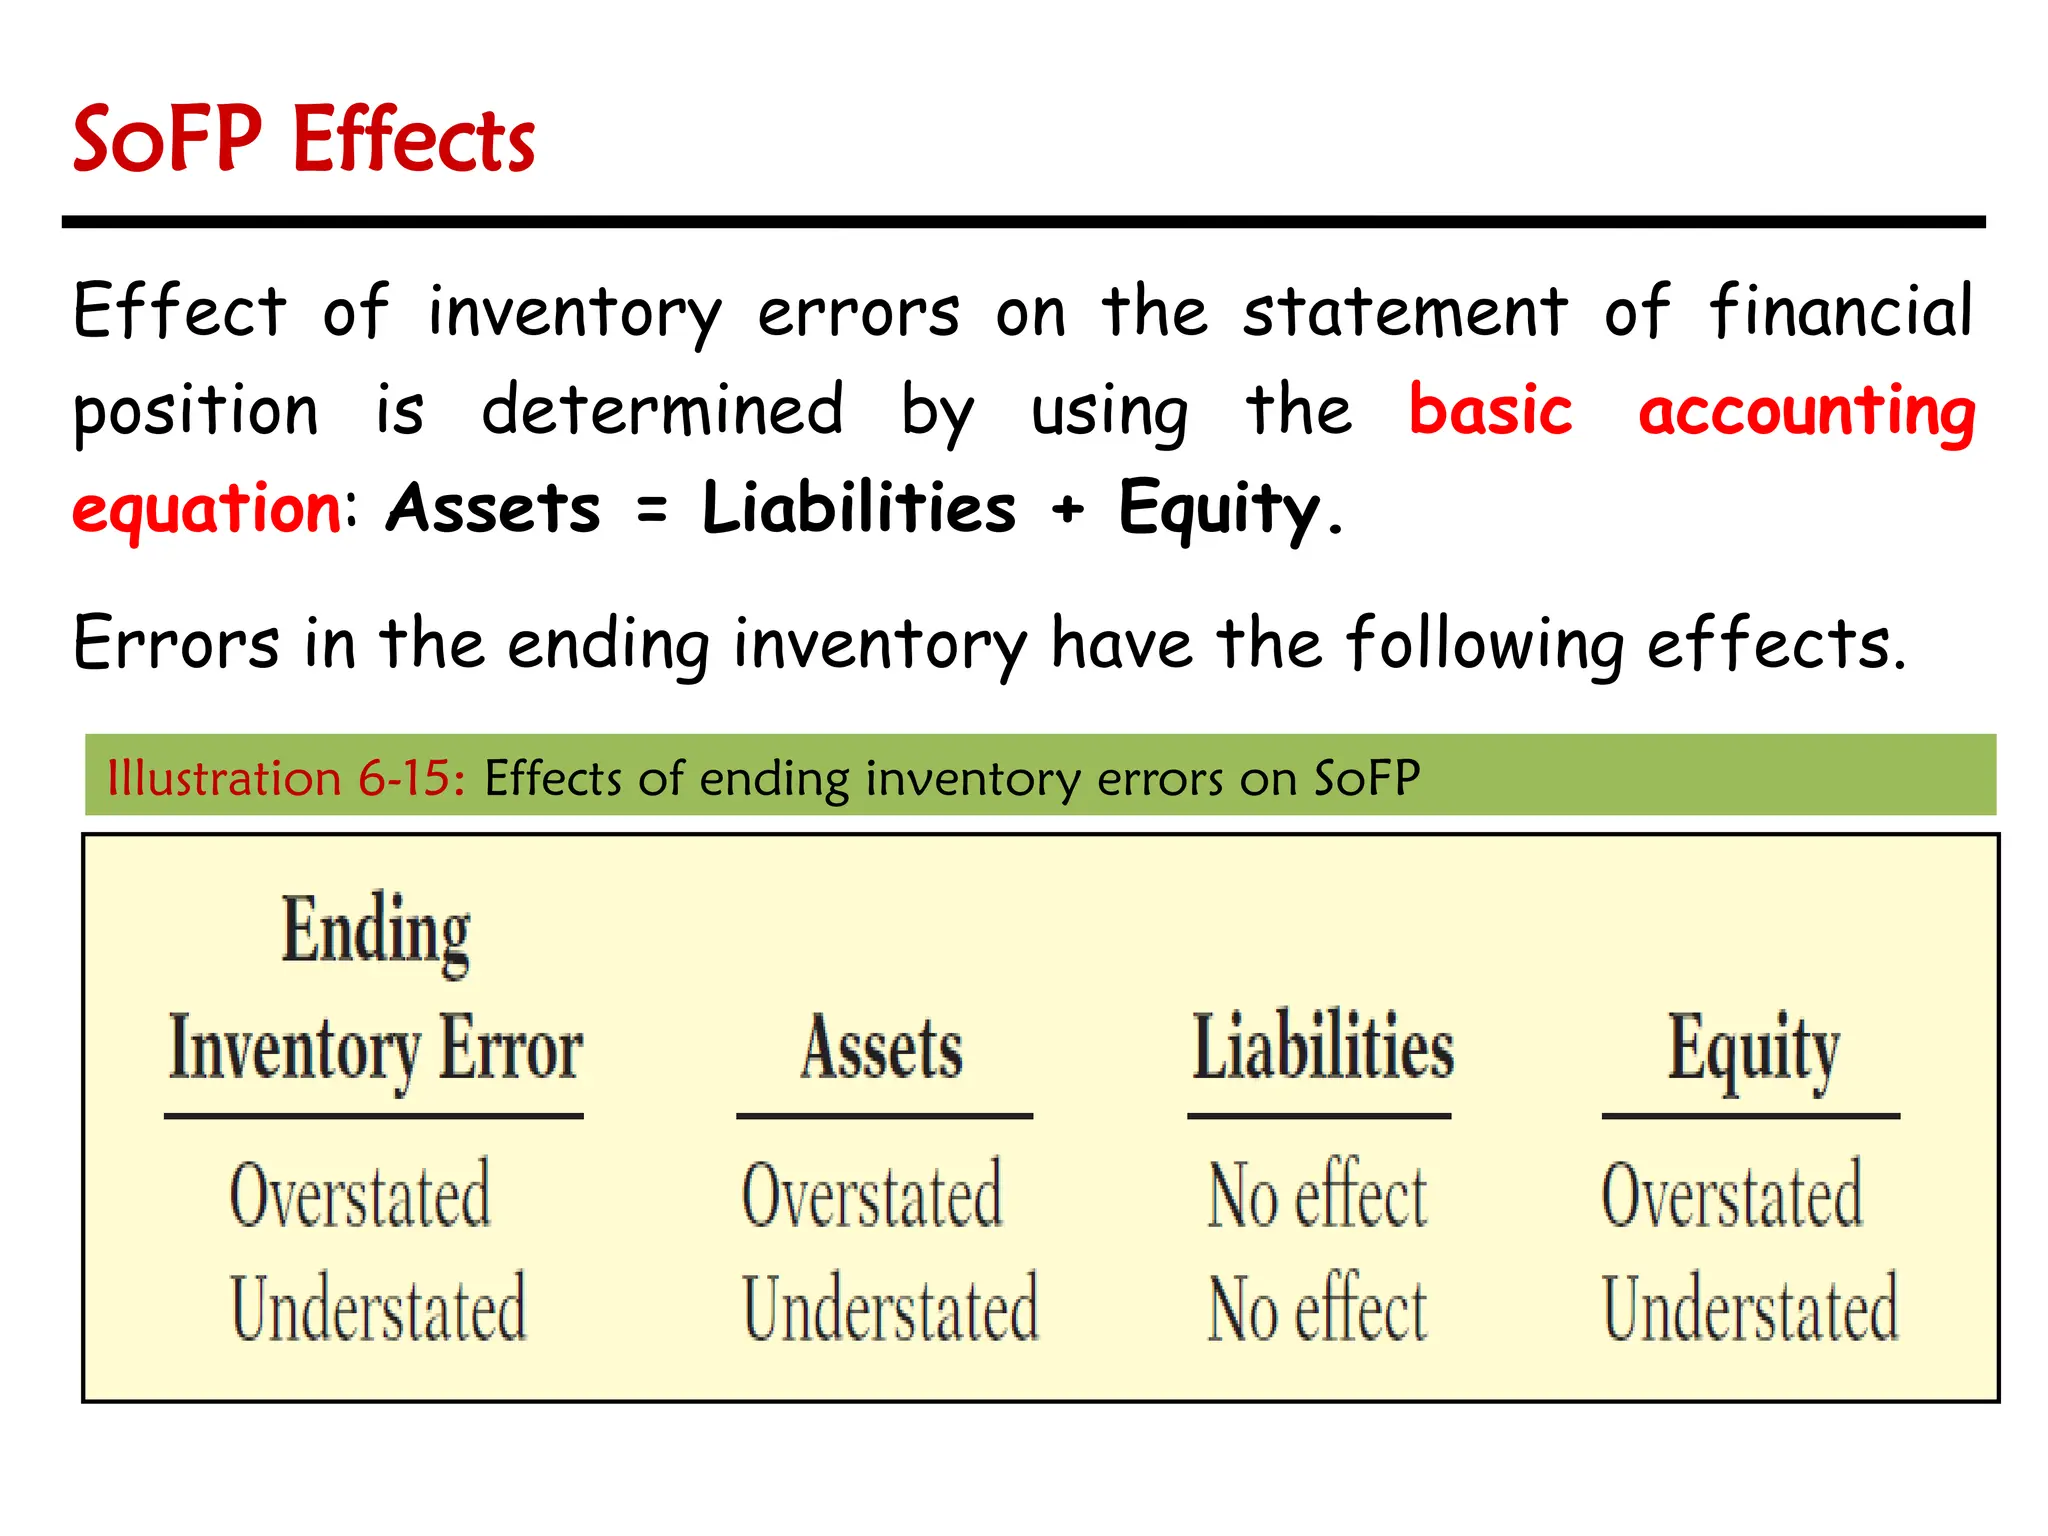
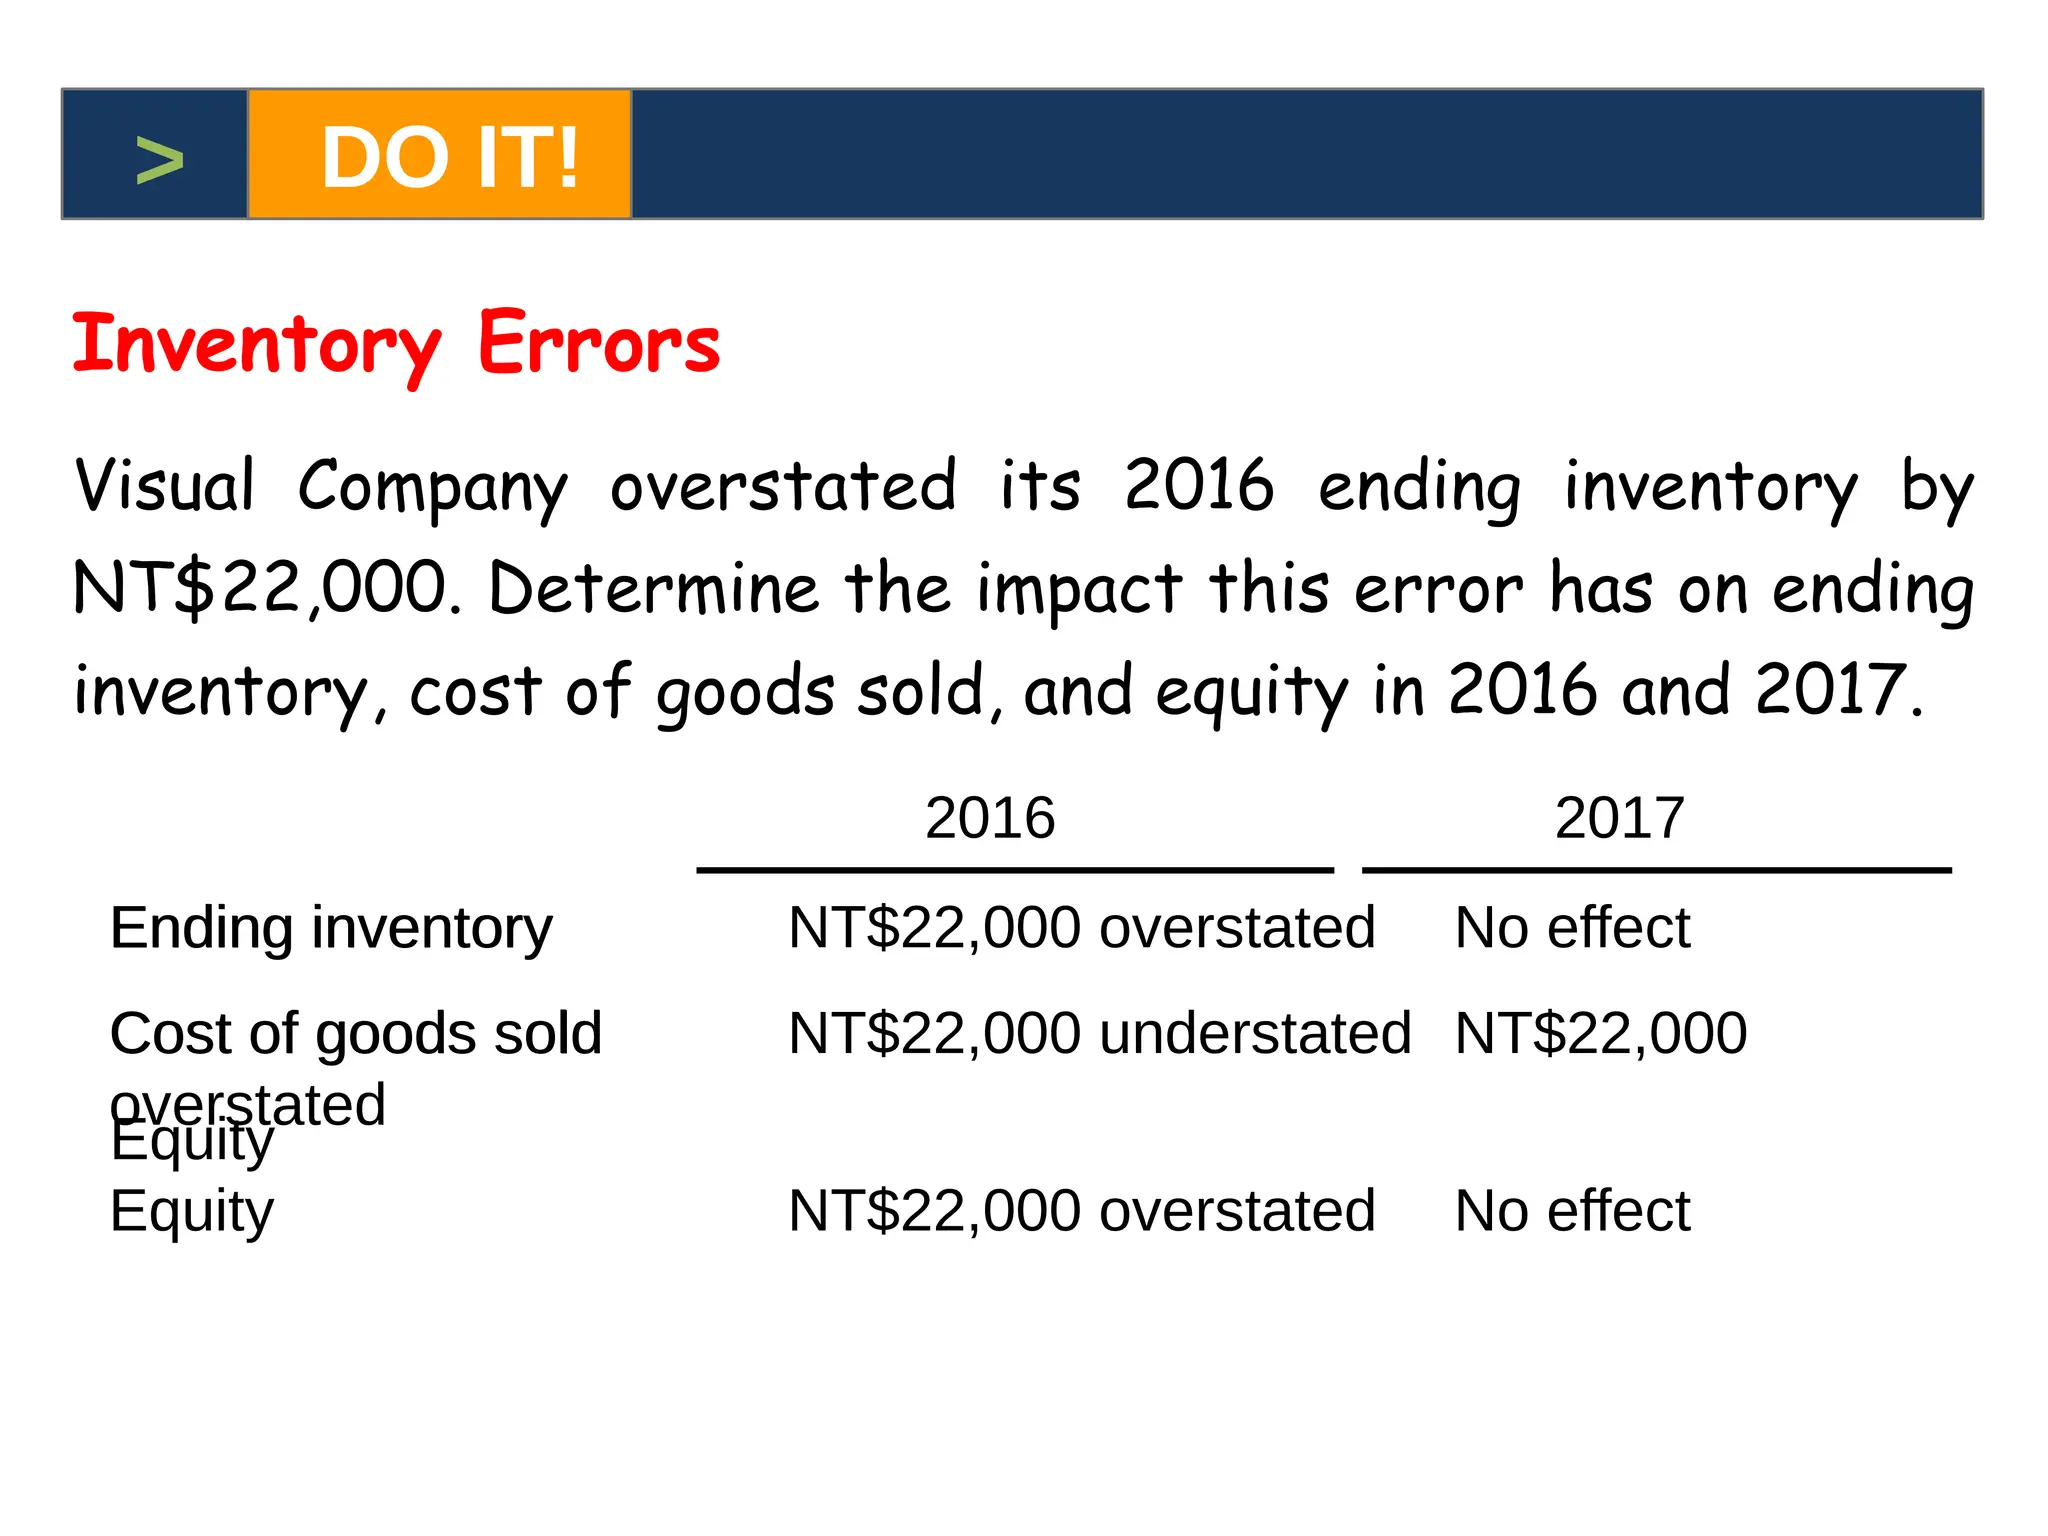
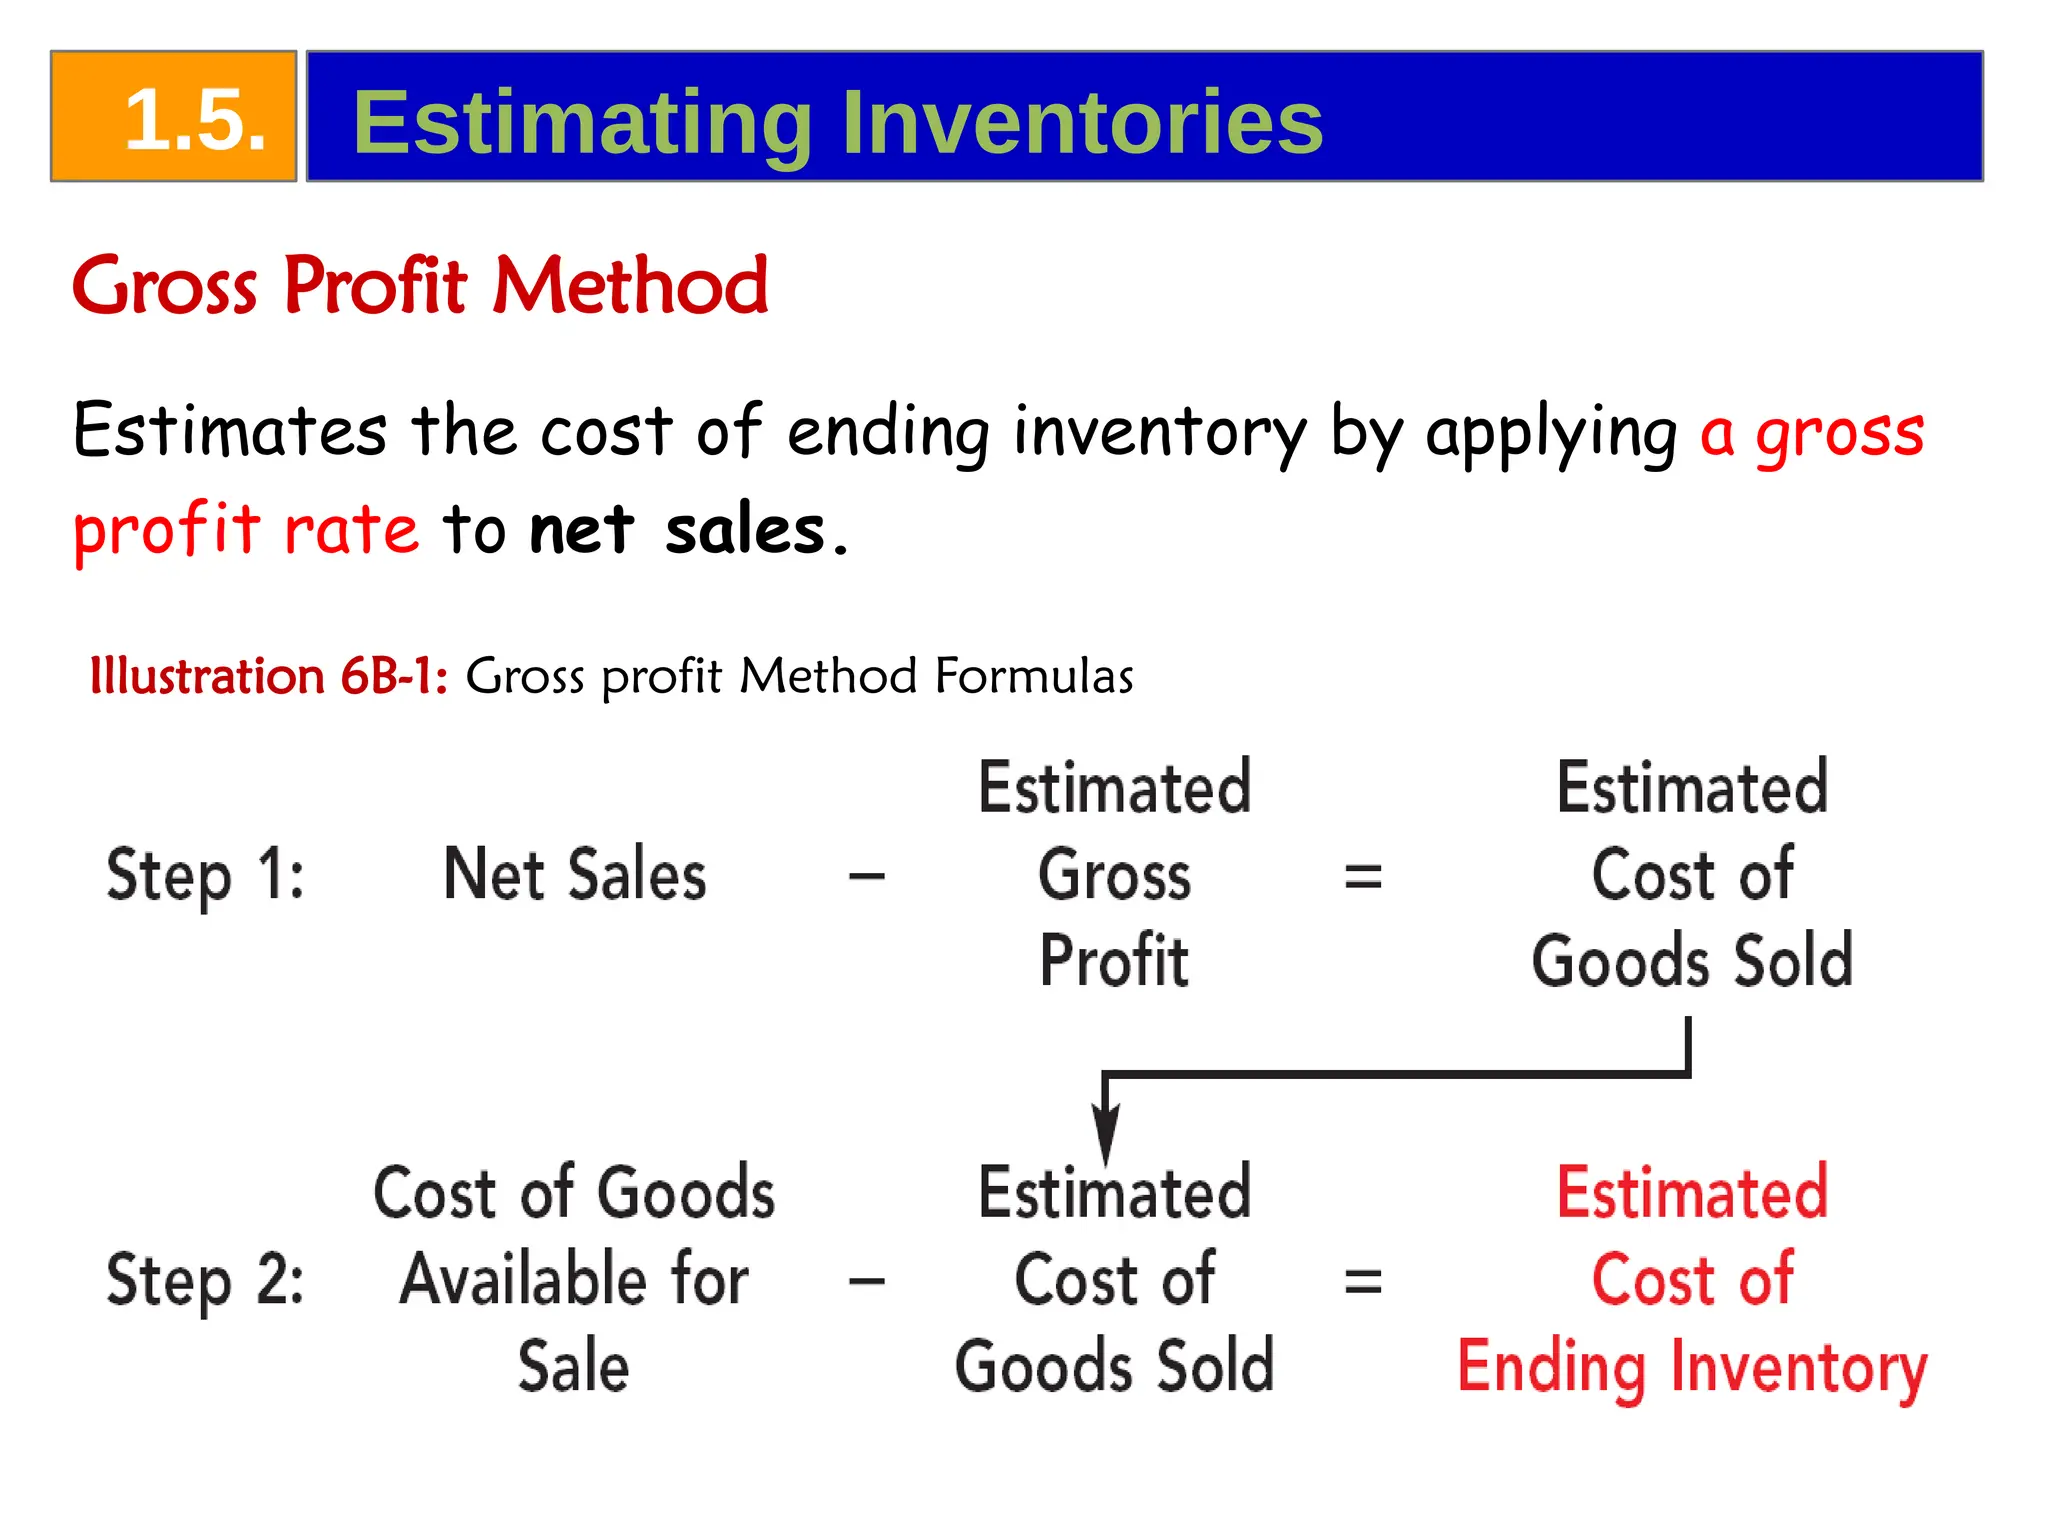
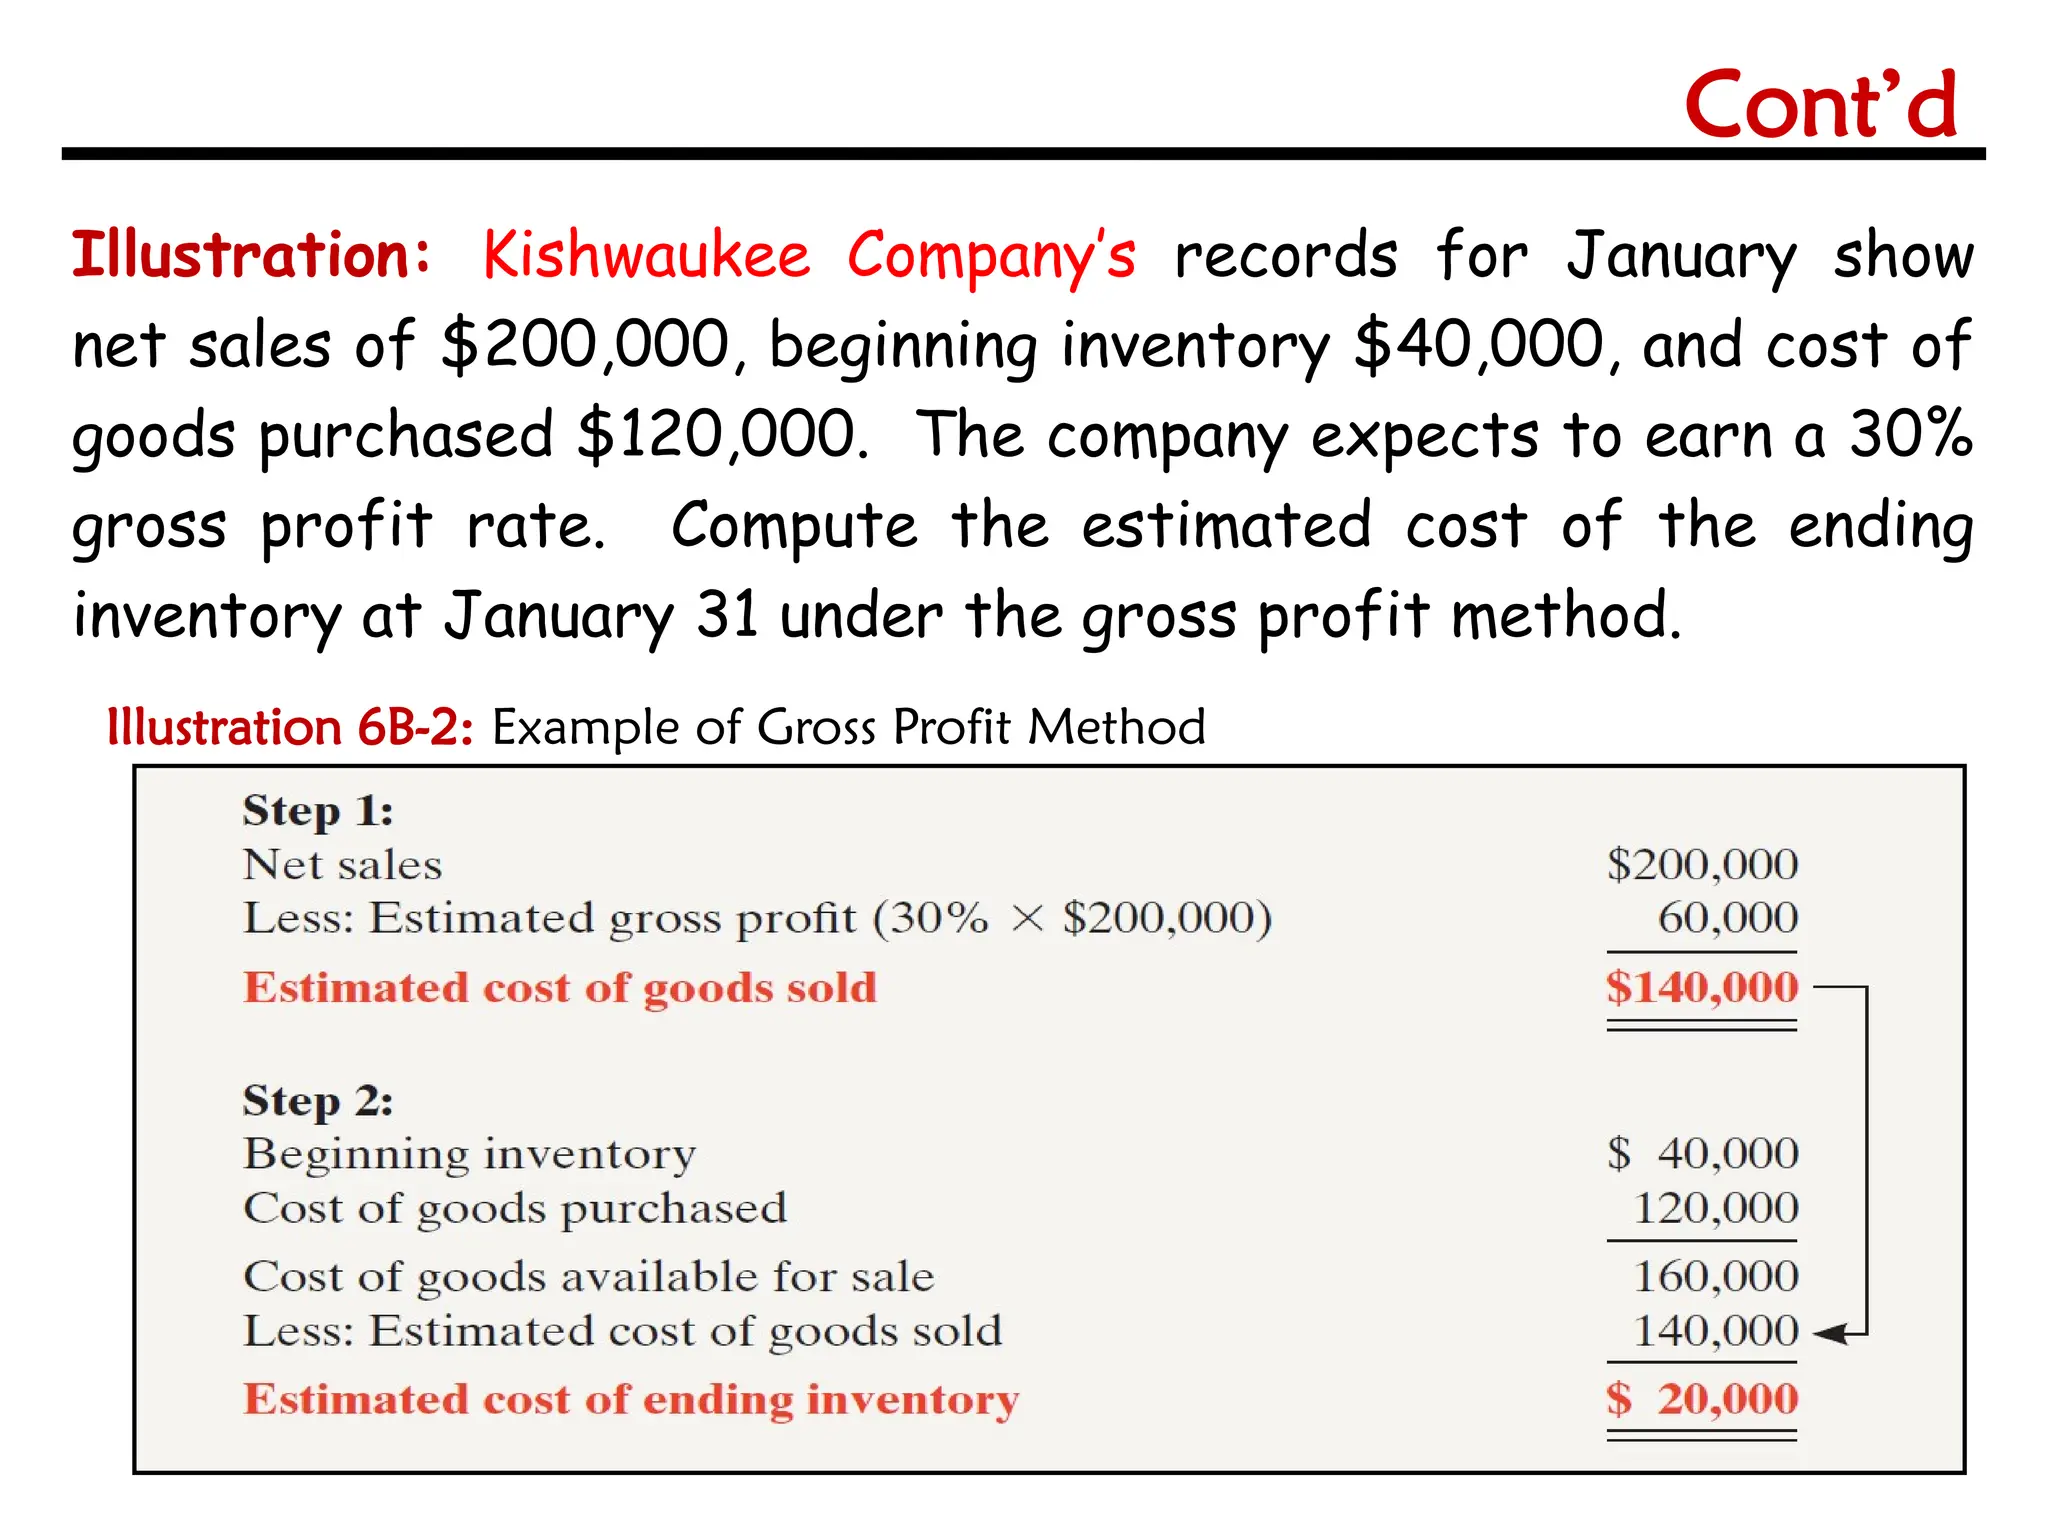
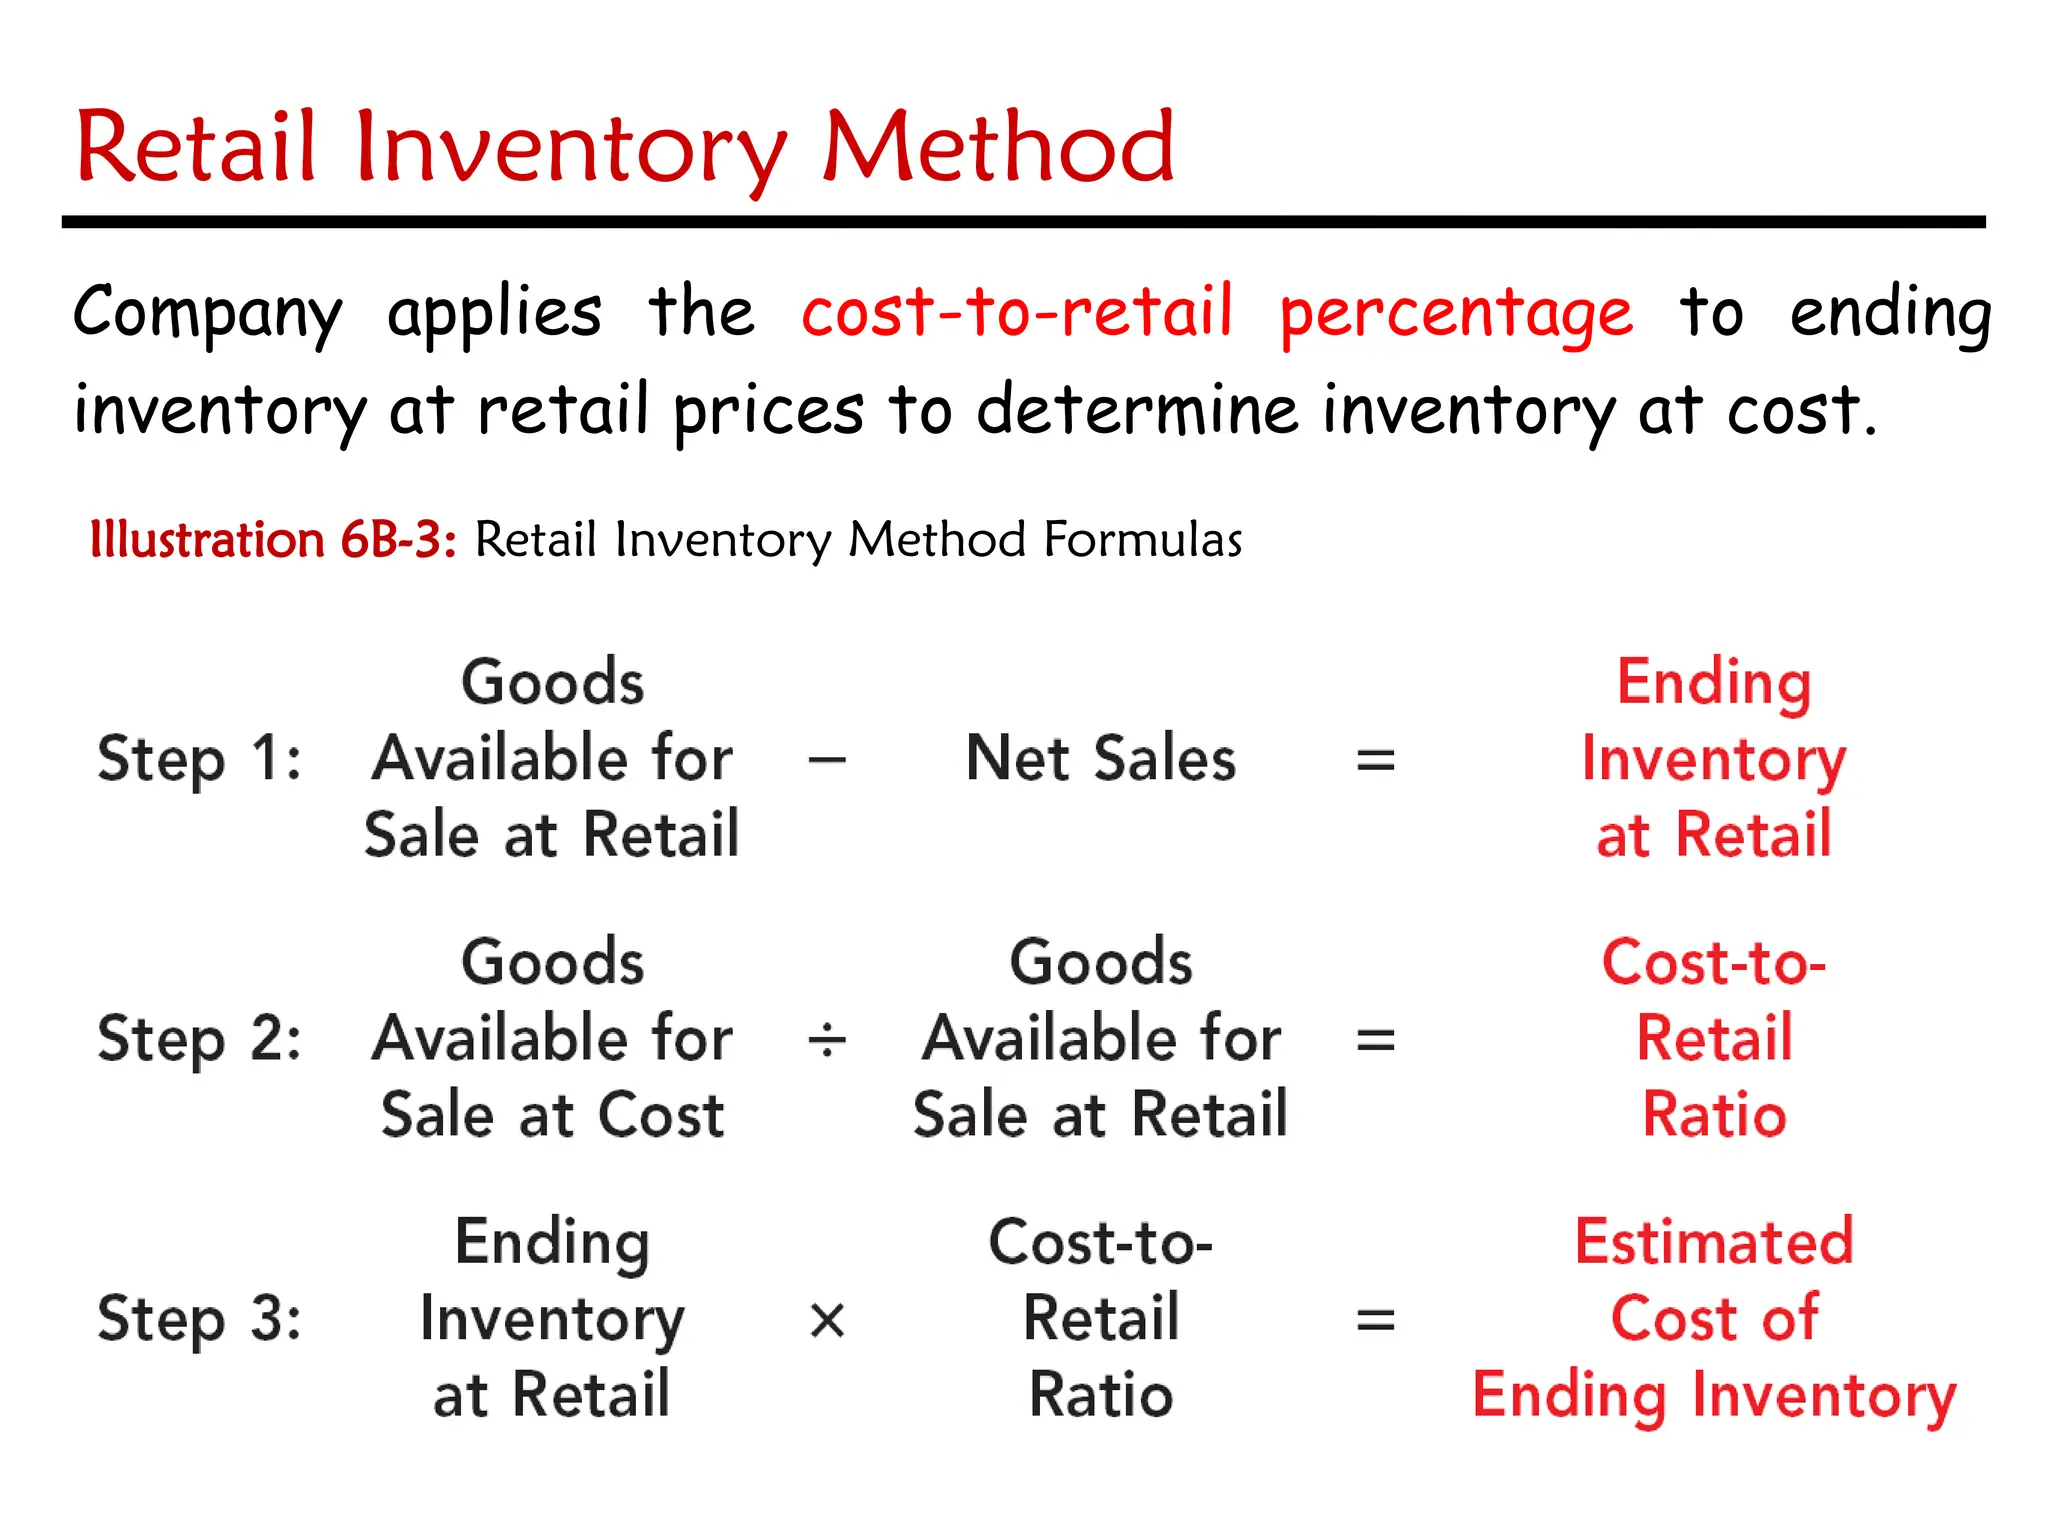
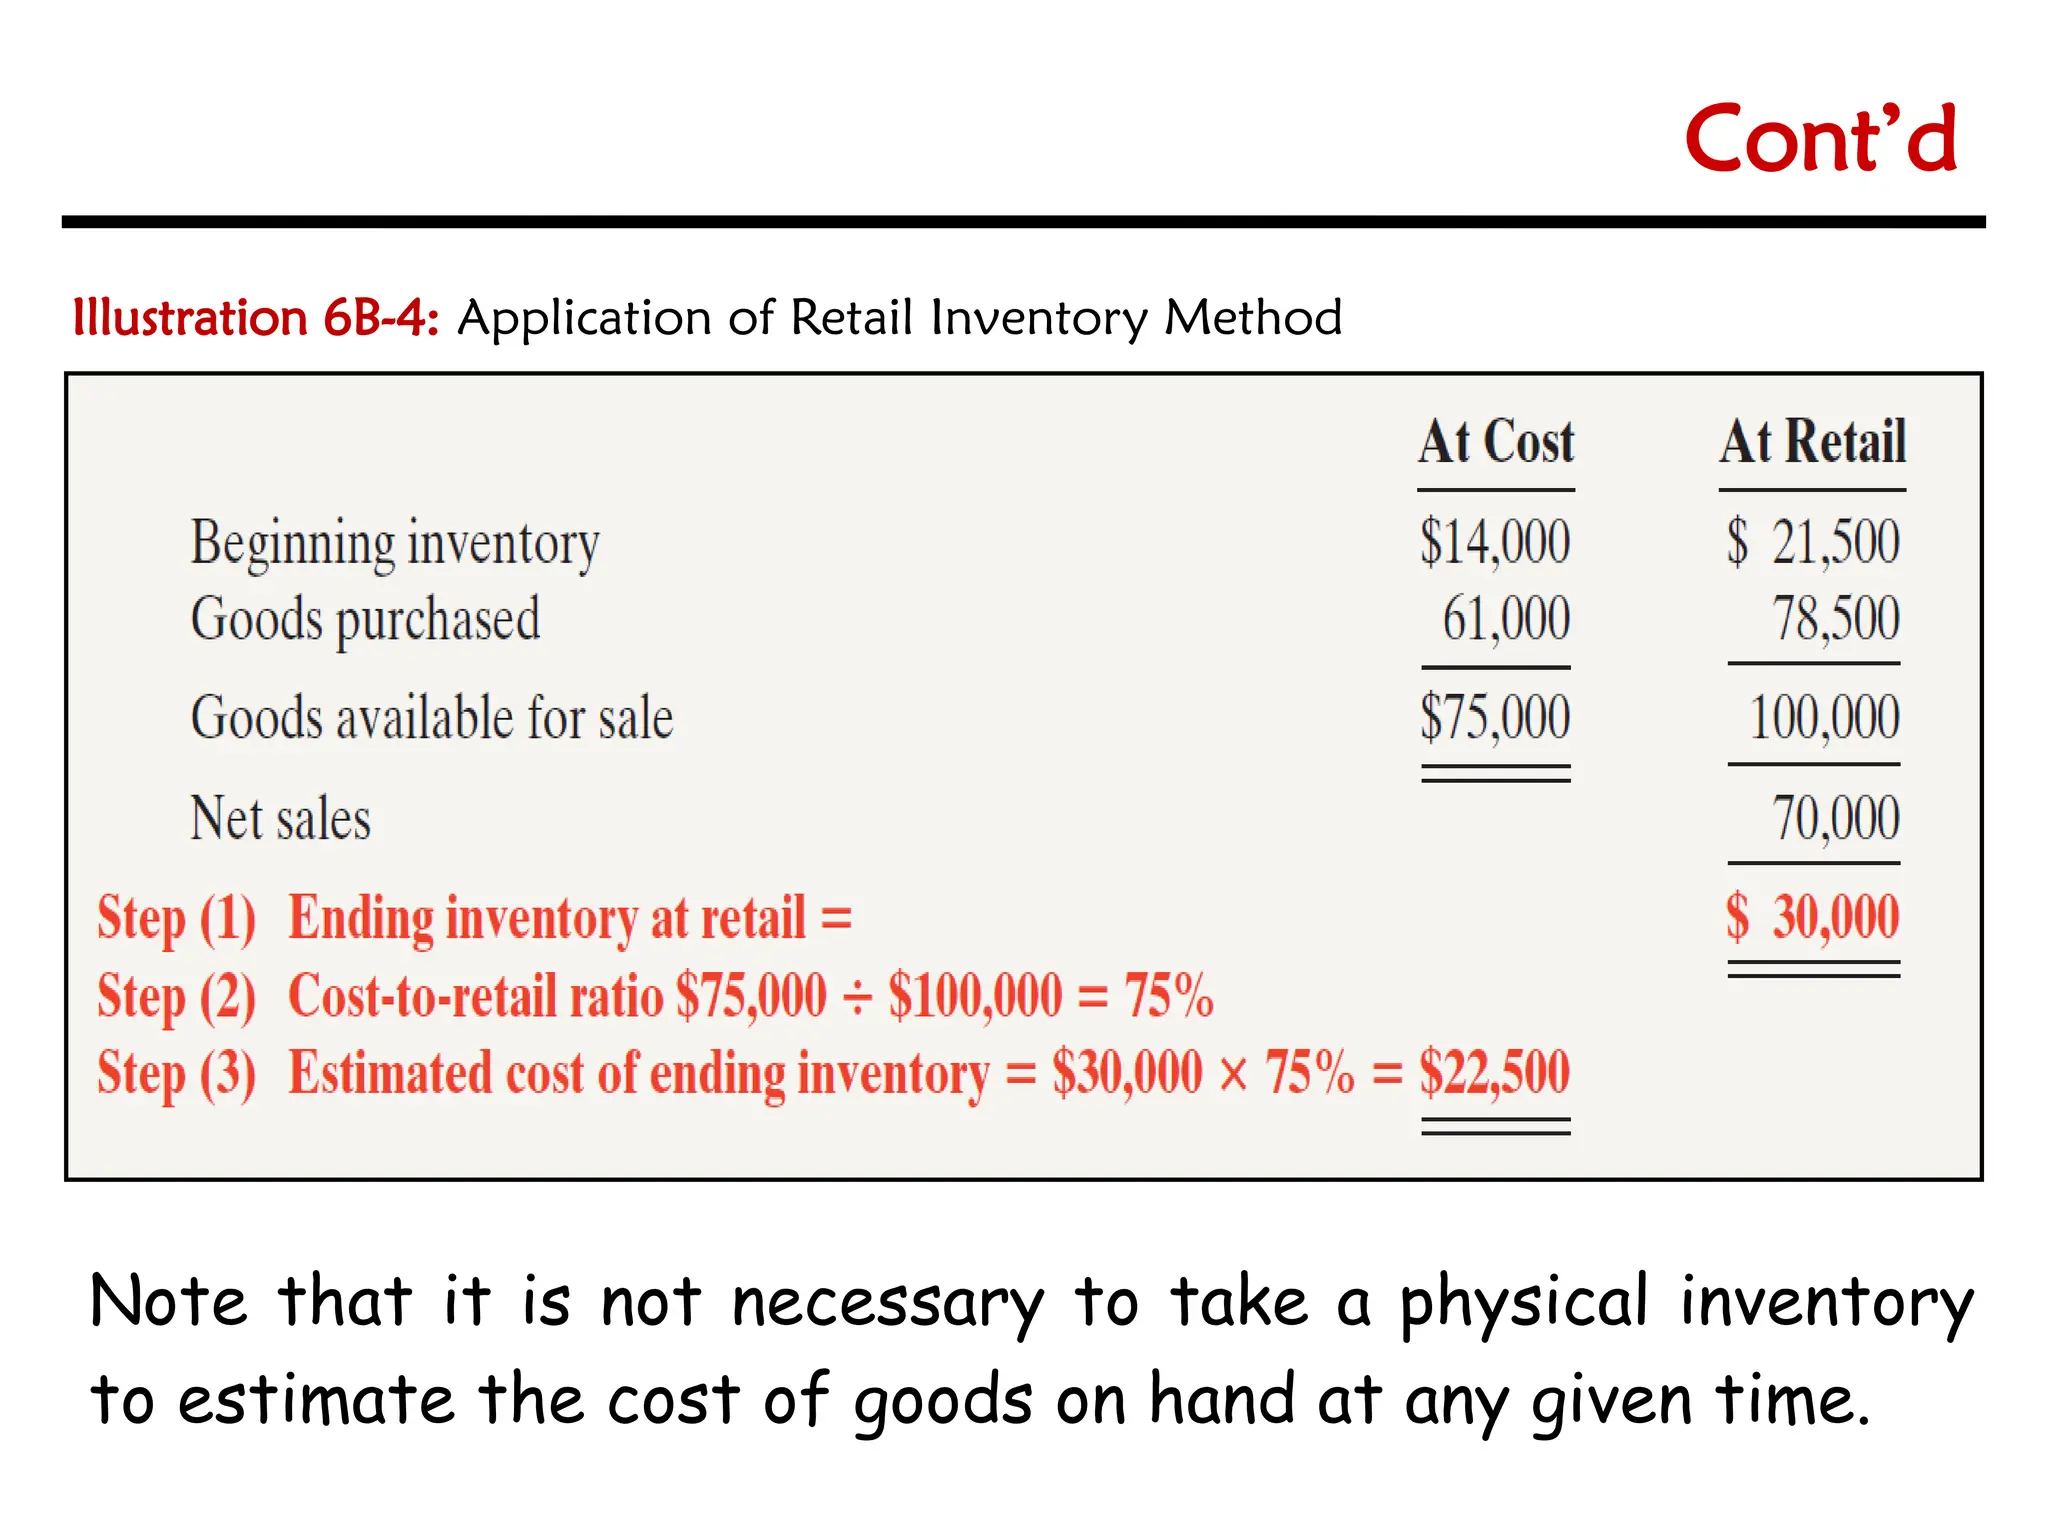
Chapter One
Inventories
6-2
6-2
One Classification:
 Merchandise Inventory
Three Classifications:
 Raw Materials
 Work in Process
 Finished Goods
Merchandising Company Manufacturing Company
Helpful Hint: Regardless of
the classification, companies
report all inventories under
Current Assets on the SoFP
.
Classifying Inventory
Classification of Inventories
1.1.
Inventories are asset items held for sale in the ordinary
course of business, or goods to be used in the production
of goods to be sold.
6-3
6-3
Physical Inventory taken for two reasons:
Perpetual System
1. Check accuracy of inventory records.
2. Determine amount of inventory lost due to wasted raw
materials, shoplifting, or employee theft.
Periodic System
3. Determine the inventory on hand.
4. Determine the cost of goods sold for the period.
Determining Inventory Quantities
1.2.
No matter whether they are using a periodic or perpetual
inventory system, all companies need to determine inventory
quantities at the end of the accounting period.
6-4
6-4
Involves counting, weighing, or measuring each kind of
inventory on hand.
Companies often “take inventory”
 when the business is closed or
business is slow.
 at the end of the accounting period.
Taking a Physical Inventory
Cont’d
Determining inventory quantities involves two steps:
(1) taking a physical inventory of goods on hand and
(2) determining the ownership of goods.
6-5
6-5
GOODS IN TRANSIT
 Purchased goods not yet received.
 Sold goods not yet delivered.
Goods in transit should be included in the inventory
of the company that has legal title to the goods. Legal
title is determined by the terms of sale.
Determining Ownership of Goods
Cont’d
6-6
6-6
Illustration 6-2 Terms of sale
Goods In Transit
Ownership of the goods
passes to the buyer when
the public carrier accepts
the goods from the
seller.
Ownership of the goods
remains with the seller
until the goods reach the
buyer.
Cont’d
6-7
6-7
Goods in transit should be included in the inventory of the
buyer when the:
a. public carrier accepts the goods from the seller.
b. goods reach the buyer.
c. terms of sale are FOB destination.
d. terms of sale are FOB shipping point.
Question # 1:
Cont’d
6-8
6-8
CONSIGNED GOODS
To hold the goods of other parties and try to sell
the goods for them for a fee, but without taking
ownership of the goods.
Many car, boat, and antique dealers sell goods on
consignment, why?
Cont’d
6-9
6-9
Deng Yaping Company completed its inventory count. It
arrived at a total inventory value of ¥200,000. You have
been given the information listed below. Discuss how this
information affects the reported cost of inventory.
1. Deng Yaping included in the inventory goods held on
consignment for Falls Co., costing ¥15,000.
2. The company did not include in the count purchased
goods of ¥10,000, which were in transit (terms:
FOB shipping point).
3. The company did not include in the count inventory
that had been sold with a cost of ¥12,000, which
was in transit (terms: FOB shipping point).
> DO IT!
6-10
6-10
Inventory is accounted for at cost.
 Cost includes all expenditures necessary to acquire
goods and place them in a condition ready for sale.
 Unit costs are applied to quantities to compute the
total cost of the inventory and the cost of goods
sold using the following costing methods:
► Specific identification
► First-in, first-out (FIFO)
► Average-cost
Cost Flow
Assumptions
Inventory Costing Methods
1.3.
Illustration: Crivitz TV Company purchases three identical
50-inch TVs on different dates at costs of £700, £750,
and £800. During the year Crivitz sold two sets at £1,200
each. These facts are summarized below.
Illustration 6-3: Data for Inventory Costing Example
Cont’d
If Crivitz sold the TVs it purchased on February 3 and May
22, then its cost of goods sold is £1,500 (£700 + £800),
and its ending inventory is £750.
1.3.1. Specific Identification
Illustration 6-4: Specific Identification Method
6-13
6-13
Actual physical flow costing method in which items
still in inventory are specifically costed to arrive at
the total cost of the ending inventory.
 Practice is relatively rare.
 Most companies make
assumptions (cost flow
assumptions) about which
units were sold.
Cont’d
There are two assumed cost flow methods:
1. First-in, first-out (FIFO)
2. Average-cost
Cost flow does not need be consistent with the
physical movement of the goods.
1.3.2. Cost Flow Assumptions
6-15
6-15
Data for Lin Electronics’ Astro condensers.
(Beginning Inventory + Purchases) - Ending Inventory = Cost of Goods Sold
Illustration 6-5
Cont’d
6-16
6-16
 Costs of the earliest goods purchased are the
first to be recognized in determining cost of
goods sold.
 Often parallels actual physical flow of
merchandise.
 Companies obtain the cost of the ending inventory
by taking the unit cost of the most recent
purchase and working backward until all units of
inventory have been costed.
FIRST
-IN, FIRST
-OUT (FIFO)
Cont’d
6-17
6-17
Illustration 6-6: Allocation of costs—FIFO method
Cont’d
6-18
6-18
• HELPFUL HINT
Another way of thinking about the calculation of FIFO
ending inventory is the LISH assumption—last in still here.
Cont’d
Illustration 6-6: Allocation of costs—FIFO method
6-19
6-19
 Allocates cost of goods available for sale on the
basis of weighted-average unit cost incurred.
 Applies weighted-average unit cost to the units on
hand to determine cost of the ending inventory.
AVERAGE-COST
Illustration 6-8: Formula for weighted-average unit cost
Cont’d
6-20
6-20
Cont’d
Illustration 6-9 Allocation of costs—Average-Cost Method
6-21
6-21
Illustration 6-11
Cont’d
Illustration 6-9 Allocation of costs—Average-Cost Method
6-22
6-22
The accounting records of Shumway Ag Implement
show the following.
Beginning Inventory 4,000 units at £ 3
Purchases 6,000 units at £ 4
Sales 7,000 units at £12
Determine the cost of goods sold during the period
under a periodic inventory system using:
(a) the FIFO method and
(b) the average-cost method.
> DO IT!
6-23
6-23
Cont’d
Assuming the Perpetual Inventory System, compute CGS and
Ending Inventory under FIFO and Average-cost.
1.3.3. Inventory CF Methods in Perpetual Inventory Systems
Data for Lin Electronics’ Astro condensers. Illustration 6A-1
Cost of Goods Sold Ending Inventory
First-In-First-Out (FIFO)
Illustration 6A-2: Perpetual System—FIFO
Average-Cost
Illustration 6A-3: Perpetual System—Average-cost method
Cost of Goods Sold Ending Inventory
Cont’d
6-28
6-28
Either of the two cost flow assumptions is acceptable for
use. For example,
 adidas (DEU) and Lenovo (CHN) use the average-cost
method, whereas
 Syngenta Group (CHE) and Nokia (FIN) use FIFO.
A recent survey of IFRS companies, approximately
► 60% use the average-cost method,
► 40% use FIFO, and
► 23% use both for different parts of their
inventory.
FS and Tax Effects of Cost Flow Methods
6-29
6-29
Illustration 6-10: Comparative effects of cost flow methods
INCOME STATEMENT EFFECTS
6-30
6-30
 A major advantage of the FIFO method is that in
a period of inflation, the costs allocated to ending
inventory will approximate their current cost.
 A major shortcoming of the average-cost method
is that in a period of inflation, the costs allocated
to ending inventory may be understated in terms
of current cost.
SoFP EFFECTS
6-31
6-31
 Both inventory and net income are higher when
companies use FIFO in a period of inflation.
 Average-cost results in the lower income taxes
(because of lower net income) during times of
rising prices.
TAX EFFECTS
6-32
6-32
 Method should be used consistently, enhances
comparability.
 Although consistency is preferred, a company
may change its inventory costing method.
Using Cost Flow Methods Consistently
6-33
6-33
In periods of rising prices, average-cost will produce:
a. higher net income than FIFO.
b. the same net income as FIFO.
c. lower net income than FIFO.
d. NI equal to the specific identification method.
LO 3
Question # 2:
Cont’d
6-34
6-34
Factors that affect the selection of an inventory costing
method do not include:
a. tax effects.
b. statement of financial position effects.
c. income statement effects.
d. perpetual vs. periodic inventory system.
Question # 3:
Cont’d
6-35
6-35
When the value of inventory is lower than its cost
 companies must “write down” the inventory to
its net realizable value.
Net realizable value: Amount that a company
expects to realize (receive from the sale of
inventory).
1.3.4. Lower-of-Cost-or-Net Realizable Value
6-36
6-36
Illustration: Assume that Gao TV has the following lines of
merchandise with costs and market values as indicated.
Illustration 6-11: Computation of lower-of-cost-or-net realizable value
Cont’d
LCNRV Basis
Tracy Company sells three different types of home heating
stoves (wood, gas, and pellet). The cost and net realizable
value of its inventory of stoves are as follows.
Total inventory value is the sum of these amounts, NT$430,000.
> DO IT!
Determine the value of the company’s inventory under the
lower-of-cost-or-net realizable value approach.
 Unfortunately, errors occasionally occur in
accounting for inventory.
 In some cases, errors are caused by failure to
count or price inventory correctly.
 In other cases, errors occur because companies
do not properly recognize the transfer of legal
title to goods that are in transit.
 When errors occur, they affect both the
Income Statement and SoFP.
Inventory Errors
1.4.
Inventory errors affect the computation of Cost of Goods Sold
and Net Income in two periods.
Illustration 6-12: Formula for cost of goods sold
Income Statement Effects
Illustration 6-13: Effects of inventory errors on current year’s income statement
 An error in ending inventory of the current
period will have a reverse effect on net income
of the next accounting period.
 Over the two years, the total net income is
correct because the errors offset each other.
 Ending inventory depends entirely on the
accuracy of taking and costing the inventory.
 Illustration 6-13 shows this effect.
Cont’d
Illustration 6-13: Effects of Inventory Errors on Two Years’ Income Statements
 As you study the illustration, you will see that the
reverse effect comes from the fact that
understating ending inventory in 2013 results in
understating beginning inventory in 2014 and
overstating net income in 2014.
 Over the two years, though, total net income is
correct because the errors offset each other.
 Notice that total income using incorrect data is
€35,000 (€22,000 + €13,000), which is the same as
the total income of €35,000 (€25,000 + €10,000)
using correct data.
Cont’d
 Also note in this example that an error in the
beginning inventory does not result in a
corresponding error in the ending inventory
for that period.
 The correctness of the ending inventory
depends entirely on the accuracy of taking
and costing the inventory at the SoFP date
under the periodic inventory system.
Cont’d
Atlantis Company’s ending inventory is understated by
NT$122,000. The effects of this error on the current
year’s CGS and Net Income, respectively, are:
a. understated, overstated.
b. overstated, understated.
c. overstated, overstated.
d. understated, understated.
Question # 4:
Cont’d
Effect of inventory errors on the statement of financial
position is determined by using the basic accounting
equation: Assets = Liabilities + Equity.
Errors in the ending inventory have the following effects.
Illustration 6-15: Effects of ending inventory errors on SoFP
SoFP Effects
Ending inventory
Cost of goods sold
Equity
Ending inventory NT$22,000 overstated No effect
Cost of goods sold NT$22,000 understated NT$22,000
overstated
Equity NT$22,000 overstated No effect
Inventory Errors
Visual Company overstated its 2016 ending inventory by
NT$22,000. Determine the impact this error has on ending
inventory, cost of goods sold, and equity in 2016 and 2017.
> DO IT!
2016 2017
Estimates the cost of ending inventory by applying a gross
profit rate to net sales.
Gross Profit Method
Illustration 6B-1: Gross profit Method Formulas
Estimating Inventories
1.5.
Illustration: Kishwaukee Company’s records for January show
net sales of $200,000, beginning inventory $40,000, and cost of
goods purchased $120,000. The company expects to earn a 30%
gross profit rate. Compute the estimated cost of the ending
inventory at January 31 under the gross profit method.
Illustration 6B-2: Example of Gross Profit Method
Cont’d
Company applies the cost-to-retail percentage to ending
inventory at retail prices to determine inventory at cost.
Retail Inventory Method
Illustration 6B-3: Retail Inventory Method Formulas
Note that it is not necessary to take a physical inventory
to estimate the cost of goods on hand at any given time.
Cont’d
Illustration 6B-4: Application of Retail Inventory Method
The End of Chapter 1
Thank You!!!

Fundamentals of Accounting II, Chapter 1.pptx

  • 1.
  • 2.
    6-2 6-2 One Classification:  MerchandiseInventory Three Classifications:  Raw Materials  Work in Process  Finished Goods Merchandising Company Manufacturing Company Helpful Hint: Regardless of the classification, companies report all inventories under Current Assets on the SoFP . Classifying Inventory Classification of Inventories 1.1. Inventories are asset items held for sale in the ordinary course of business, or goods to be used in the production of goods to be sold.
  • 3.
    6-3 6-3 Physical Inventory takenfor two reasons: Perpetual System 1. Check accuracy of inventory records. 2. Determine amount of inventory lost due to wasted raw materials, shoplifting, or employee theft. Periodic System 3. Determine the inventory on hand. 4. Determine the cost of goods sold for the period. Determining Inventory Quantities 1.2. No matter whether they are using a periodic or perpetual inventory system, all companies need to determine inventory quantities at the end of the accounting period.
  • 4.
    6-4 6-4 Involves counting, weighing,or measuring each kind of inventory on hand. Companies often “take inventory”  when the business is closed or business is slow.  at the end of the accounting period. Taking a Physical Inventory Cont’d Determining inventory quantities involves two steps: (1) taking a physical inventory of goods on hand and (2) determining the ownership of goods.
  • 5.
    6-5 6-5 GOODS IN TRANSIT Purchased goods not yet received.  Sold goods not yet delivered. Goods in transit should be included in the inventory of the company that has legal title to the goods. Legal title is determined by the terms of sale. Determining Ownership of Goods Cont’d
  • 6.
    6-6 6-6 Illustration 6-2 Termsof sale Goods In Transit Ownership of the goods passes to the buyer when the public carrier accepts the goods from the seller. Ownership of the goods remains with the seller until the goods reach the buyer. Cont’d
  • 7.
    6-7 6-7 Goods in transitshould be included in the inventory of the buyer when the: a. public carrier accepts the goods from the seller. b. goods reach the buyer. c. terms of sale are FOB destination. d. terms of sale are FOB shipping point. Question # 1: Cont’d
  • 8.
    6-8 6-8 CONSIGNED GOODS To holdthe goods of other parties and try to sell the goods for them for a fee, but without taking ownership of the goods. Many car, boat, and antique dealers sell goods on consignment, why? Cont’d
  • 9.
    6-9 6-9 Deng Yaping Companycompleted its inventory count. It arrived at a total inventory value of ¥200,000. You have been given the information listed below. Discuss how this information affects the reported cost of inventory. 1. Deng Yaping included in the inventory goods held on consignment for Falls Co., costing ¥15,000. 2. The company did not include in the count purchased goods of ¥10,000, which were in transit (terms: FOB shipping point). 3. The company did not include in the count inventory that had been sold with a cost of ¥12,000, which was in transit (terms: FOB shipping point). > DO IT!
  • 10.
    6-10 6-10 Inventory is accountedfor at cost.  Cost includes all expenditures necessary to acquire goods and place them in a condition ready for sale.  Unit costs are applied to quantities to compute the total cost of the inventory and the cost of goods sold using the following costing methods: ► Specific identification ► First-in, first-out (FIFO) ► Average-cost Cost Flow Assumptions Inventory Costing Methods 1.3.
  • 11.
    Illustration: Crivitz TVCompany purchases three identical 50-inch TVs on different dates at costs of £700, £750, and £800. During the year Crivitz sold two sets at £1,200 each. These facts are summarized below. Illustration 6-3: Data for Inventory Costing Example Cont’d
  • 12.
    If Crivitz soldthe TVs it purchased on February 3 and May 22, then its cost of goods sold is £1,500 (£700 + £800), and its ending inventory is £750. 1.3.1. Specific Identification Illustration 6-4: Specific Identification Method
  • 13.
    6-13 6-13 Actual physical flowcosting method in which items still in inventory are specifically costed to arrive at the total cost of the ending inventory.  Practice is relatively rare.  Most companies make assumptions (cost flow assumptions) about which units were sold. Cont’d
  • 14.
    There are twoassumed cost flow methods: 1. First-in, first-out (FIFO) 2. Average-cost Cost flow does not need be consistent with the physical movement of the goods. 1.3.2. Cost Flow Assumptions
  • 15.
    6-15 6-15 Data for LinElectronics’ Astro condensers. (Beginning Inventory + Purchases) - Ending Inventory = Cost of Goods Sold Illustration 6-5 Cont’d
  • 16.
    6-16 6-16  Costs ofthe earliest goods purchased are the first to be recognized in determining cost of goods sold.  Often parallels actual physical flow of merchandise.  Companies obtain the cost of the ending inventory by taking the unit cost of the most recent purchase and working backward until all units of inventory have been costed. FIRST -IN, FIRST -OUT (FIFO) Cont’d
  • 17.
    6-17 6-17 Illustration 6-6: Allocationof costs—FIFO method Cont’d
  • 18.
    6-18 6-18 • HELPFUL HINT Anotherway of thinking about the calculation of FIFO ending inventory is the LISH assumption—last in still here. Cont’d Illustration 6-6: Allocation of costs—FIFO method
  • 19.
    6-19 6-19  Allocates costof goods available for sale on the basis of weighted-average unit cost incurred.  Applies weighted-average unit cost to the units on hand to determine cost of the ending inventory. AVERAGE-COST Illustration 6-8: Formula for weighted-average unit cost Cont’d
  • 20.
    6-20 6-20 Cont’d Illustration 6-9 Allocationof costs—Average-Cost Method
  • 21.
    6-21 6-21 Illustration 6-11 Cont’d Illustration 6-9Allocation of costs—Average-Cost Method
  • 22.
    6-22 6-22 The accounting recordsof Shumway Ag Implement show the following. Beginning Inventory 4,000 units at £ 3 Purchases 6,000 units at £ 4 Sales 7,000 units at £12 Determine the cost of goods sold during the period under a periodic inventory system using: (a) the FIFO method and (b) the average-cost method. > DO IT!
  • 23.
  • 24.
    Assuming the PerpetualInventory System, compute CGS and Ending Inventory under FIFO and Average-cost. 1.3.3. Inventory CF Methods in Perpetual Inventory Systems Data for Lin Electronics’ Astro condensers. Illustration 6A-1
  • 25.
    Cost of GoodsSold Ending Inventory First-In-First-Out (FIFO) Illustration 6A-2: Perpetual System—FIFO
  • 26.
    Average-Cost Illustration 6A-3: PerpetualSystem—Average-cost method Cost of Goods Sold Ending Inventory
  • 27.
  • 28.
    6-28 6-28 Either of thetwo cost flow assumptions is acceptable for use. For example,  adidas (DEU) and Lenovo (CHN) use the average-cost method, whereas  Syngenta Group (CHE) and Nokia (FIN) use FIFO. A recent survey of IFRS companies, approximately ► 60% use the average-cost method, ► 40% use FIFO, and ► 23% use both for different parts of their inventory. FS and Tax Effects of Cost Flow Methods
  • 29.
    6-29 6-29 Illustration 6-10: Comparativeeffects of cost flow methods INCOME STATEMENT EFFECTS
  • 30.
    6-30 6-30  A majoradvantage of the FIFO method is that in a period of inflation, the costs allocated to ending inventory will approximate their current cost.  A major shortcoming of the average-cost method is that in a period of inflation, the costs allocated to ending inventory may be understated in terms of current cost. SoFP EFFECTS
  • 31.
    6-31 6-31  Both inventoryand net income are higher when companies use FIFO in a period of inflation.  Average-cost results in the lower income taxes (because of lower net income) during times of rising prices. TAX EFFECTS
  • 32.
    6-32 6-32  Method shouldbe used consistently, enhances comparability.  Although consistency is preferred, a company may change its inventory costing method. Using Cost Flow Methods Consistently
  • 33.
    6-33 6-33 In periods ofrising prices, average-cost will produce: a. higher net income than FIFO. b. the same net income as FIFO. c. lower net income than FIFO. d. NI equal to the specific identification method. LO 3 Question # 2: Cont’d
  • 34.
    6-34 6-34 Factors that affectthe selection of an inventory costing method do not include: a. tax effects. b. statement of financial position effects. c. income statement effects. d. perpetual vs. periodic inventory system. Question # 3: Cont’d
  • 35.
    6-35 6-35 When the valueof inventory is lower than its cost  companies must “write down” the inventory to its net realizable value. Net realizable value: Amount that a company expects to realize (receive from the sale of inventory). 1.3.4. Lower-of-Cost-or-Net Realizable Value
  • 36.
    6-36 6-36 Illustration: Assume thatGao TV has the following lines of merchandise with costs and market values as indicated. Illustration 6-11: Computation of lower-of-cost-or-net realizable value Cont’d
  • 37.
    LCNRV Basis Tracy Companysells three different types of home heating stoves (wood, gas, and pellet). The cost and net realizable value of its inventory of stoves are as follows. Total inventory value is the sum of these amounts, NT$430,000. > DO IT! Determine the value of the company’s inventory under the lower-of-cost-or-net realizable value approach.
  • 38.
     Unfortunately, errorsoccasionally occur in accounting for inventory.  In some cases, errors are caused by failure to count or price inventory correctly.  In other cases, errors occur because companies do not properly recognize the transfer of legal title to goods that are in transit.  When errors occur, they affect both the Income Statement and SoFP. Inventory Errors 1.4.
  • 39.
    Inventory errors affectthe computation of Cost of Goods Sold and Net Income in two periods. Illustration 6-12: Formula for cost of goods sold Income Statement Effects Illustration 6-13: Effects of inventory errors on current year’s income statement
  • 40.
     An errorin ending inventory of the current period will have a reverse effect on net income of the next accounting period.  Over the two years, the total net income is correct because the errors offset each other.  Ending inventory depends entirely on the accuracy of taking and costing the inventory.  Illustration 6-13 shows this effect. Cont’d
  • 41.
    Illustration 6-13: Effectsof Inventory Errors on Two Years’ Income Statements
  • 42.
     As youstudy the illustration, you will see that the reverse effect comes from the fact that understating ending inventory in 2013 results in understating beginning inventory in 2014 and overstating net income in 2014.  Over the two years, though, total net income is correct because the errors offset each other.  Notice that total income using incorrect data is €35,000 (€22,000 + €13,000), which is the same as the total income of €35,000 (€25,000 + €10,000) using correct data. Cont’d
  • 43.
     Also notein this example that an error in the beginning inventory does not result in a corresponding error in the ending inventory for that period.  The correctness of the ending inventory depends entirely on the accuracy of taking and costing the inventory at the SoFP date under the periodic inventory system. Cont’d
  • 44.
    Atlantis Company’s endinginventory is understated by NT$122,000. The effects of this error on the current year’s CGS and Net Income, respectively, are: a. understated, overstated. b. overstated, understated. c. overstated, overstated. d. understated, understated. Question # 4: Cont’d
  • 45.
    Effect of inventoryerrors on the statement of financial position is determined by using the basic accounting equation: Assets = Liabilities + Equity. Errors in the ending inventory have the following effects. Illustration 6-15: Effects of ending inventory errors on SoFP SoFP Effects
  • 46.
    Ending inventory Cost ofgoods sold Equity Ending inventory NT$22,000 overstated No effect Cost of goods sold NT$22,000 understated NT$22,000 overstated Equity NT$22,000 overstated No effect Inventory Errors Visual Company overstated its 2016 ending inventory by NT$22,000. Determine the impact this error has on ending inventory, cost of goods sold, and equity in 2016 and 2017. > DO IT! 2016 2017
  • 47.
    Estimates the costof ending inventory by applying a gross profit rate to net sales. Gross Profit Method Illustration 6B-1: Gross profit Method Formulas Estimating Inventories 1.5.
  • 48.
    Illustration: Kishwaukee Company’srecords for January show net sales of $200,000, beginning inventory $40,000, and cost of goods purchased $120,000. The company expects to earn a 30% gross profit rate. Compute the estimated cost of the ending inventory at January 31 under the gross profit method. Illustration 6B-2: Example of Gross Profit Method Cont’d
  • 49.
    Company applies thecost-to-retail percentage to ending inventory at retail prices to determine inventory at cost. Retail Inventory Method Illustration 6B-3: Retail Inventory Method Formulas
  • 50.
    Note that itis not necessary to take a physical inventory to estimate the cost of goods on hand at any given time. Cont’d Illustration 6B-4: Application of Retail Inventory Method
  • 51.
    The End ofChapter 1 Thank You!!!

Editor's Notes