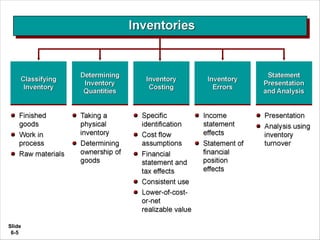
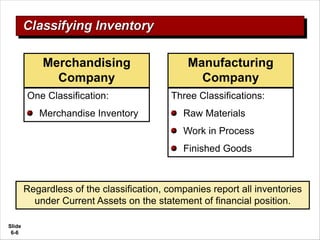
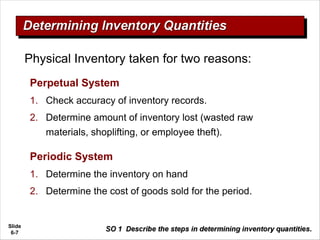
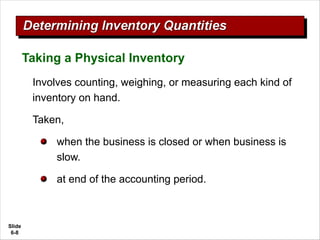
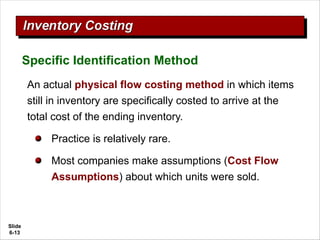
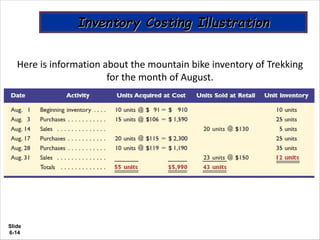
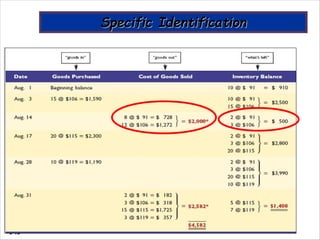
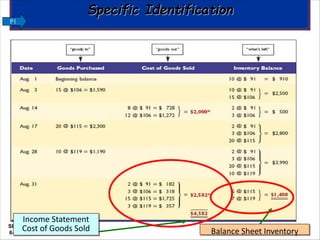
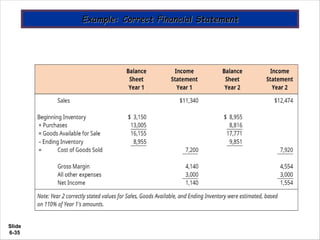
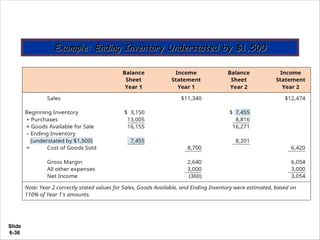
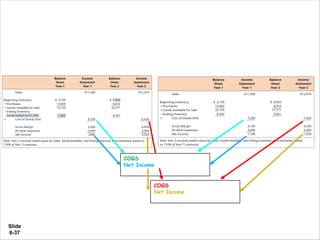
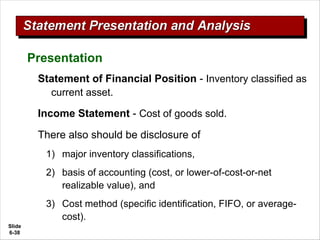
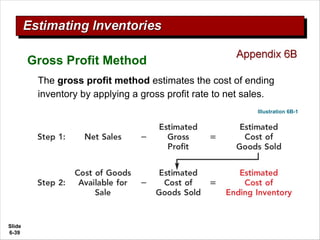
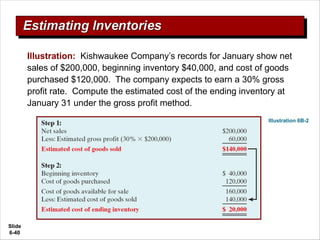
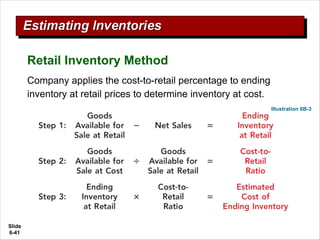
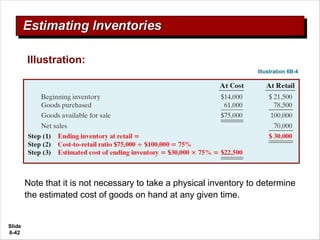
Slide
6-1
Inventories
Slide
6-2
Slide
6-3
Slide
6-4
Perpetual Inventory Method
Date Account Debit Credit
Inventory
Accounts Payable
$$$
$$$
Accounts Receivable
Sales
COGS
Inventory
$$$
SSS
SSS
SSS
Ordering
Inventory
Selling
Inventory
Periodic Inventory Method
Date Account Debit Credit
Purchases
Accounts Payable
$$$
$$$
Accounts Receivable
Sales
$$$
SSS
Slide
6-5
Slide
6-6
One Classification:
Merchandise Inventory
Three Classifications:
Raw Materials
Work in Process
Finished Goods
Merchandising
Company
Manufacturing
Company
Regardless of the classification, companies report all inventories
under Current Assets on the statement of financial position.
Slide
6-7
Physical Inventory taken for two reasons:
Perpetual System
1. Check accuracy of inventory records.
2. Determine amount of inventory lost (wasted raw
materials, shoplifting, or employee theft).
Periodic System
1. Determine the inventory on hand
2. Determine the cost of goods sold for the period.
Slide
6-8
Involves counting, weighing, or measuring each kind of
inventory on hand.
Taken,
when the business is closed or when business is
slow.
at end of the accounting period.
Taking a Physical Inventory
Slide
6-9
Goods in Transit
Purchased goods not yet received.
Sold goods not yet delivered.
Determining Ownership of Goods
Goods in transit should be included in the inventory of the
company that has legal title to the goods. Legal title is
determined by the terms of sale.
Slide
6-10
Illustration 6-1
Ownership of the goods
passes to the buyer when
the public carrier accepts
the goods from the seller.
Ownership of the goods
remains with the seller until
the goods reach the buyer.
Goods in Transit
Slide
6-11
Consigned Goods
In some lines of business, it is common to hold the
goods of other parties and try to sell the goods for
them for a fee, but without taking ownership of
goods.
These are called consigned goods.
Determining Ownership of Goods
Slide
6-12
Unit costs can be applied to quantities on hand
using the following costing methods:
Specific Identification
First-in, first-out (FIFO)
Average-cost
Cost Flow
Assumptions
Slide
6-13
An actual physical flow costing method in which items
still in inventory are specifically costed to arrive at the
total cost of the ending inventory.
Practice is relatively rare.
Most companies make assumptions (Cost Flow
Assumptions) about which units were sold.
Specific Identification Method
Slide
6-14
Here is information about the mountain bike inventory of Trekking
for the month of August.
Slide
6-15
Slide
6-16
P1
Balance Sheet Inventory
Income Statement
Cost of Goods Sold
Slide
6-17
Earliest goods purchased are first to be sold.
Often parallels actual physical flow of merchandise.
Generally good business practice to sell oldest units
first.
“First-In-First-Out (FIFO)”
Slide
6-18
P1
Slide
6-19
P1
Slide
6-20
Allocates cost of goods available for sale on the
basis of weighted average unit cost incurred.
Assumes goods are similar in nature.
Applies weighted average unit cost to the units on
hand to determine cost of the ending inventory.
“Average-Cost”
Slide
6-21
Cost of Goods
Available for
Sale
Units on hand
on the date of
sale
÷
P1
Slide
6-22
P1
Slide
6-23
P1
Slide
6-24
Illustration 6-9
Financial Statement and Tax Effects
Income
Statement
Effects
Slide
6-25
Statement of Financial Statement Effects
Ø A major advantage of the FIFO method is that in a period
of inflation, the costs allocated to ending inventory will
approximate their current cost.
Ø A shortcoming of the average-cost method is that in a
period of inflation, the costs allocated to ending inventory
may be understated in terms of current cost.
Slide
6-26
Tax Effects
In a period of inflation:
Ø FIFO - inventory and net income higher.
Ø AVERAGE Cost - lower income taxes.
Slide
6-27
Using Cost Flow Methods Consistently
Method should be used consistently, enhances
comparability.
Although consistency is preferred, a company may
change its inventory costing method.
Slide
6-28
Lower-of-Cost-or-Net Realizable Value
When the value of inventory is lower than its cost
Companies can “write down” the inventory to its net
realizable value in the period in which the price
decline occurs.
Net realizable value refers to the net amount that a
company expects to realize (receive) from the sale of
inventory.
It is the estimated selling price in the ordinary course of
business, less the estimated costs of completion and
estimated selling expenses.
Slide
6-29
Illustration: Assume that Ken Tuckie TV has the following
lines of merchandise with costs and market values as
indicated.
Illustration 6-10
Lower-of-Cost-or-Net Realizable Value
Slide
6-30
Common Cause:
Failure to count or price inventory correctly.
Not properly recognizing the transfer of legal title to
goods in transit.
Errors affect both the income statement and
statement of financial position.
Slide
6-31
Inventory errors affect the computation of cost of goods
sold and net income.
Income Statement Effects
Illustration 6-12
Illustration 6-11
Slide
6-32
Inventory errors affect the computation of cost of goods sold
and net income in two periods.
An error in ending inventory of the current period will
have a reverse effect on net income of the next
accounting period.
Over the two years, the total net income is correct
because the errors offset each other.
The ending inventory depends entirely on the accuracy
of taking and costing the inventory.
Income Statement Effects
Slide
6-33
($3,000)
Net Income
understated
$3,000
Net Income
overstated
Combined income for 2-
year period is correct.
Illustration 6-13
Slide
6-34
Effect of inventory errors on the statement of financial
position is determined by using the accounting equation:
Statement of Financial Position Effects
Illustration 6-11
Illustration 6-14
Slide
6-35
Slide
6-36
Slide
6-37
Ending inventory understated by
$1,500
Correct
COGS Overstated by $1,500
Net Income Understated by
$1,500
COGS Understated by $1,500
Net Income Overstated by
$1,500
Slide
6-38
Statement of Financial Position - Inventory classified as
current asset.
Income Statement - Cost of goods sold.
There also should be disclosure of
1) major inventory classifications,
2) basis of accounting (cost, or lower-of-cost-or-net
realizable value), and
3) Cost method (specific identification, FIFO, or average-
cost).
Presentation
Slide
6-39
The gross profit method estimates the cost of ending
inventory by applying a gross profit rate to net sales.
Gross Profit Method
Illustration 6B-1
Slide
6-40
Illustration: Kishwaukee Company’s records for January show net
sales of $200,000, beginning inventory $40,000, and cost of goods
purchased $120,000. The company expects to earn a 30% gross
profit rate. Compute the estimated cost of the ending inventory at
January 31 under the gross profit method.
Illustration 6B-2
Slide
6-41
Company applies the cost-to-retail percentage to ending
inventory at retail prices to determine inventory at cost.
Retail Inventory Method
Illustration 6B-3
Slide
6-42
Note that it is not necessary to take a physical inventory to determine
the estimated cost of goods on hand at any given time.
Illustration 6B-4
Illustration:

2023 Chapter one accounting for inventory.pdf

  • 1.
  • 2.
  • 3.
  • 4.
    Slide 6-4 Perpetual Inventory Method DateAccount Debit Credit Inventory Accounts Payable $$$ $$$ Accounts Receivable Sales COGS Inventory $$$ SSS SSS SSS Ordering Inventory Selling Inventory Periodic Inventory Method Date Account Debit Credit Purchases Accounts Payable $$$ $$$ Accounts Receivable Sales $$$ SSS
  • 5.
  • 6.
    Slide 6-6 One Classification: Merchandise Inventory ThreeClassifications: Raw Materials Work in Process Finished Goods Merchandising Company Manufacturing Company Regardless of the classification, companies report all inventories under Current Assets on the statement of financial position.
  • 7.
    Slide 6-7 Physical Inventory takenfor two reasons: Perpetual System 1. Check accuracy of inventory records. 2. Determine amount of inventory lost (wasted raw materials, shoplifting, or employee theft). Periodic System 1. Determine the inventory on hand 2. Determine the cost of goods sold for the period.
  • 8.
    Slide 6-8 Involves counting, weighing,or measuring each kind of inventory on hand. Taken, when the business is closed or when business is slow. at end of the accounting period. Taking a Physical Inventory
  • 9.
    Slide 6-9 Goods in Transit Purchasedgoods not yet received. Sold goods not yet delivered. Determining Ownership of Goods Goods in transit should be included in the inventory of the company that has legal title to the goods. Legal title is determined by the terms of sale.
  • 10.
    Slide 6-10 Illustration 6-1 Ownership ofthe goods passes to the buyer when the public carrier accepts the goods from the seller. Ownership of the goods remains with the seller until the goods reach the buyer. Goods in Transit
  • 11.
    Slide 6-11 Consigned Goods In somelines of business, it is common to hold the goods of other parties and try to sell the goods for them for a fee, but without taking ownership of goods. These are called consigned goods. Determining Ownership of Goods
  • 12.
    Slide 6-12 Unit costs canbe applied to quantities on hand using the following costing methods: Specific Identification First-in, first-out (FIFO) Average-cost Cost Flow Assumptions
  • 13.
    Slide 6-13 An actual physicalflow costing method in which items still in inventory are specifically costed to arrive at the total cost of the ending inventory. Practice is relatively rare. Most companies make assumptions (Cost Flow Assumptions) about which units were sold. Specific Identification Method
  • 14.
    Slide 6-14 Here is informationabout the mountain bike inventory of Trekking for the month of August.
  • 15.
  • 16.
  • 17.
    Slide 6-17 Earliest goods purchasedare first to be sold. Often parallels actual physical flow of merchandise. Generally good business practice to sell oldest units first. “First-In-First-Out (FIFO)”
  • 18.
  • 19.
  • 20.
    Slide 6-20 Allocates cost ofgoods available for sale on the basis of weighted average unit cost incurred. Assumes goods are similar in nature. Applies weighted average unit cost to the units on hand to determine cost of the ending inventory. “Average-Cost”
  • 21.
    Slide 6-21 Cost of Goods Availablefor Sale Units on hand on the date of sale ÷ P1
  • 22.
  • 23.
  • 24.
    Slide 6-24 Illustration 6-9 Financial Statementand Tax Effects Income Statement Effects
  • 25.
    Slide 6-25 Statement of FinancialStatement Effects Ø A major advantage of the FIFO method is that in a period of inflation, the costs allocated to ending inventory will approximate their current cost. Ø A shortcoming of the average-cost method is that in a period of inflation, the costs allocated to ending inventory may be understated in terms of current cost.
  • 26.
    Slide 6-26 Tax Effects In aperiod of inflation: Ø FIFO - inventory and net income higher. Ø AVERAGE Cost - lower income taxes.
  • 27.
    Slide 6-27 Using Cost FlowMethods Consistently Method should be used consistently, enhances comparability. Although consistency is preferred, a company may change its inventory costing method.
  • 28.
    Slide 6-28 Lower-of-Cost-or-Net Realizable Value Whenthe value of inventory is lower than its cost Companies can “write down” the inventory to its net realizable value in the period in which the price decline occurs. Net realizable value refers to the net amount that a company expects to realize (receive) from the sale of inventory. It is the estimated selling price in the ordinary course of business, less the estimated costs of completion and estimated selling expenses.
  • 29.
    Slide 6-29 Illustration: Assume thatKen Tuckie TV has the following lines of merchandise with costs and market values as indicated. Illustration 6-10 Lower-of-Cost-or-Net Realizable Value
  • 30.
    Slide 6-30 Common Cause: Failure tocount or price inventory correctly. Not properly recognizing the transfer of legal title to goods in transit. Errors affect both the income statement and statement of financial position.
  • 31.
    Slide 6-31 Inventory errors affectthe computation of cost of goods sold and net income. Income Statement Effects Illustration 6-12 Illustration 6-11
  • 32.
    Slide 6-32 Inventory errors affectthe computation of cost of goods sold and net income in two periods. An error in ending inventory of the current period will have a reverse effect on net income of the next accounting period. Over the two years, the total net income is correct because the errors offset each other. The ending inventory depends entirely on the accuracy of taking and costing the inventory. Income Statement Effects
  • 33.
    Slide 6-33 ($3,000) Net Income understated $3,000 Net Income overstated Combinedincome for 2- year period is correct. Illustration 6-13
  • 34.
    Slide 6-34 Effect of inventoryerrors on the statement of financial position is determined by using the accounting equation: Statement of Financial Position Effects Illustration 6-11 Illustration 6-14
  • 35.
  • 36.
  • 37.
    Slide 6-37 Ending inventory understatedby $1,500 Correct COGS Overstated by $1,500 Net Income Understated by $1,500 COGS Understated by $1,500 Net Income Overstated by $1,500
  • 38.
    Slide 6-38 Statement of FinancialPosition - Inventory classified as current asset. Income Statement - Cost of goods sold. There also should be disclosure of 1) major inventory classifications, 2) basis of accounting (cost, or lower-of-cost-or-net realizable value), and 3) Cost method (specific identification, FIFO, or average- cost). Presentation
  • 39.
    Slide 6-39 The gross profitmethod estimates the cost of ending inventory by applying a gross profit rate to net sales. Gross Profit Method Illustration 6B-1
  • 40.
    Slide 6-40 Illustration: Kishwaukee Company’srecords for January show net sales of $200,000, beginning inventory $40,000, and cost of goods purchased $120,000. The company expects to earn a 30% gross profit rate. Compute the estimated cost of the ending inventory at January 31 under the gross profit method. Illustration 6B-2
  • 41.
    Slide 6-41 Company applies thecost-to-retail percentage to ending inventory at retail prices to determine inventory at cost. Retail Inventory Method Illustration 6B-3
  • 42.
    Slide 6-42 Note that itis not necessary to take a physical inventory to determine the estimated cost of goods on hand at any given time. Illustration 6B-4 Illustration: