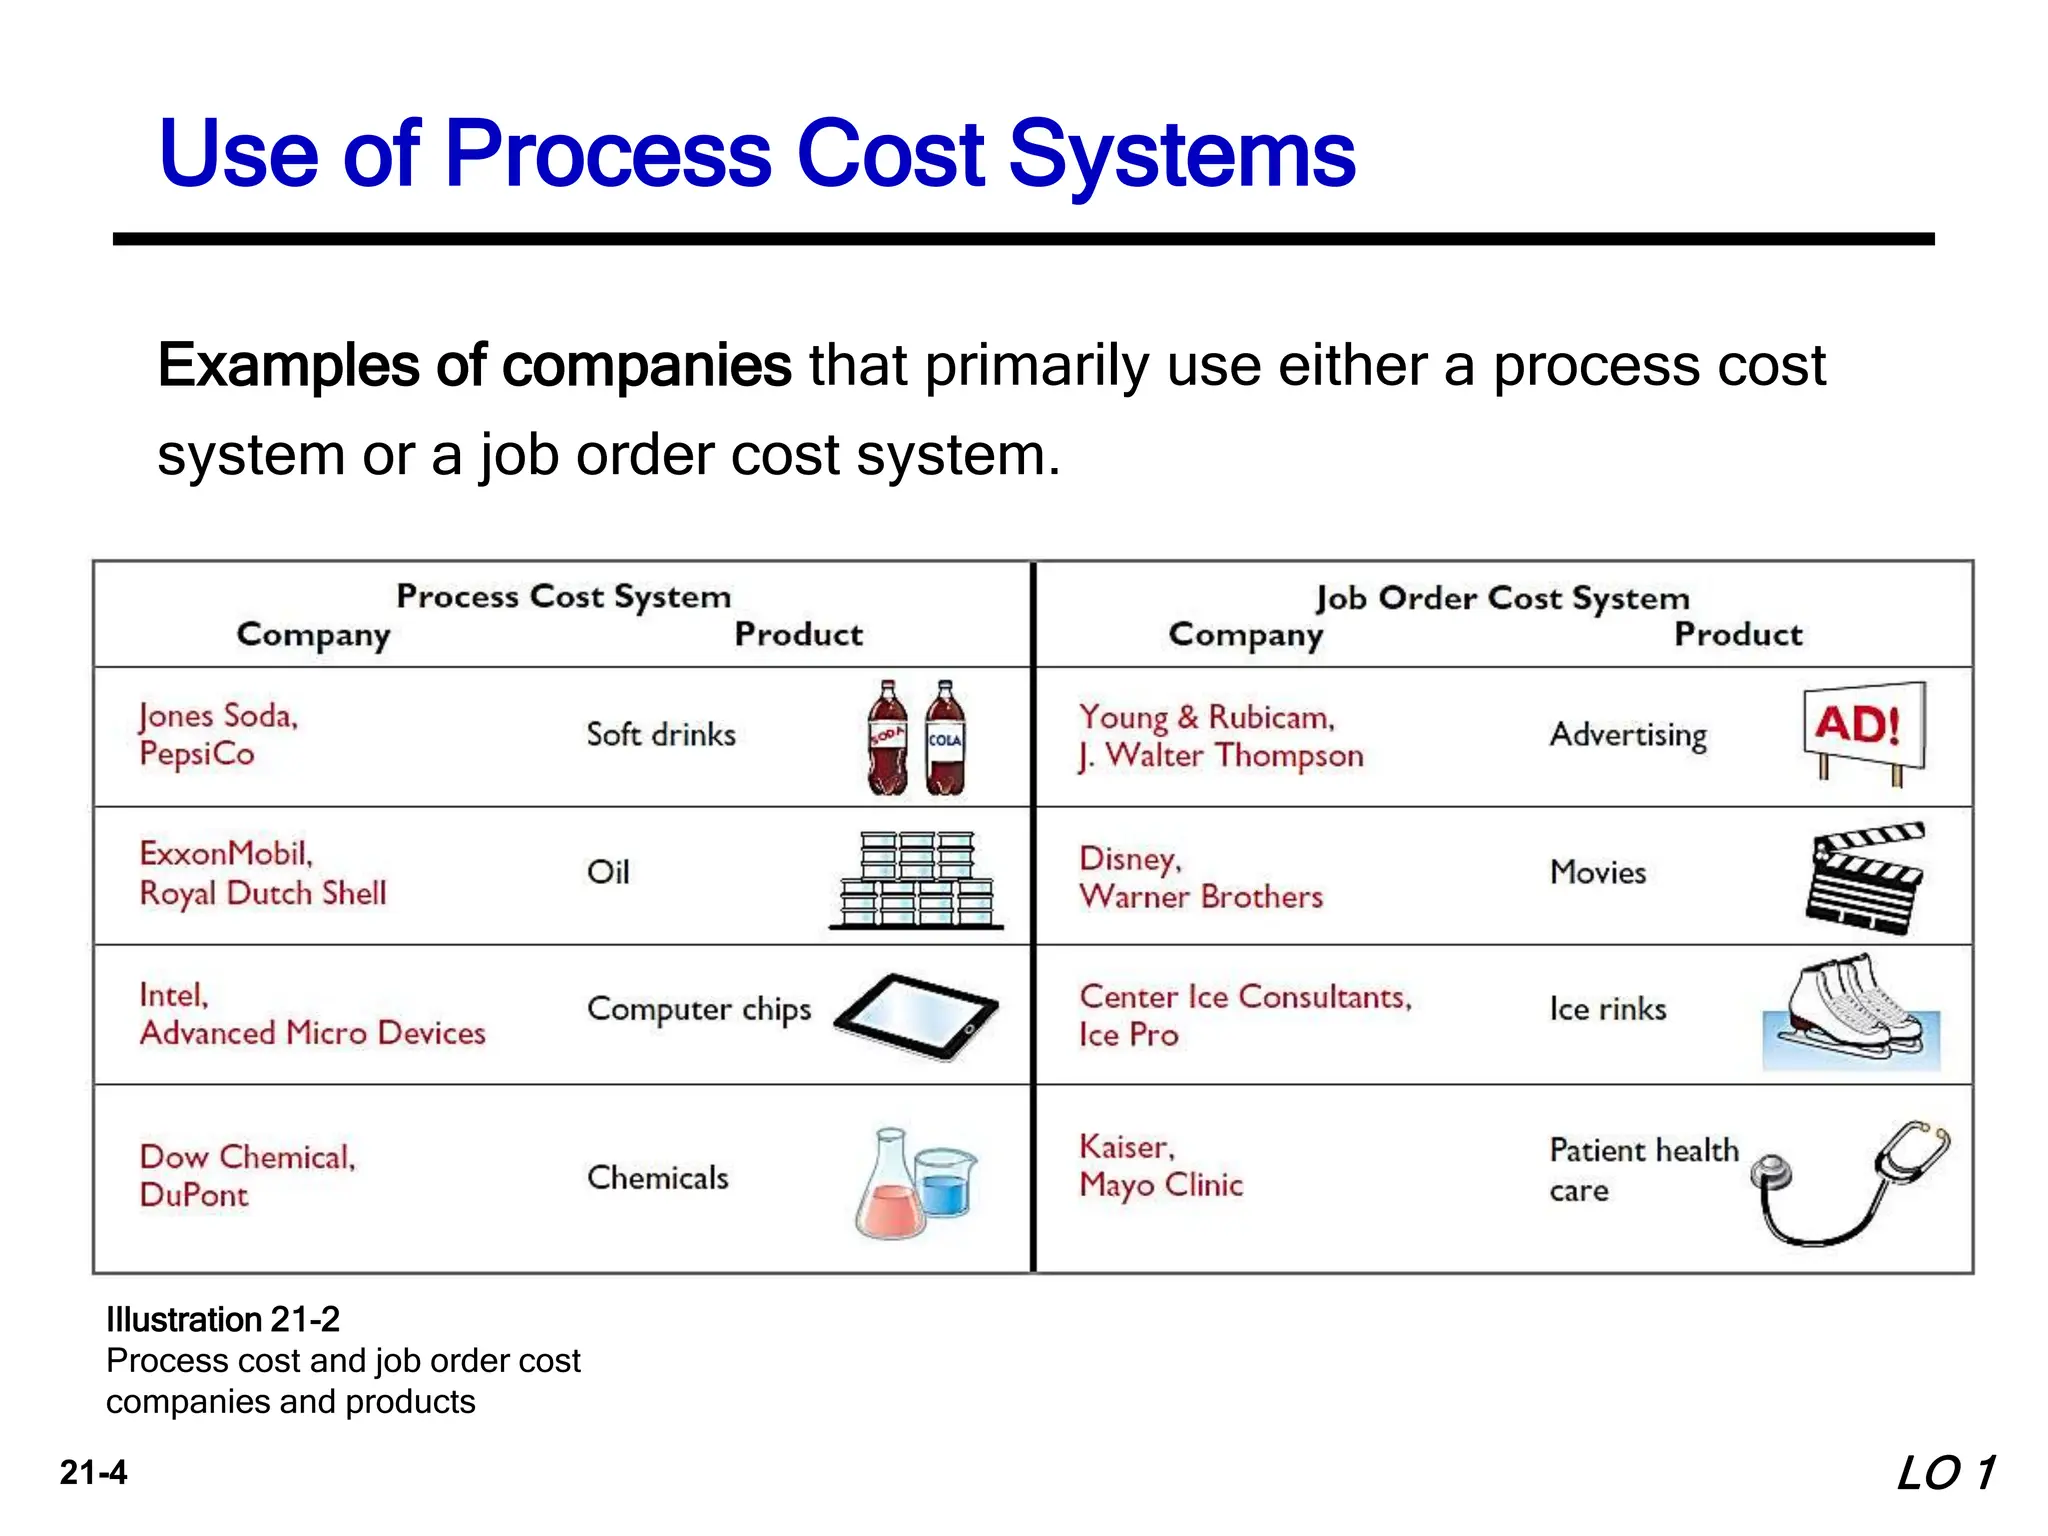
1. The document discusses process costing, which is used to apply costs to mass-produced, homogeneous products like cereal, paint, steel, oil, and soft drinks. It tracks costs through interconnected manufacturing processes.
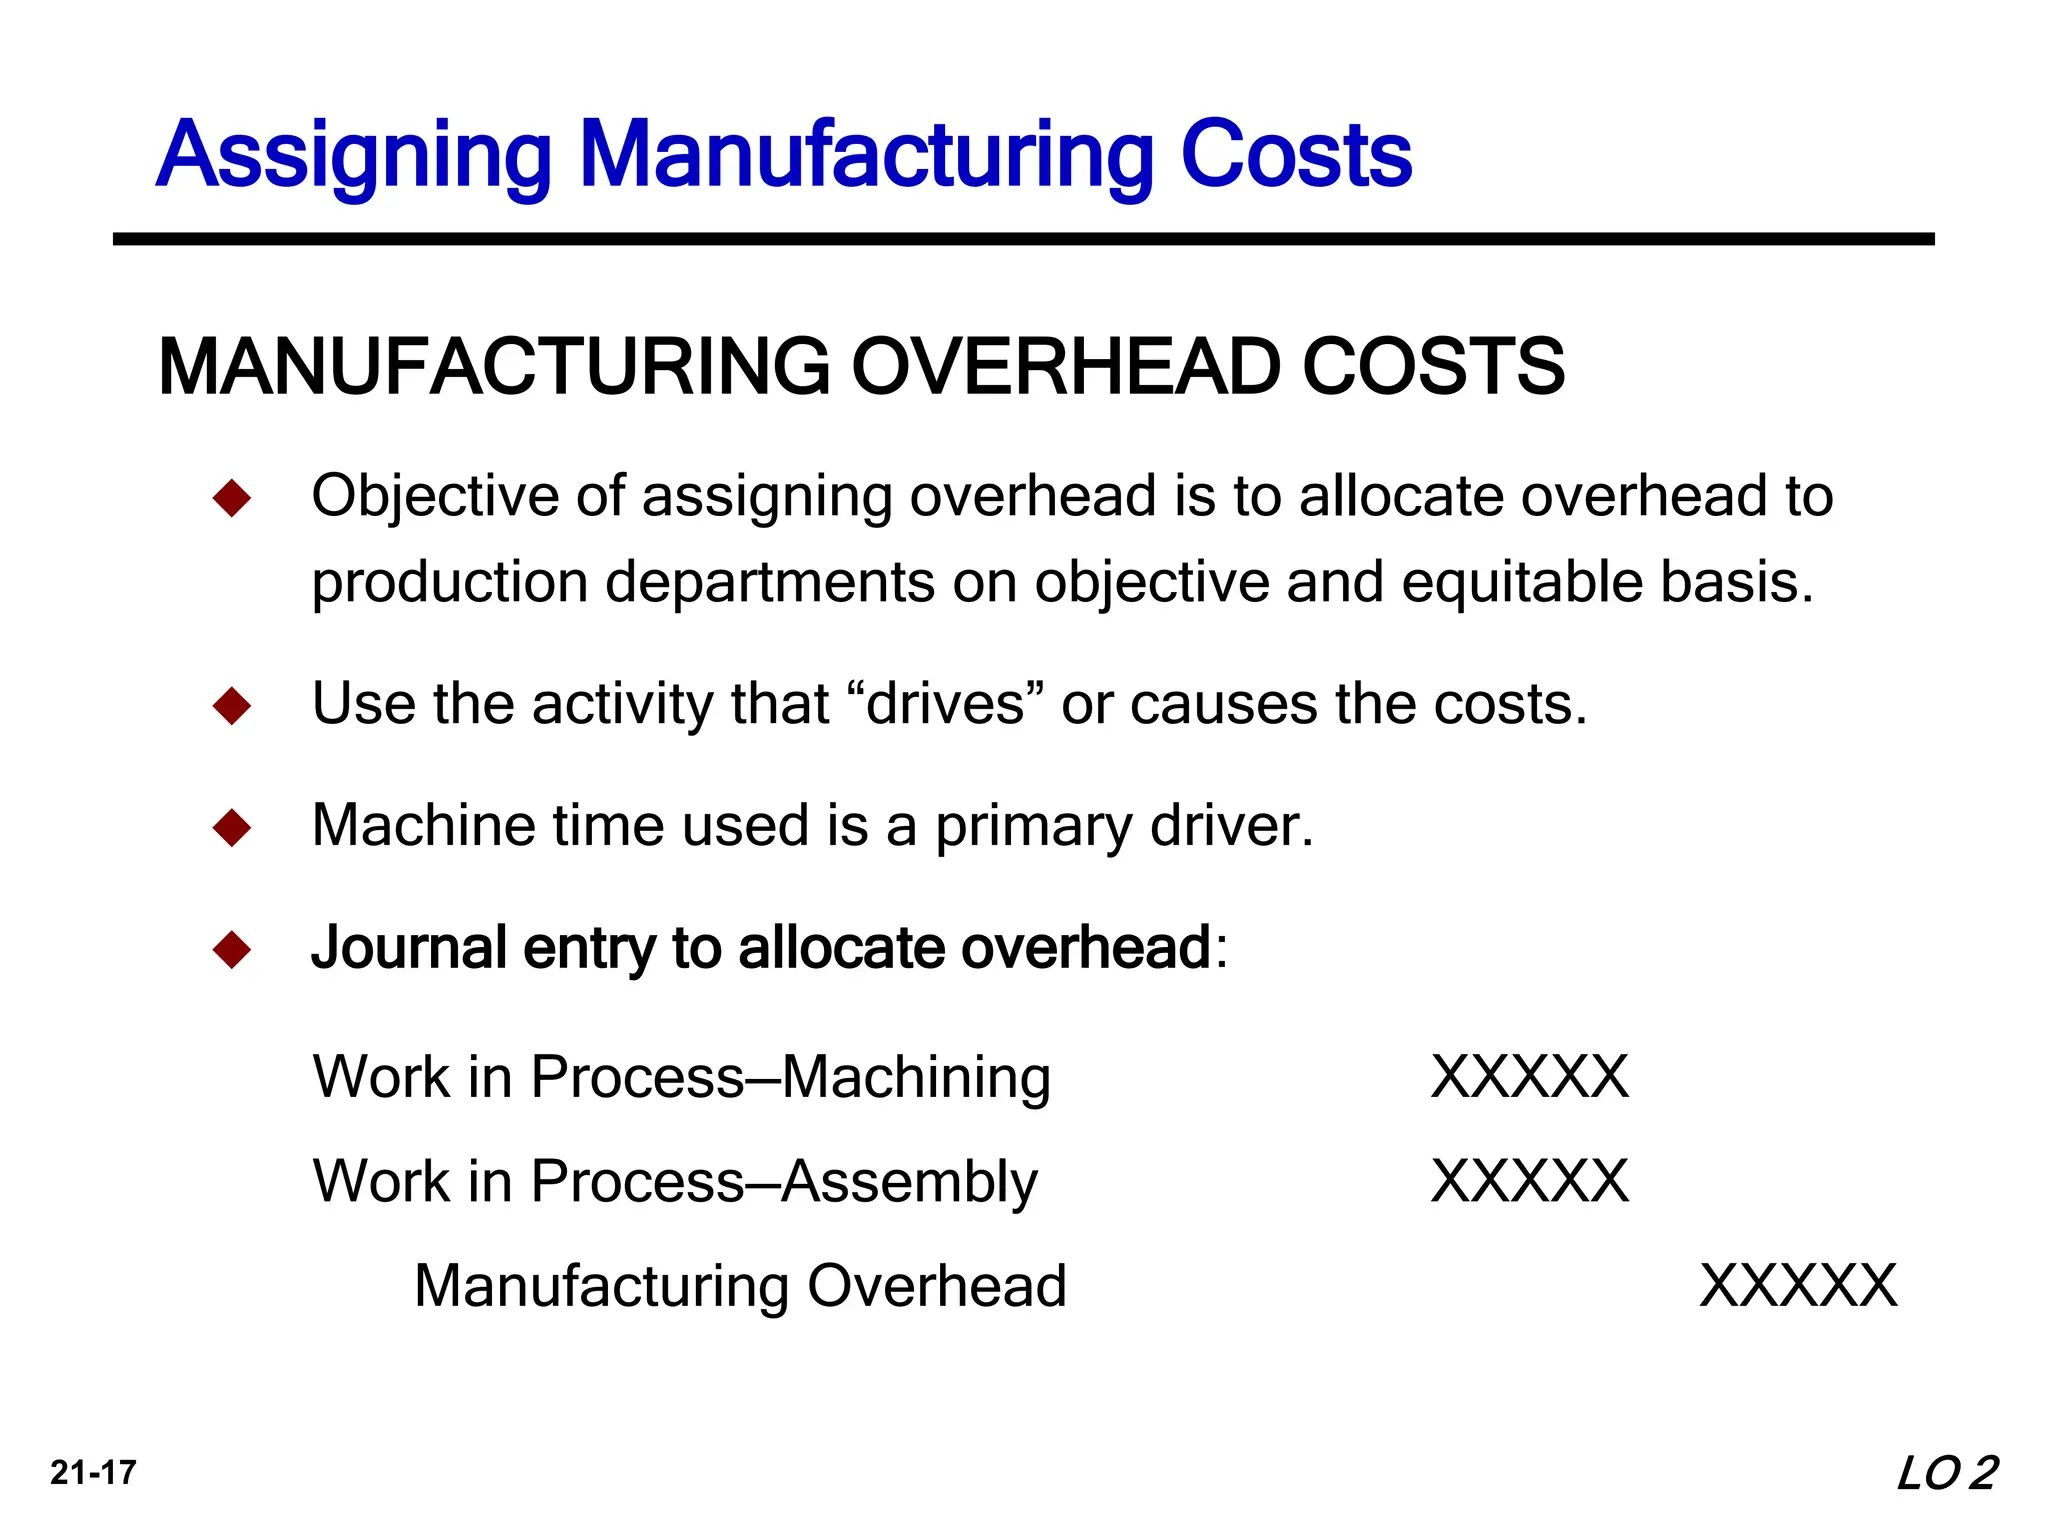
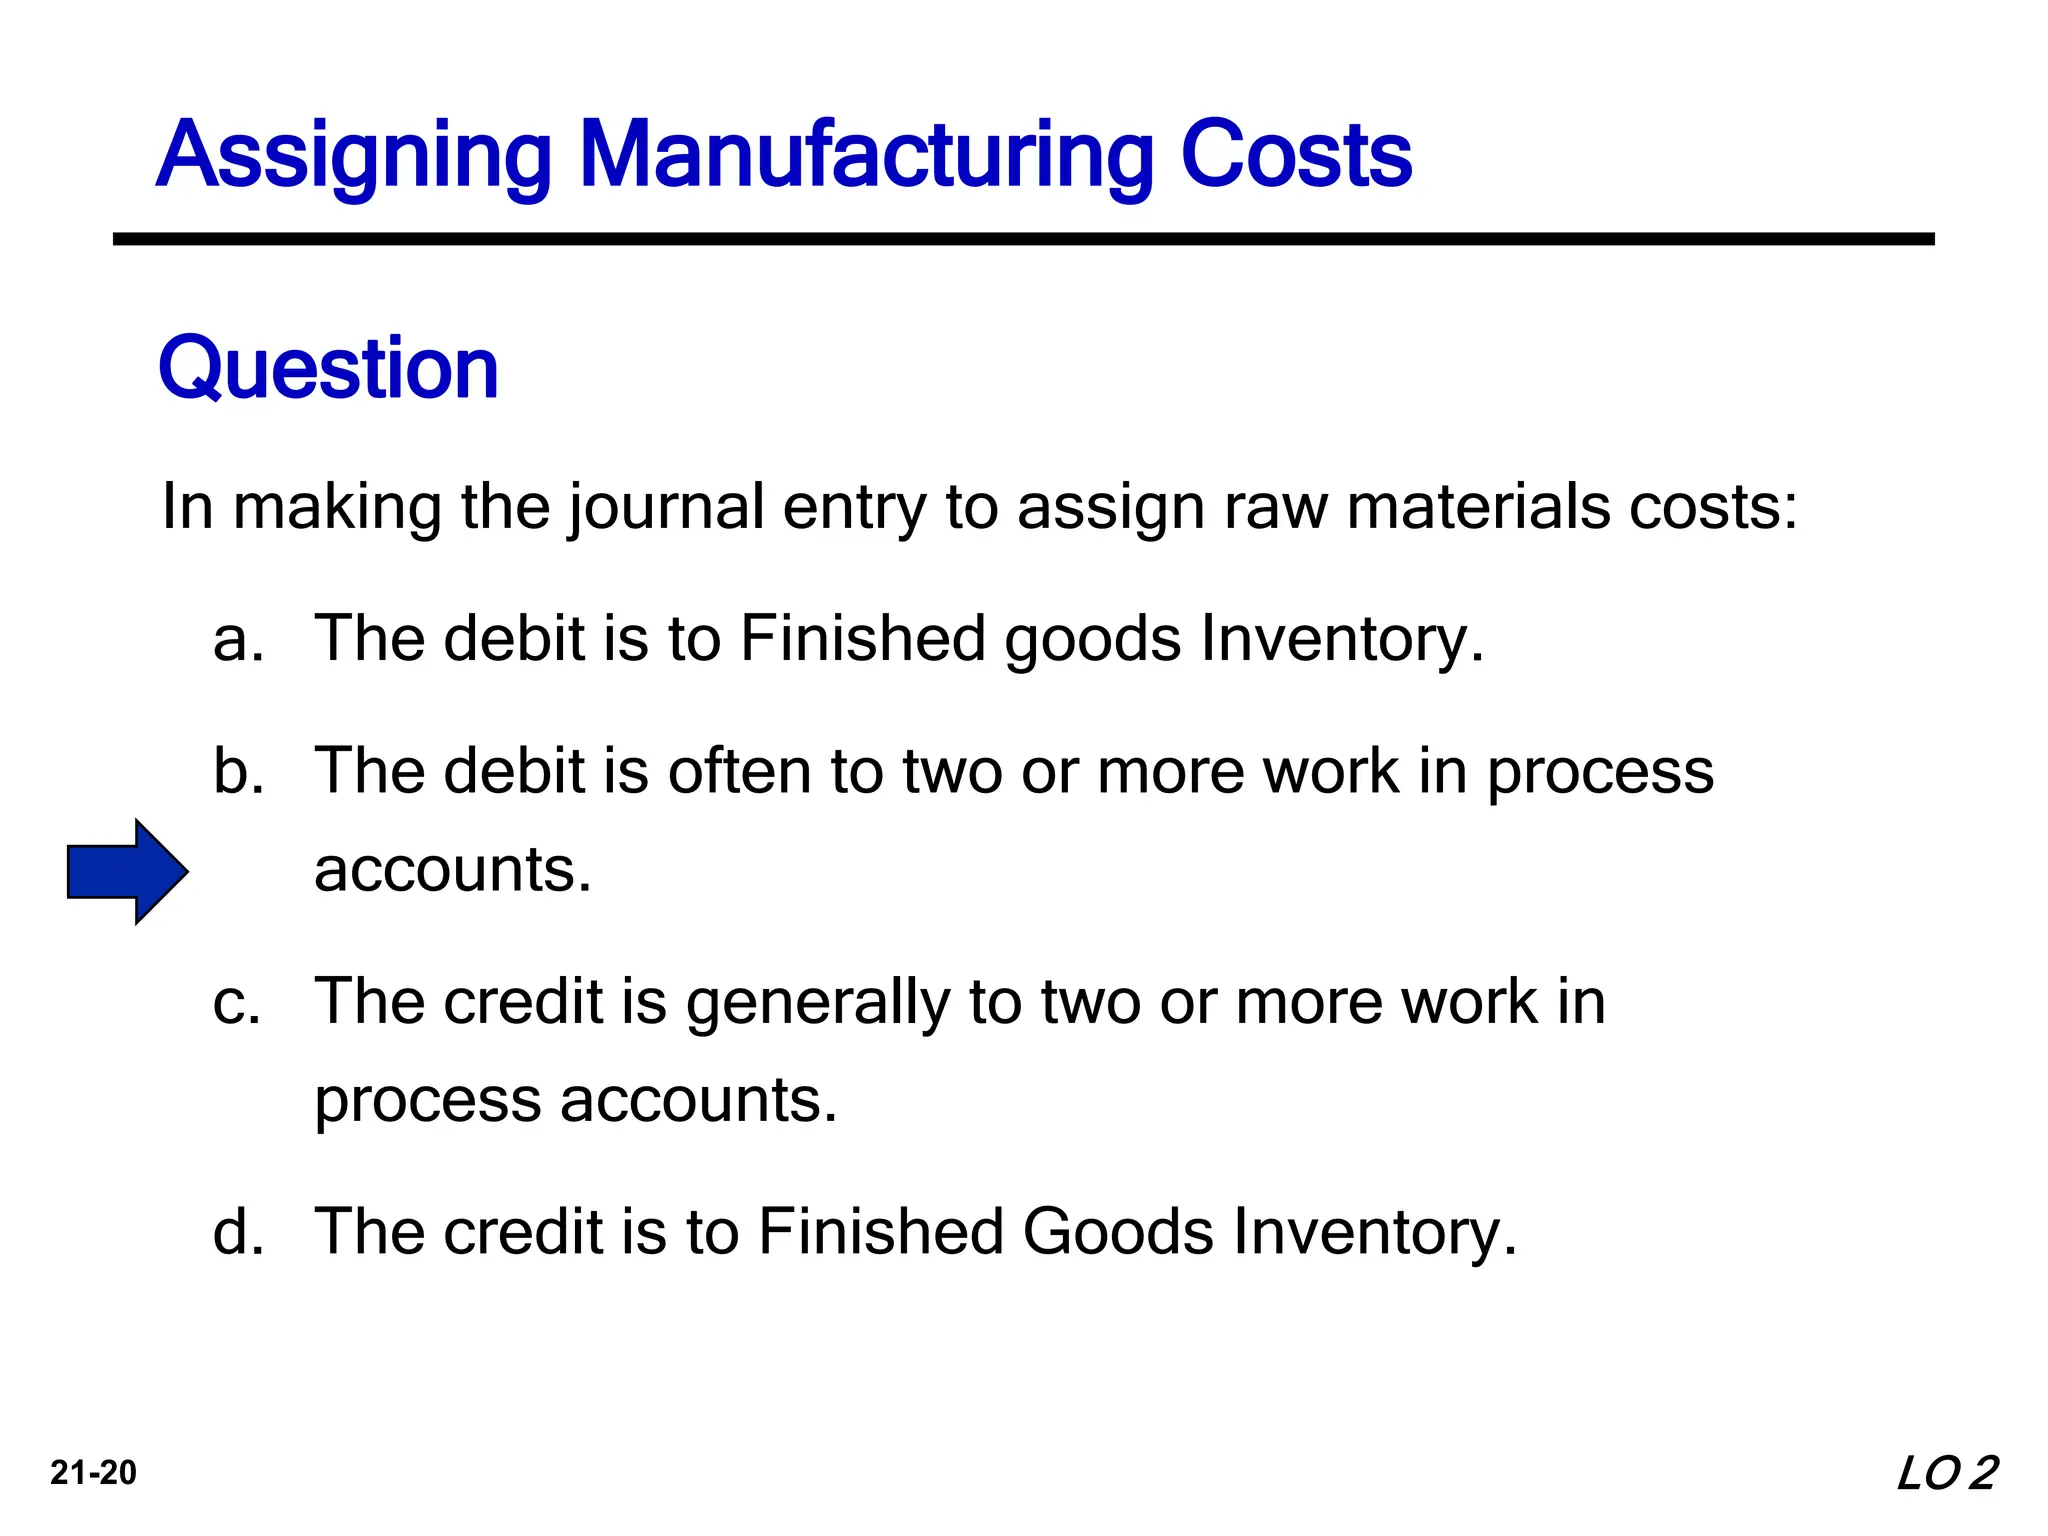
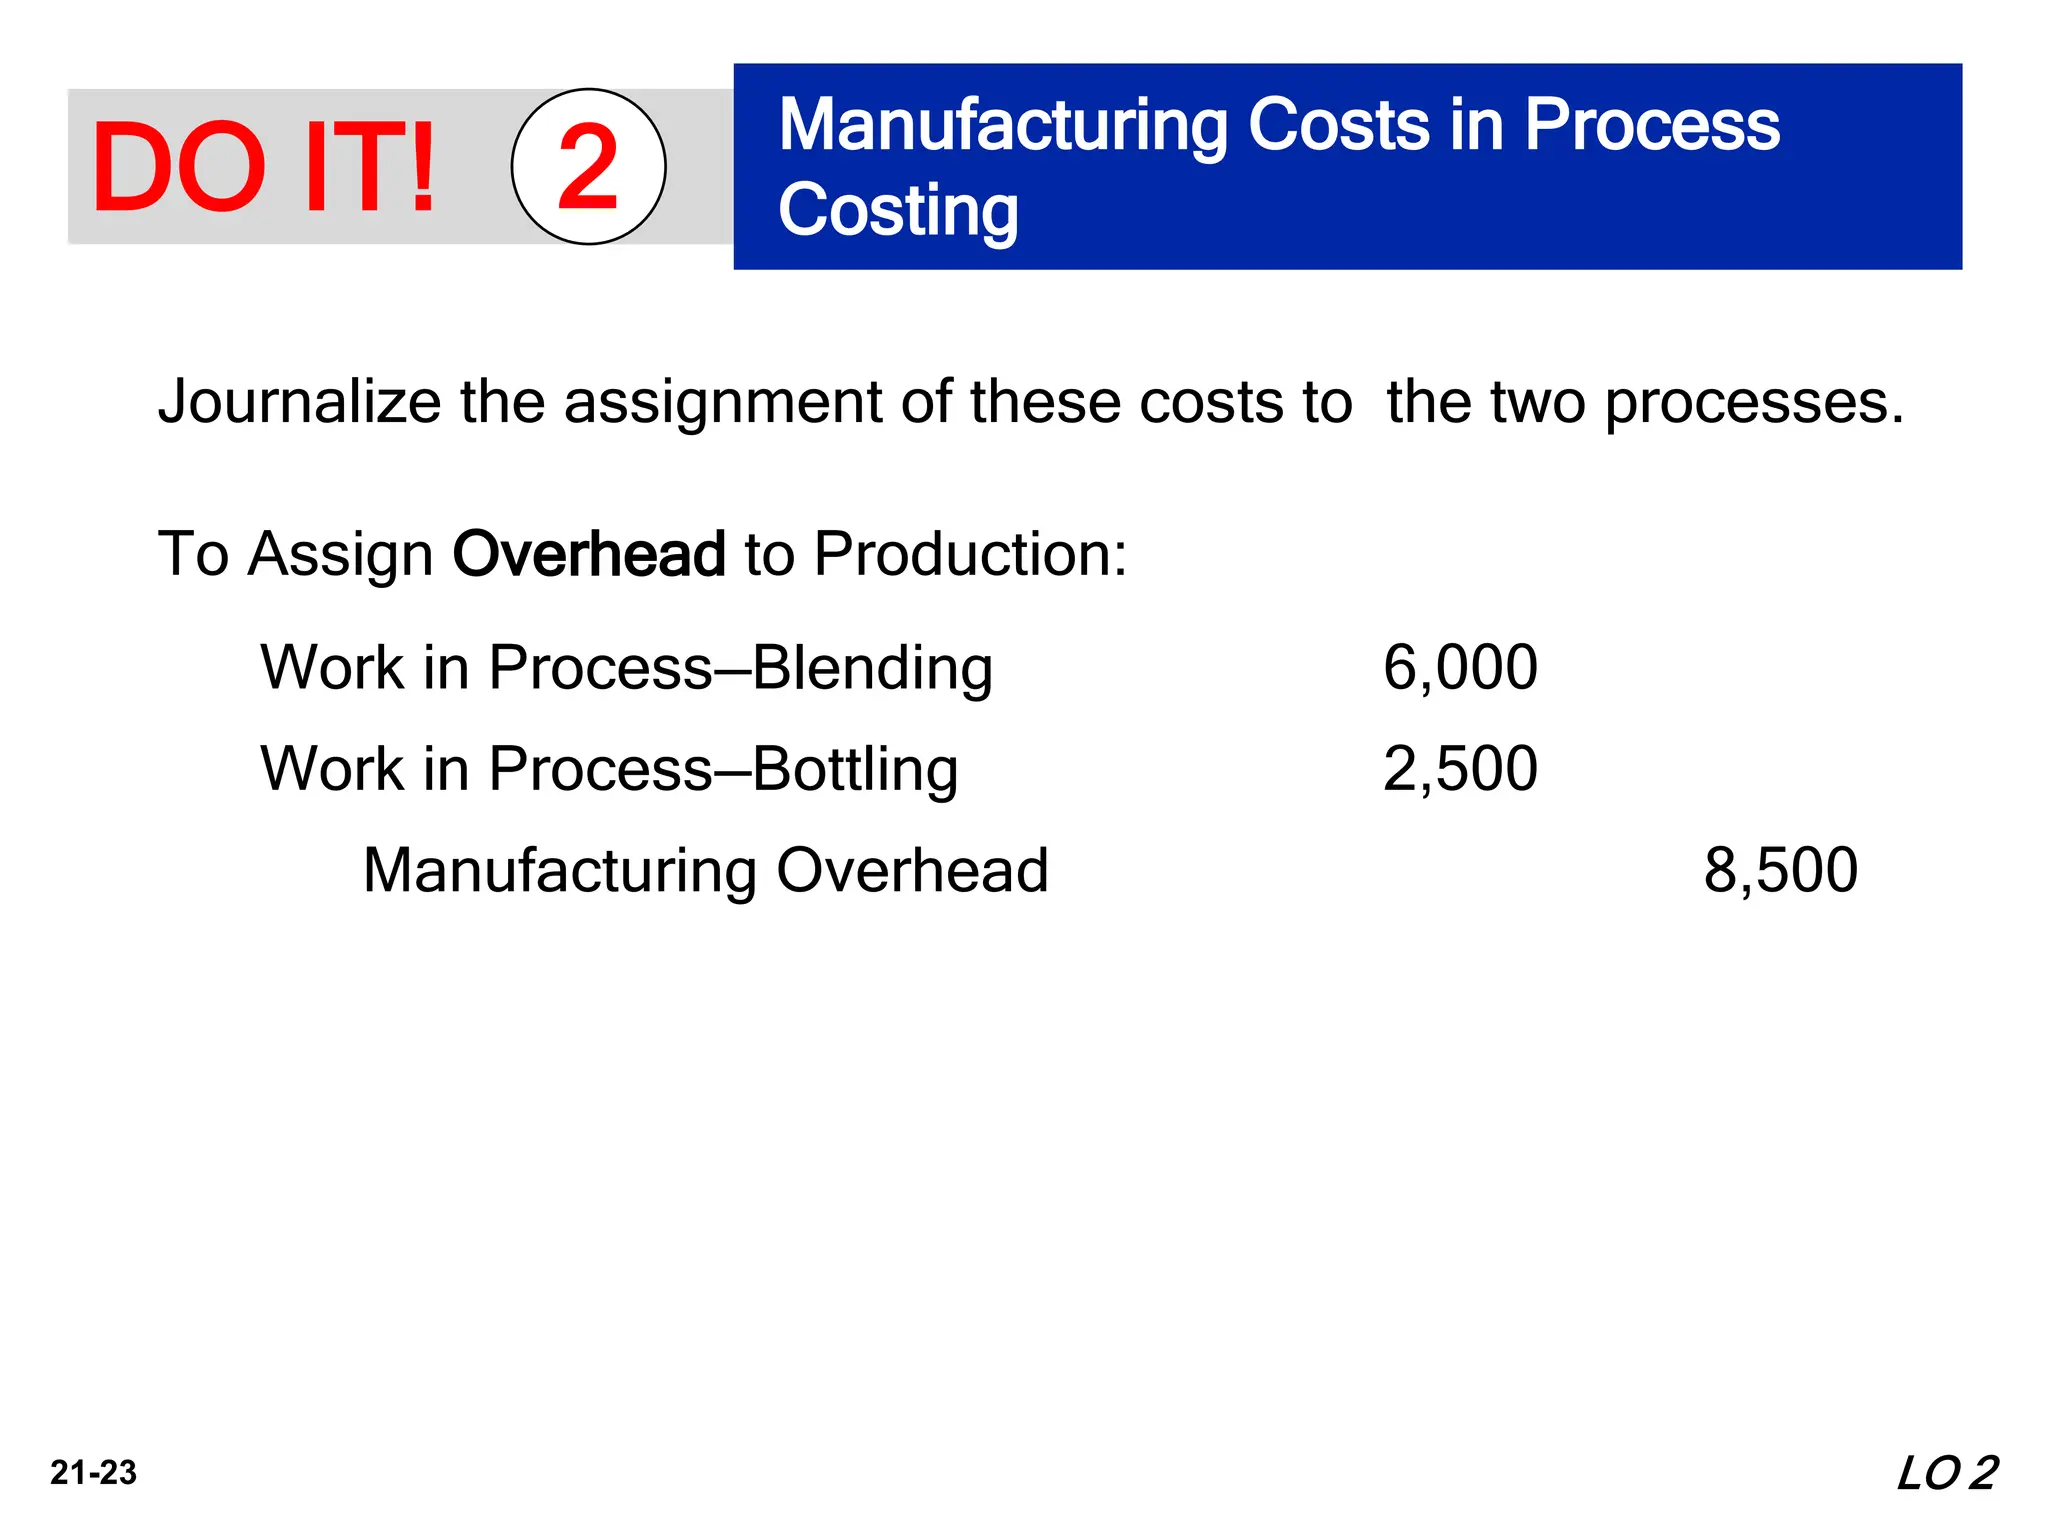
2. It explains how process costing assigns manufacturing costs of materials, labor, and overhead to work in process accounts through journal entries, and how finished units are transferred out.
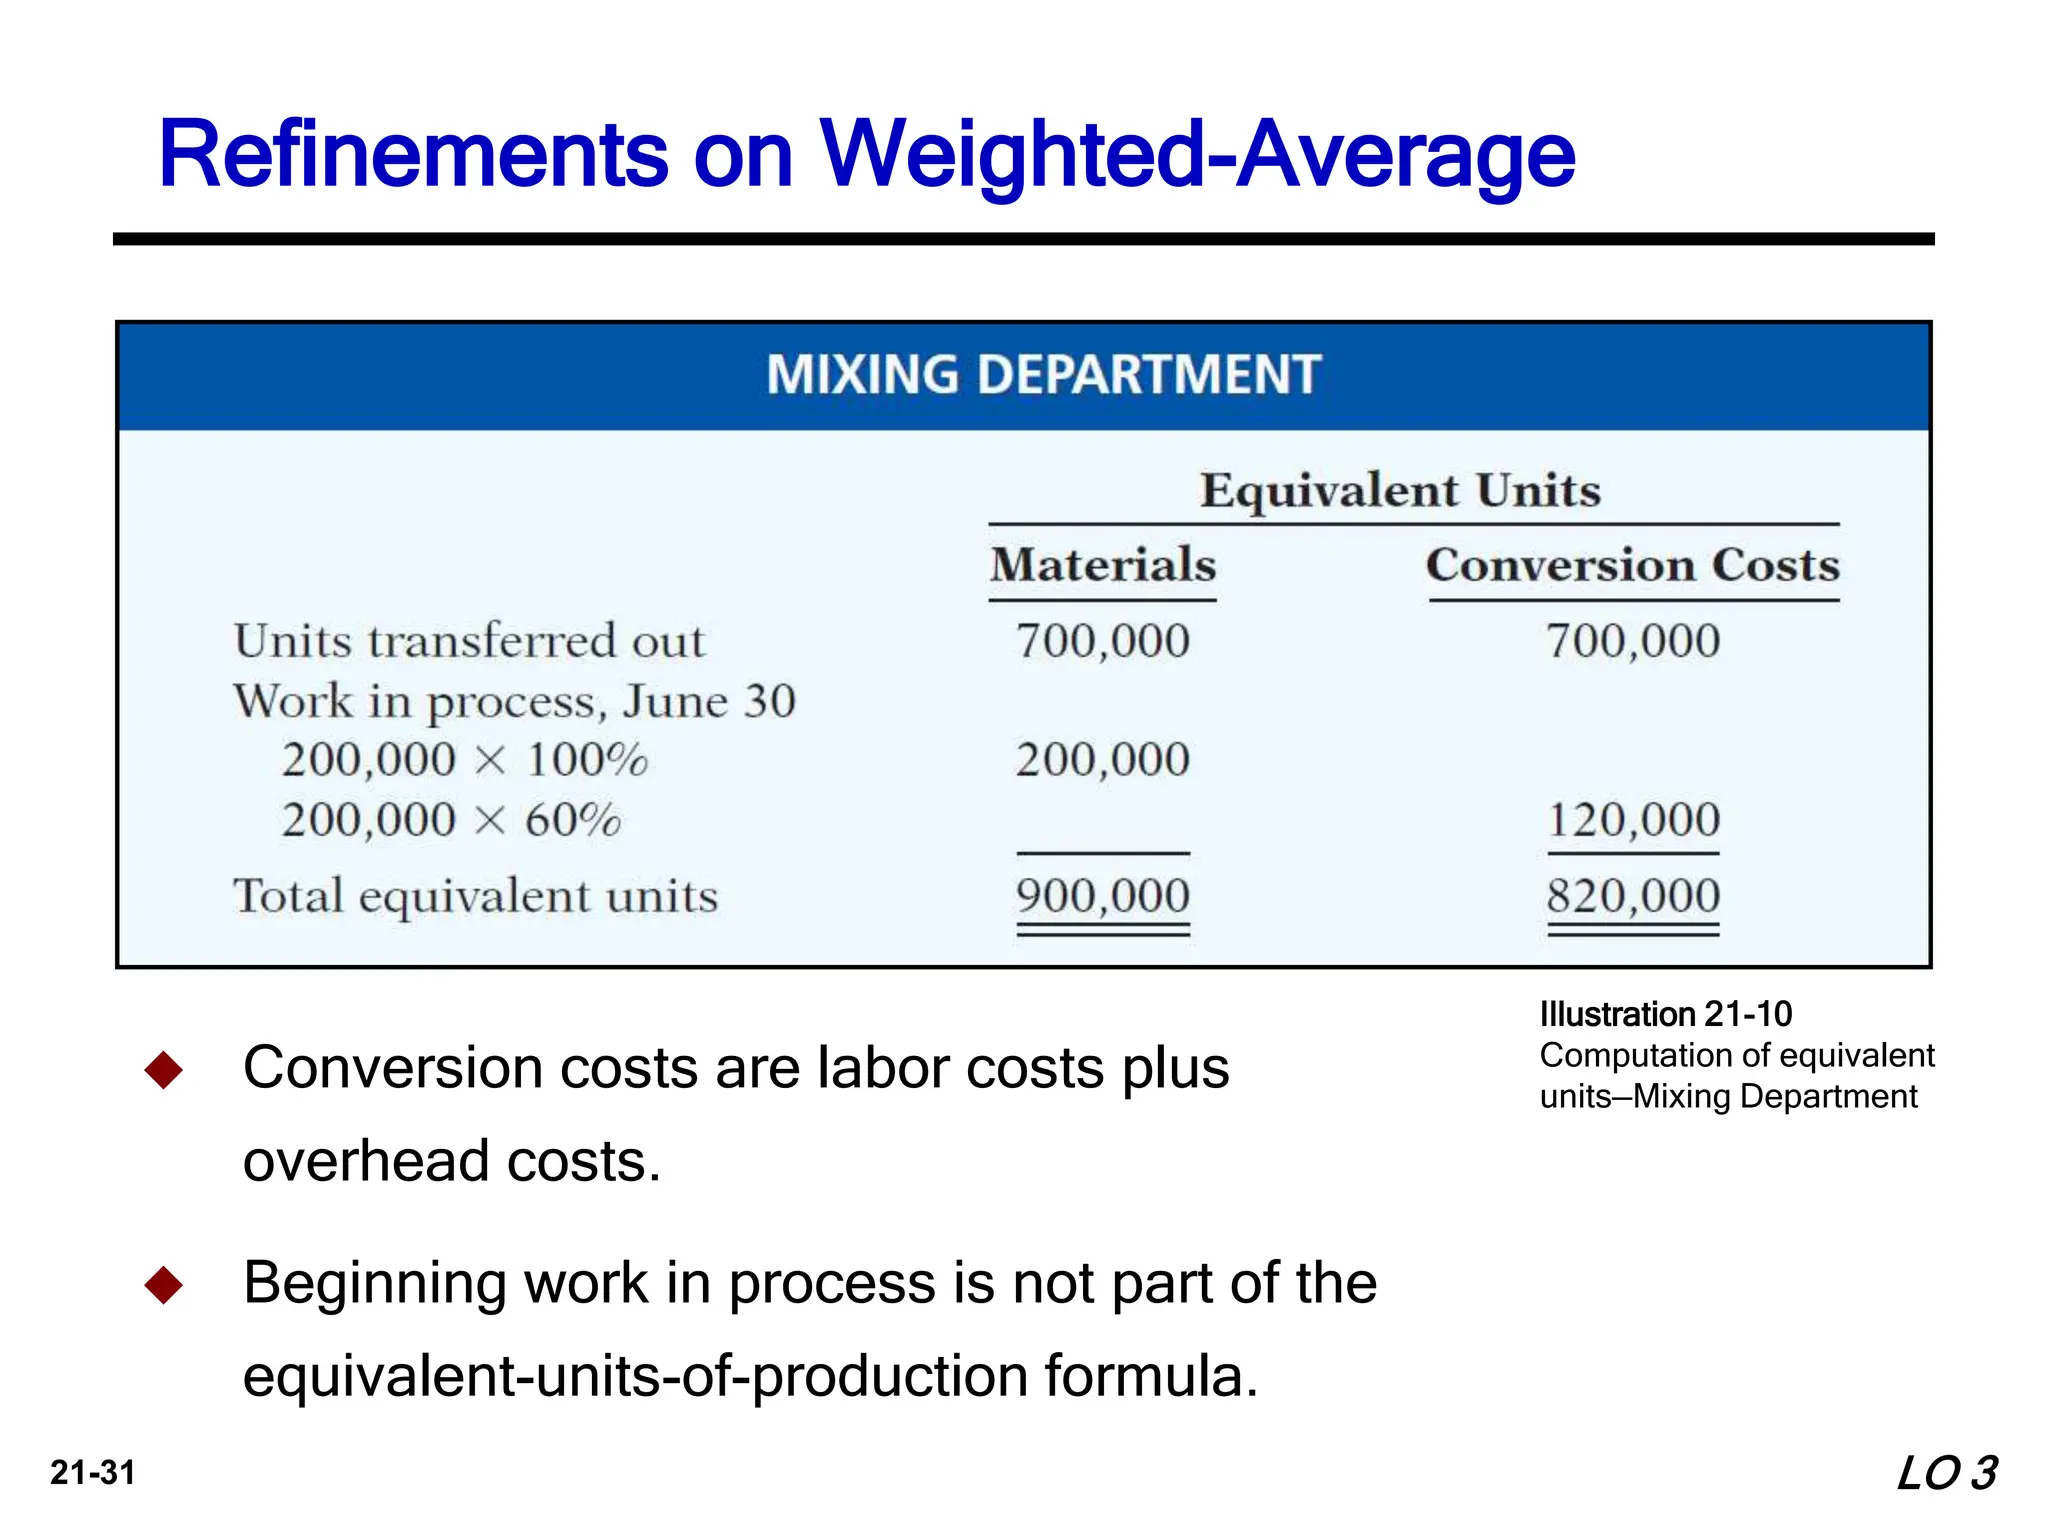
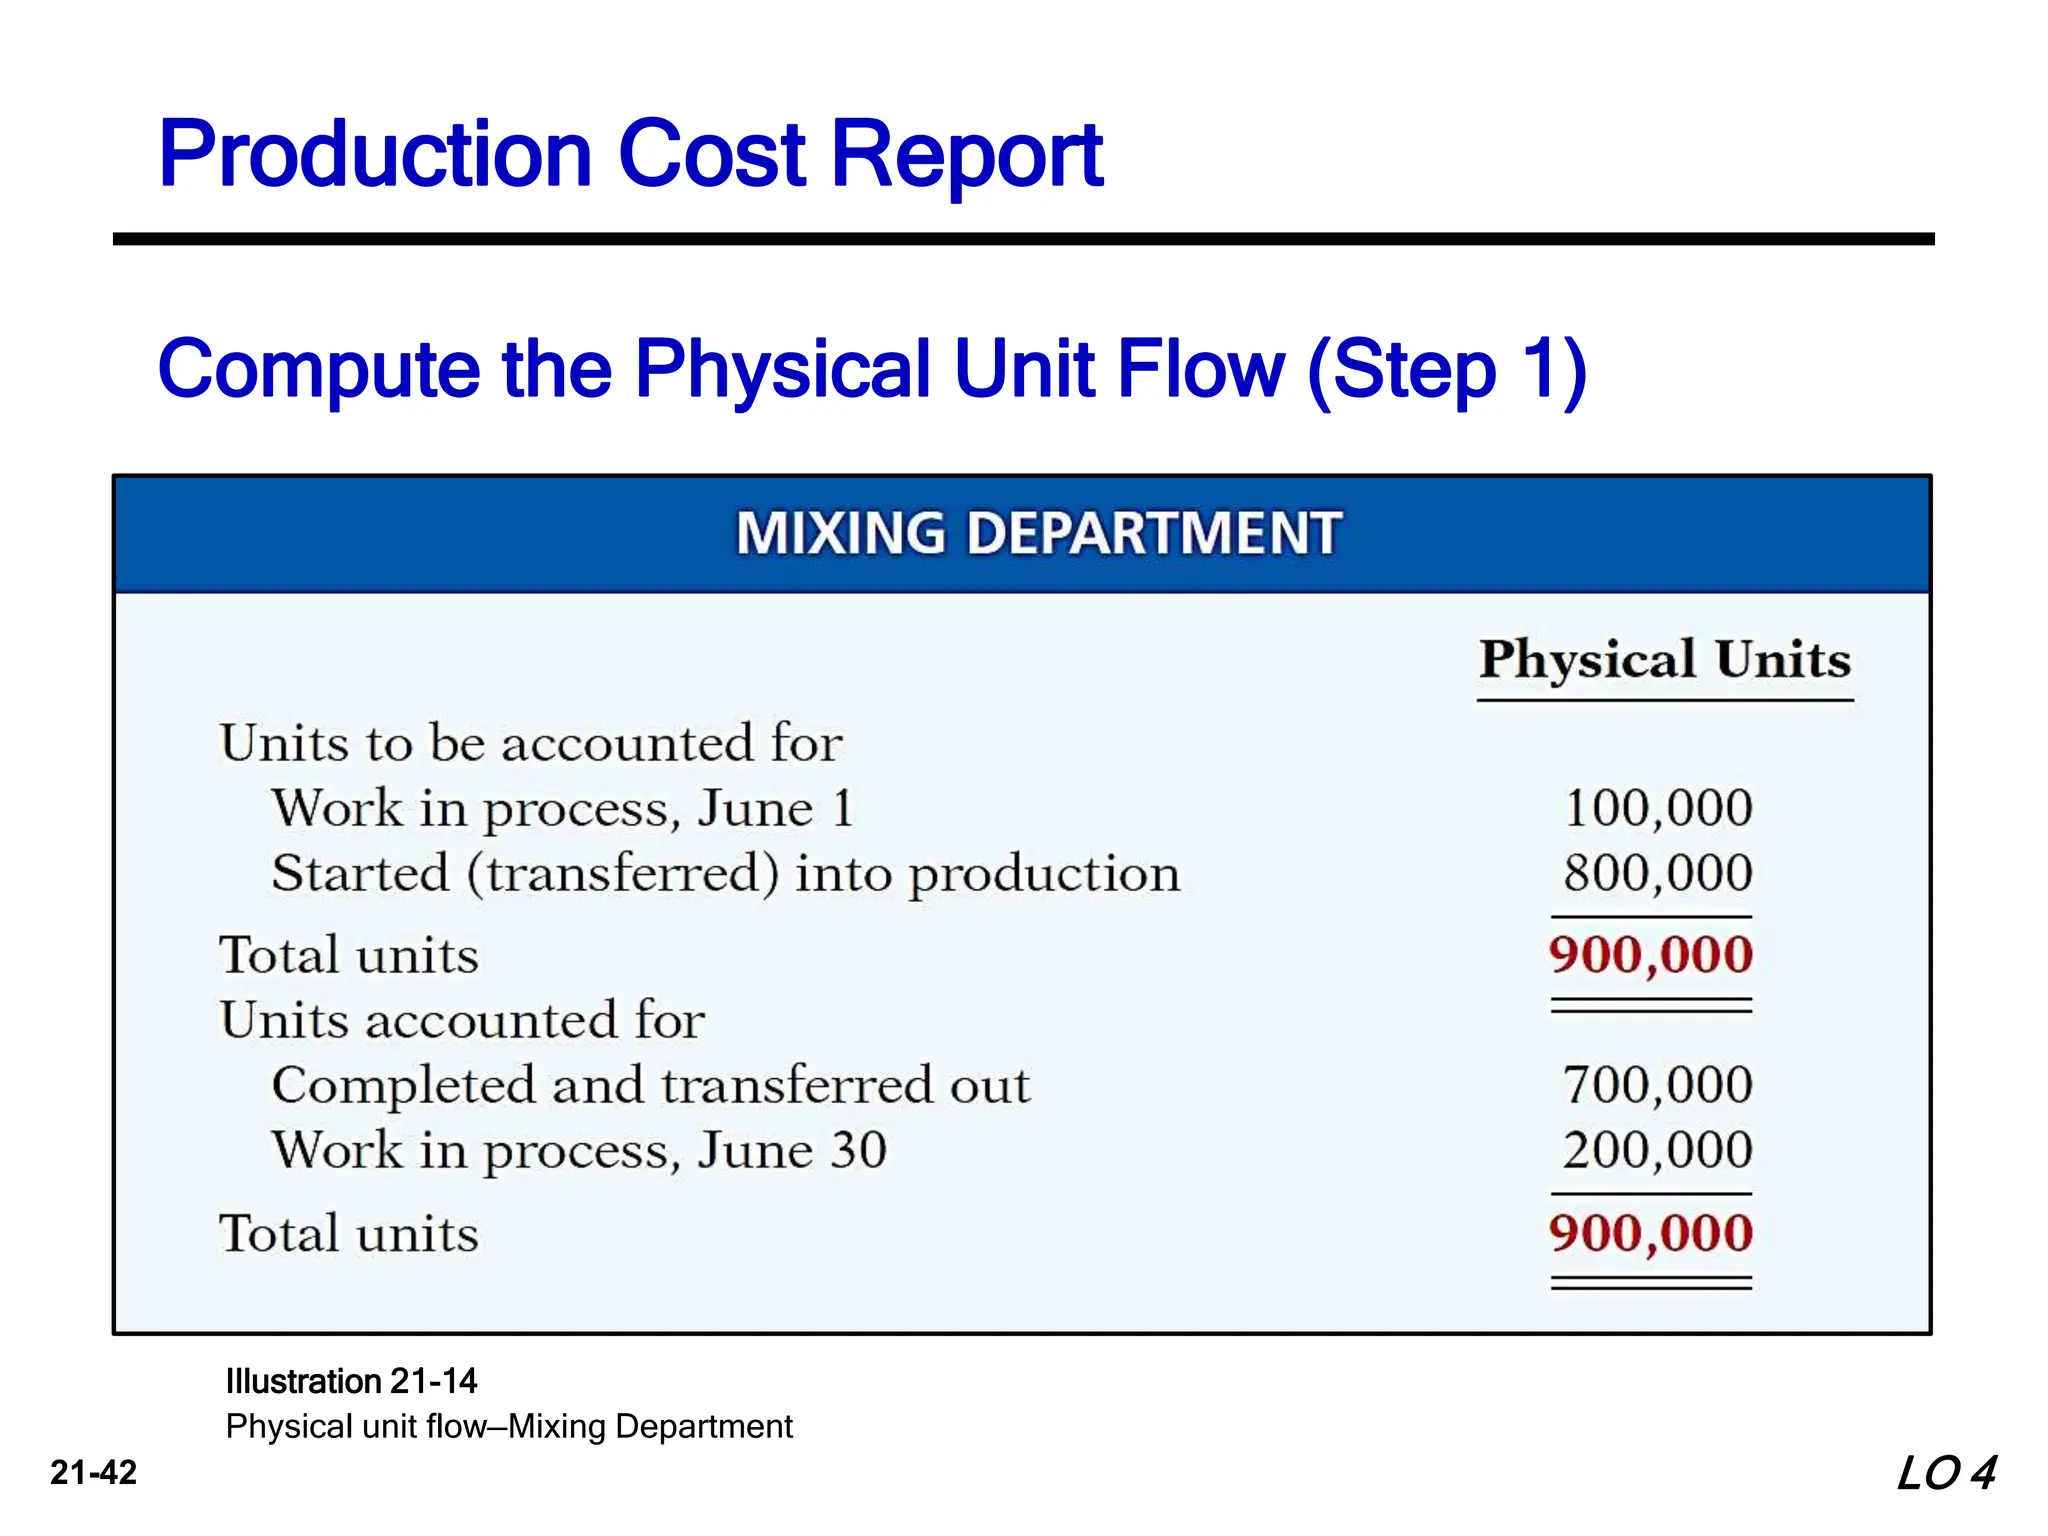
3. Computing equivalent units is discussed, which considers degree of completion by weighting units transferred and in ending work in process, to determine average costs per unit. The weighted-average method is most widely used.