This document discusses key concepts related to financial statements, taxes, and cash flow. It covers the following key points in 3 sentences:
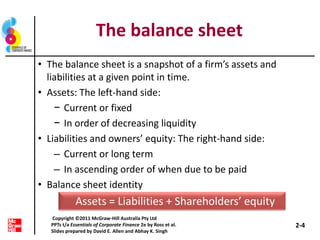
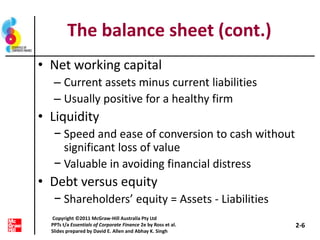
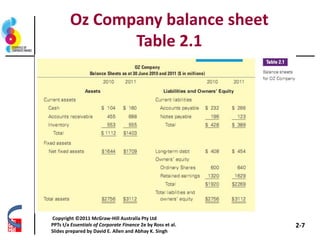
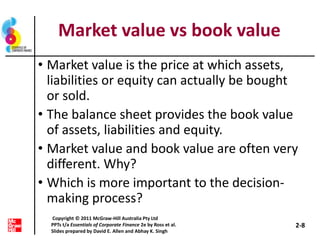
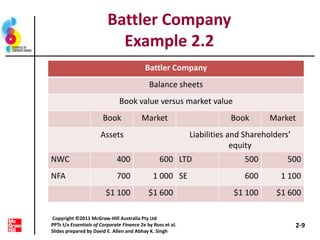
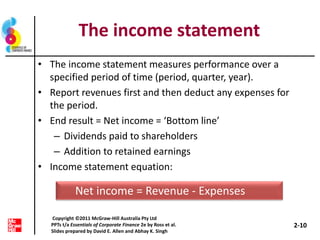
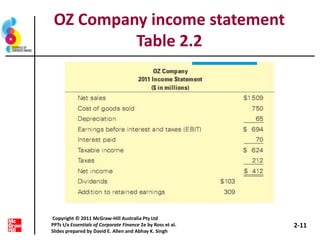
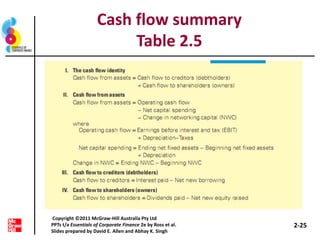
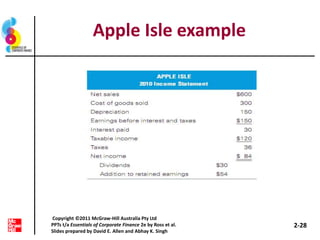
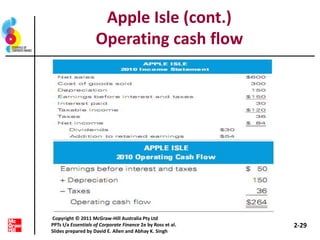
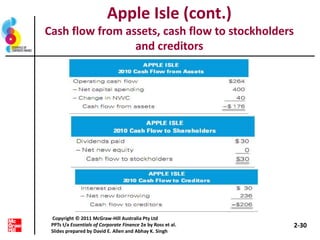
The balance sheet provides a snapshot of a firm's assets and liabilities at a point in time, showing book values which may differ from market values. The income statement measures financial performance over a period by reporting revenues and expenses to arrive at net income. Cash flow is also important as it shows the actual inflow and outflow of cash from operating, investing, and financing activities, which can differ from accounting profits.