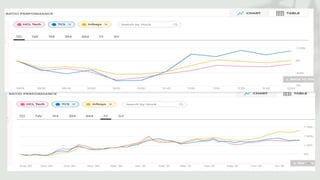
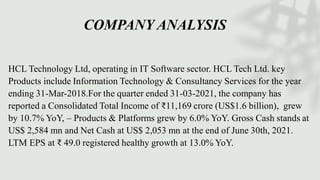
HCL Tech Fundamental
Analysis
Presentation by: Simran Madan
ICG/2018/25346
B.COM (Hons) FSG
Introduction to HCL Tech
Hindustan Computers Limited (HCL) started its operations in 1976
and launched India’s first 8C microcomputer in 1978. Since then, the
company has diversified into 4 main verticals namely HCL Tech, HCL
infosystems, HCL Healthcare and HCL foundation.
The company’s shares have a 52-week high of INR 1,067and a total market
capitalization of INR 1.25 Trillion, which makes it a Large-Cap company.
HCL Technologies has been one of the fastest-growing technology
companies in the world since the last decade and has a presence in 46
countries while employing 1,50,000+ professionals.
Introduction to Fundamental
Analysis
Fundamental analysis is the analysis of a business's
financial statements, health, competitors and markets. It
also considers the overall state of the economy and factors
including interest rates, production, earnings, employment,
GDP, housing, manufacturing and management.
COMPONENTS OF FUNDAMENTAL
ANALYSIS
Economic
Analysis
Industry Analysis
Company
Analysis
ECONOMIC ANALYSIS
• HCL annual results for FY 2020 has shown revenue growth of 16.7% YoY
in constant currency and Net income growth of 9.3% YoY. The company
has also seen a slight increase in ROE to 23.6% during this period. Overall,
the growth continues to be linear for the company.
• The strong revenue growth is driven by the organic growth and acceleration
of Mode 2 and Mode 3 business. Products and Platform grew by 60.5%
YoY, IT and Business grew by 12.7% and ERS business grew by 12.8%
YoY on a constant currency basis.
At first, HCL Tech’s share dive at 3% after it failed to enthuse
in quarter 1 but, now the company expects strong growth from
HCL Tech in quater 2 and believes it will stay bullish
INDUSTRIAL ANALYSIS
India is the world’s largest sourcing destination, accounting for approximately 55 percent of the
US$ 146 billion markets. The country’s cost competitiveness in providing Information
Technology (IT) services, which is approximately 3-4 times cheaper than the US, continues to be
its Unique Selling Proposition (USP) in the global sourcing market
India’s highly qualified talent pool of technical graduates is one of the largest in the world and is
available at a cost saving of 60-70 percent to source countries. This large pool of qualified skilled
workforce has enabled Indian IT companies to help clients to save US$ 200 billion in the last five
years.
India’s IT industry amounts to 12.3 percent of the global market, largely due to exports. Export of
IT services accounted for 56.12 percent of total IT exports (including hardware) from India. The
Business Process Management (BPM) segment accounted for 23.46 percent of total IT exports
during FY15.
The Government of India has extended tax holidays to the IT sector for software technology parks
of India (STPI) and Special Economic Zones (SEZs). Further, the country is providing procedural
ease and single window clearance for setting up facilities.
Company overview:
Indian Multinational IT company based in Noida Uttar Pradesh. The company operates in
IT consulting, remote infrastructure management, BPO, and Operating in many sectors
like Aerospace, healthcare, automotive, consumer electronics, energy and other utilities,
financial services, Govt services, industrial manufacturing, life sciences, media,
entertainment, Mining, public services, retail and consumer, Semiconductors, Server and
storage, telecommunications, transportation, logistics, hospitality. The Company has
offices in 34 countries and having tie-ups With many big companies.
Even though the stock is not performing well, the future Outlook is clear. Automation
including BPO, Application development, Infrastructure and engineering, and others
including cloud all part of services provided by the company. Cloud, IoT, and Security
segments hold 20%-30% YoY growth potential as per HDFC securities. Though revenue
from Application is not growing fast, and in fact decline in percentage term concerning
Total revenue. Big growth is coming from Infrastructure. But as per the new plan of the
company, the company is concentrating on IoT and cloud computing. HDFC securities
also highlighted the fact that Wipro and INFOSYS Tier 1 revenue is not growing, HCL
Tech is eating that segment. On some Frontier, HCL technologies performance is better
•
From the above performance we can conclude that recently TCS and Infosys took over HCL but as
per the latest 2nd quarter report we believe that HCL will soon take over Infosys again.
COMPANY ANALYSIS
HCL Technology Ltd, operating in IT Software sector. HCL Tech Ltd. key
Products include Information Technology & Consultancy Services for the year
ending 31-Mar-2018.For the quarter ended 31-03-2021, the company has
reported a Consolidated Total Income of ₹11,169 crore (US$1.6 billion), grew
by 10.7% YoY, – Products & Platforms grew by 6.0% YoY. Gross Cash stands at
US$ 2,584 mn and Net Cash at US$ 2,053 mn at the end of June 30th, 2021.
LTM EPS at ₹ 49.0 registered healthy growth at 13.0% YoY.
KEY SUCCESS FACTOR
• They are leveraging the latest technologies in human capital management
to reimaging the employee experience and create an empowered, connected,
and talent-driven workforce, geared for the future of work, capability,
ability to execute, and success at delivering HR solutions that are aligned
with today’s CHRO strategies.
• HCL Tech offers services across the consult-to-operate spectrum, supported
by a strong investment focus on innovation
• HCL Tech is a preferred business partner with demonstrated capabilities in
digital HR transformation and focus on enhancing employee experience and
productivity for customers
This is last 5 year share
price of HCL Tech.
Here we can see that since
2018 share price is
continuously rising with
some minor downfalls but in
2020 due to covid there can
be seen a major downfall.
After that share started to
rise and soon it was nearly
doubled from past years
performance
PROFIT AND LOSS ACCOUNT
The net sales of the
company is increasing
indicating the good
health and growth of the
company and also we
can see the operating
profit of the company is
increasing which again is
a good sign for growth of
the company.
Growth Ratios
The revenue has shown a growth of 20%
CAGR over the last 10 years. The
operating income and net income has
also grown at 21% and 22.6% CAGR,
respectively. This shows improving
efficiency and profitability of the
company. The working capital is also
positive and has shown a linear
growth. Capital expenditure has also
increased with scale.
QUATERLY RESULTS
BALANCE SHEET
• HCLTECH is good value based on its PE Ratio
(20.9x) compared to the Indian IT industry average
(32.9x).
• Earnings are forecast to grow 10.81% per year
• Earnings have grown 7.9% per year over the past 5
years
Average PE (3 Yrs): 17.54
It is calculated as: (Price per
share/ Earnings per Share). As a
thumb rule, a company with a
lower PE ratio is undervalued
compared to the companies with
a higher PE ratio. The average PE
ratio varies depending on the
industry
PRICE EARNING RATIO
r SALES GROWTH:
It shows the compounded growth in net sales for
1,3 and 5 years. The graph shows the past 5 year
figure of net sales and CAGR% is shown below
the box. (vales are in crore)
PROFIT GROWTH:
It shows the compounded growth in net profit for
1,3 and 5 years. The graph shows the past 5 year
figure of net profit and CAGR% is shown below
the box. (vales are in crore)
Return on Equity (ROE):
It measures the ability of a firm to generates profit
from its shareholders investment in the company.
The graph here shows ROE% of last 5 years and
below are the average value of 1,3 and 5 years.
Return on capital employed (ROCE):
It measures how efficiently a company is using its
capital employed. The graph here shows
ROCE% of last 5 years and below are the
average value of 1,3 and 5 years.
It is a measure of a degree to which
company is financing its operations
through debts vs. wholly owned funds.
Ideal D/E ratio should be less than 1.
It determines how easily a company can
pay interest on its outstanding debts.
generally the higher the ratio is better
The ratio shows average of CFO by PAT
for last 5 years. The ratio higher than 1 is
good and company is good and it tells us
the company is turning its profit into cash
It is used to calculate company's market
value with cash flow. just like PE ratio, this
ratio when compared to peers is lower the
better.
• When compared to peers we found out that HCL is below TCS, INFOSYS and
WIPRO . But, EPS and ROE of HCL is better than wipro . Overall we can say that
hcl is currently performing good.
CONCLUSION
So we can conclude that the company has delivered strong financial performance. HCL has also
delivered industry leading growth and returns for shareholders.
• -Low debt to equity ratio of 0.0
• -Company is almost debt free.
• Interest coverage ids 47.96 and price to cash flow is 27.18
Overall, the company has solid fundamentals and has delivered consistent growth and profitability. The
revenue growth will see some slowdown in the coming years which will impact the margins, but this is
however temporary, and the company still remains a good investment for the long term.
So, from our fundamental analysis we can conclude that HCL Tech is sound for investment
Fundamental analysis of HCL Tech (2021)

Fundamental analysis of HCL Tech (2021)

  • 1.
    HCL Tech Fundamental Analysis Presentationby: Simran Madan ICG/2018/25346 B.COM (Hons) FSG
  • 2.
    Introduction to HCLTech Hindustan Computers Limited (HCL) started its operations in 1976 and launched India’s first 8C microcomputer in 1978. Since then, the company has diversified into 4 main verticals namely HCL Tech, HCL infosystems, HCL Healthcare and HCL foundation. The company’s shares have a 52-week high of INR 1,067and a total market capitalization of INR 1.25 Trillion, which makes it a Large-Cap company. HCL Technologies has been one of the fastest-growing technology companies in the world since the last decade and has a presence in 46 countries while employing 1,50,000+ professionals.
  • 4.
    Introduction to Fundamental Analysis Fundamentalanalysis is the analysis of a business's financial statements, health, competitors and markets. It also considers the overall state of the economy and factors including interest rates, production, earnings, employment, GDP, housing, manufacturing and management.
  • 5.
  • 6.
    ECONOMIC ANALYSIS • HCLannual results for FY 2020 has shown revenue growth of 16.7% YoY in constant currency and Net income growth of 9.3% YoY. The company has also seen a slight increase in ROE to 23.6% during this period. Overall, the growth continues to be linear for the company. • The strong revenue growth is driven by the organic growth and acceleration of Mode 2 and Mode 3 business. Products and Platform grew by 60.5% YoY, IT and Business grew by 12.7% and ERS business grew by 12.8% YoY on a constant currency basis.
  • 7.
    At first, HCLTech’s share dive at 3% after it failed to enthuse in quarter 1 but, now the company expects strong growth from HCL Tech in quater 2 and believes it will stay bullish
  • 8.
    INDUSTRIAL ANALYSIS India isthe world’s largest sourcing destination, accounting for approximately 55 percent of the US$ 146 billion markets. The country’s cost competitiveness in providing Information Technology (IT) services, which is approximately 3-4 times cheaper than the US, continues to be its Unique Selling Proposition (USP) in the global sourcing market India’s highly qualified talent pool of technical graduates is one of the largest in the world and is available at a cost saving of 60-70 percent to source countries. This large pool of qualified skilled workforce has enabled Indian IT companies to help clients to save US$ 200 billion in the last five years. India’s IT industry amounts to 12.3 percent of the global market, largely due to exports. Export of IT services accounted for 56.12 percent of total IT exports (including hardware) from India. The Business Process Management (BPM) segment accounted for 23.46 percent of total IT exports during FY15. The Government of India has extended tax holidays to the IT sector for software technology parks of India (STPI) and Special Economic Zones (SEZs). Further, the country is providing procedural ease and single window clearance for setting up facilities.
  • 9.
    Company overview: Indian MultinationalIT company based in Noida Uttar Pradesh. The company operates in IT consulting, remote infrastructure management, BPO, and Operating in many sectors like Aerospace, healthcare, automotive, consumer electronics, energy and other utilities, financial services, Govt services, industrial manufacturing, life sciences, media, entertainment, Mining, public services, retail and consumer, Semiconductors, Server and storage, telecommunications, transportation, logistics, hospitality. The Company has offices in 34 countries and having tie-ups With many big companies. Even though the stock is not performing well, the future Outlook is clear. Automation including BPO, Application development, Infrastructure and engineering, and others including cloud all part of services provided by the company. Cloud, IoT, and Security segments hold 20%-30% YoY growth potential as per HDFC securities. Though revenue from Application is not growing fast, and in fact decline in percentage term concerning Total revenue. Big growth is coming from Infrastructure. But as per the new plan of the company, the company is concentrating on IoT and cloud computing. HDFC securities also highlighted the fact that Wipro and INFOSYS Tier 1 revenue is not growing, HCL Tech is eating that segment. On some Frontier, HCL technologies performance is better
  • 10.
  • 11.
    From the aboveperformance we can conclude that recently TCS and Infosys took over HCL but as per the latest 2nd quarter report we believe that HCL will soon take over Infosys again.
  • 13.
    COMPANY ANALYSIS HCL TechnologyLtd, operating in IT Software sector. HCL Tech Ltd. key Products include Information Technology & Consultancy Services for the year ending 31-Mar-2018.For the quarter ended 31-03-2021, the company has reported a Consolidated Total Income of ₹11,169 crore (US$1.6 billion), grew by 10.7% YoY, – Products & Platforms grew by 6.0% YoY. Gross Cash stands at US$ 2,584 mn and Net Cash at US$ 2,053 mn at the end of June 30th, 2021. LTM EPS at ₹ 49.0 registered healthy growth at 13.0% YoY.
  • 14.
    KEY SUCCESS FACTOR •They are leveraging the latest technologies in human capital management to reimaging the employee experience and create an empowered, connected, and talent-driven workforce, geared for the future of work, capability, ability to execute, and success at delivering HR solutions that are aligned with today’s CHRO strategies. • HCL Tech offers services across the consult-to-operate spectrum, supported by a strong investment focus on innovation • HCL Tech is a preferred business partner with demonstrated capabilities in digital HR transformation and focus on enhancing employee experience and productivity for customers
  • 15.
    This is last5 year share price of HCL Tech. Here we can see that since 2018 share price is continuously rising with some minor downfalls but in 2020 due to covid there can be seen a major downfall. After that share started to rise and soon it was nearly doubled from past years performance
  • 16.
    PROFIT AND LOSSACCOUNT The net sales of the company is increasing indicating the good health and growth of the company and also we can see the operating profit of the company is increasing which again is a good sign for growth of the company.
  • 17.
    Growth Ratios The revenuehas shown a growth of 20% CAGR over the last 10 years. The operating income and net income has also grown at 21% and 22.6% CAGR, respectively. This shows improving efficiency and profitability of the company. The working capital is also positive and has shown a linear growth. Capital expenditure has also increased with scale.
  • 18.
  • 19.
  • 20.
    • HCLTECH isgood value based on its PE Ratio (20.9x) compared to the Indian IT industry average (32.9x). • Earnings are forecast to grow 10.81% per year • Earnings have grown 7.9% per year over the past 5 years Average PE (3 Yrs): 17.54 It is calculated as: (Price per share/ Earnings per Share). As a thumb rule, a company with a lower PE ratio is undervalued compared to the companies with a higher PE ratio. The average PE ratio varies depending on the industry PRICE EARNING RATIO
  • 21.
    r SALES GROWTH: Itshows the compounded growth in net sales for 1,3 and 5 years. The graph shows the past 5 year figure of net sales and CAGR% is shown below the box. (vales are in crore) PROFIT GROWTH: It shows the compounded growth in net profit for 1,3 and 5 years. The graph shows the past 5 year figure of net profit and CAGR% is shown below the box. (vales are in crore)
  • 22.
    Return on Equity(ROE): It measures the ability of a firm to generates profit from its shareholders investment in the company. The graph here shows ROE% of last 5 years and below are the average value of 1,3 and 5 years. Return on capital employed (ROCE): It measures how efficiently a company is using its capital employed. The graph here shows ROCE% of last 5 years and below are the average value of 1,3 and 5 years.
  • 23.
    It is ameasure of a degree to which company is financing its operations through debts vs. wholly owned funds. Ideal D/E ratio should be less than 1. It determines how easily a company can pay interest on its outstanding debts. generally the higher the ratio is better The ratio shows average of CFO by PAT for last 5 years. The ratio higher than 1 is good and company is good and it tells us the company is turning its profit into cash It is used to calculate company's market value with cash flow. just like PE ratio, this ratio when compared to peers is lower the better.
  • 24.
    • When comparedto peers we found out that HCL is below TCS, INFOSYS and WIPRO . But, EPS and ROE of HCL is better than wipro . Overall we can say that hcl is currently performing good.
  • 26.
    CONCLUSION So we canconclude that the company has delivered strong financial performance. HCL has also delivered industry leading growth and returns for shareholders. • -Low debt to equity ratio of 0.0 • -Company is almost debt free. • Interest coverage ids 47.96 and price to cash flow is 27.18 Overall, the company has solid fundamentals and has delivered consistent growth and profitability. The revenue growth will see some slowdown in the coming years which will impact the margins, but this is however temporary, and the company still remains a good investment for the long term. So, from our fundamental analysis we can conclude that HCL Tech is sound for investment