What is aRandom Variable?
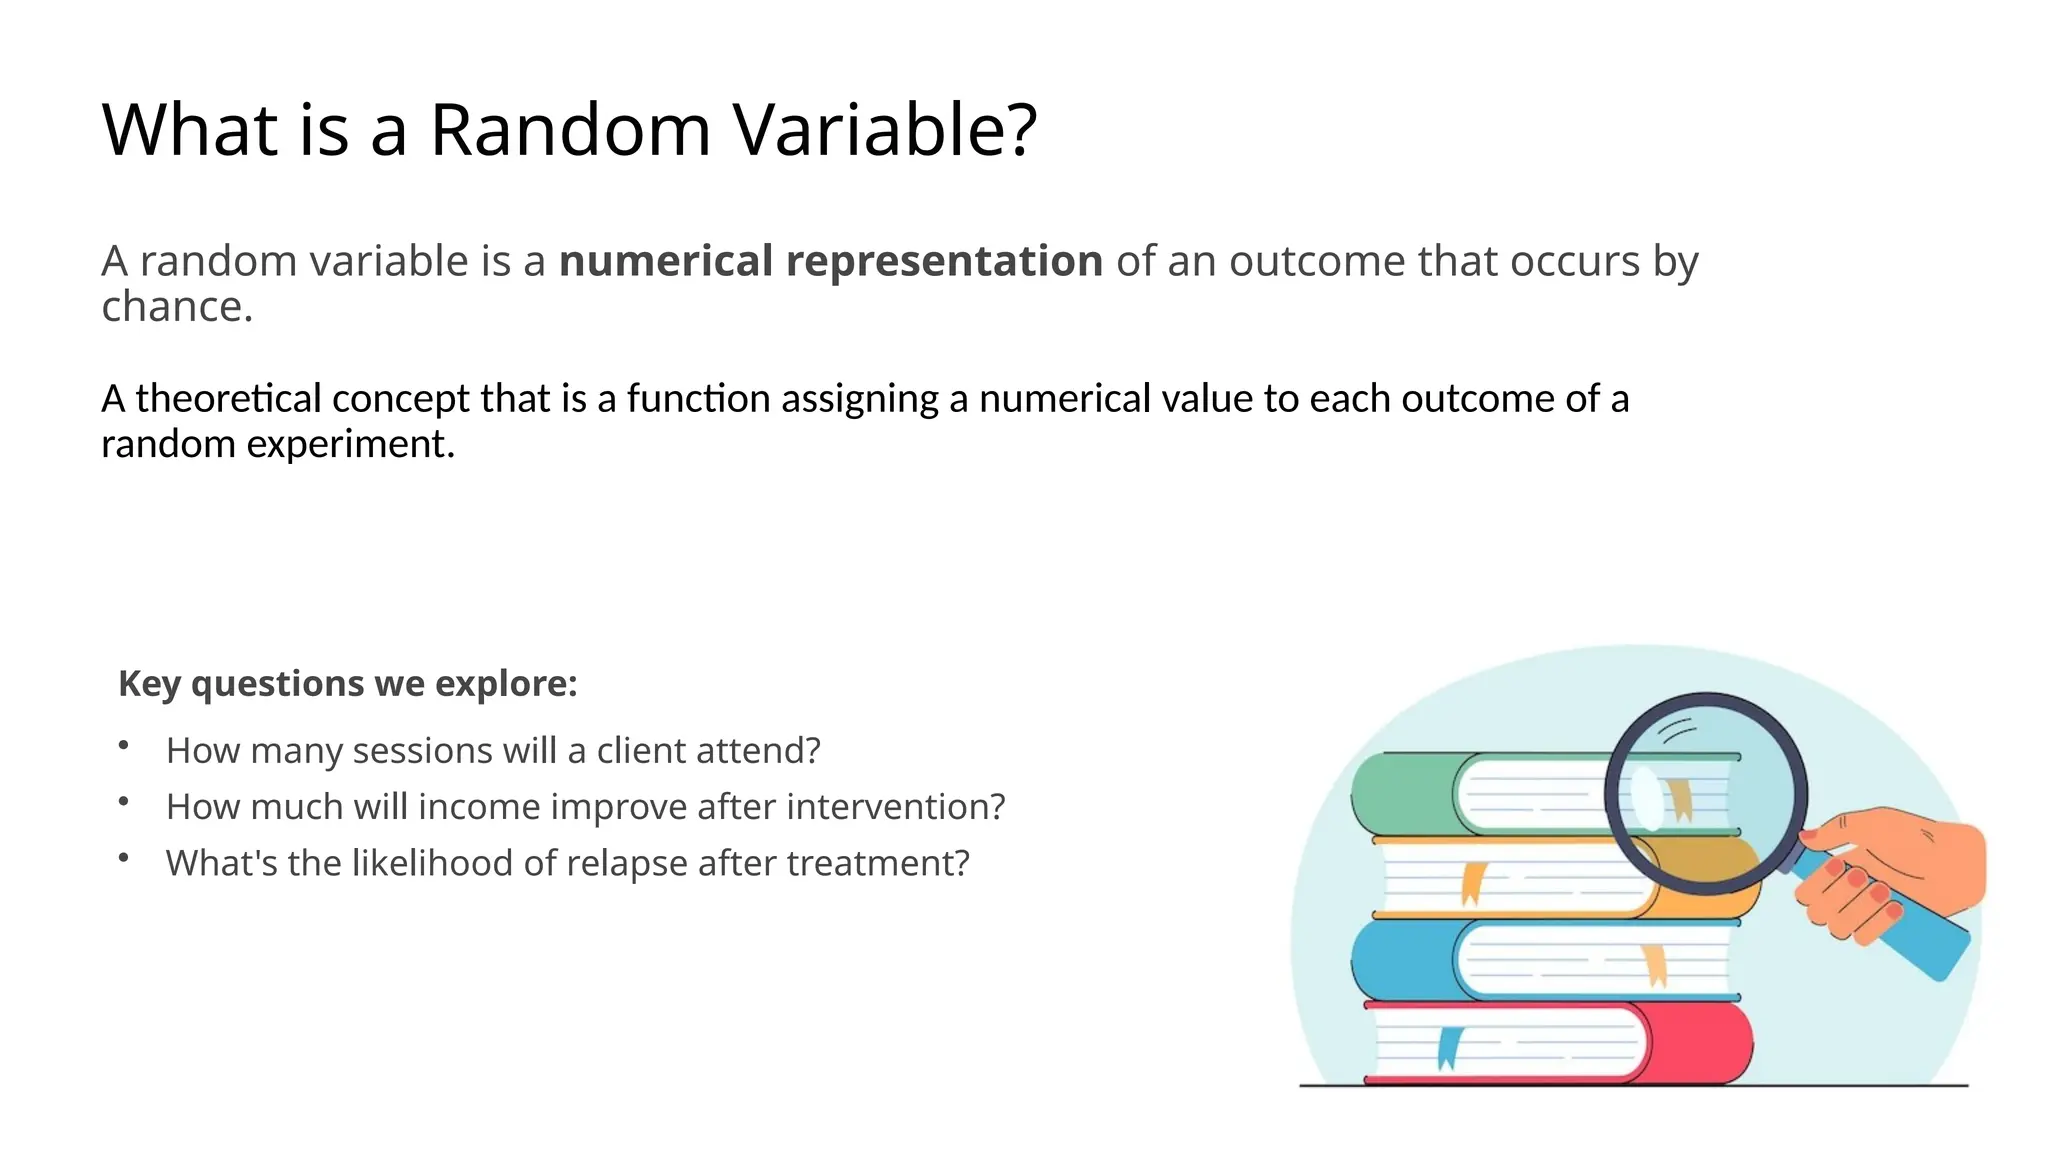
A random variable is a numerical representation of an outcome that occurs by
chance.
A theoretical concept that is a function assigning a numerical value to each outcome of a
random experiment.
Key questions we explore:
• How many sessions will a client attend?
• How much will income improve after intervention?
• What's the likelihood of relapse after treatment?
3.
Types of RandomVariables
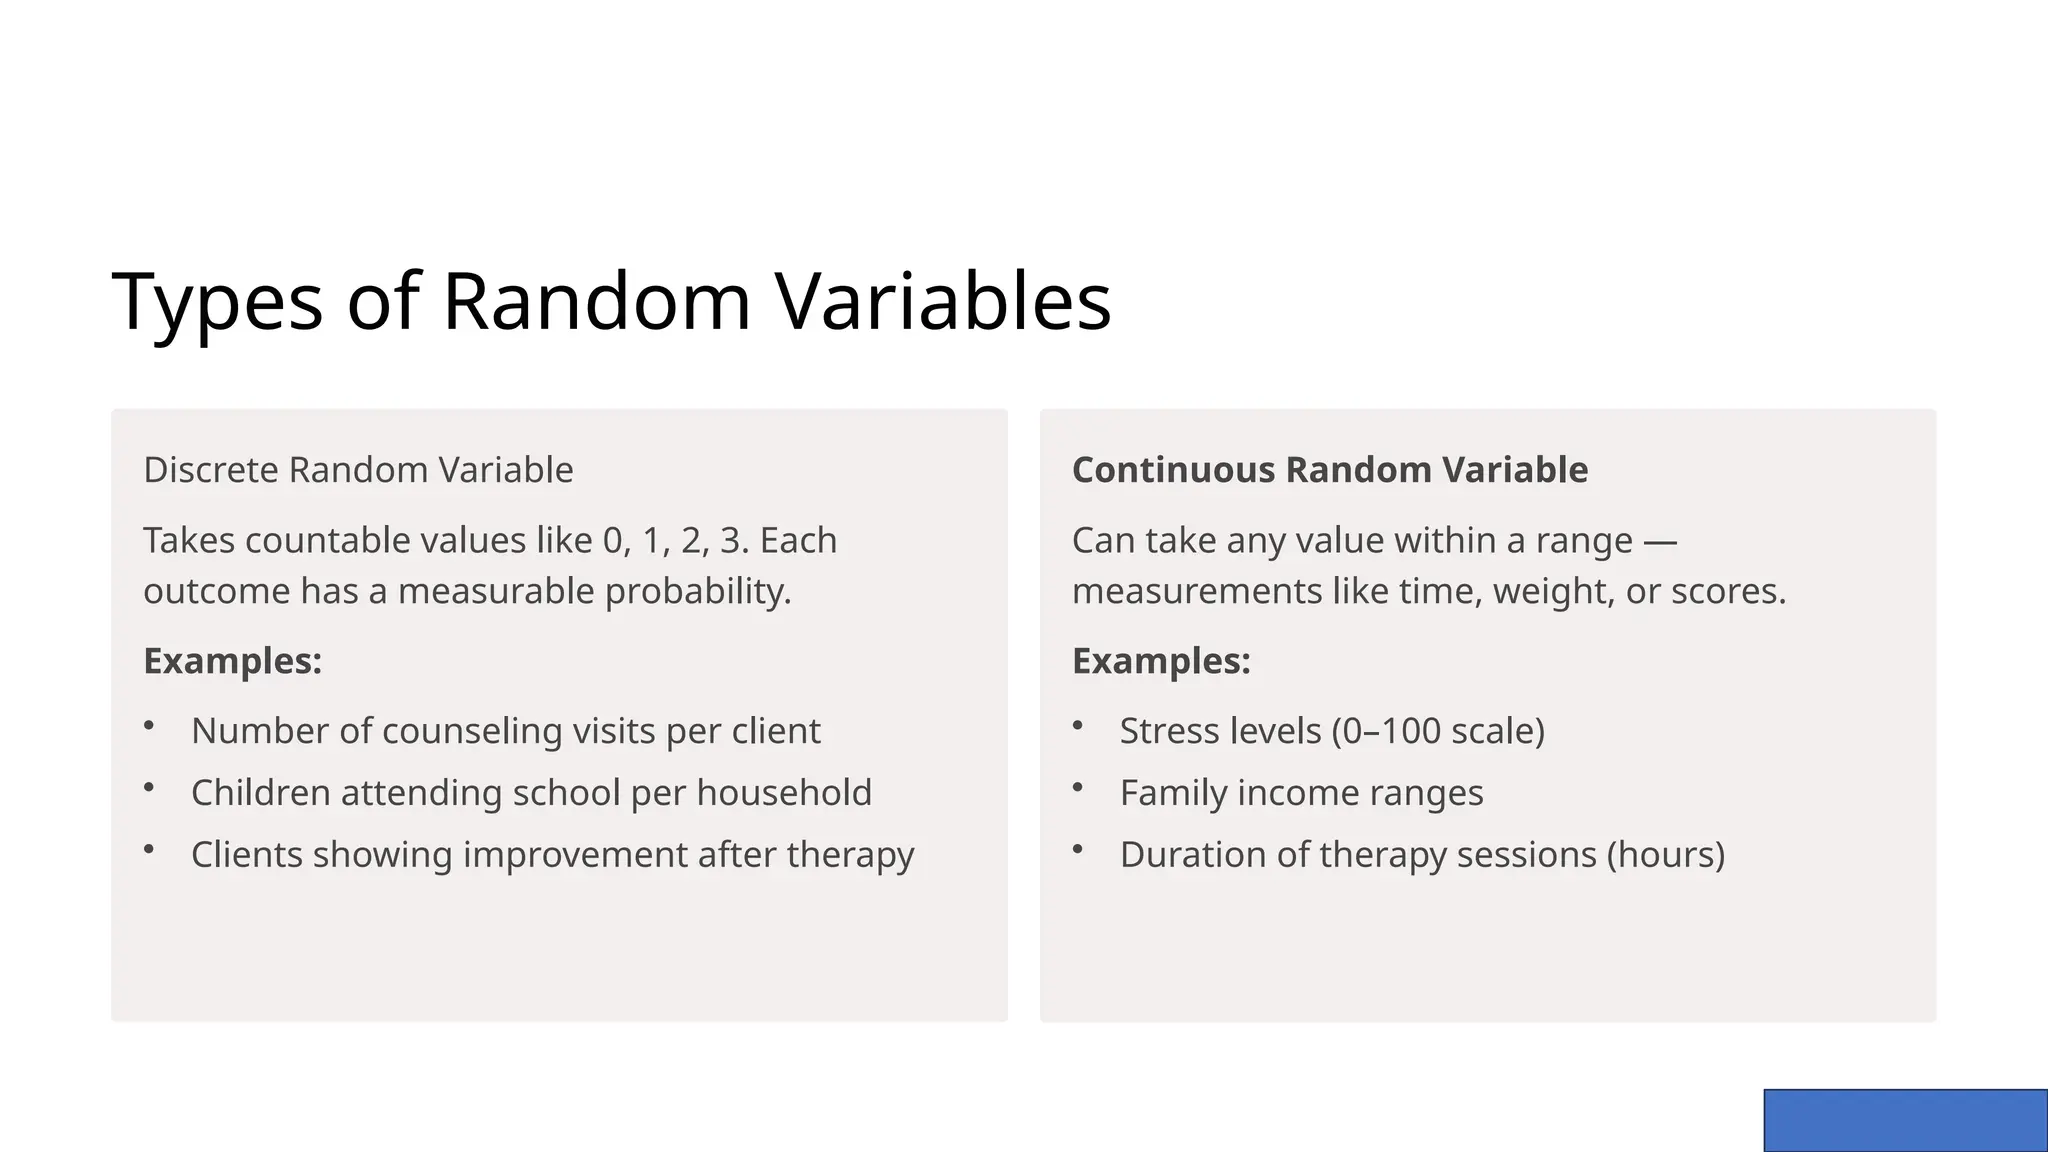
Discrete Random Variable
Takes countable values like 0, 1, 2, 3. Each
outcome has a measurable probability.
Examples:
• Number of counseling visits per client
• Children attending school per household
• Clients showing improvement after therapy
Continuous Random Variable
Can take any value within a range —
measurements like time, weight, or scores.
Examples:
• Stress levels (0–100 scale)
• Family income ranges
• Duration of therapy sessions (hours)
4.
What is aFunction of a
Random Variable?
A function of a random variable is created when we apply a
mathematical rule to transform or combine random variables.
If X is a random variable and g(X) is a mathematical function,
then Y = g(X) is a function of a random variable.
Why it matters: It allow social workers to create new
variables that show change, simplify complex data, or
represent meaningful outcomes in their research and
practice.
5.
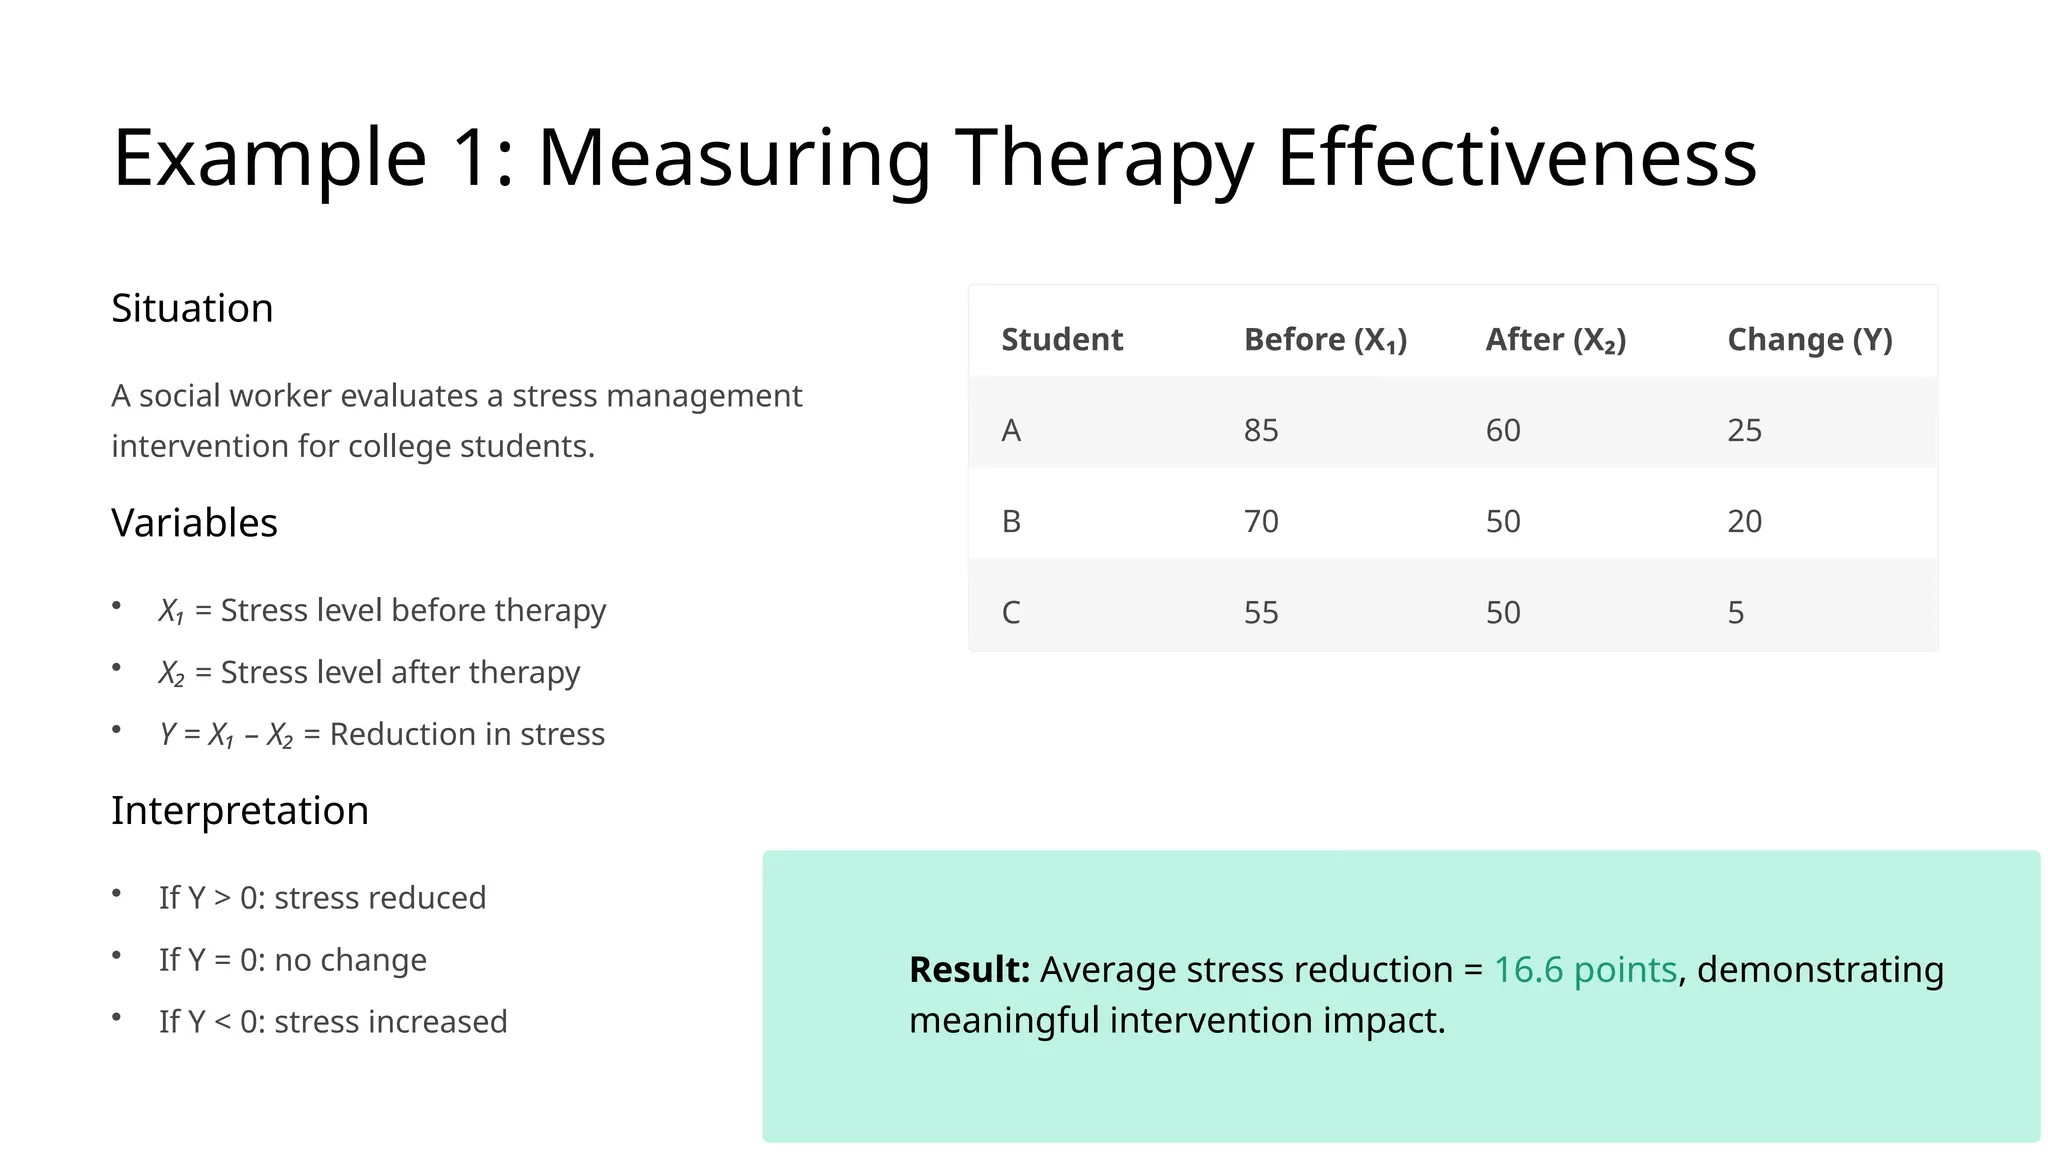
Example 1: MeasuringTherapy Effectiveness
Situation
A social worker evaluates a stress management
intervention for college students.
Variables
• X₁ = Stress level before therapy
• X₂ = Stress level after therapy
• Y = X₁ – X₂ = Reduction in stress
Interpretation
• If Y > 0: stress reduced
• If Y = 0: no change
• If Y < 0: stress increased
Student Before (X₁) After (X₂) Change (Y)
A 85 60 25
B 70 50 20
C 55 50 5
Result: Average stress reduction = 16.6 points, demonstrating
meaningful intervention impact.
6.
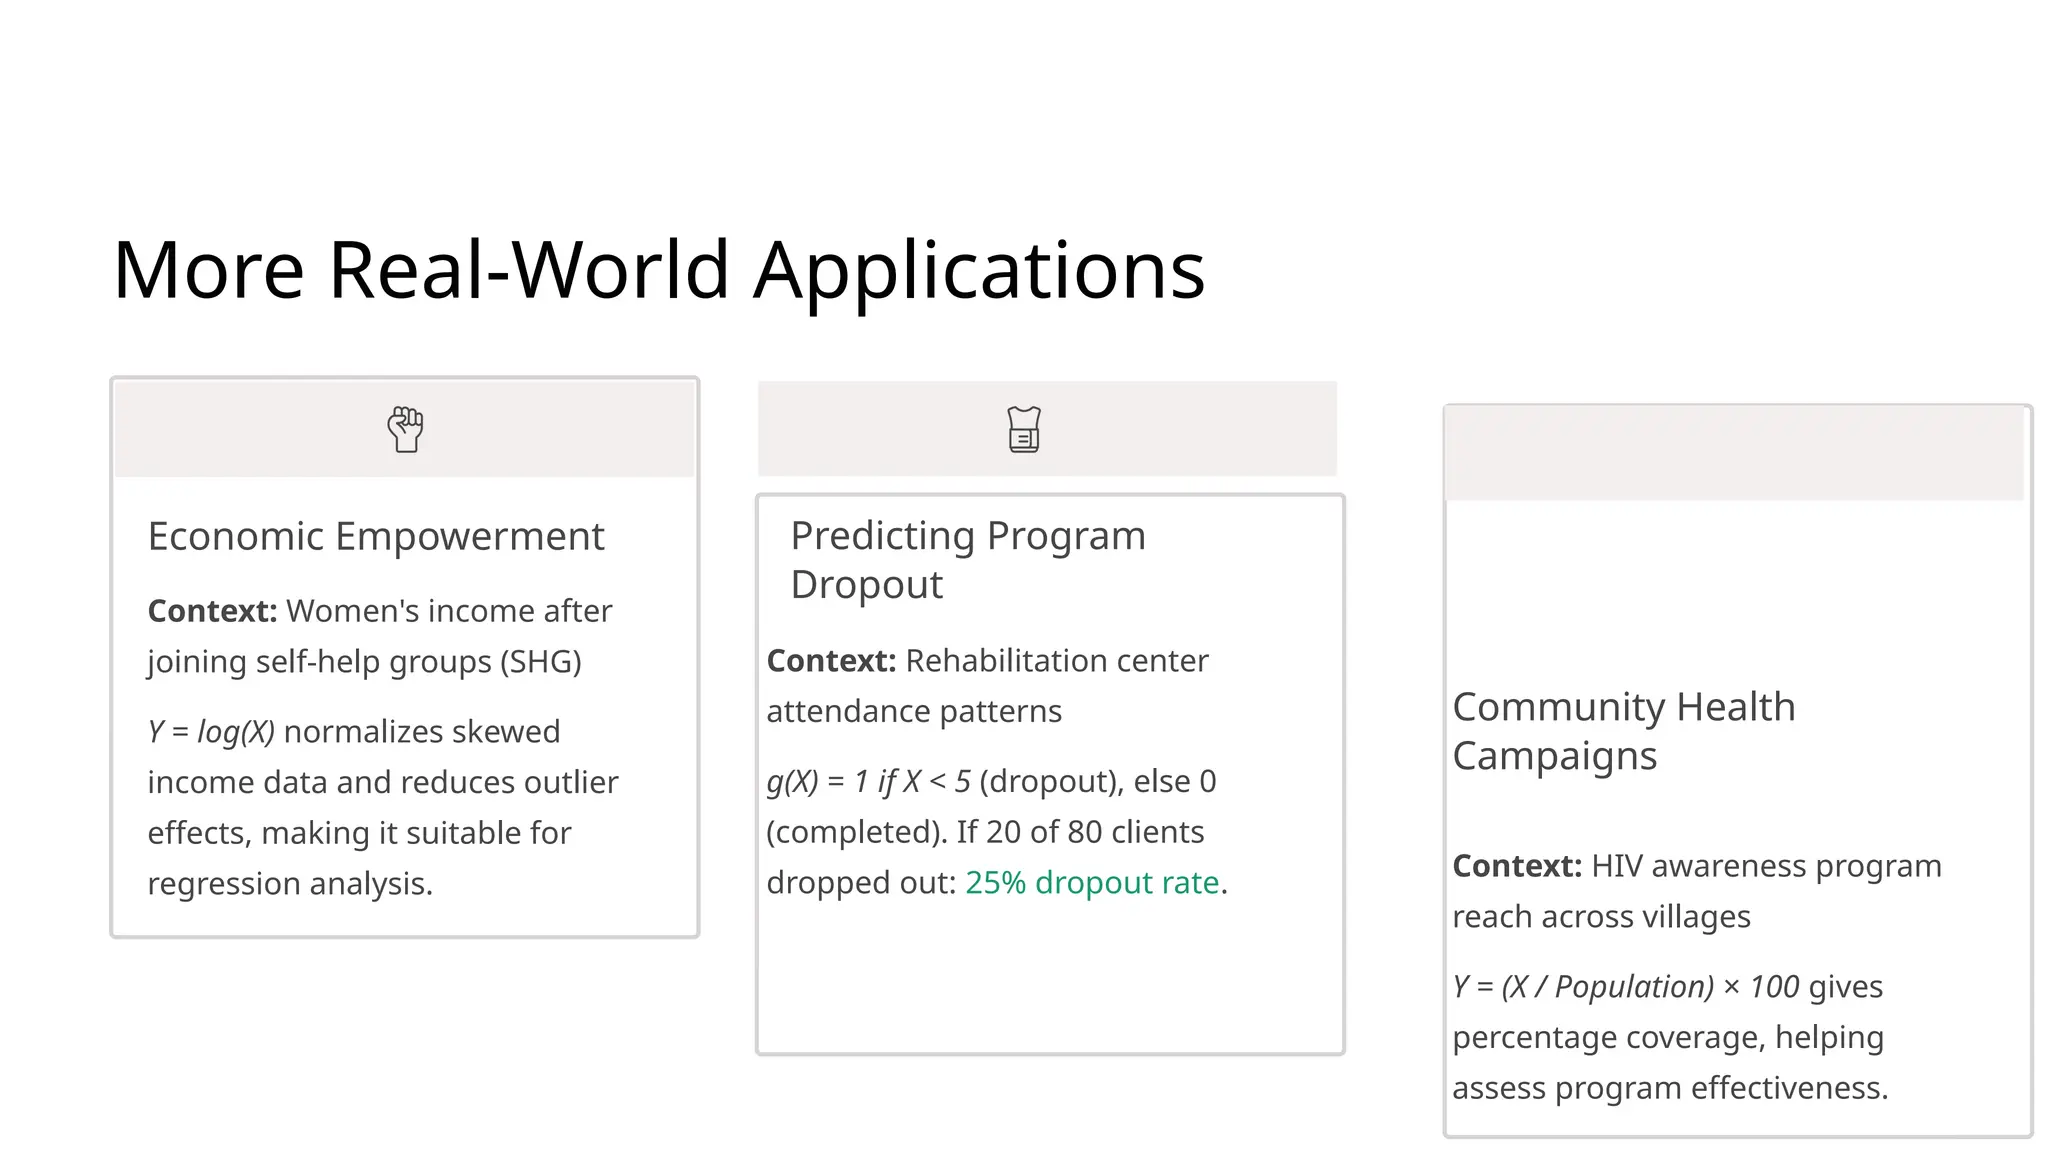
More Real-World Applications
EconomicEmpowerment
Context: Women's income after
joining self-help groups (SHG)
Y = log(X) normalizes skewed
income data and reduces outlier
effects, making it suitable for
regression analysis.
Predicting Program
Dropout
Context: Rehabilitation center
attendance patterns
g(X) = 1 if X < 5 (dropout), else 0
(completed). If 20 of 80 clients
dropped out: 25% dropout rate.
Community Health
Campaigns
Context: HIV awareness program
reach across villages
Y = (X / Population) × 100 gives
percentage coverage, helping
assess program effectiveness.
7.
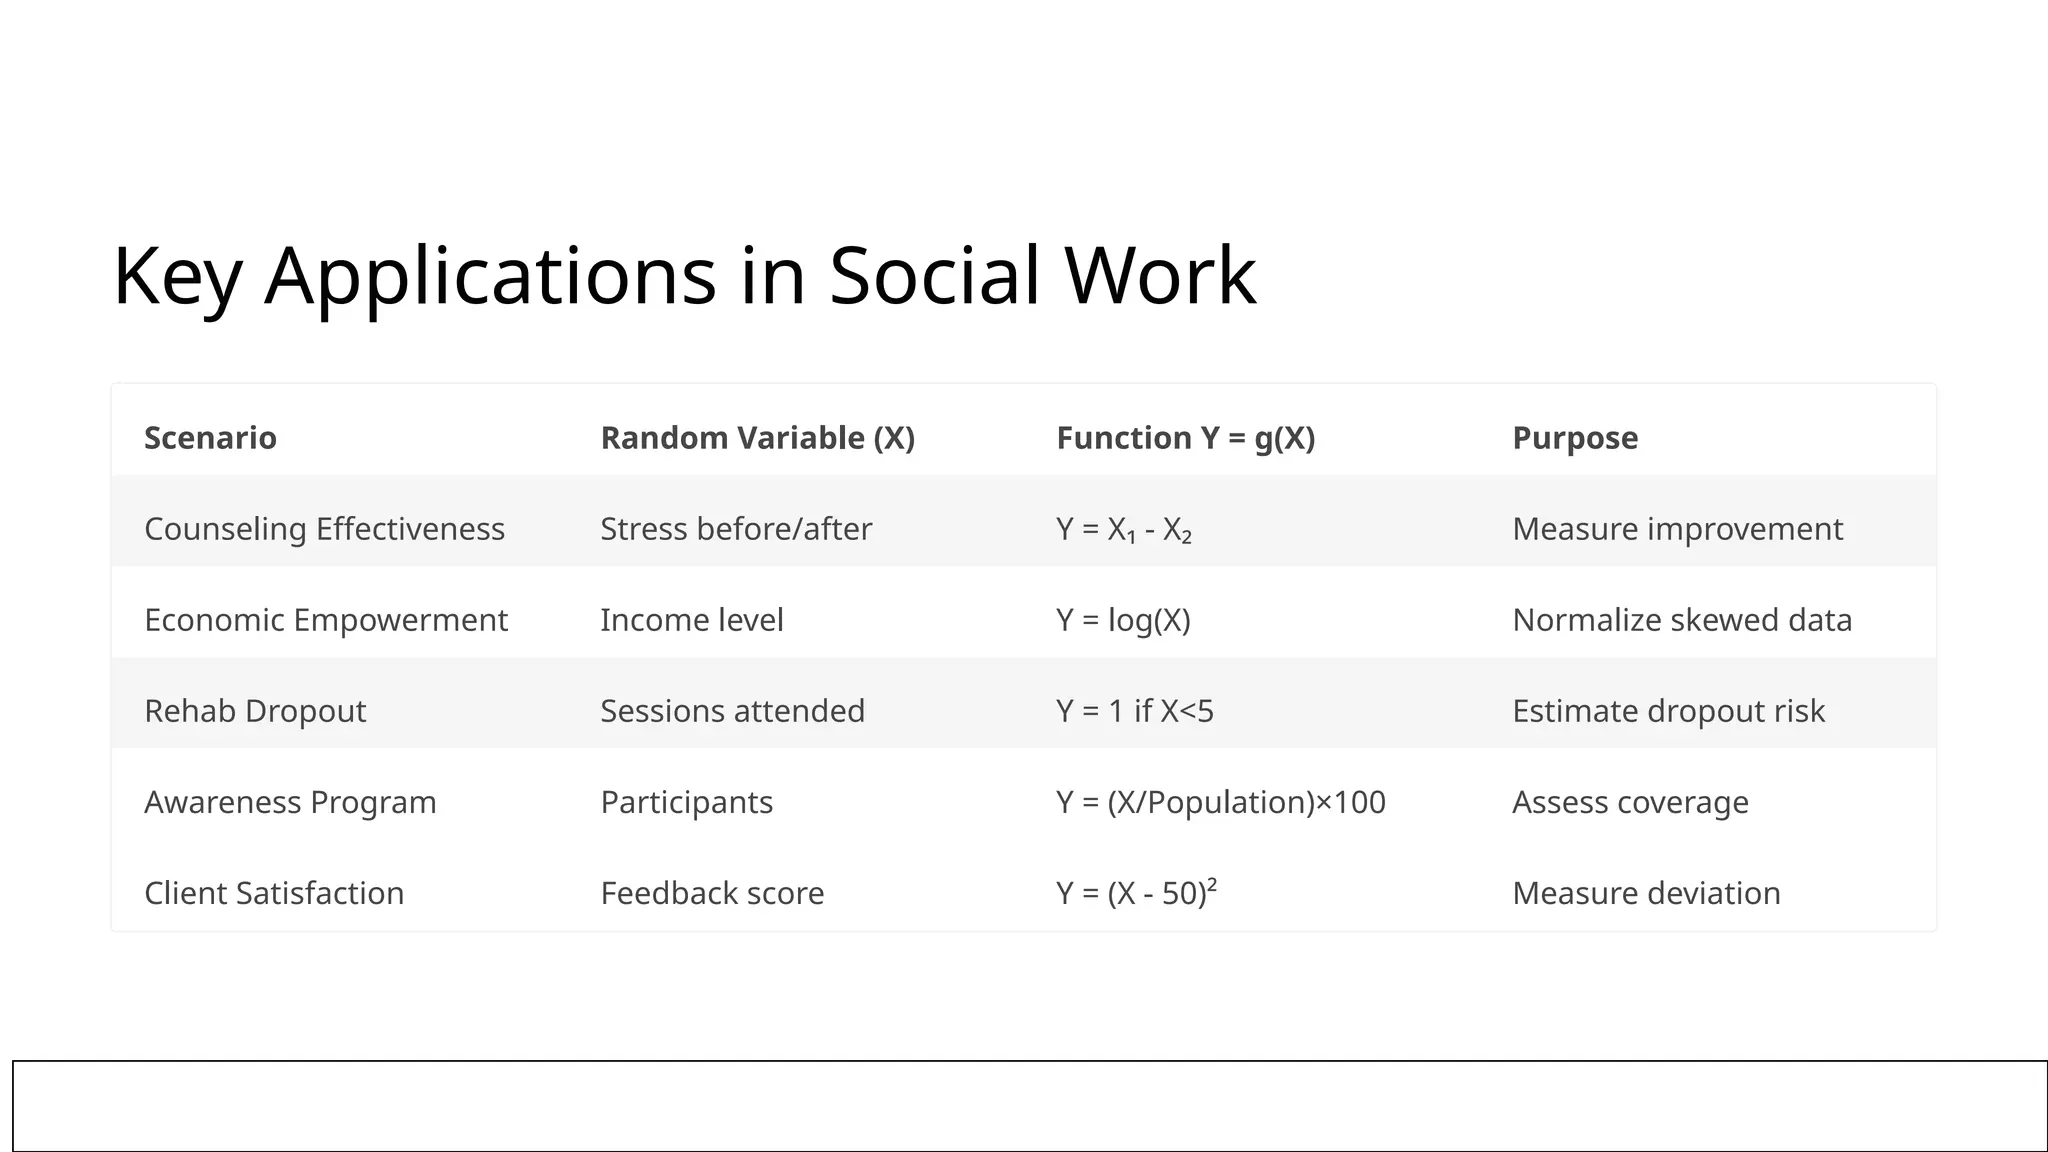
Key Applications inSocial Work
Scenario Random Variable (X) Function Y = g(X) Purpose
Counseling Effectiveness Stress before/after Y = X₁ - X₂ Measure improvement
Economic Empowerment Income level Y = log(X) Normalize skewed data
Rehab Dropout Sessions attended Y = 1 if X<5 Estimate dropout risk
Awareness Program Participants Y = (X/Population)×100 Assess coverage
Client Satisfaction Feedback score Y = (X - 50)² Measure deviation
8.
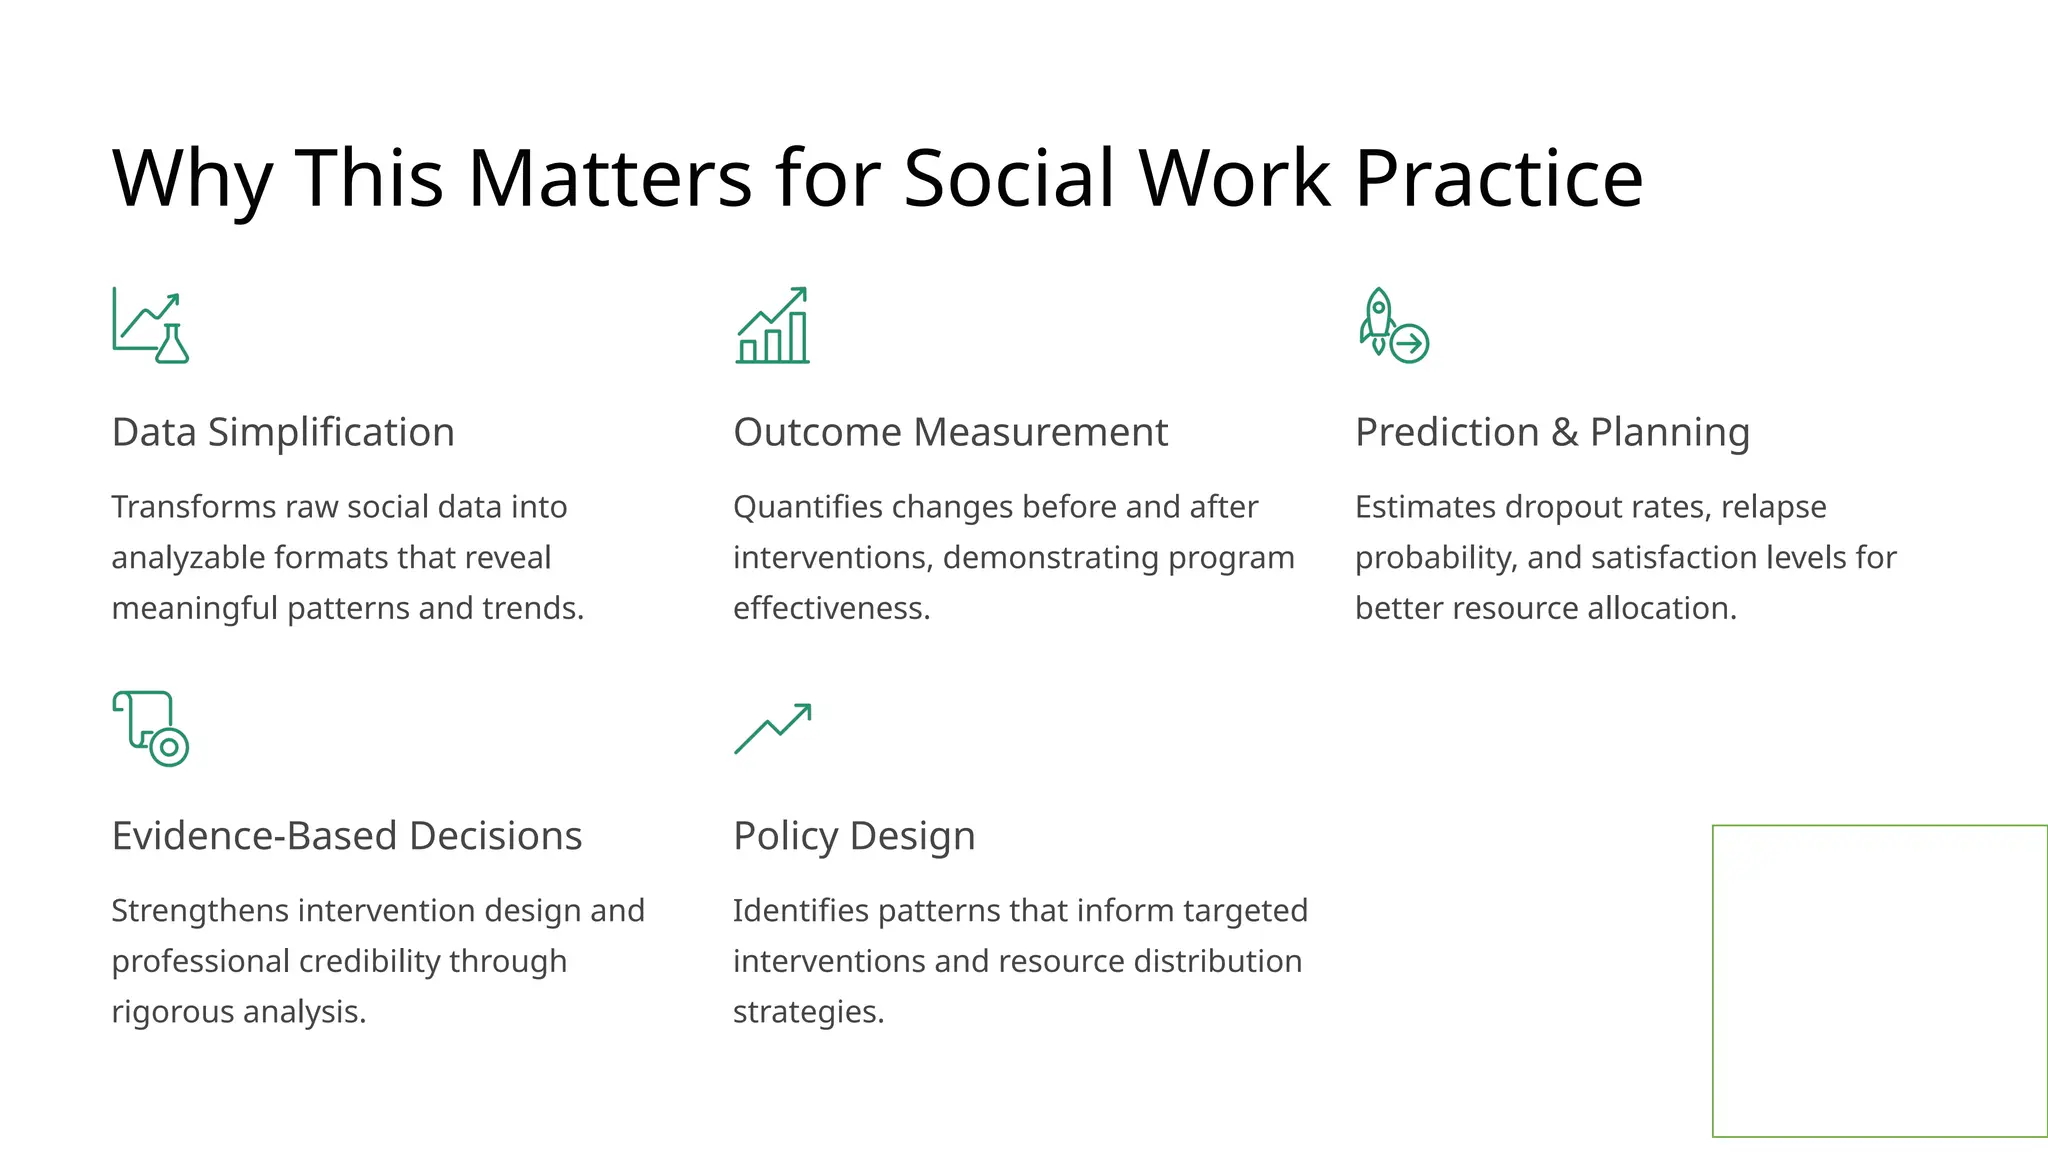
Why This Mattersfor Social Work Practice
Data Simplification
Transforms raw social data into
analyzable formats that reveal
meaningful patterns and trends.
Outcome Measurement
Quantifies changes before and after
interventions, demonstrating program
effectiveness.
Prediction & Planning
Estimates dropout rates, relapse
probability, and satisfaction levels for
better resource allocation.
Evidence-Based Decisions
Strengthens intervention design and
professional credibility through
rigorous analysis.
Policy Design
Identifies patterns that inform targeted
interventions and resource distribution
strategies.
9.
Key Takeaways
Random variableshelp
quantify uncertain human
and social behaviors in
measurable ways.
Functions transform
these variables to
analyze, compare, and
predict outcomes
scientifically.
These tools ensure
evidence-based,
impactful practice across
mental health, poverty
reduction, and
community programs.
10.
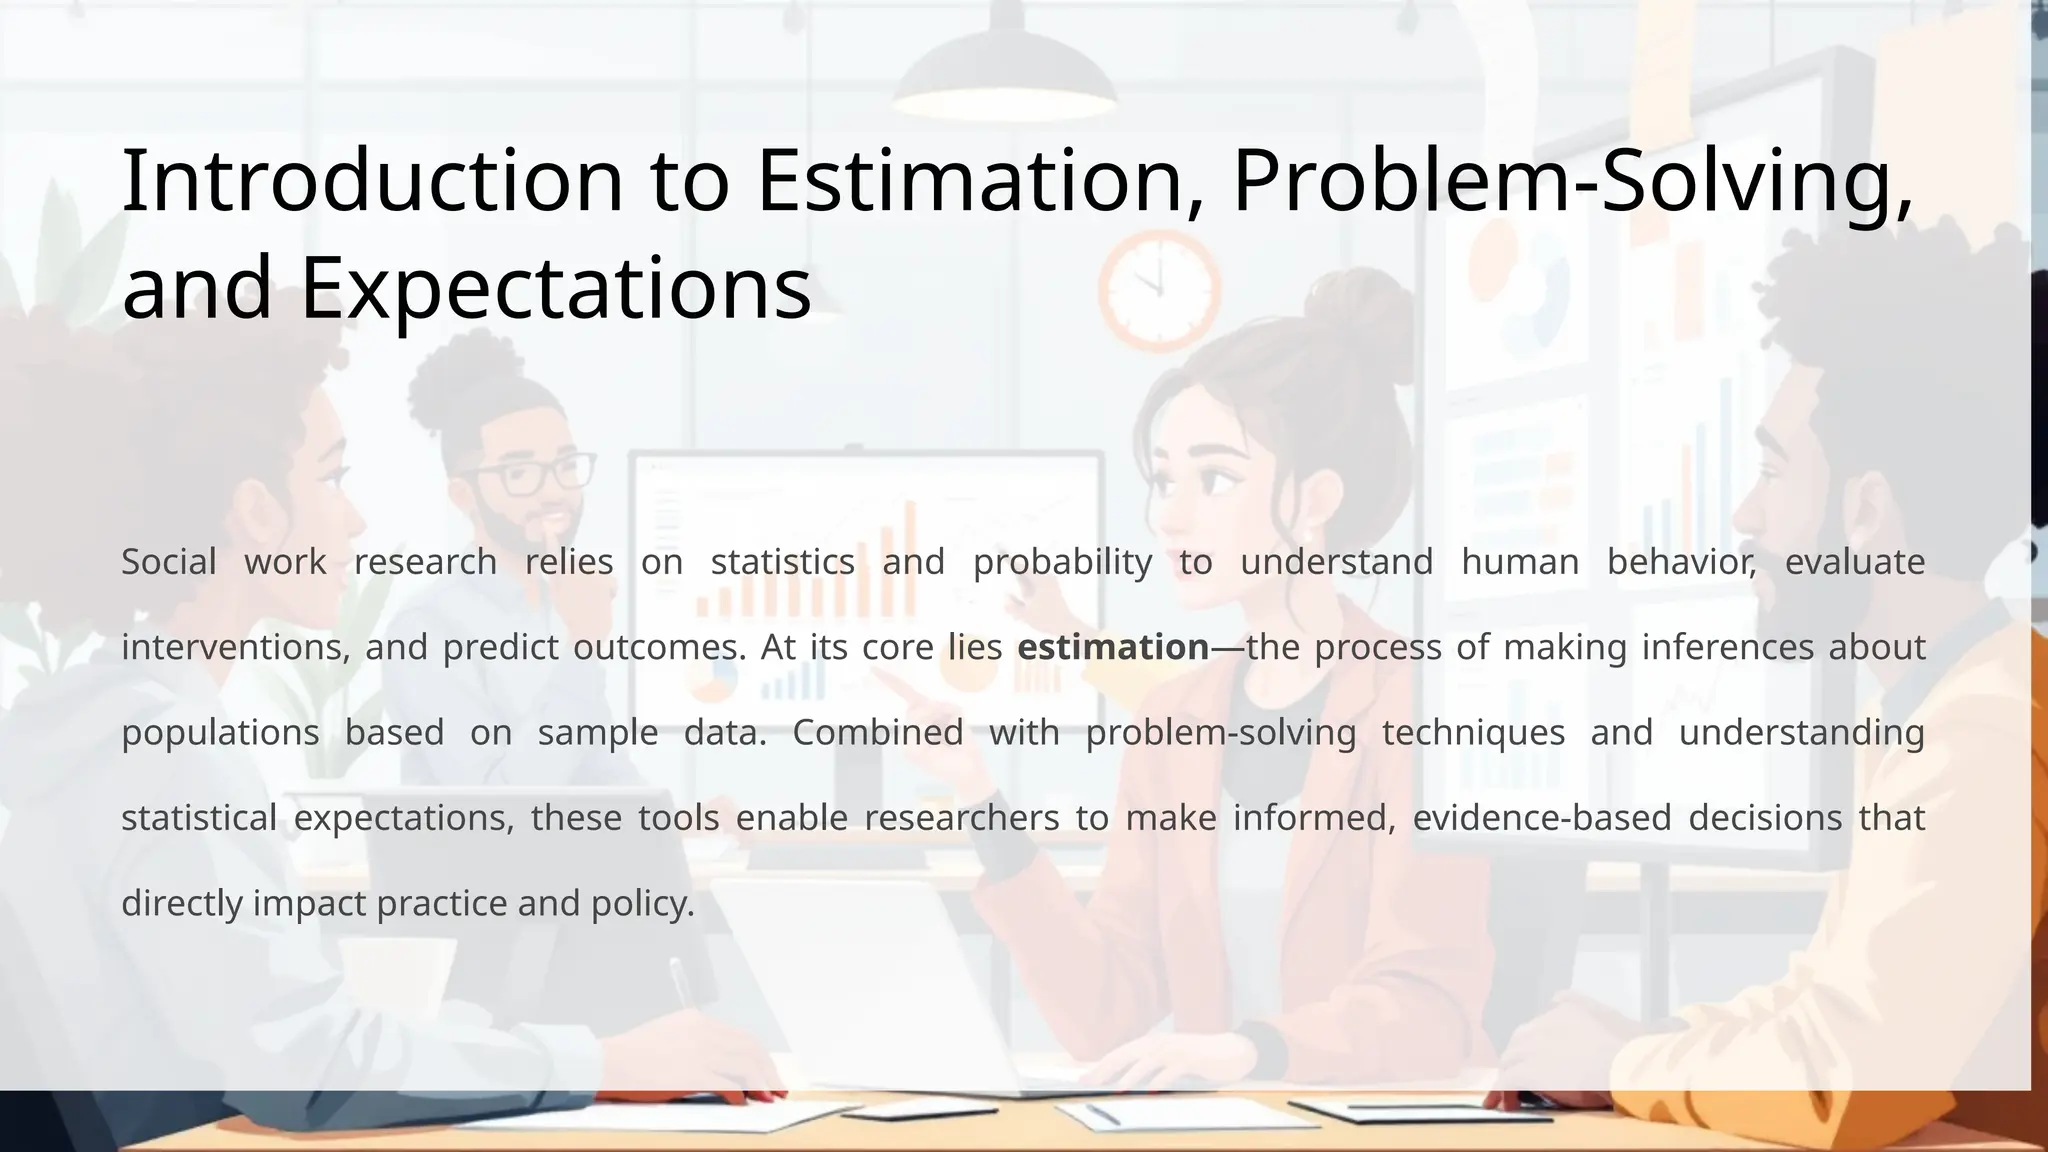
Introduction to Estimation,Problem-Solving,
and Expectations
Social work research relies on statistics and probability to understand human behavior, evaluate
interventions, and predict outcomes. At its core lies estimation—the process of making inferences about
populations based on sample data. Combined with problem-solving techniques and understanding
statistical expectations, these tools enable researchers to make informed, evidence-based decisions that
directly impact practice and policy.
11.
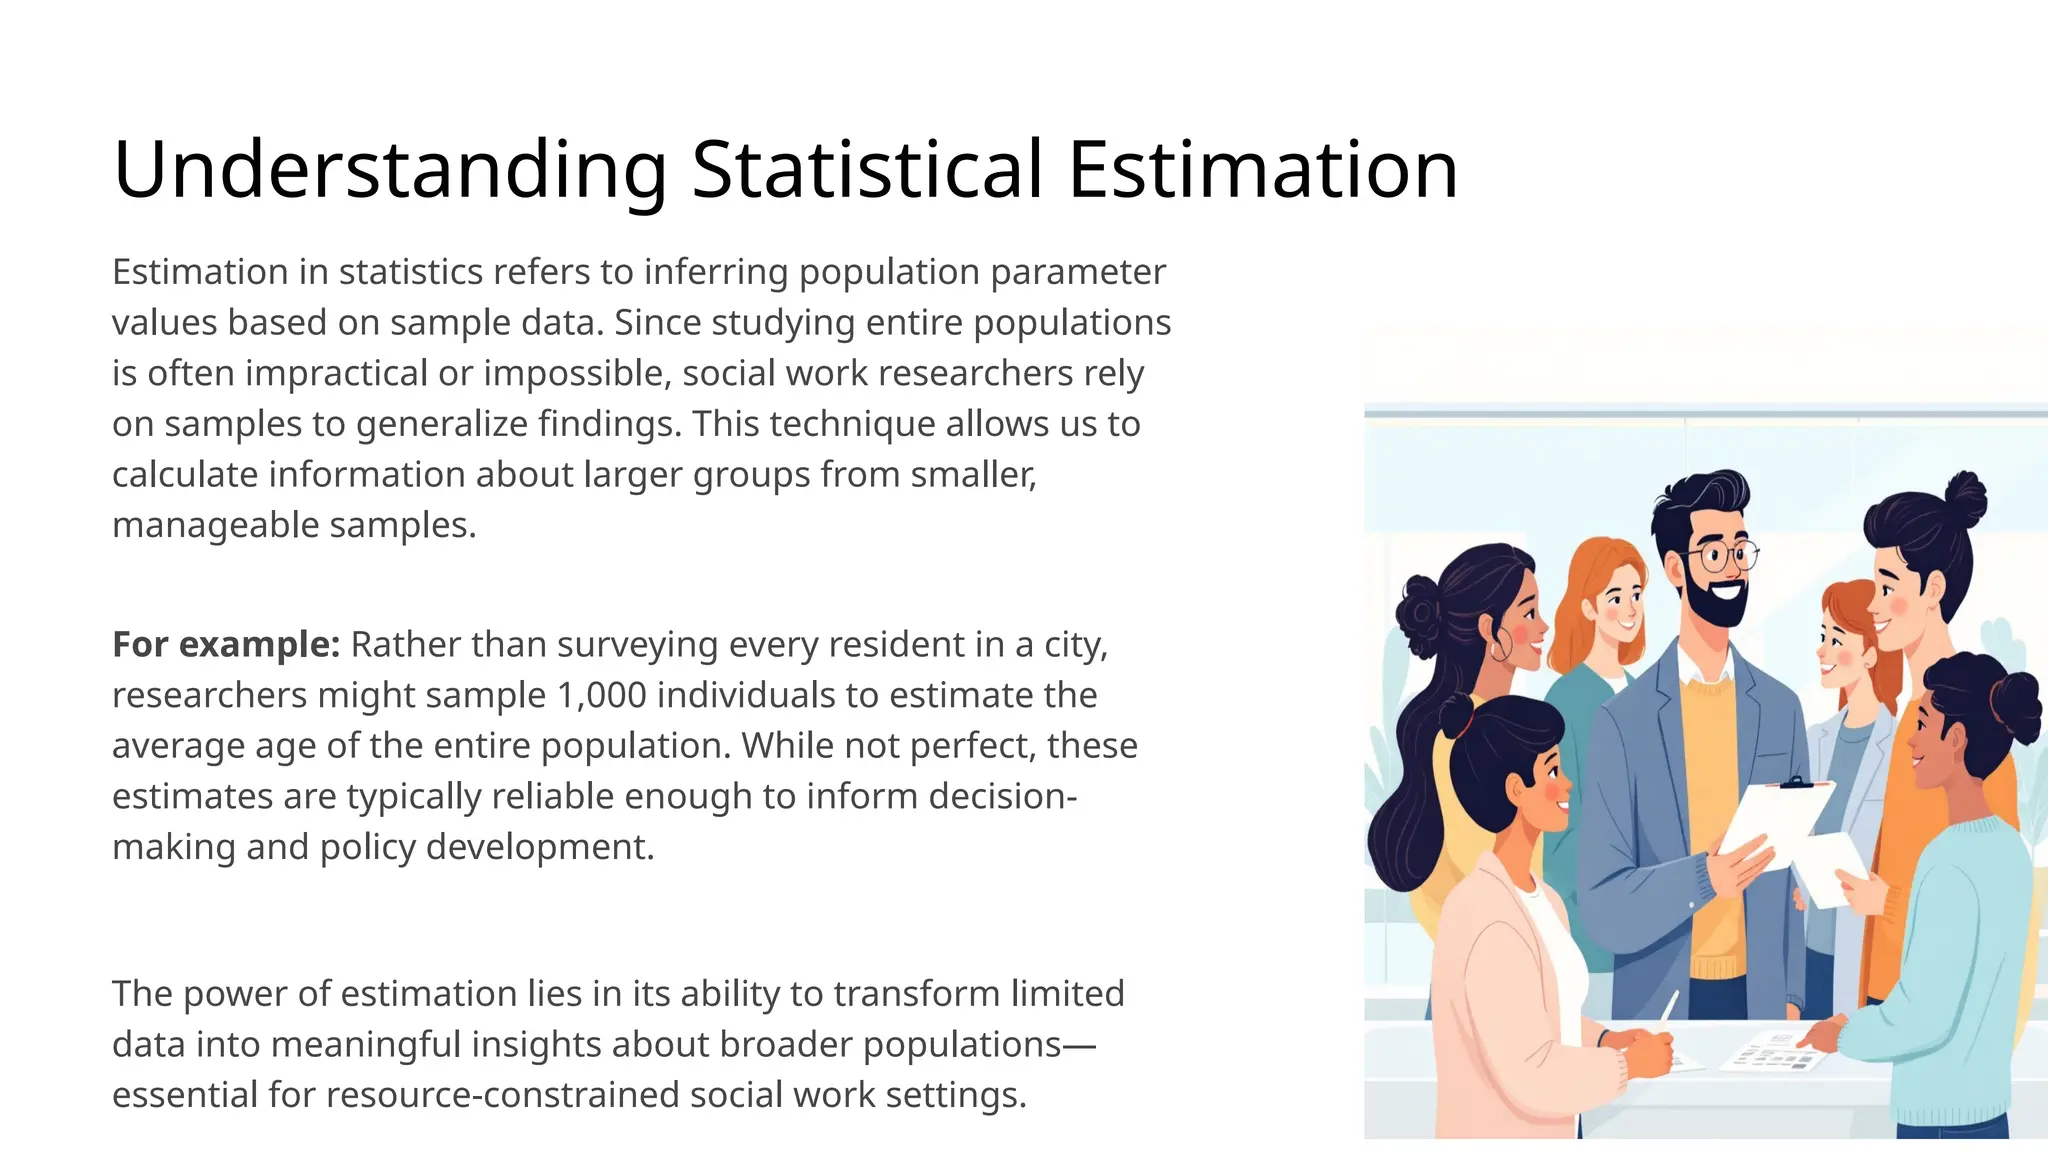
Understanding Statistical Estimation
Estimationin statistics refers to inferring population parameter
values based on sample data. Since studying entire populations
is often impractical or impossible, social work researchers rely
on samples to generalize findings. This technique allows us to
calculate information about larger groups from smaller,
manageable samples.
For example: Rather than surveying every resident in a city,
researchers might sample 1,000 individuals to estimate the
average age of the entire population. While not perfect, these
estimates are typically reliable enough to inform decision-
making and policy development.
The power of estimation lies in its ability to transform limited
data into meaningful insights about broader populations—
essential for resource-constrained social work settings.
12.
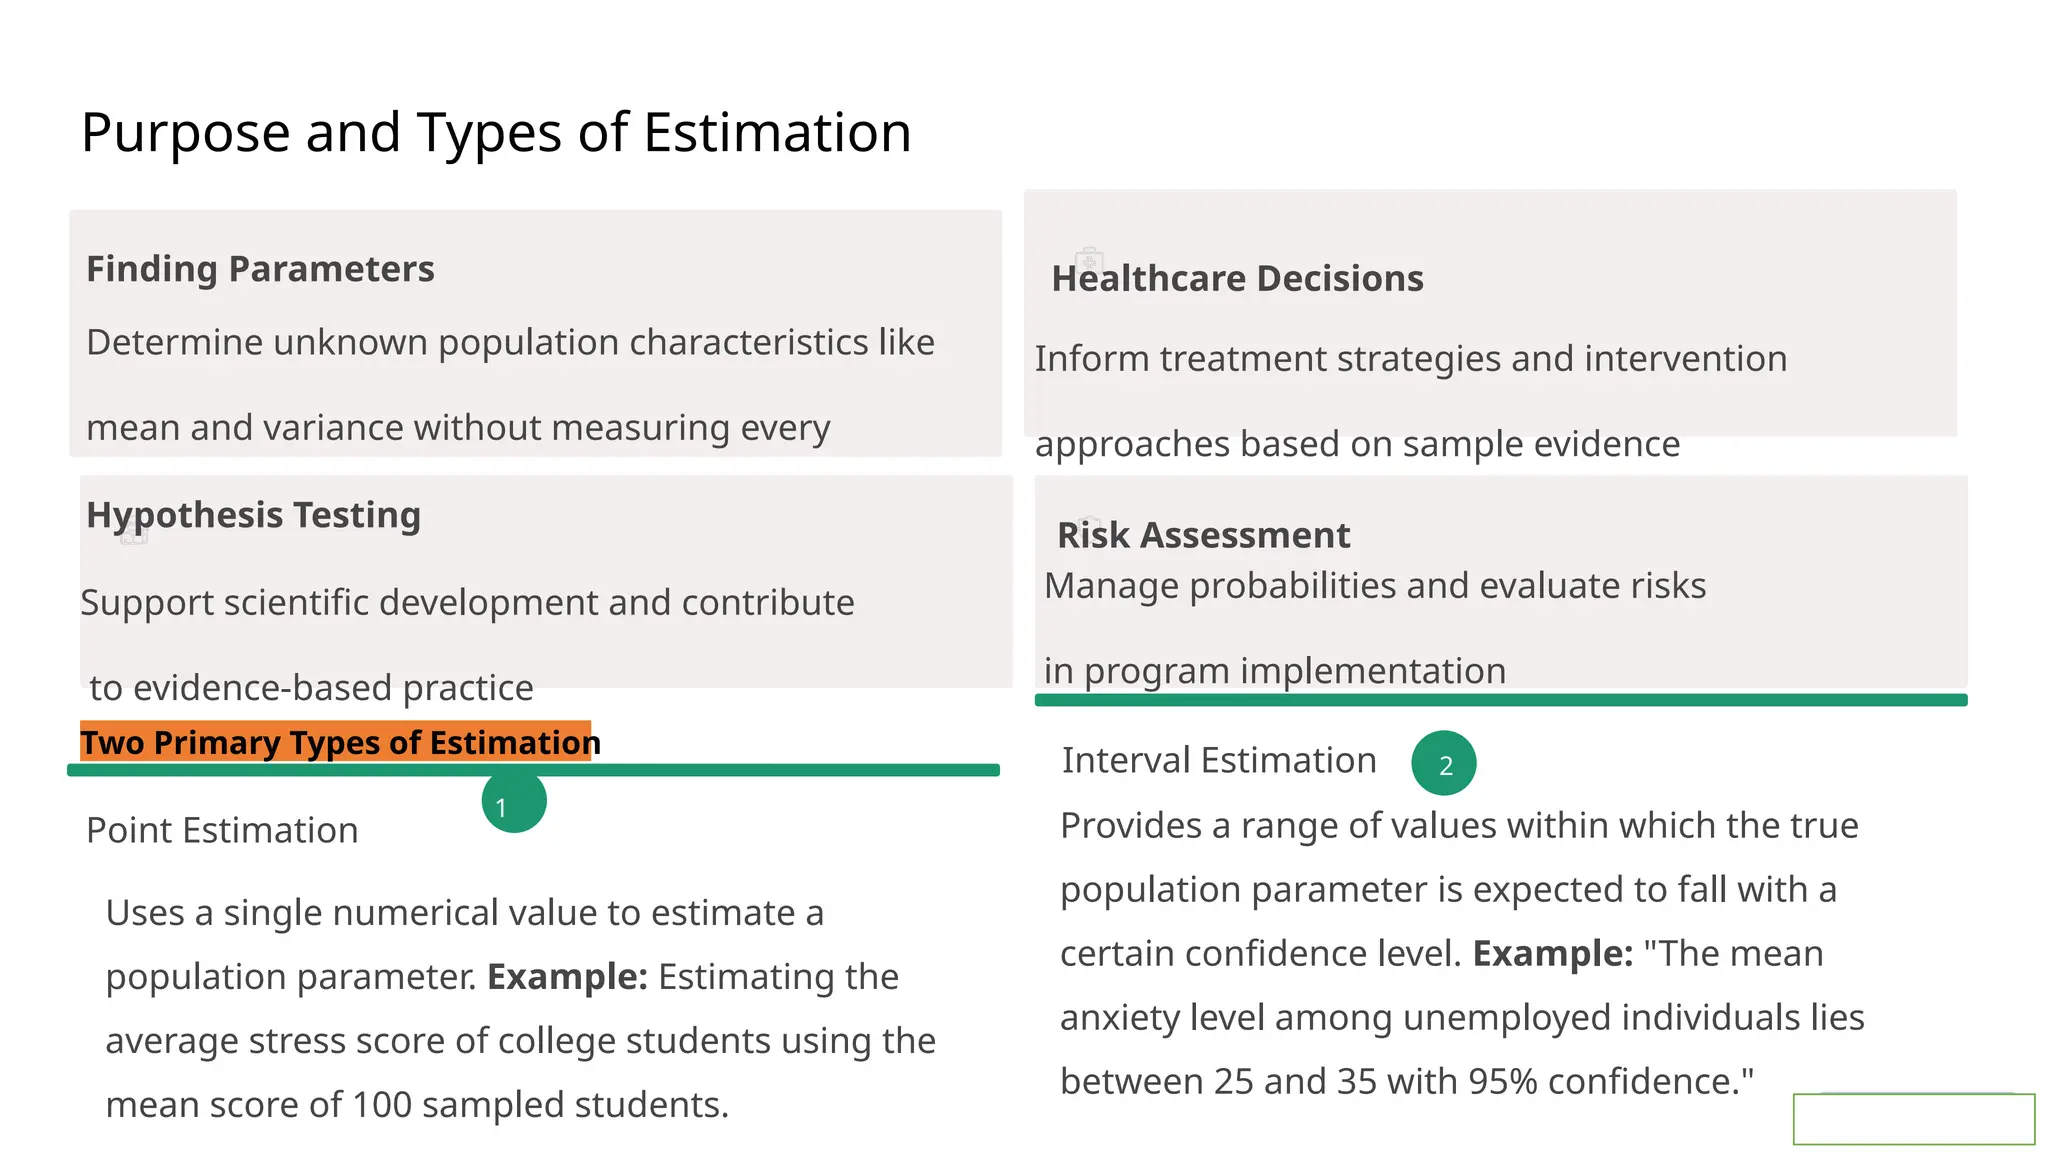
Purpose and Typesof Estimation
Finding Parameters
Determine unknown population characteristics like
mean and variance without measuring every
individual
Healthcare Decisions
Inform treatment strategies and intervention
approaches based on sample evidence
Hypothesis Testing
Support scientific development and contribute
to evidence-based practice
Risk Assessment
Manage probabilities and evaluate risks
in program implementation
Two Primary Types of Estimation
1
Point Estimation
Uses a single numerical value to estimate a
population parameter. Example: Estimating the
average stress score of college students using the
mean score of 100 sampled students.
2
Interval Estimation
Provides a range of values within which the true
population parameter is expected to fall with a
certain confidence level. Example: "The mean
anxiety level among unemployed individuals lies
between 25 and 35 with 95% confidence."
13.
Criteria for GoodEstimators
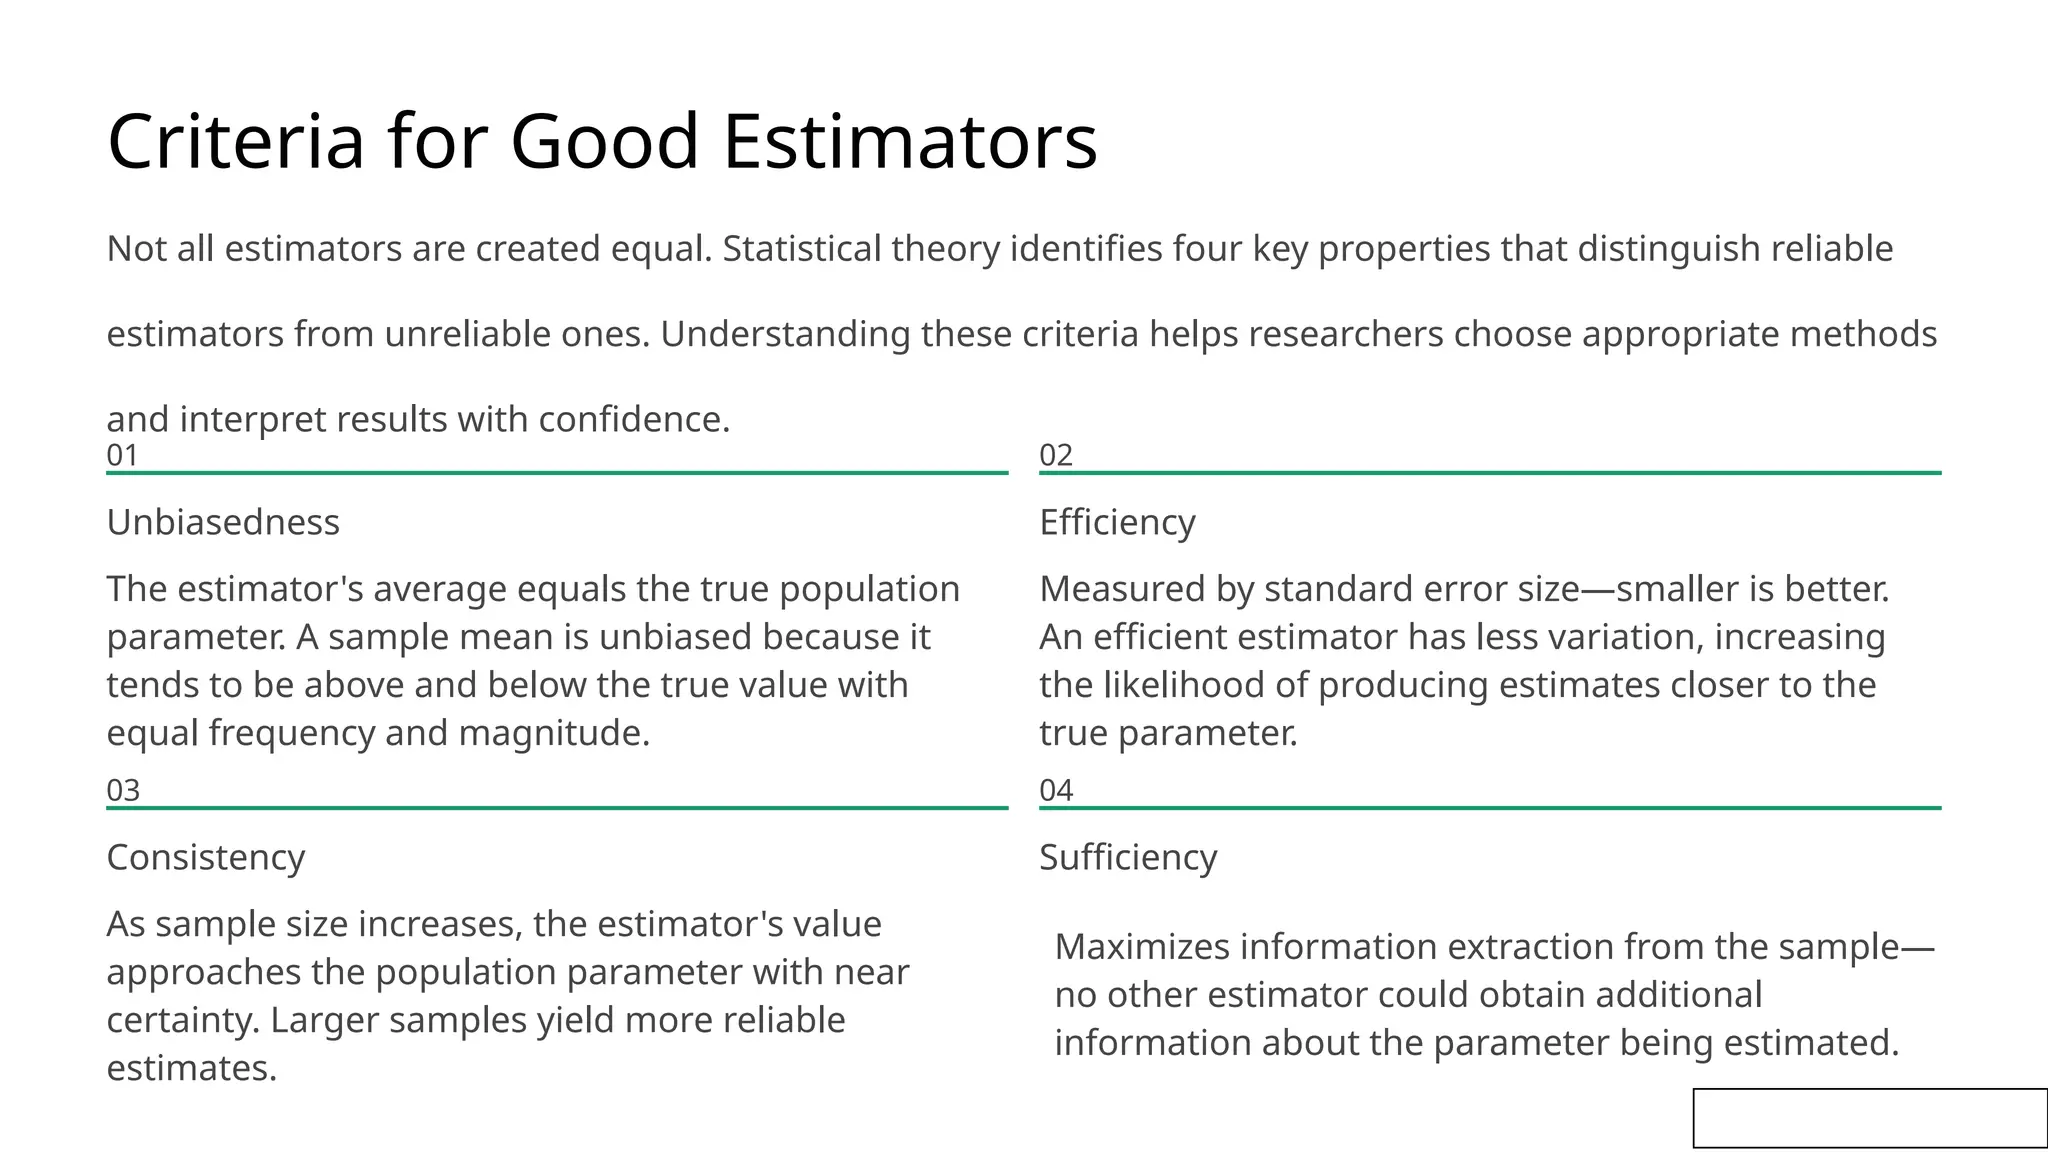
Not all estimators are created equal. Statistical theory identifies four key properties that distinguish reliable
estimators from unreliable ones. Understanding these criteria helps researchers choose appropriate methods
and interpret results with confidence.
01
Unbiasedness
The estimator's average equals the true population
parameter. A sample mean is unbiased because it
tends to be above and below the true value with
equal frequency and magnitude.
02
Efficiency
Measured by standard error size—smaller is better.
An efficient estimator has less variation, increasing
the likelihood of producing estimates closer to the
true parameter.
03
Consistency
As sample size increases, the estimator's value
approaches the population parameter with near
certainty. Larger samples yield more reliable
estimates.
04
Sufficiency
Maximizes information extraction from the sample—
no other estimator could obtain additional
information about the parameter being estimated.
14.
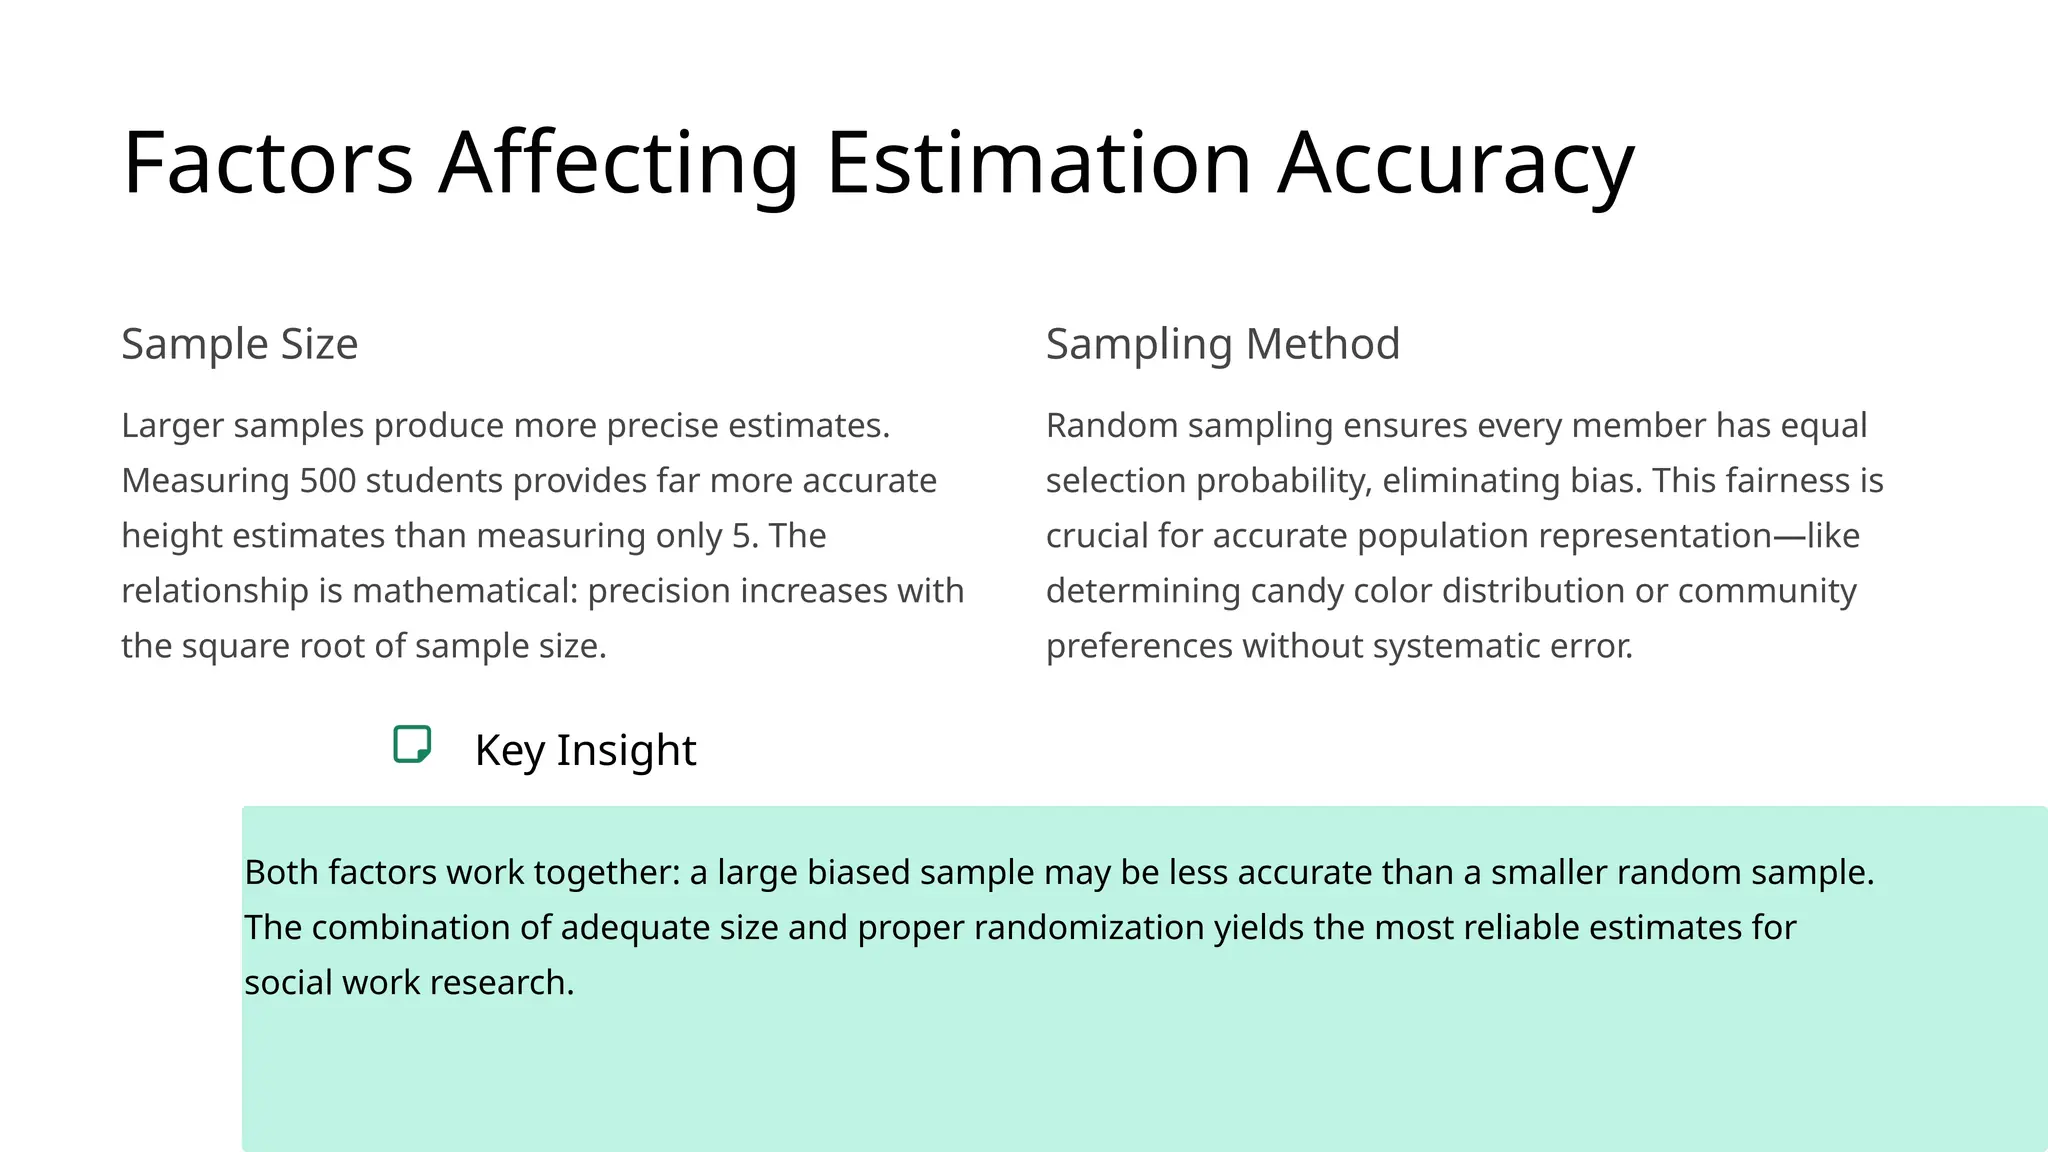
Factors Affecting EstimationAccuracy
Sample Size
Larger samples produce more precise estimates.
Measuring 500 students provides far more accurate
height estimates than measuring only 5. The
relationship is mathematical: precision increases with
the square root of sample size.
Sampling Method
Random sampling ensures every member has equal
selection probability, eliminating bias. This fairness is
crucial for accurate population representation—like
determining candy color distribution or community
preferences without systematic error.
Key Insight
Both factors work together: a large biased sample may be less accurate than a smaller random sample.
The combination of adequate size and proper randomization yields the most reliable estimates for
social work research.
15.
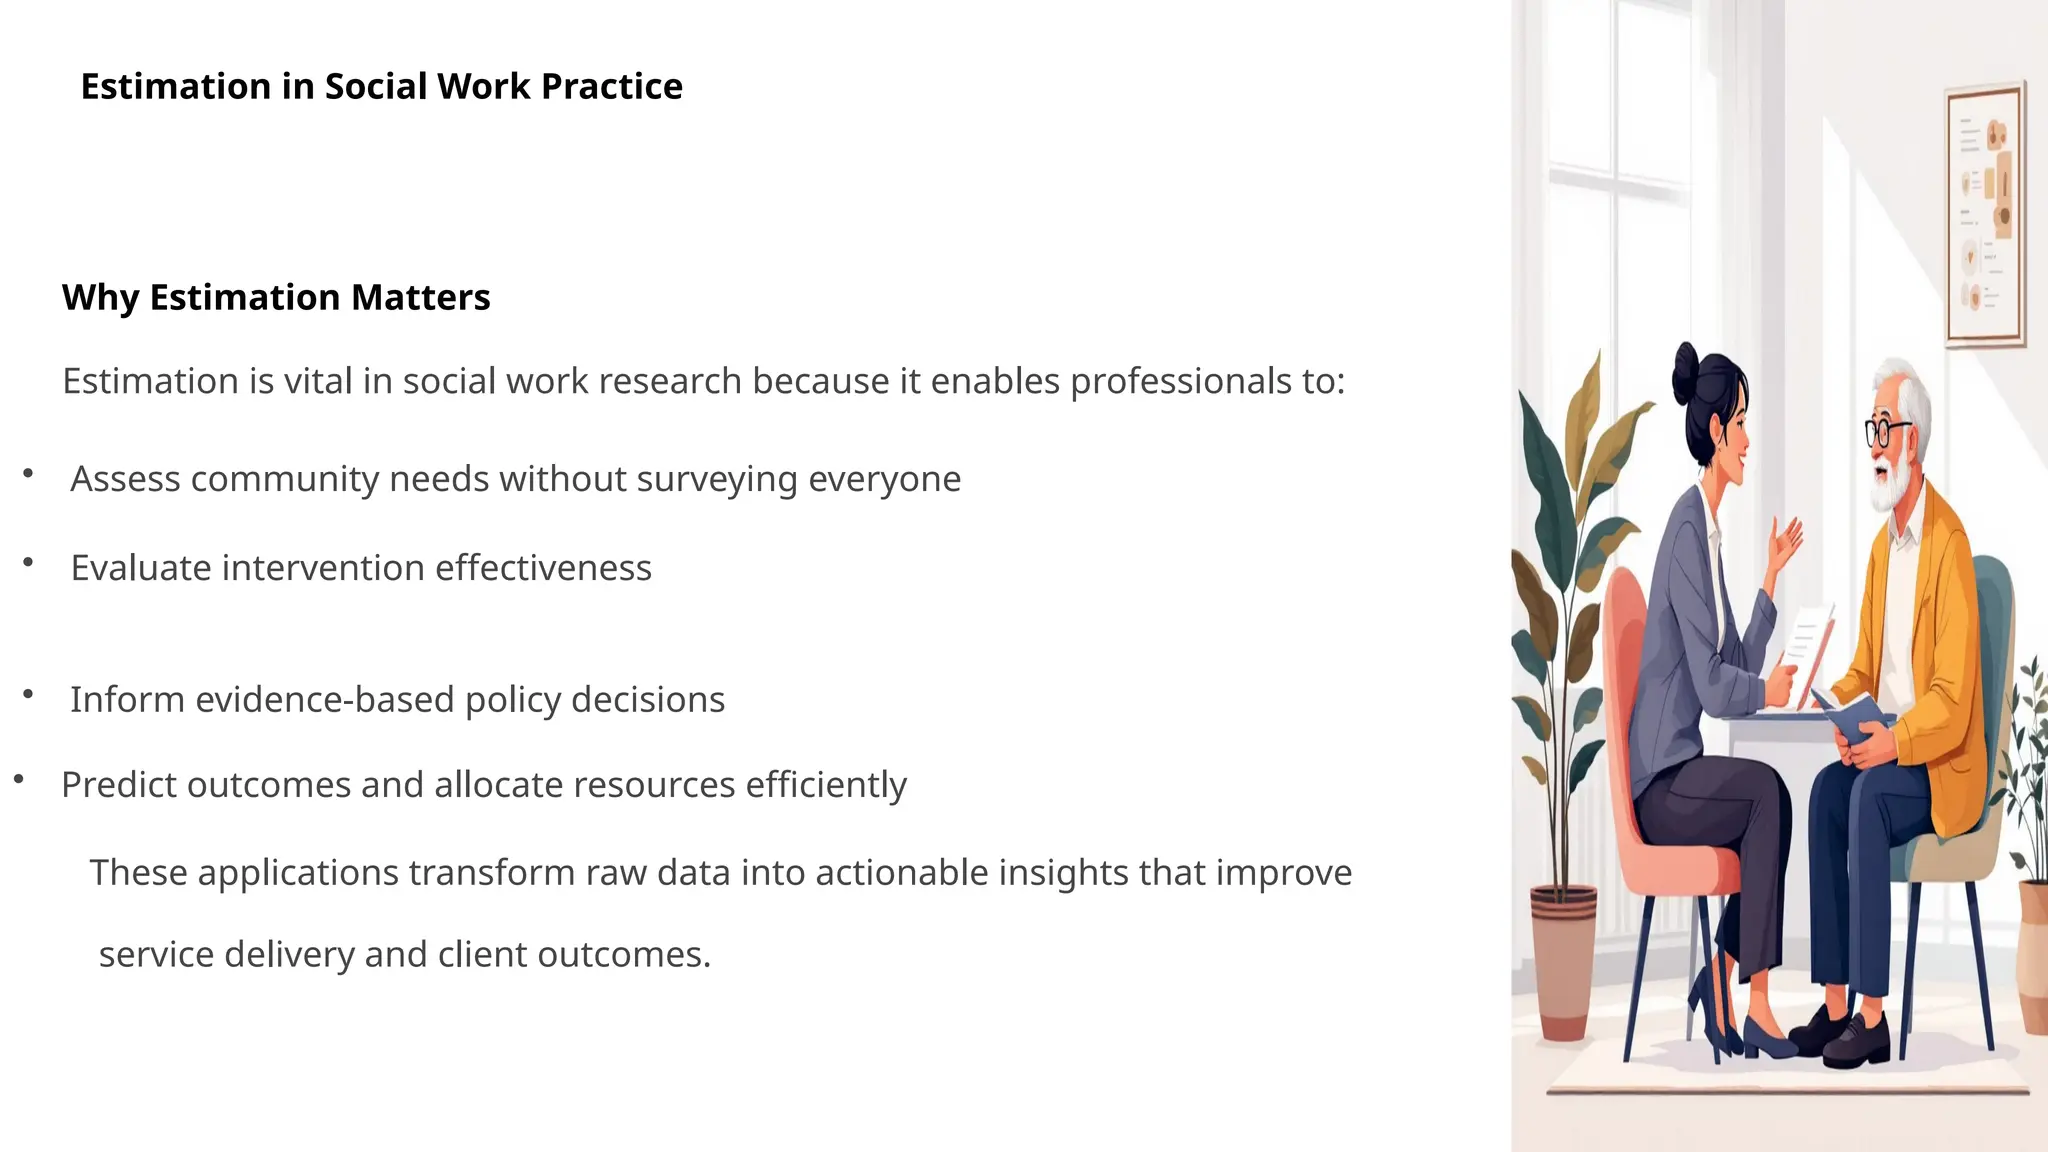
Estimation in SocialWork Practice
Why Estimation Matters
Estimation is vital in social work research because it enables professionals to:
• Assess community needs without surveying everyone
• Evaluate intervention effectiveness
• Inform evidence-based policy decisions
• Predict outcomes and allocate resources efficiently
These applications transform raw data into actionable insights that improve
service delivery and client outcomes.
16.
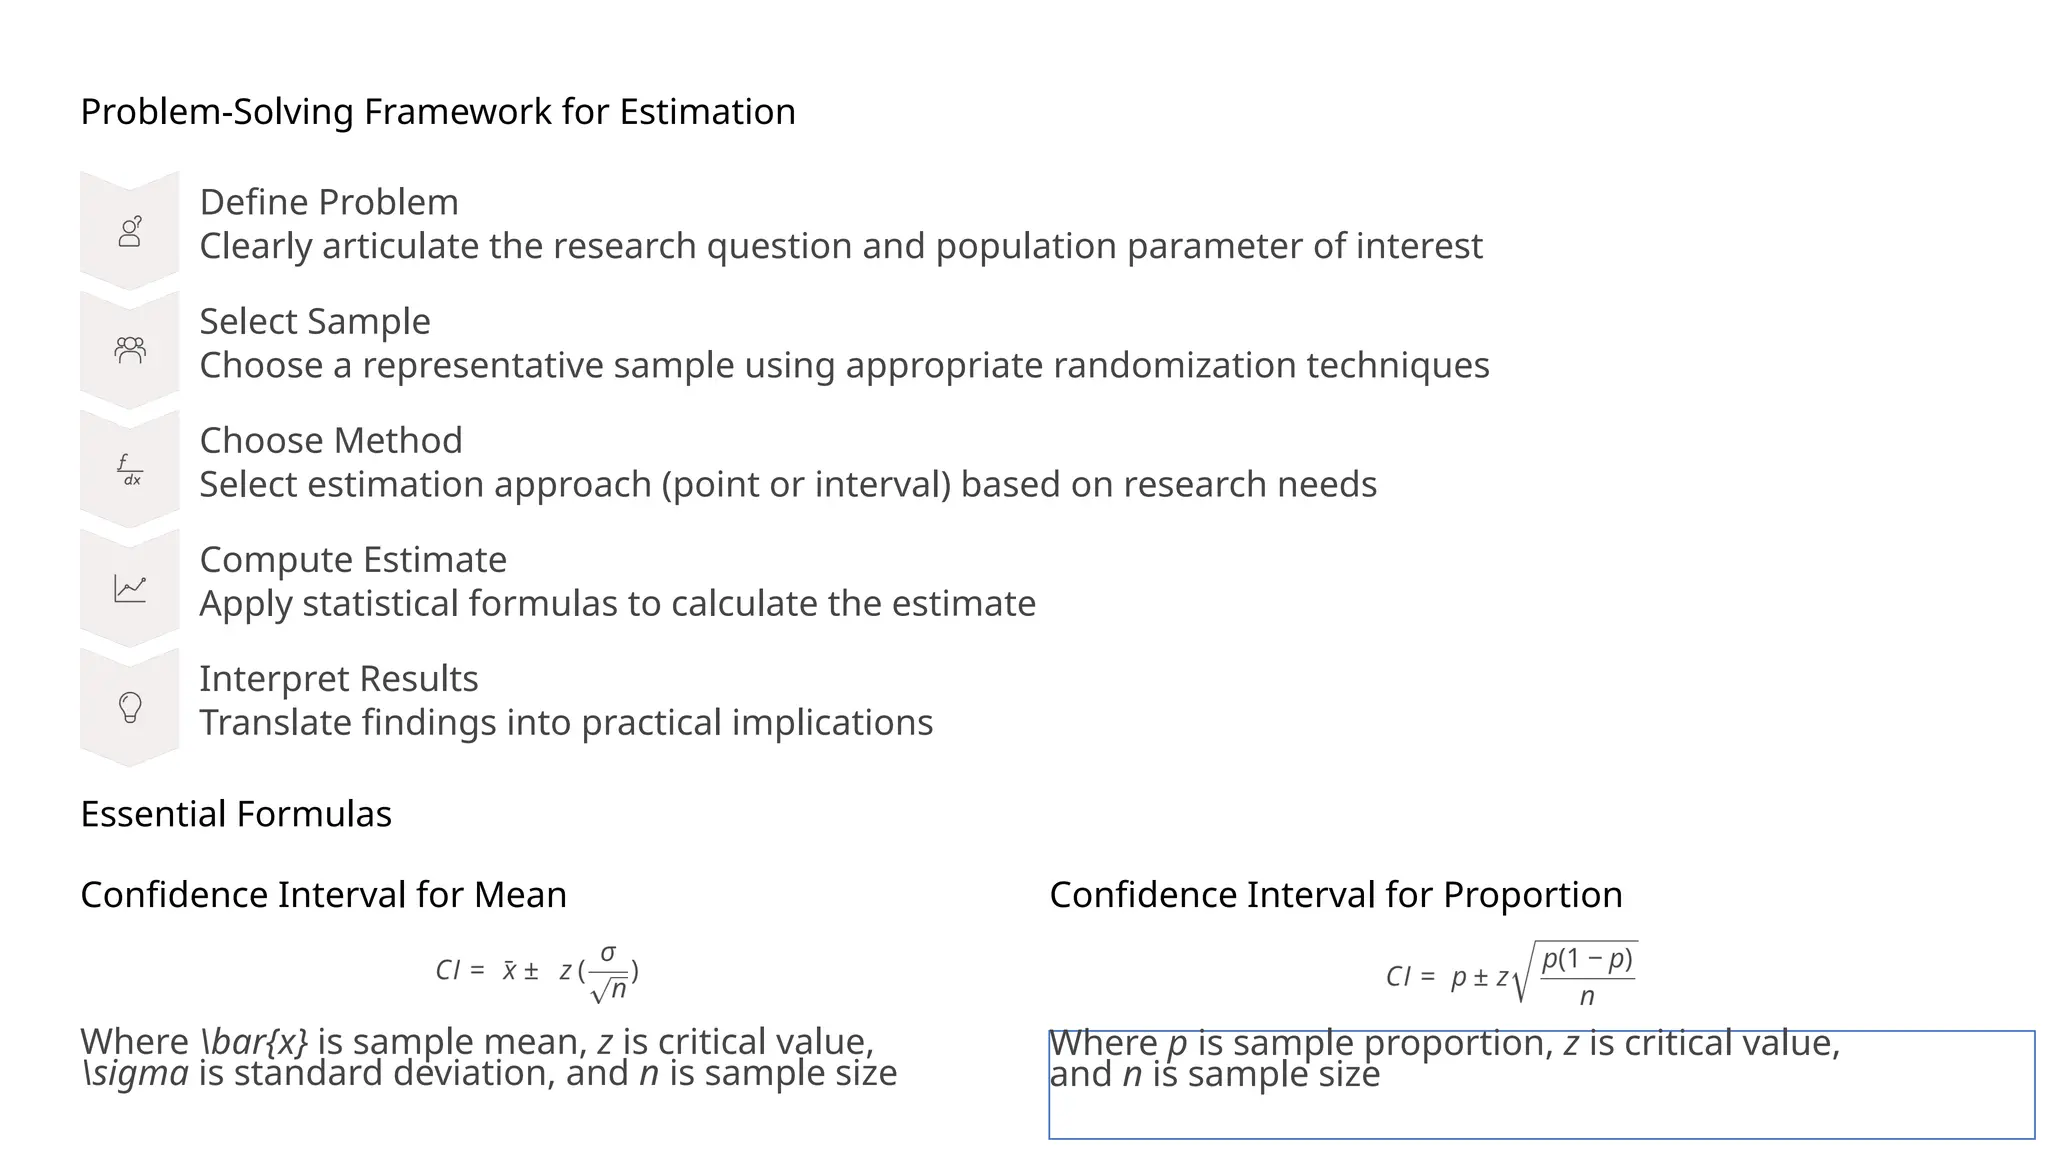
Problem-Solving Framework forEstimation
Define Problem
Clearly articulate the research question and population parameter of interest
Select Sample
Choose a representative sample using appropriate randomization techniques
Choose Method
Select estimation approach (point or interval) based on research needs
Compute Estimate
Apply statistical formulas to calculate the estimate
Interpret Results
Translate findings into practical implications
Essential Formulas
Confidence Interval for Mean
Where bar{x} is sample mean, z is critical value,
sigma is standard deviation, and n is sample size
Confidence Interval for Proportion
Where p is sample proportion, z is critical value,
and n is sample size
17.
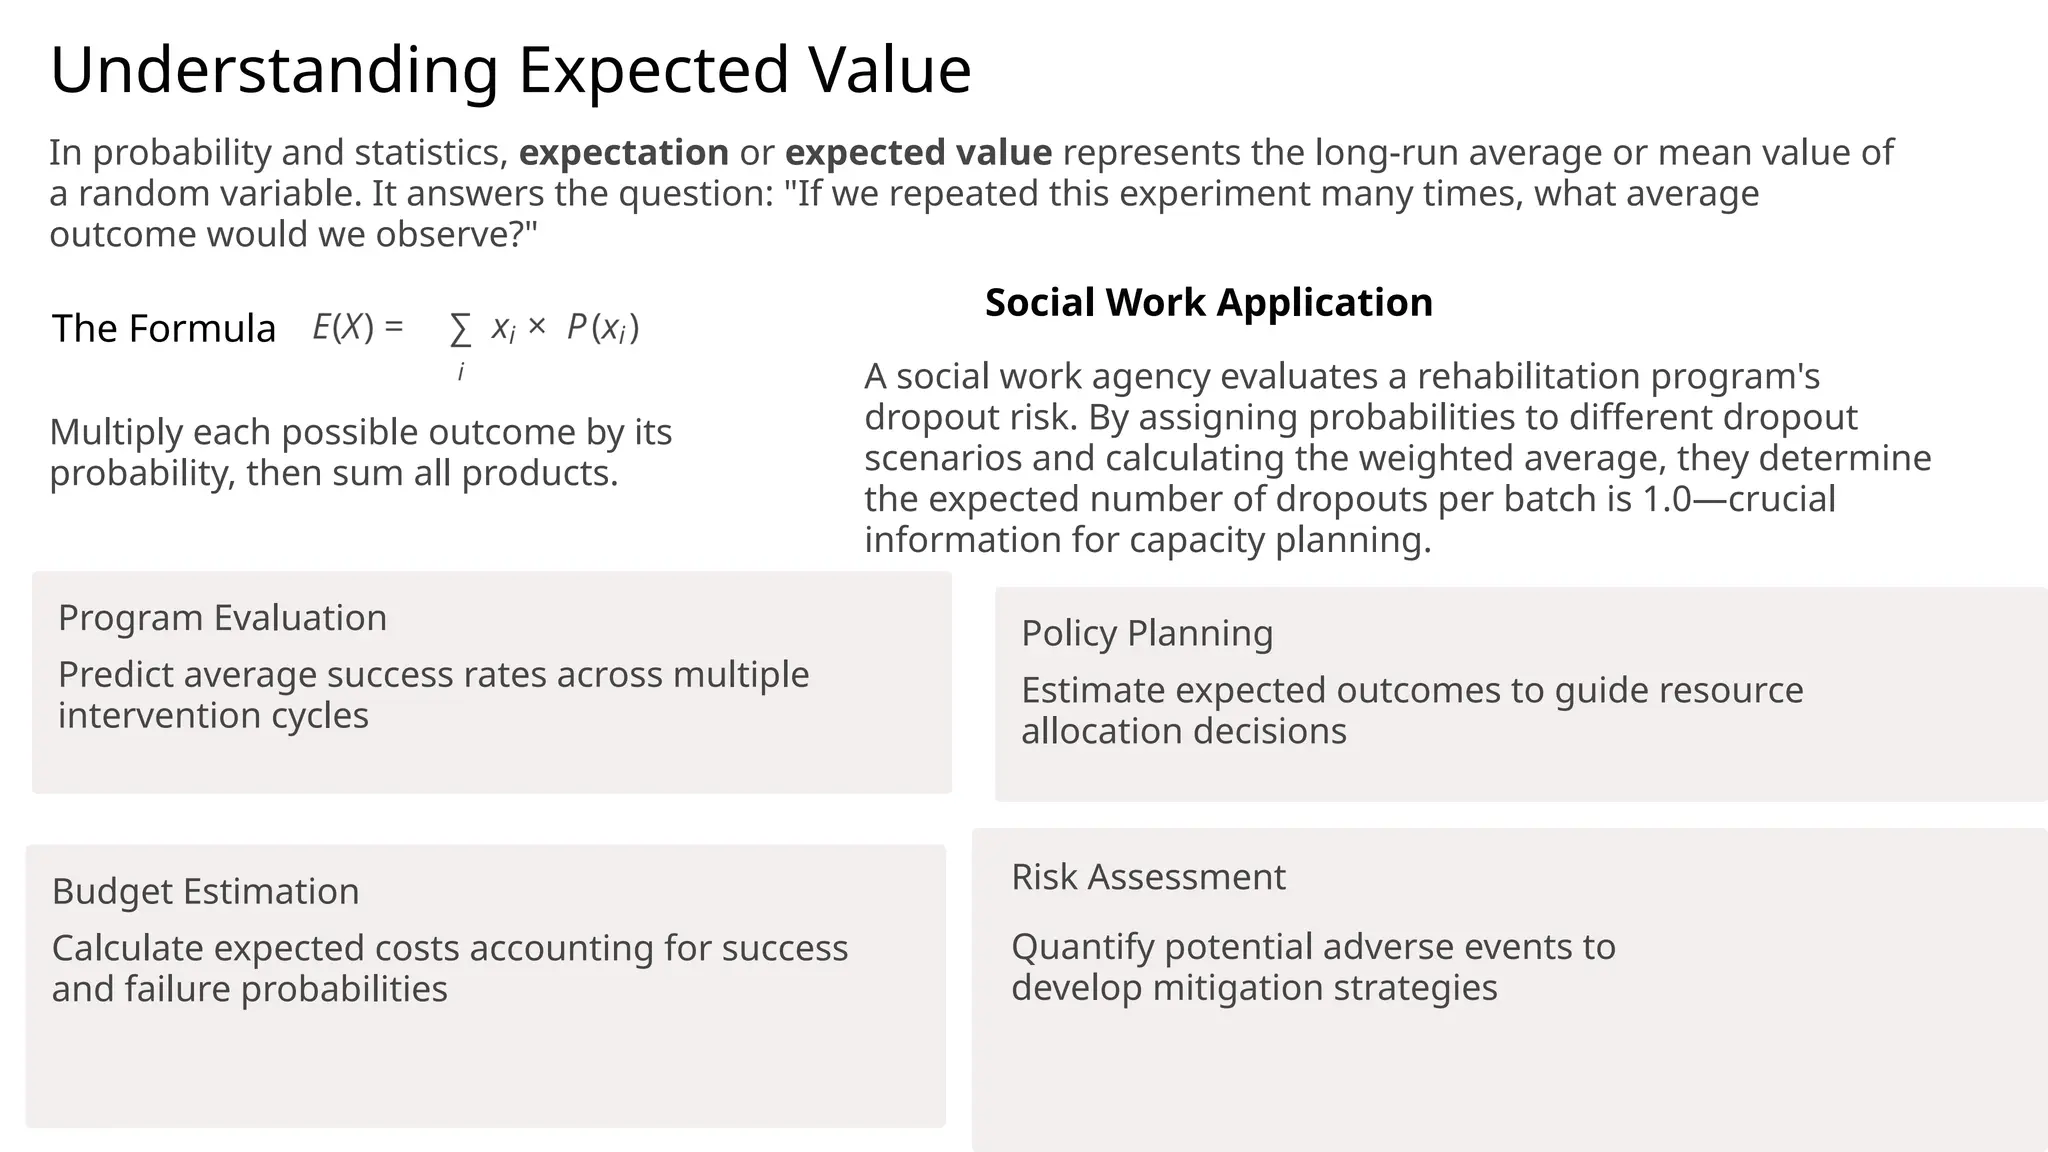
Understanding Expected Value
Inprobability and statistics, expectation or expected value represents the long-run average or mean value of
a random variable. It answers the question: "If we repeated this experiment many times, what average
outcome would we observe?"
The Formula
Multiply each possible outcome by its
probability, then sum all products.
Social Work Application
A social work agency evaluates a rehabilitation program's
dropout risk. By assigning probabilities to different dropout
scenarios and calculating the weighted average, they determine
the expected number of dropouts per batch is 1.0—crucial
information for capacity planning.
Program Evaluation
Predict average success rates across multiple
intervention cycles
Policy Planning
Estimate expected outcomes to guide resource
allocation decisions
Budget Estimation
Calculate expected costs accounting for success
and failure probabilities
Risk Assessment
Quantify potential adverse events to
develop mitigation strategies
18.
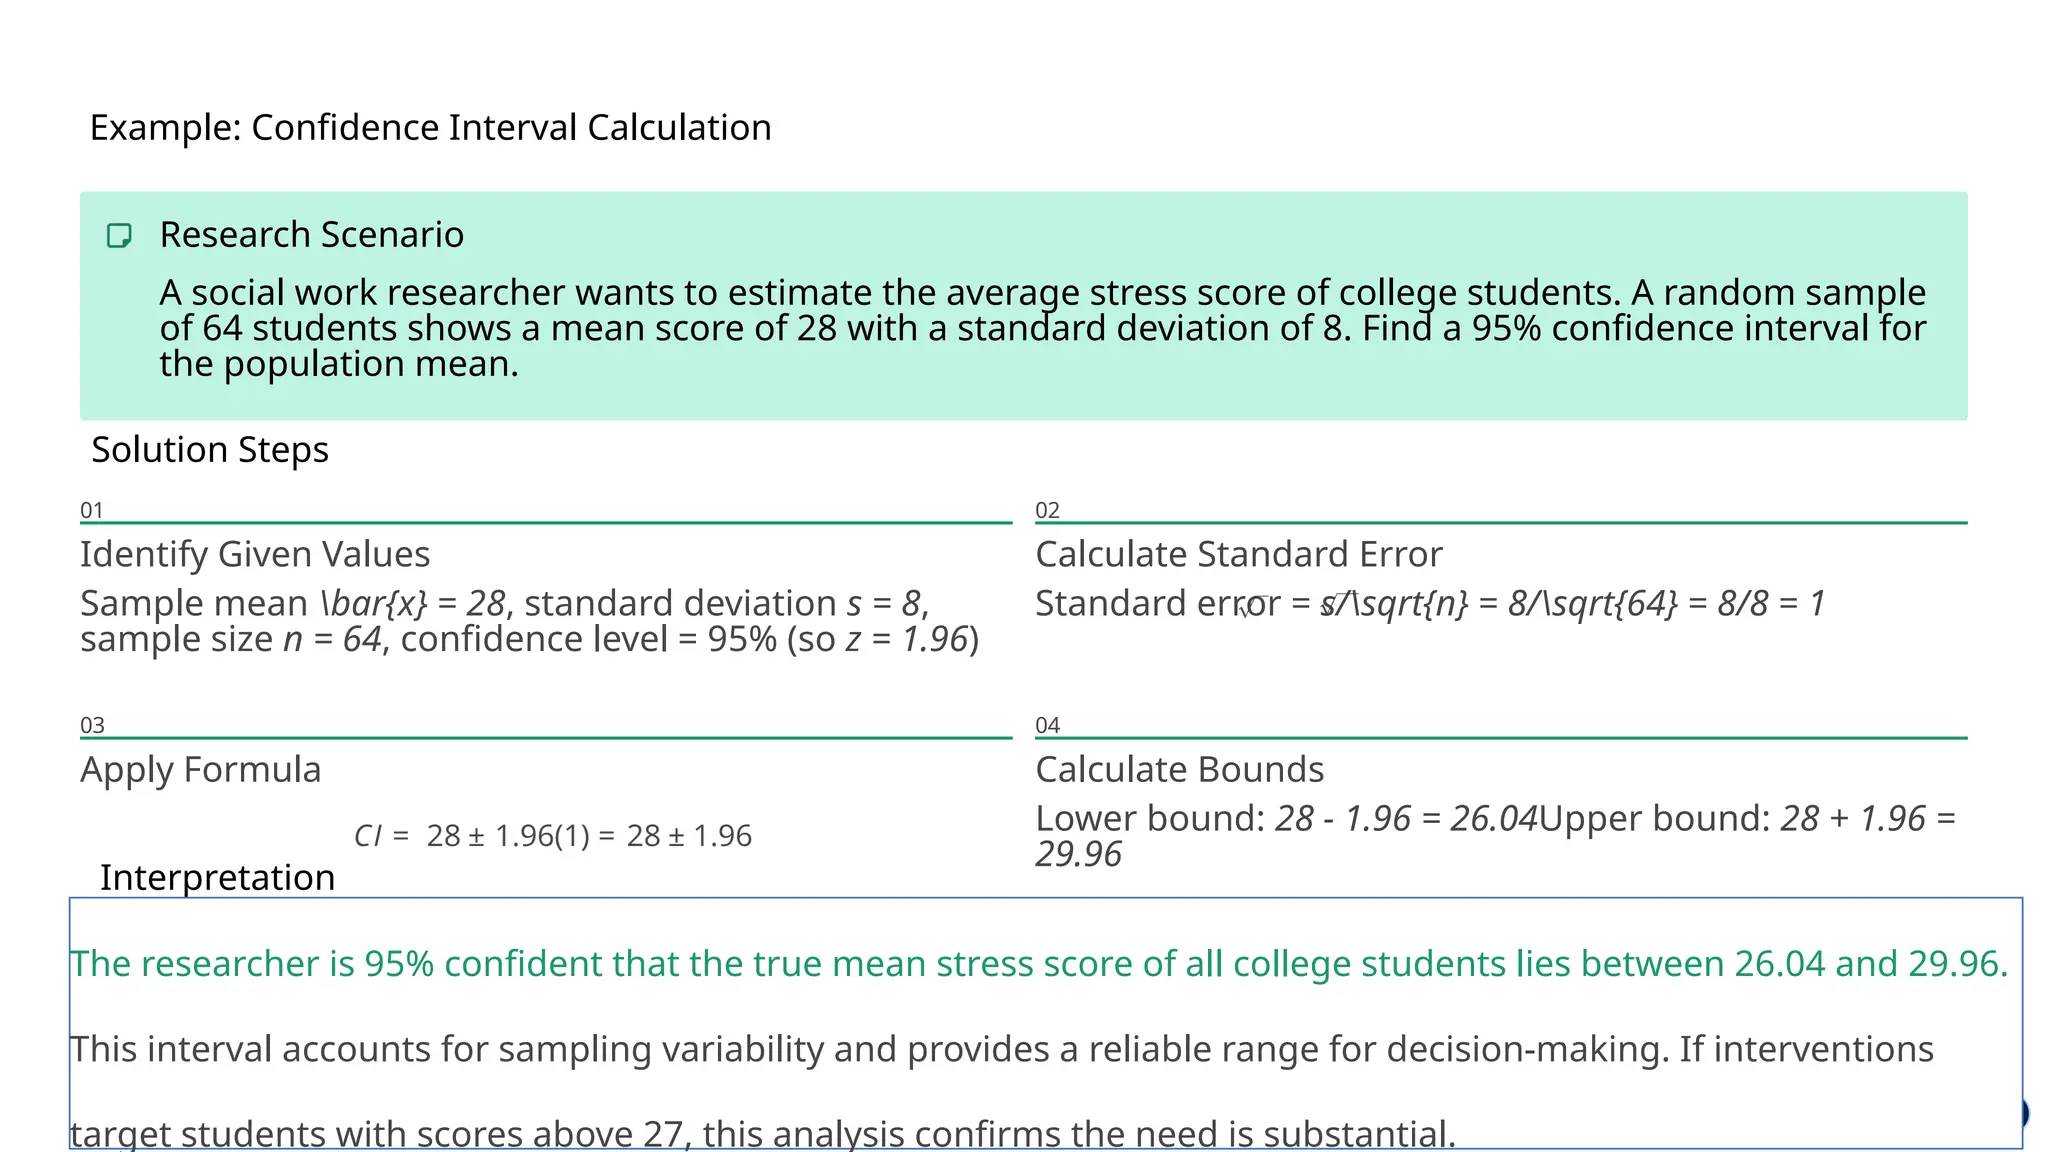
Example: Confidence IntervalCalculation
Research Scenario
A social work researcher wants to estimate the average stress score of college students. A random sample
of 64 students shows a mean score of 28 with a standard deviation of 8. Find a 95% confidence interval for
the population mean.
Solution Steps
01
Identify Given Values
Sample mean bar{x} = 28, standard deviation s = 8,
sample size n = 64, confidence level = 95% (so z = 1.96)
02
Calculate Standard Error
Standard error = s/sqrt{n} = 8/sqrt{64} = 8/8 = 1
03
Apply Formula
04
Calculate Bounds
Lower bound: 28 - 1.96 = 26.04Upper bound: 28 + 1.96 =
29.96
Interpretation
The researcher is 95% confident that the true mean stress score of all college students lies between 26.04 and 29.96.
This interval accounts for sampling variability and provides a reliable range for decision-making. If interventions
target students with scores above 27, this analysis confirms the need is substantial.
19.
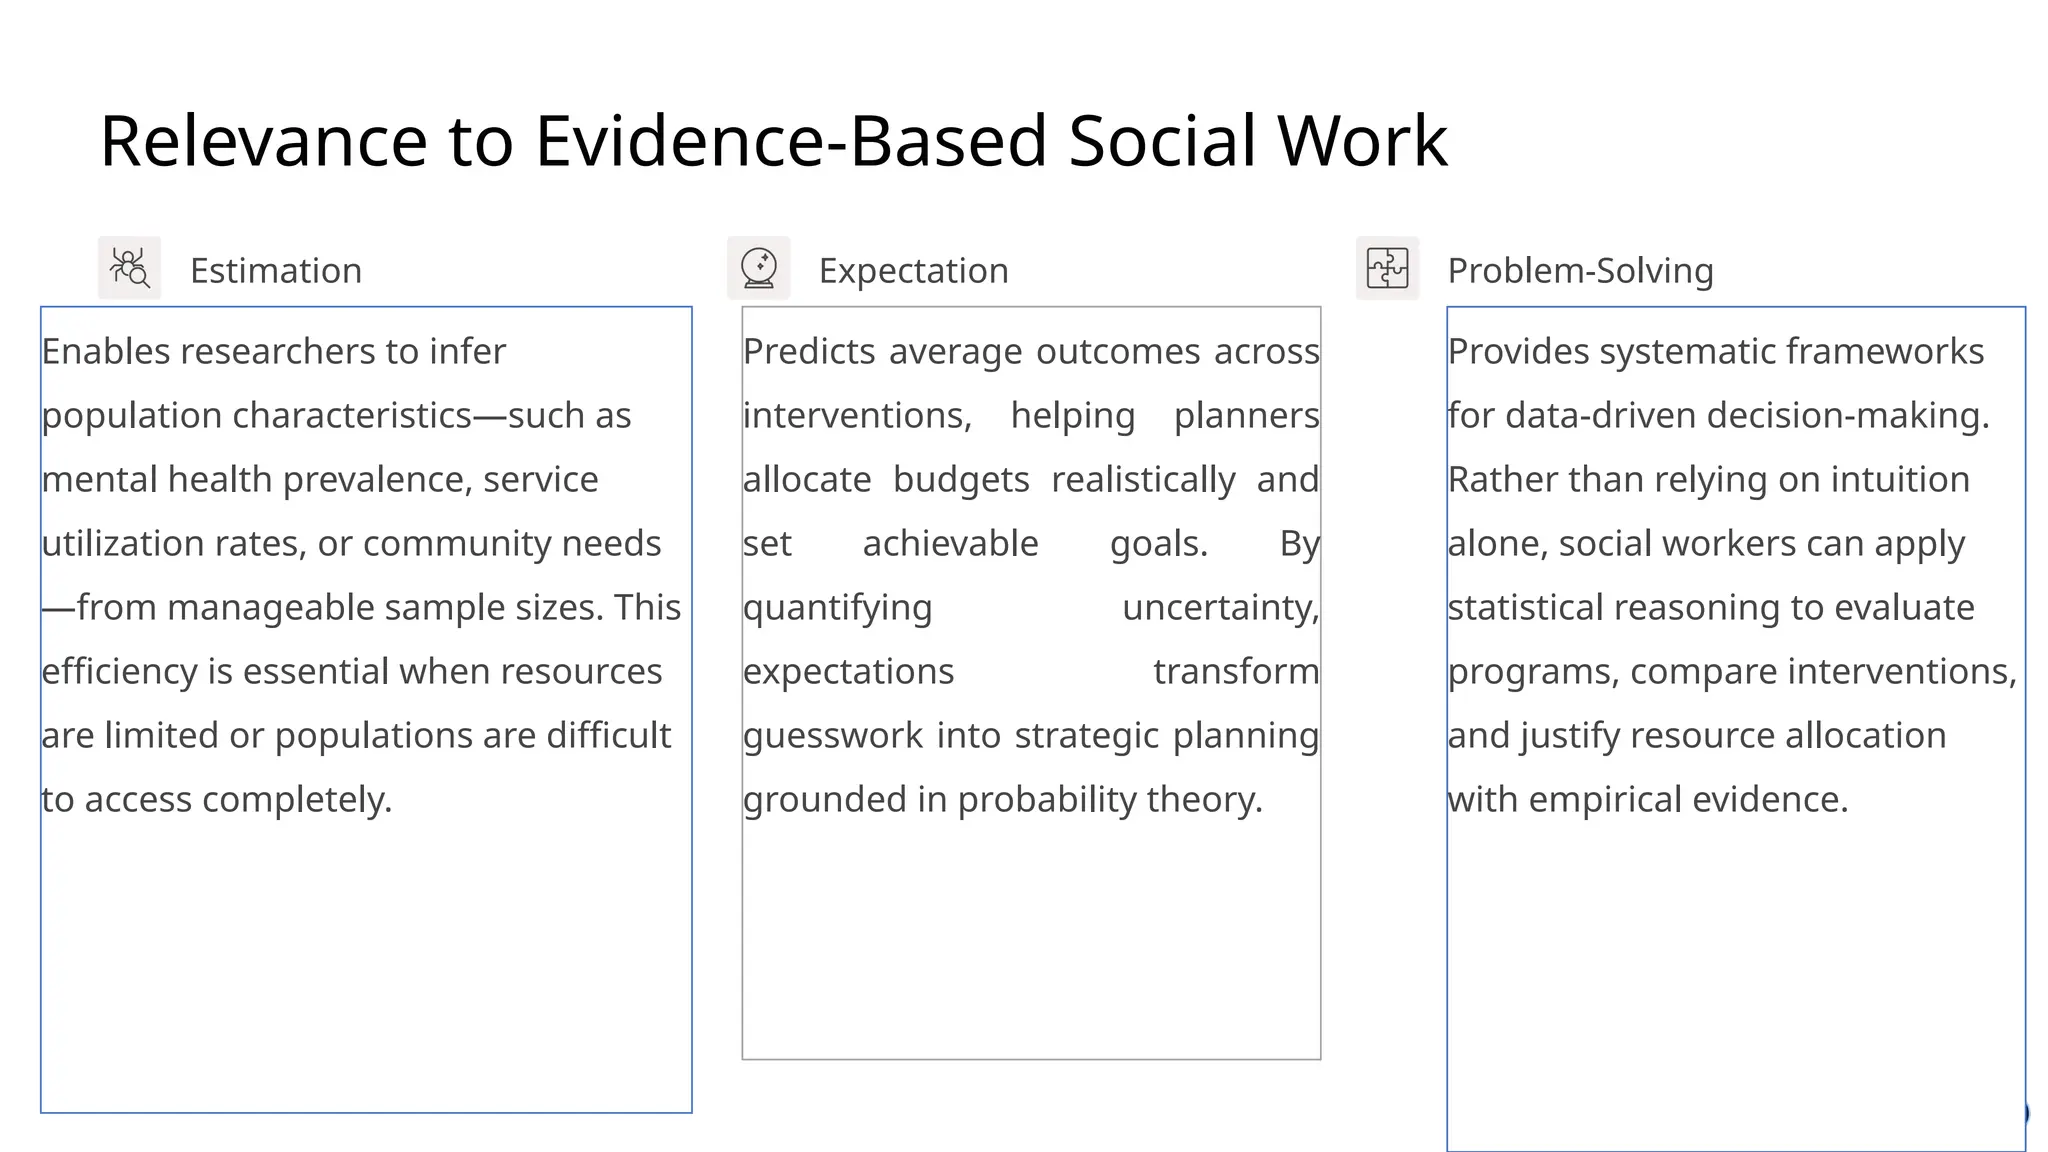
Relevance to Evidence-BasedSocial Work
Estimation
Enables researchers to infer
population characteristics—such as
mental health prevalence, service
utilization rates, or community needs
—from manageable sample sizes. This
efficiency is essential when resources
are limited or populations are difficult
to access completely.
Expectation
Predicts average outcomes across
interventions, helping planners
allocate budgets realistically and
set achievable goals. By
quantifying uncertainty,
expectations transform
guesswork into strategic planning
grounded in probability theory.
Problem-Solving
Provides systematic frameworks
for data-driven decision-making.
Rather than relying on intuition
alone, social workers can apply
statistical reasoning to evaluate
programs, compare interventions,
and justify resource allocation
with empirical evidence.
20.
Relevance to Evidence-BasedSocial Work
Conclusion
Estimation and expectations are integral to quantitative research in social work. They provide essential tools
for understanding populations, evaluating programs, and making informed policy decisions. Through effective
problem-solving and statistical reasoning, social work researchers contribute to evidence-based practices that
enhance community well-being and improve client outcomes.
By mastering these concepts, social work professionals transform data into actionable knowledge—ensuring
interventions are not just well-intentioned, but demonstrably effective.
21.
Writing and PublishingScientific Papers
Scientific writing is the cornerstone of knowledge dissemination in academia. The advancement of science
depends not only on rigorous experimentation but also on effectively communicating findings to the wider
research community. A well-crafted research paper ensures that results remain visible, verifiable, and valuable for
future investigations (Parija & Kate, 2017).
22.
Scientific writing playsa central role in academia by providing a systematic
medium through which researchers disseminate their findings. It contributes to
scholarly communication, fosters collaboration, and enhances academic visibility
(Day & Gastel, 2012).
For early-career researchers, mastering the art of writing and publishing is essential
for career progression, research funding, and institutional recognition
(Belcher,2019).
The publication of research articles ensures the expansion of existing knowledge
while encouraging accountability and transparency. Unlike informal
communication, scientific papers follow a standardized approach, typically
represented by the IMRAD format (Sollaci& Pereira, 2004).
In addition to mastering structure, authors must understand the ethical and
procedural dimensions of publishing.
23.
The Role ofScientific Writing in Academia
• Serves as the primary medium.
• contributes to scholarly communication, fosters international
collaboration, and significantly enhances academic visibility.
• Essential for career progression, securing research funding, and
gaining institutional recognition.
• Expands the boundaries of existing knowledge
24.
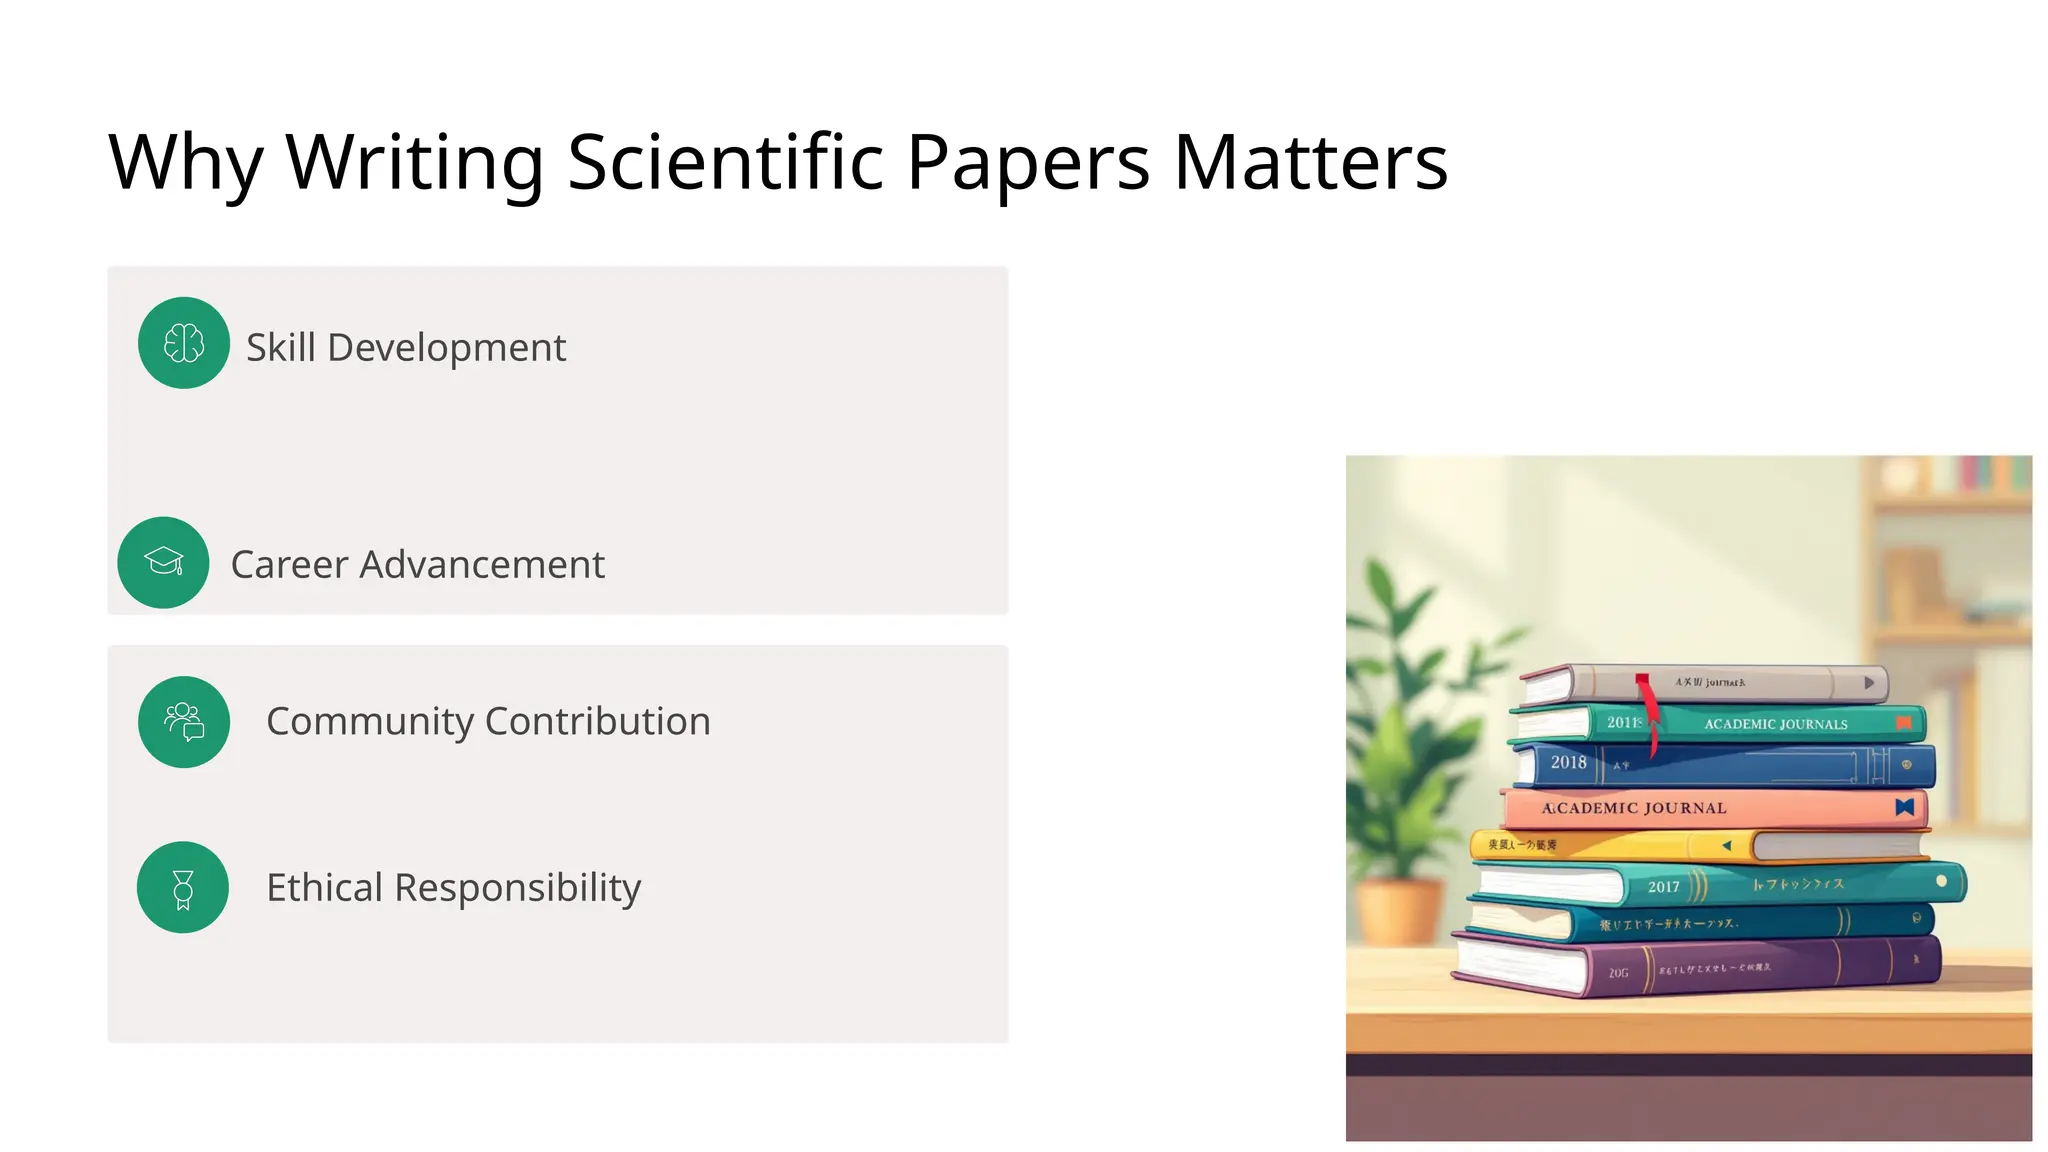
Why Writing ScientificPapers Matters
Skill Development
Career Advancement
Community Contribution
Ethical Responsibility
25.
The IMRAD Structure:Foundation of Scientific Papers
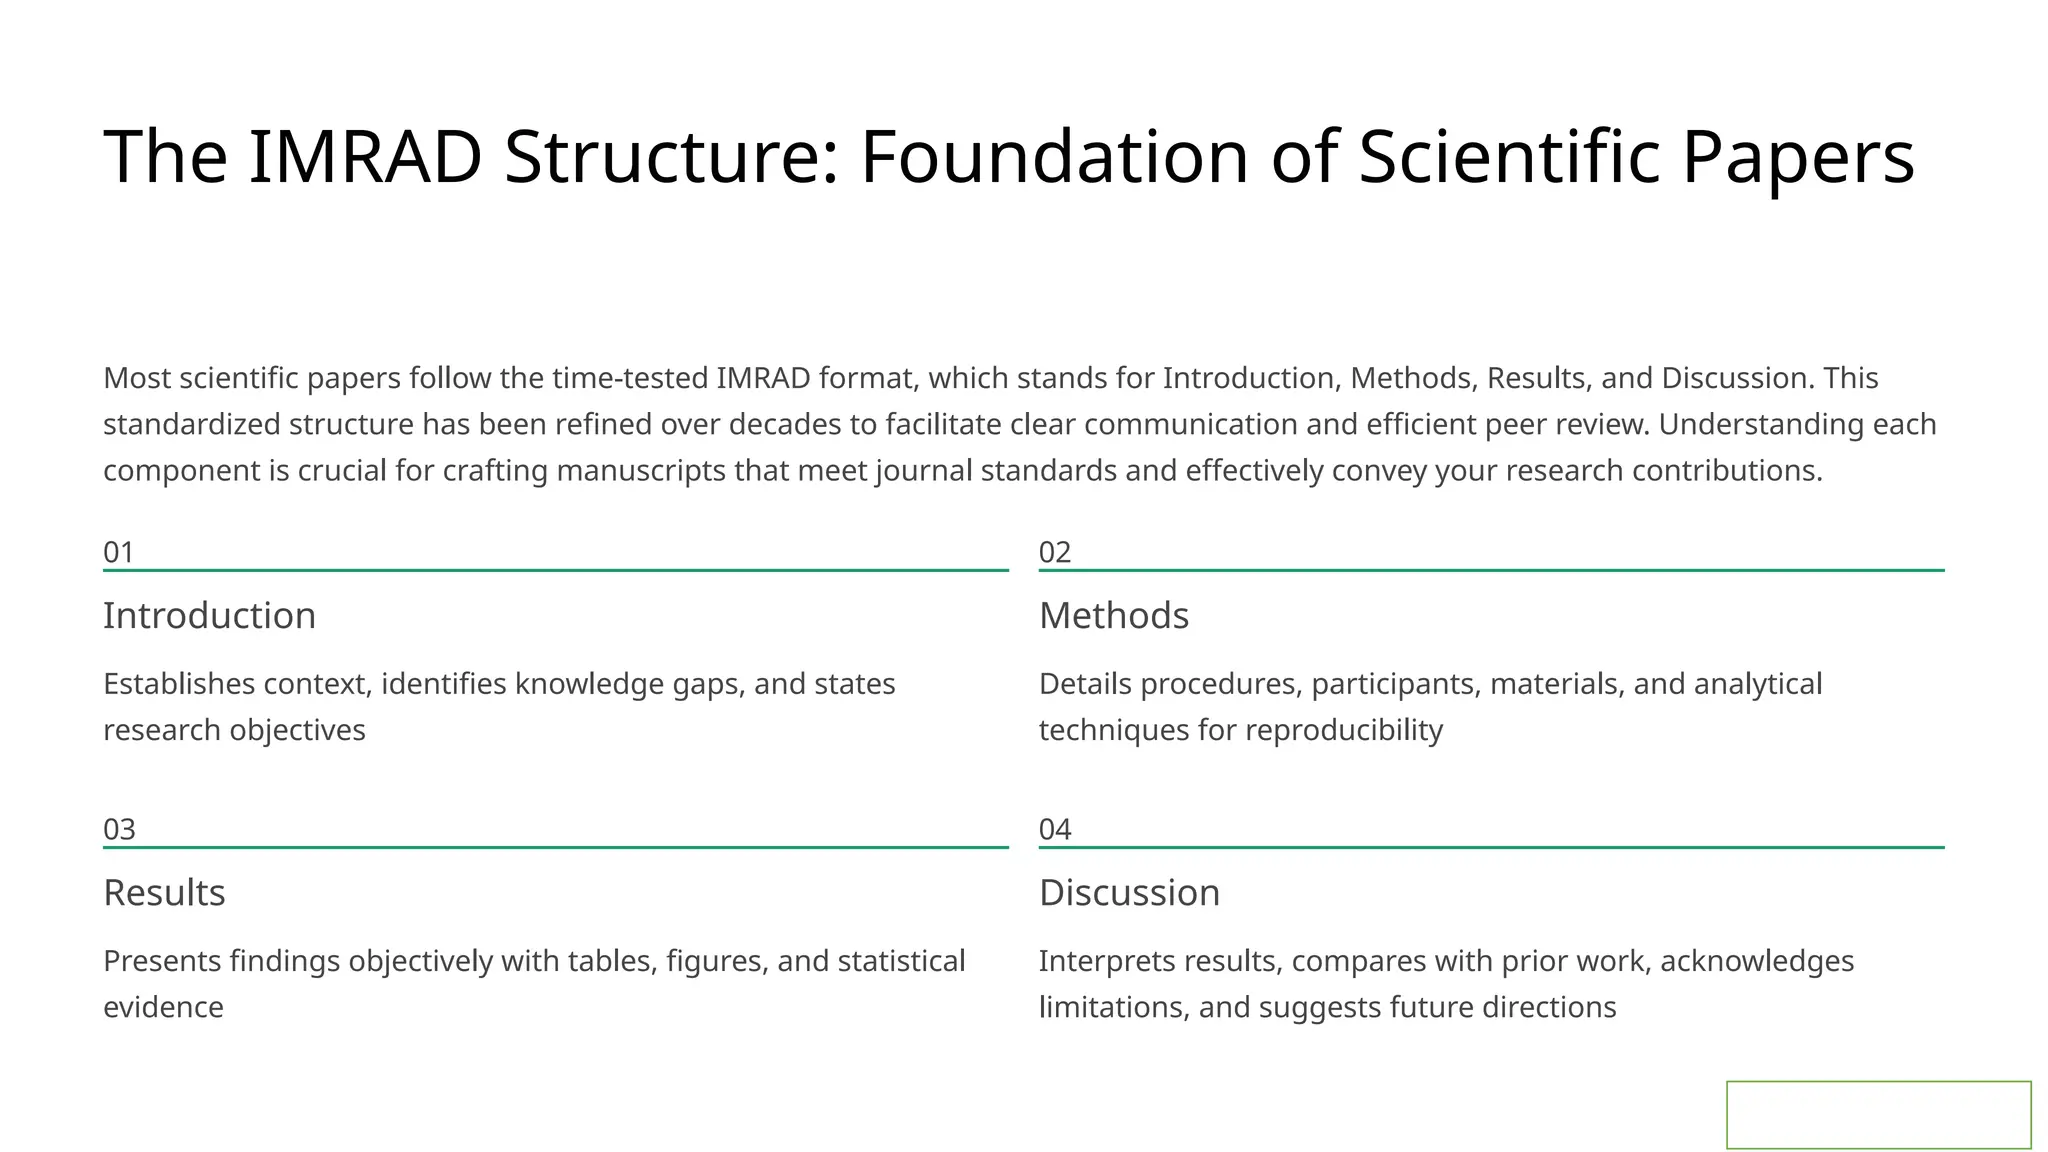
Most scientific papers follow the time-tested IMRAD format, which stands for Introduction, Methods, Results, and Discussion. This
standardized structure has been refined over decades to facilitate clear communication and efficient peer review. Understanding each
component is crucial for crafting manuscripts that meet journal standards and effectively convey your research contributions.
01
Introduction
Establishes context, identifies knowledge gaps, and states
research objectives
02
Methods
Details procedures, participants, materials, and analytical
techniques for reproducibility
03
Results
Presents findings objectively with tables, figures, and statistical
evidence
04
Discussion
Interprets results, compares with prior work, acknowledges
limitations, and suggests future directions
26.
Acknowledgments & References:Recognize contributions and cite literature appropriately, often
using Vancouver or APA styles .
The Vancouver reference style, also known as the author-number system, is a citation style commonly
used in biomedical and scientific fields that uses numbers in the text to refer to a numbered reference
list at the end of a document.
APA Style is a standardized writing and citation format developed by the American Psychological
Association (APA) to promote clarity and consistency in academic communication, primarily in the
behavioral and social sciences like psychology, sociology, and education
27.
Crafting Effective Titlesand Abstracts
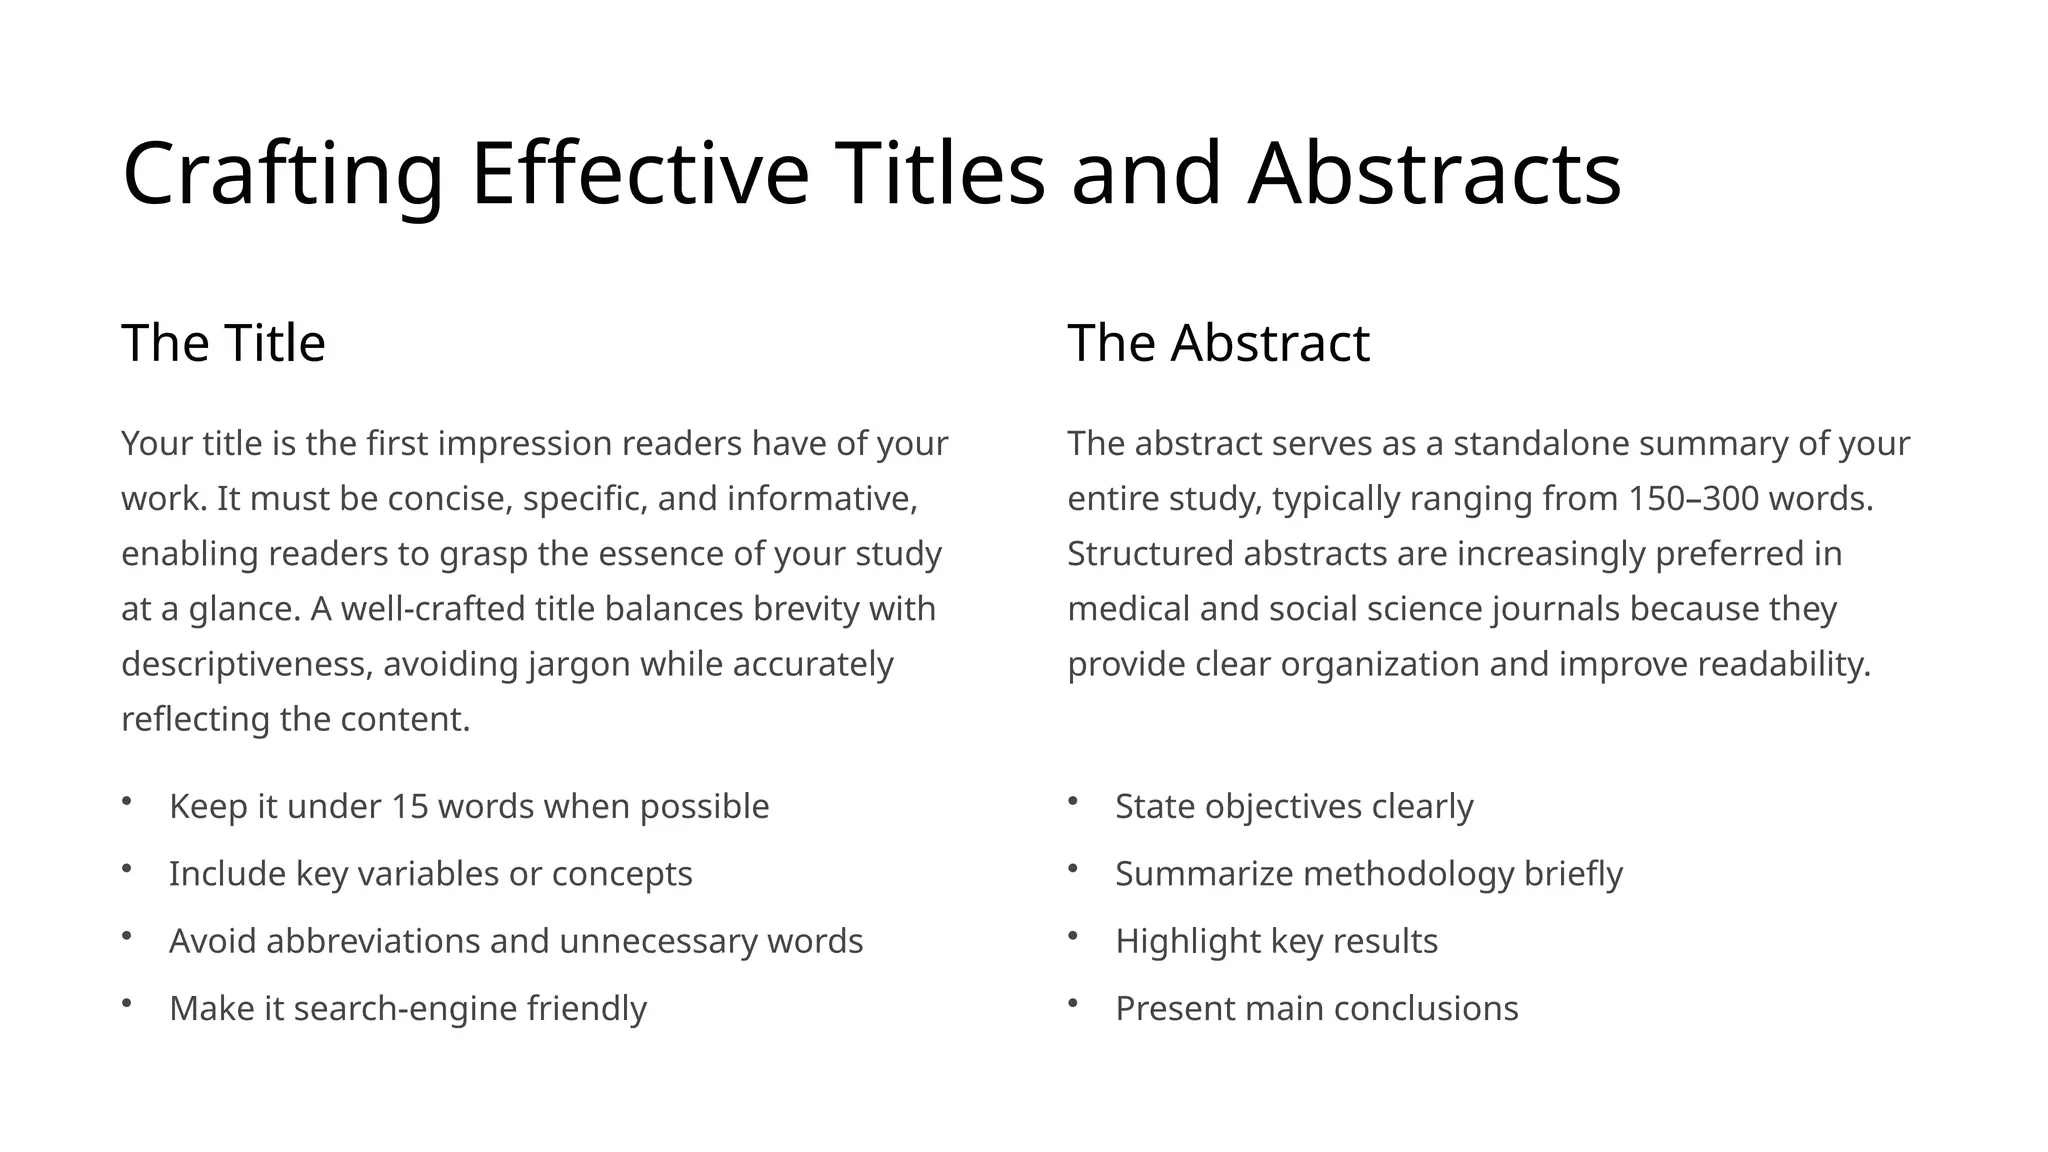
The Title
Your title is the first impression readers have of your
work. It must be concise, specific, and informative,
enabling readers to grasp the essence of your study
at a glance. A well-crafted title balances brevity with
descriptiveness, avoiding jargon while accurately
reflecting the content.
• Keep it under 15 words when possible
• Include key variables or concepts
• Avoid abbreviations and unnecessary words
• Make it search-engine friendly
The Abstract
The abstract serves as a standalone summary of your
entire study, typically ranging from 150–300 words.
Structured abstracts are increasingly preferred in
medical and social science journals because they
provide clear organization and improve readability.
• State objectives clearly
• Summarize methodology briefly
• Highlight key results
• Present main conclusions
28.
Methods and Results:The Core of
Your Research
Methods: Ensuring Reproducibility
The Methods section emphasizes reproducibility by providing comprehensive
details about participants, materials, procedures, and data analysis techniques.
Clear descriptions ensure other researchers can replicate your study, which is
fundamental to scientific validity. Include information about ethical approvals,
sample sizes, inclusion/exclusion criteria, and statistical tests employed.
Results: Objective Presentation
Findings should be reported objectively, supported by well-designed tables,
figures, and statistical evidence. Authors are advised to avoid interpretation at
this stage, limiting the section to factual presentation of data. Use visual
elements strategically to enhance comprehension—tables for precise values,
graphs for trends, and images for qualitative findings.
29.
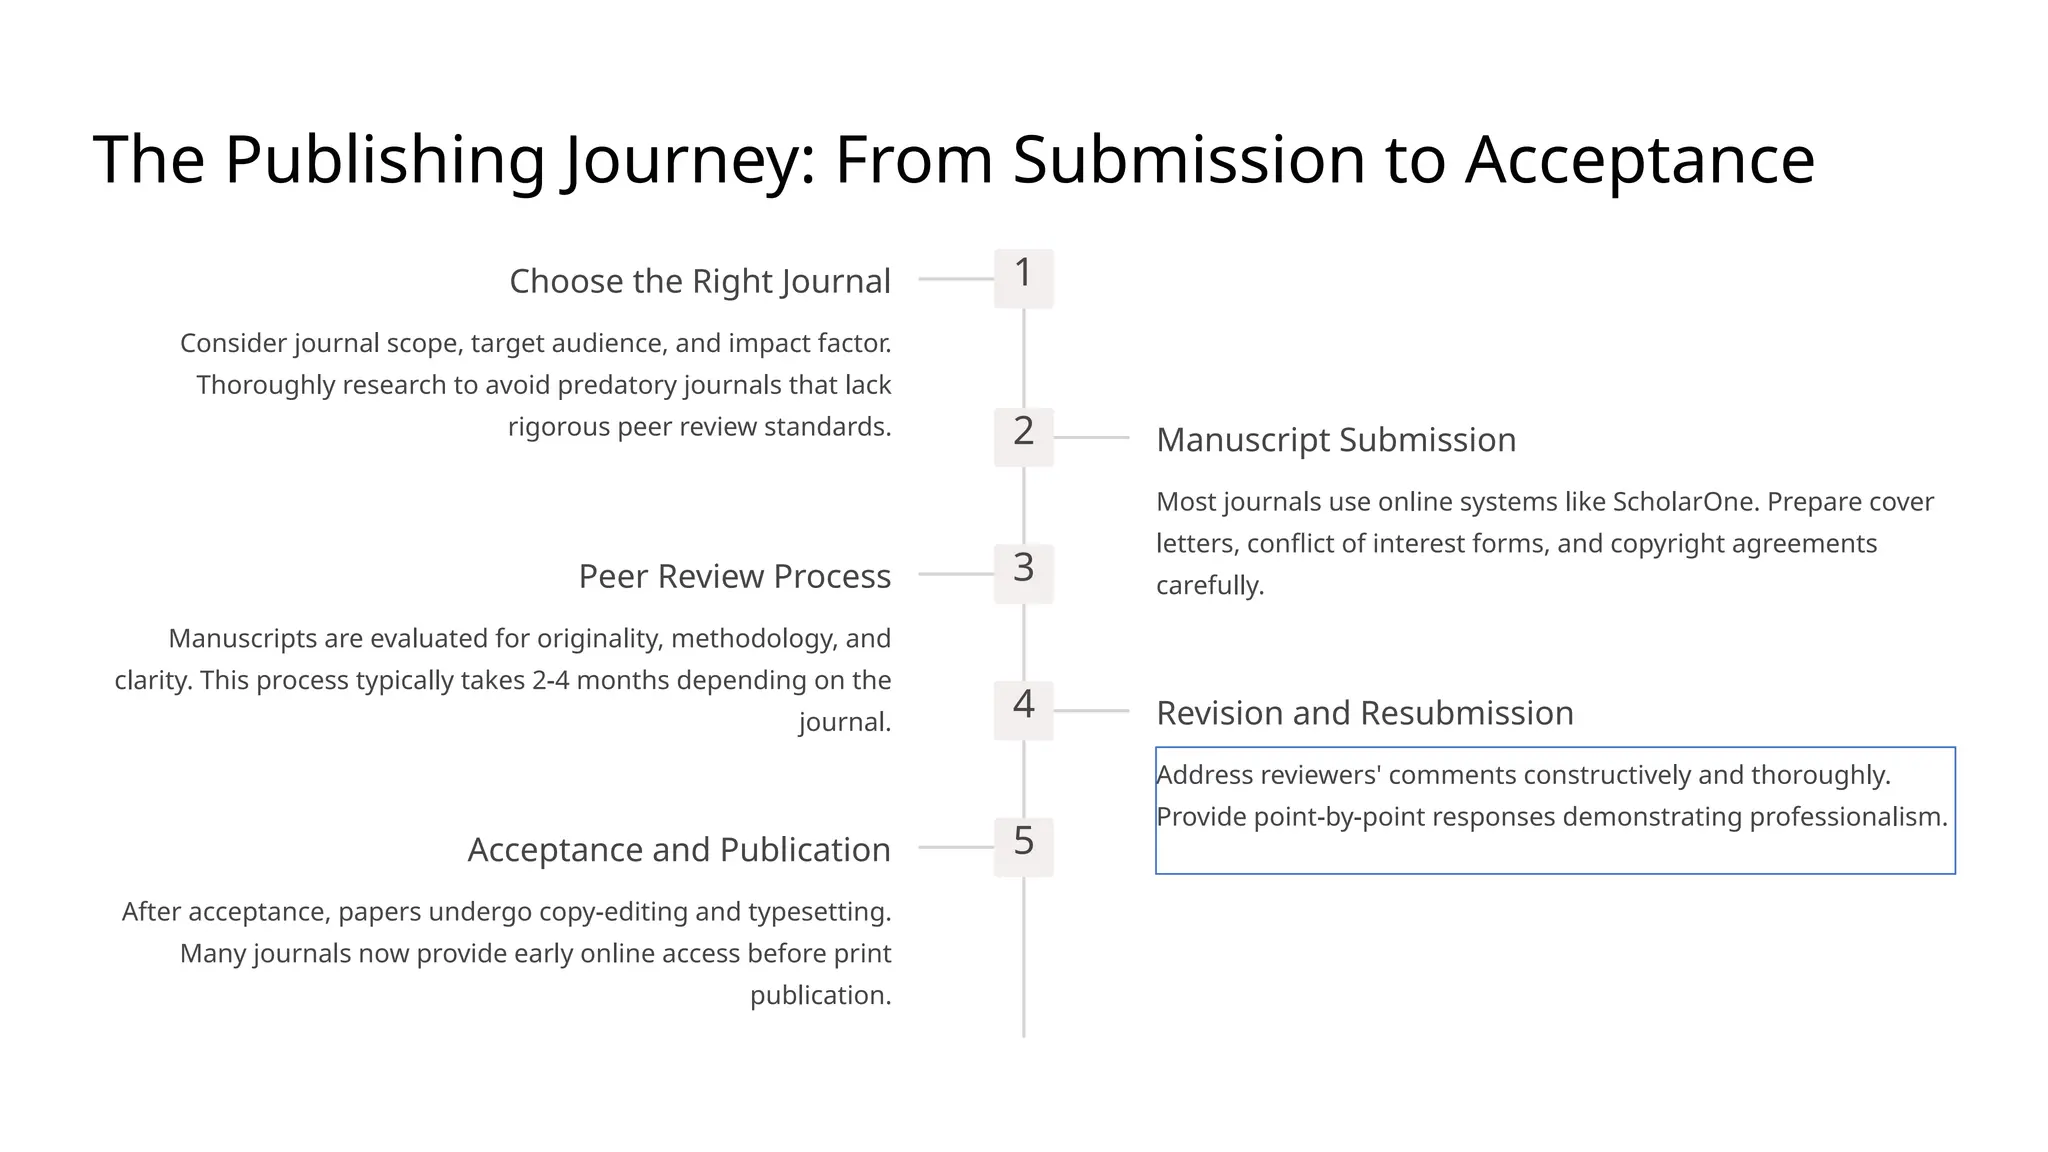
The Publishing Journey:From Submission to Acceptance
1
Choose the Right Journal
Consider journal scope, target audience, and impact factor.
Thoroughly research to avoid predatory journals that lack
rigorous peer review standards. 2 Manuscript Submission
Most journals use online systems like ScholarOne. Prepare cover
letters, conflict of interest forms, and copyright agreements
carefully.
3
Peer Review Process
Manuscripts are evaluated for originality, methodology, and
clarity. This process typically takes 2-4 months depending on the
journal.
4 Revision and Resubmission
Address reviewers' comments constructively and thoroughly.
Provide point-by-point responses demonstrating professionalism.
5
Acceptance and Publication
After acceptance, papers undergo copy-editing and typesetting.
Many journals now provide early online access before print
publication.
30.
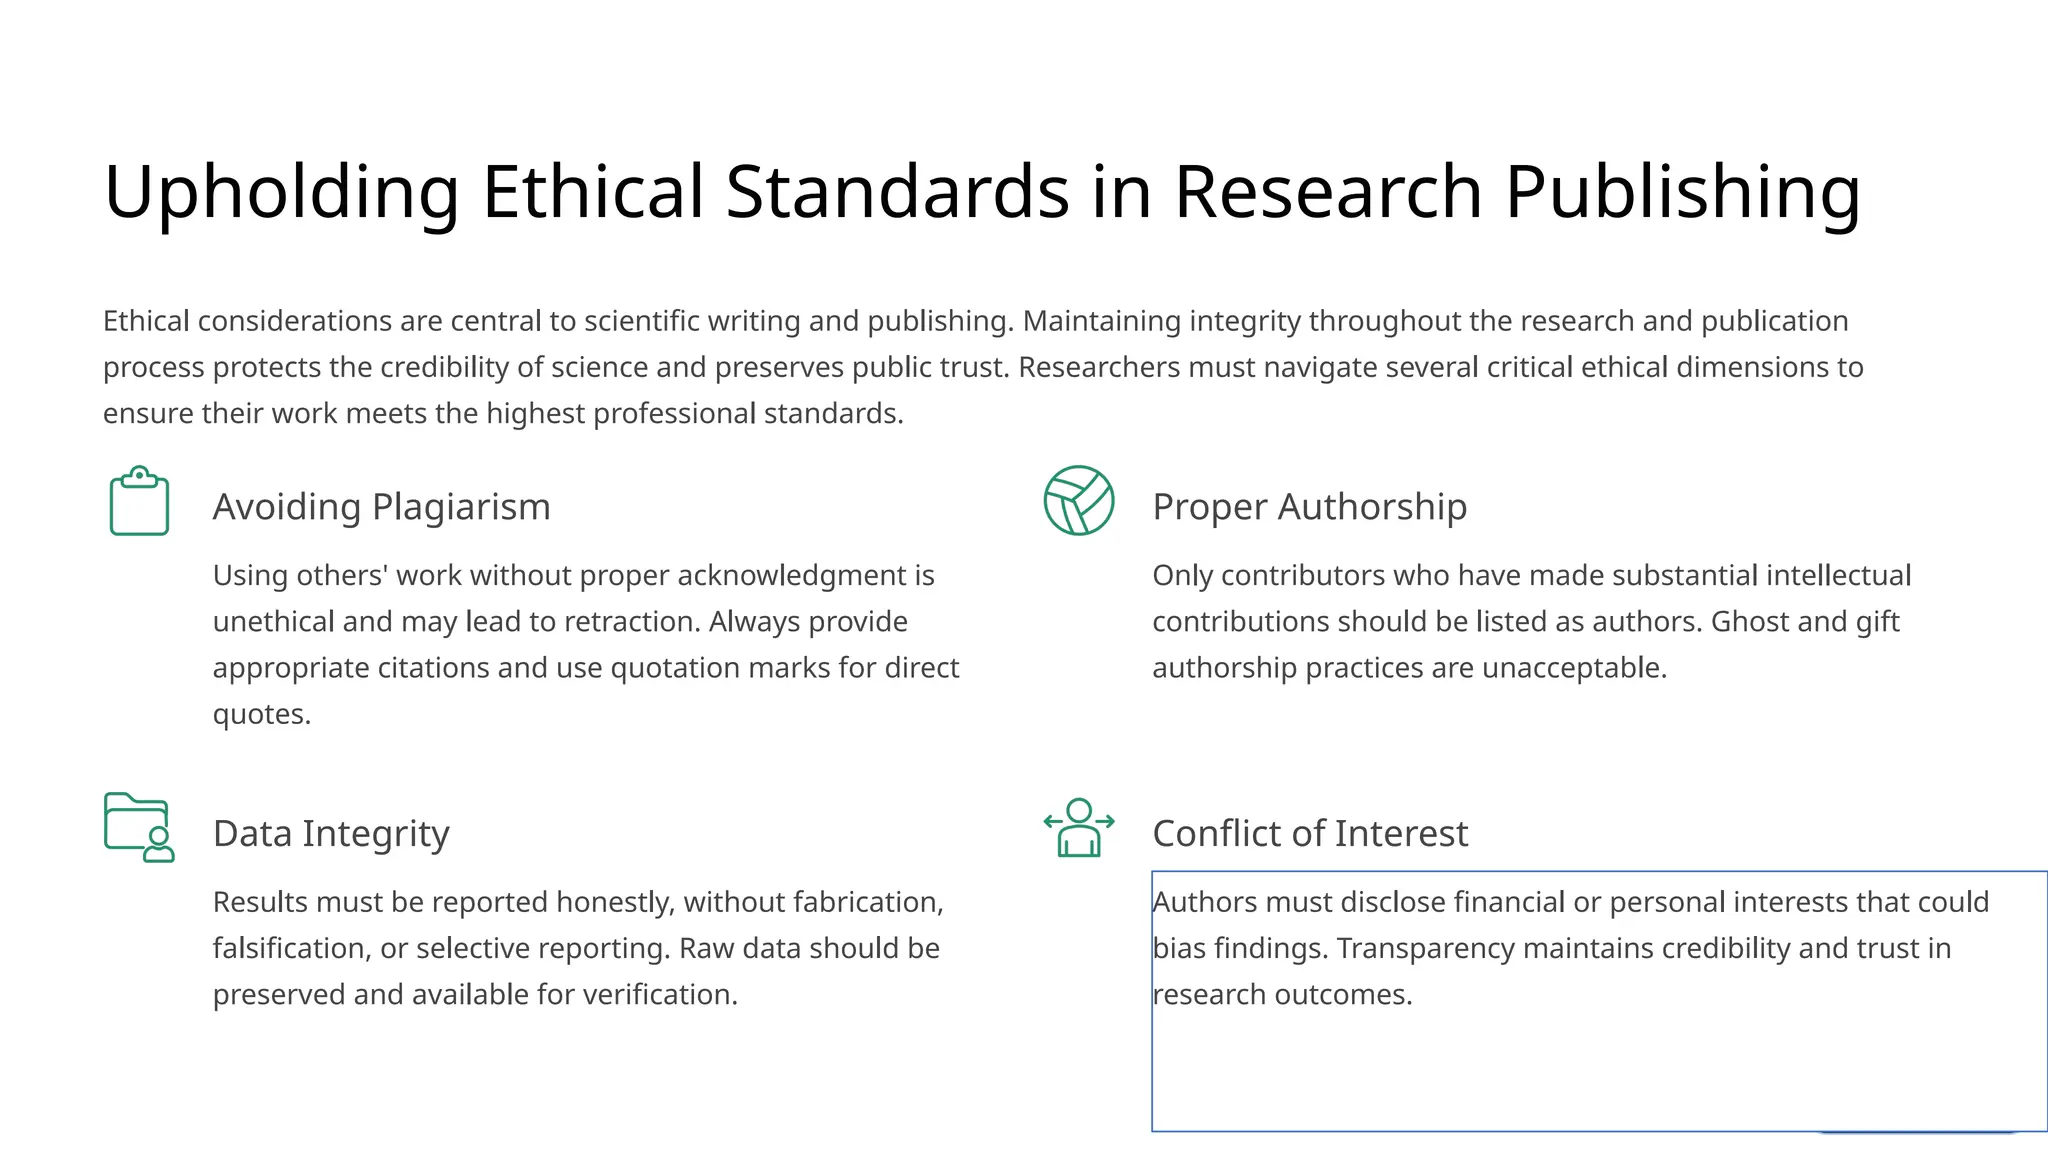
Upholding Ethical Standardsin Research Publishing
Ethical considerations are central to scientific writing and publishing. Maintaining integrity throughout the research and publication
process protects the credibility of science and preserves public trust. Researchers must navigate several critical ethical dimensions to
ensure their work meets the highest professional standards.
Avoiding Plagiarism
Using others' work without proper acknowledgment is
unethical and may lead to retraction. Always provide
appropriate citations and use quotation marks for direct
quotes.
Proper Authorship
Only contributors who have made substantial intellectual
contributions should be listed as authors. Ghost and gift
authorship practices are unacceptable.
Data Integrity
Results must be reported honestly, without fabrication,
falsification, or selective reporting. Raw data should be
preserved and available for verification.
Conflict of Interest
Authors must disclose financial or personal interests that could
bias findings. Transparency maintains credibility and trust in
research outcomes.
31.
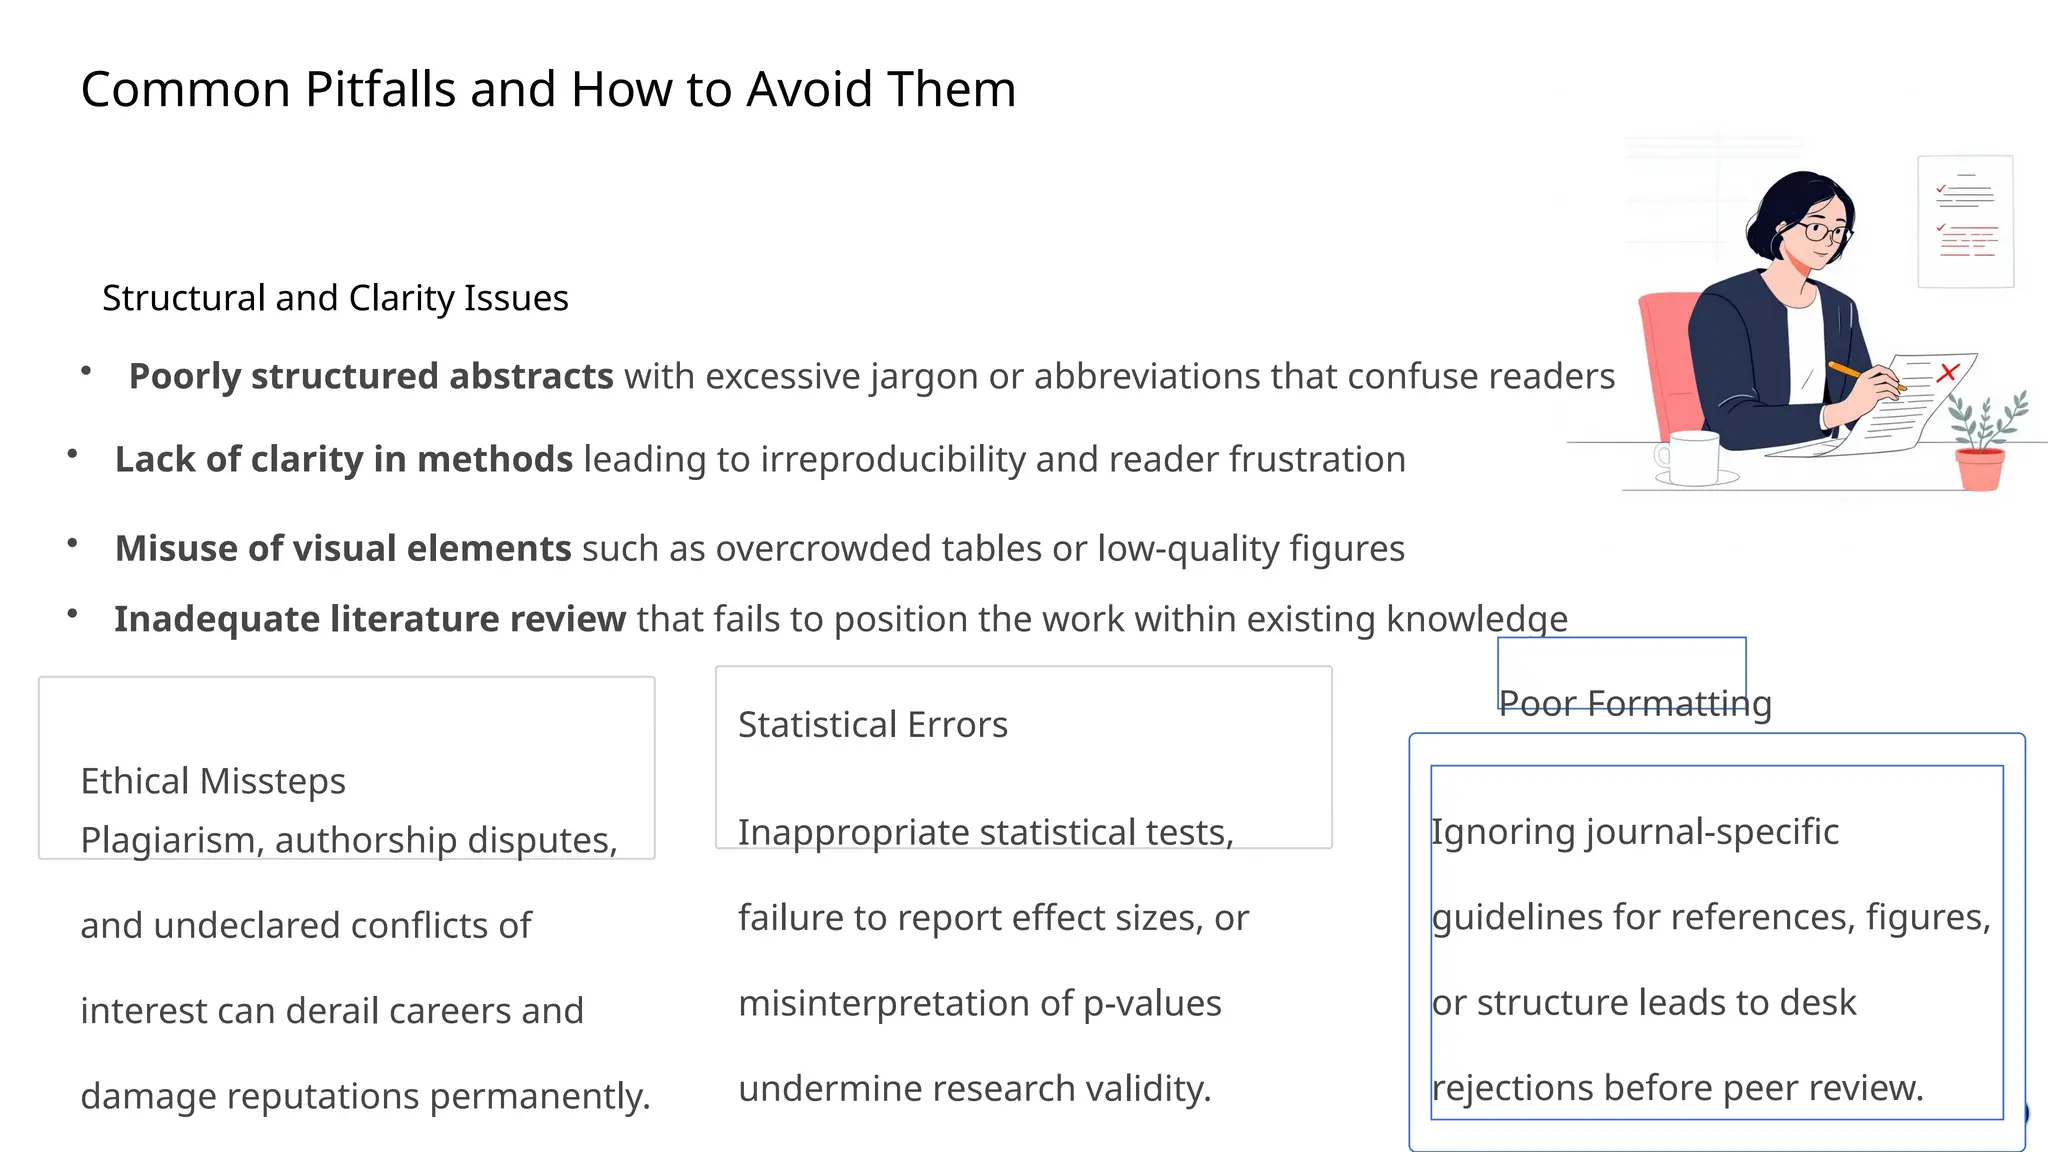
Common Pitfalls andHow to Avoid Them
Structural and Clarity Issues
• Poorly structured abstracts with excessive jargon or abbreviations that confuse readers
• Lack of clarity in methods leading to irreproducibility and reader frustration
• Misuse of visual elements such as overcrowded tables or low-quality figures
• Inadequate literature review that fails to position the work within existing knowledge
Ethical Missteps
Plagiarism, authorship disputes,
and undeclared conflicts of
interest can derail careers and
damage reputations permanently.
Statistical Errors
Inappropriate statistical tests,
failure to report effect sizes, or
misinterpretation of p-values
undermine research validity.
Poor Formatting
Ignoring journal-specific
guidelines for references, figures,
or structure leads to desk
rejections before peer review.
32.
Your Path Forward:Excellence in Scientific Communication
Writing and publishing a scientific paper is both an art and a responsibility that extends far beyond personal achievement. It enhances career prospects,
contributes meaningfully to scientific advancement, and ensures that valuable knowledge is shared ethically and effectively with the global research
community.
Follow Guidelines
Adhere to journal-specific requirements
meticulously
Uphold Ethics
Maintain integrity throughout research and
publication
Refine Skills
Continuously improve writing through practice
and feedback
"The publication of research is not the end of the scientific process—it is the beginning of knowledge translation
and impact. Every paper you write contributes to the collective advancement of human understanding."
Editor's Notes
#2 “A random variable is simply a way of giving a numerical value to outcomes that occur by chance.
In social work, many things we measure—like stress levels, attendance, income, or relapse likelihood—are uncertain.
A random variable allows us to convert these uncertain outcomes into numbers so we can study them scientifically.
So in short, a random variable is a numerical representation of a random outcome.
When we use random variables in social work, we’re often trying to answer questions like:
How many sessions will a client attend?
How much will a family’s income improve after an intervention?
What is the likelihood of relapse after treatment?
These are uncertain outcomes, and random variables help us quantify them.”
#4 Now that we know what a random variable is, what is a function of a random variable?
It simply means applying a mathematical rule to transform or combine variables.
If X is a random variable, and we apply a function g(X), then Y = g(X) becomes a new variable with new meaning.
This is extremely useful in social work because it allows us to create new measures—like changes in stress, dropout indicators, or program coverage.”
#5
“Let’s take a simple and practical example. A social worker wants to evaluate whether a stress-management program is effective.
We define:
X₁ = Stress level before therapy
X₂ = Stress level after therapy
We create a new variable:
Y = X₁ – X₂
This tells us the reduction in stress.
If Y is positive, stress has reduced.
If Y is zero, there is no change.
If Y is negative, stress increased.
Here, three students show measurable reductions, with an average improvement of about 16.6 points
Step 1: Add all the values
Step 2: Divide the total by how many values there are
Suppose the reductions in stress (Y) for 3 students are:
Student 1: 25
Student 2: 20
Student 3: 5
Step 1 → Add them
25 + 20 + 5 = 50
Step 2 → Divide by number of students
There are 3 students.
50 ÷ 3 ≈ 16.6
✅ The average stress reduction = 16.6 points
{Average} = {Sum of all values}
{Number of values}
#6 Economic Empowerment
Script:
“In income studies, incomes are often skewed.
Using a function like Y = log(X) makes incomes easier to analyze, especially in regression models.”
Functions-of-Random-Variables-i…
Predicting Dropout
Script:
“If a rehabilitation center wants to predict dropout, we can define a function such as:
g(X) = 1 if sessions < 5, otherwise 0.
You defined:
X = number of sessions a client attended
If a client attends less than 5 sessions, we label them as dropout → g(X) = 1
If a client attends 5 or more sessions, we label them as completed → g(X) = 0
This function converts a numeric variable into a categorical variable (dropout vs. completed).
If 20 out of 80 clients drop out, then:
✔️ Interpretation
A 25% dropout rate means 1 in 4 clients did not complete the required minimum sessions.
This converts attendance into a simple dropout indicator.”
Community Health Coverage
Script:
“For awareness programs, we often use functions like:
Y = (Participants / Population) × 100
to calculate percentage reach.”
We want to measure how effectively an HIV awareness program reaches different villages.
Let:
X = Number of people who attended/received the program
Population = Total population of the village
We create a new variable:
⭐ What does this give?
Percentage coverage — the proportion of the village that was reached.
⭐ Why is this useful?
It helps us compare effectiveness across villages of different sizes.
Example (optional to include)
If a village has 120 participants out of a population of 600:
So the program reached 20% of the village.
#23 Scientific writing serves as the primary medium through which researchers share their discoveries with the world.
It contributes to scholarly communication, fosters international collaboration, and significantly enhances academic visibility.
For early-career researchers and graduate students, mastering the craft of writing and publishing is absolutely essential for career progression, securing research funding, and gaining institutional recognition.
The publication of research articles expands the boundaries of existing knowledge while encouraging accountability and transparency in the scientific process. Unlike informal communication methods, scientific papers follow a standardized approach, typically represented by the well-established IMRAD format—a structure that has become the gold standard in academic publishing.
#24 Skill development - Writing sharpens analytical thinking and fosters critical evaluation of data, strengthening your research abilities.
Career advance,ent - Publications enhance résumés, open pathways to fellowships, and dramatically improve job opportunities.
Community contribution -Papers provide reliable information for clinicians, researchers, and the public, advancing collective knowledge.
Ethical responsibility- Researchers must disclose findings, positive or negative, to ensure ethical and transparent dissemination.