HUBUNGI KAMI : PT.MINDS INDO SURVEY, DISTRIBUTOR ALAT UKUR SURVEY DAN PEMETAAN, KOMP/RUKO. MEGA KALIMALANG KAV. 8 JLN KH NOER ALI NO. 11,PEKAYON JAYA BEKASI, Tlp : 02195099644/ HP : 082119953499/ 087886144398 Pin BB : 237FC845 .
PENGIRIMAN GRATIS UNTUK WILAYAH DKI
Menjual Alat-Alat Untuk Survey Pemetaan, Infrastruktur, Kontraktor, Telekomunikasi, Pertambangan, Geologist, Exploration, Mining, Dirling, Kelautan, Militer, Migas, Pembangunan Pembangunan, Pengelolaan Lahan Lahan Perhutanan Dan Perkebunan Kelapa Sawit.
RUANG LINGKUP KEGIATAN
PENJUALAN, SERVICE / PERBAIKAN DAN PENYEWAAN ALAT-ALAT UKUR
PENJUALAN :
Alat Ukur
- Total Station
- Altimeter
- Theodolite
- Digital Planimeter
- Levels
- Walking Measure
- GPS Geodetic
- Digital Level / Smart Tool
- Compass
- Phantograph
- Clinometer
- Tandem / Clino - Compass
Accessories :
- Tripod
- Prisma
- Rambu Ukur
- Meteran
- Jalon
- Binocular
PENYEWAAN :
- Total Station
- Automatic Level
- Theodolite
MEREK ALAT UKUR YANG TERSEDIA :
- MINDS
- SPECTRA
- NIKON
- SUUNTO
- GARMIN
- LEICA
- HORIZON
SERVICE / PERBAIKAN DAN KALIBRASI MACAM-MACAM ALAT UKUR
HARGA MENARIK / COMPETITIVE
Catatan : Price List akan dikirim sesuai permintaan
The Serinus 40 Oxides of Nitrogen analyser delivers precise and reliable performance at excellent value. It uses proven chemiluminescence technology to measure NO, NO2 and NOx in ambient air (LDL <0.4 ppb, range 0-20 ppm).
The Serinus 40 Oxides of Nitrogen analyser delivers precise and reliable performance at excellent value. It uses proven chemiluminescence technology to measure NO, NO2 and NOx in ambient air (LDL <0.4 ppb, range 0-20 ppm).
Orion Instruments Jupiter Magnetostrictive Level TransmitterMiller Energy, Inc.
The Jupiter JM4 Magnetostrictive level transmitter from Orion Instruments is the newest and most advanced level instrument to date. The JM4 is available as a direct insertion option, as well as an external mount on any Orion magnetic level indicator (MLI) or modular instrumentation bridle. With an improved design, unparalleled performance, and a collection of new and innovative features, the JM4 provides safer, simpler, and smarter measurement in total and interface level applications.
anritsu mp1800a Анализатор качества сигнала BERonlinestuden
Тест битовых ошибок BER
детектор ошибок до 10мВ;
измерения BER до 32х каналов;
Функции измерений для PON, усилителей EDFA
4PAM/8PAM генератор 32.4PAM BER;
The Serinus 50 Sulfur Dioxide (SO2) analyser delivers precise and reliable performance at excellent value. It uses proven pulsed UV fluorescent radiation technology to measure SO2 in ambient air (LDL <0.3 ppb, Range 0-20 ppm).
The Serinus range of analysers has been designed using our experience and knowledge gained from operating large air quality monitoring networks for more than 35 years. The result: instruments that integrate seamlessly into continuous monitoring networks.
Here, an active RFID tag is used in place of voter id where the system can scan the tag and matches with the fingerprints collected in the Aadhar database.
The voter has to scan the RFID tag for the identification and further the voter has to confirm the identity with the fingerprints.
When fingerprints get matched then voters can cast their votes as the data gets matched.
A LCD is applicable in the process of displaying the corresponding information of the voter from the database, thus illegal voting or impersonating can be avoided since the finger prints is not the same for every individual
Webinar: Wearables - Apresentando um diagrama de blocos e componentes chavesEmbarcados
Neste webinar, apresentaremos exemplos de aplicações de wearables além de um de diagrama de blocos completo, no qual analisaremos os componentes chave da solução. Este conceito poderá ser replicado para inúmeras aplicações e mercados. Link para o Webinar: https://www.embarcados.com.br/webinar-wearables-apresentando-um-diagrama-de-blocos-e-componentes-chaves/
UHF RFID Integrated reader, UHF Fixed reader, UHF Long range reader, UHF Mid-range reader, UHF short range reader, UHF Four channel reader, UHF access control reader, UHF Portal reader, UHF Outdoor reader
Liquid Sensing: Visible light absorption spectroscopy and colorimetry are two fundamental tools used in chemical analysis. Most of these light-based systems use photodiodes as the light sensor, and require similar high input impedance signal chains. This session examines the different components of a photodiode amplifier signal chain, including a programmable gain transimpedance amplifier, a hardware lock-in amplifier, and a Σ-Δ ADC that can measure a sample and reference channel to greatly reduce any measurement error due to variations in intensity of the light source.
Gas Sensing: Many industrial processes involve toxic compounds, and it is important to know when dangerous concentrations exist. Electrochemical sensors offer several advantages for instruments that detect or measure the concentration of toxic gases. This session will describe a portable toxic gas detector using an electrochemical sensor. The system presented here includes a potentiostat circuit to drive the sensor, as well as a transimpedance amplifier to take the very small output current from the sensor and translate it to a voltage that can take advantage of the full-scale input of an ADC.
The Serinus 57 Total Reduced Sulfur analyser delivers precise and reliable performance at excellent value. It uses proven UV fluorescent radiation technology and an external thermal converter to measure TRS in ambient air (LDL <0.3 ppb, Range 0-10 ppm).
The Serinus range of analysers has been designed using our experience and knowledge gained from operating large air quality monitoring networks for more than 35 years. The result: instruments that integrate seamlessly into continuous monitoring networks.
Tektronix keithley Product and Application update Q2 2016Jeff Sable
Tektronix delivers innovative, precise and easy-to-operate test, measurement and monitoring solutions that solve problems, unlock insights and drive discovery.
Modulation schemes used in wireless technologiesVijitaaDas
As we all know, in today's world, Wireless Technology is one of the most important method of communication between one device and other devices. This communication system uses a very clever technique called Modulation Technique or schemes to increase the reach of the signals. Another reason is to allow the use of smaller antenna. This PPT is mainly focused on the modulation schemes that helps in the communication process of Bluetooth, Zigbee, Wi-Fi and UWB.
Pipe locator India, cable locator, pipe and cable locator, buried cable locator, underground pipe and cable locator, underground pipe locator, GPR India, pipe video inspection India, ahmedabad, Gujarat, Delhi, Rajasthan, Bangalore, Chennai
5GPro Spectrum Analyzer - RF spectrum analyzer
Simple to use, accurate, built specifically for field techs. The portable 5GPro Spectrum Analyzer provides visibility into 4G/LTE and 5G RF environments with the industry’s only modular solution.
Features:-
• FR1 (sub-6 GHz) and FR2 (mmWave) with a single solution
• Real-time spectrum analysis (RTSA) of bandwidth up to 100 MHz
• Supports 5G NR demodulation and beamforming analysis
• Smart UX-optimized GUI
• Complete, compact solution for validating 4G and 5G RAN
• First field upgradeable solution: scale at your own pace
• Patent-pending intelligent peak detection and Snap-to-Peak features
• Cloud-enabled workflow management and easy results sharing
We also have certified and authorized service center of EXFO & Sumitomo in India (Jammu, Delhi-NCR, Patna, Kolkata, Mumbai, Hyderabad, Bangalore and Chennai.
Our highlighted products of EXFO are OTDR, Power Meter, Laser Source, Spectrum Analyzer, 𝗢𝗽𝘁𝗶𝗰𝗮𝗹 𝗦𝗽𝗲𝗰𝘁𝗿𝘂𝗺 𝗔𝗻𝗮𝗹𝘆𝘇𝗲𝗿, FIP, FTB, OSA20, 5g testing equipment with the latest otdr of exfo. We are also deal with exfo otdr and other equipment accessories part.
Our highlighted products of Sumitomo electric are : Splicing machines (New z2c z2c, 82c, 82c+, t400s), Cleavers (fc series), electrode
we are also deal with Ixia taps, infovista temspocket, ibwave enterprise tools etc.
𝗖𝗼𝗻𝘁𝗮𝗰𝘁 𝘂𝘀 𝗳𝗼𝗿 𝗺𝗼𝗿𝗲 𝗱𝗲𝘁𝗮𝗶𝗹𝘀 :-
𝑪𝒂𝒍𝒍 𝒐𝒓 𝑾𝒉𝒂𝒕𝒔𝑨𝒑𝒑: https://wa.me/c/919599144113
𝑬𝒎𝒂𝒊𝒍 𝒖𝒔 : sales@invas.in
𝑽𝒊𝒔𝒊𝒕 𝒐𝒖𝒓 𝒘𝒆𝒃𝒔𝒊𝒕𝒆 : www.invas.in
We are 𝒂𝒖𝒕𝒉𝒐𝒓𝒊𝒛𝒆𝒅 𝑺𝒂𝒍𝒆𝒔 & 𝑺𝒆𝒓𝒗𝒊𝒄𝒆 𝑷𝒂𝒓𝒕𝒏𝒆𝒓 of @exfo_inc
We have 𝟴 𝗯𝗿𝗮𝗻𝗰𝗵𝗲𝘀 all over India (𝗝𝗮𝗺𝗺𝘂 | 𝗗𝗲𝗹𝗵𝗶-𝗡𝗖𝗥 | 𝗣𝗮𝘁𝗻𝗮 | 𝗞𝗼𝗹𝗸𝗮𝘁𝗮 | 𝗠𝘂𝗺𝗯𝗮𝗶 | 𝗛𝘆𝗱𝗲𝗿𝗮𝗯𝗮𝗱 | 𝗕𝗮𝗻𝗴𝗮𝗹𝗼𝗿𝗲 | 𝗖𝗵𝗲𝗻𝗻𝗮𝗶).
.
.
#EXFO #exfo #opticalanalyzer #spectrumanalyzer #OpticalPowerMeter #fiberoptic #telecommunications #telecoms #TelecomServices #invastechnologies #5G #networking #network #networkequipment #OpaticalNetworks #invastech
#otdr
#otdrfullform
#otdrtesting
#otdrprice
#otdrmachine
#otdrstandsfor
#ptdrpriceinindia
#otdrpriceamazon
#otdrpdf
#otdrpriceindelhi
#otdrpic
#otdrexfoprice
#otdrexfo
#otdrequipment
#otdrevents
#otdrexfo715b
#otdrexfomaxtester730c
#otdrexfoftb-200
#otdrebay
#otdrexfoftb-1manual
#otdrexfomax-72c
#otdrexfoftb-1price
#exfo
#exfootdr
#exfootdrprice
#exfopune
#exfopowermeter
#exfocompany
#exfoindia
#exfomaxtester
#exfootdrsoftware
#exfootdrsoftwareupdate
#exfootdrcharger
#exfootdrbattery
#exfootdrforsale
#exfootdrbag
#exfootdr710priceinindia
#splicingmachinewithotdr
#splicingmachine
#splicingmachineprice
#spicingmachinesumitomo
#splicingmachinefujikura
#splicingmachineonemi
#splicingmachinefujikuraprice
#splicingmachineelectrode
#splicingmachinebox
#splicingmachinebag
#splicingmachinesuppliersinkolkata
#splicingmachinesuppliersindelhi
#z2c
What is 5G NR all about? Check out this presentation to see all the key design components of this new unifying air interface for the next decade and beyond.
Real-time spectrum analyzer RSA5000 Series
The RSA5065 real-time spectrum analyzer with real-time analysis and sweep analysis, optional vector signal analysis application software (VSA) and EMI measurement application software (EMI), with excellent performance and specifications. Its frequency range is 9kHz to 3.2GHz, and it is available with the tracking source "-TG" model, which can be widely used in enterprise R&D, factory production, education and teaching
For effective implementation of Software Defined
Radio (SDR) in any RF application, a proper choice of data
converter is an essential requirement. This paper describes the
requirement of data converters in SDR, their key specificati
ons that impact the SDR performance and a comparison of
various data converters from leading vendors, which are
suitable in an SDR application.
CASCADEMIC Smart Water Meter Solution is a compact low power Industrial grade device that has the features to work under a networked environment.
The Smart flow meter has inbuilt Processing, storage and RF transmission unit.
The Smart water meter is an automated meter reading (AMR) based water meter with long life battery operation which is integrated and can be completely sealed based on the application requirement.
The modular approach design of this device provides the OEM’s the flexibility to use any type of sensors that match their application environment. For the current remote flow meter application,we can use ultrasonic sensor, AMR sensor or Hall Effect Sensor.
JMeter webinar - integration with InfluxDB and GrafanaRTTS
Watch this recorded webinar about real-time monitoring of application performance. See how to integrate Apache JMeter, the open-source leader in performance testing, with InfluxDB, the open-source time-series database, and Grafana, the open-source analytics and visualization application.
In this webinar, we will review the benefits of leveraging InfluxDB and Grafana when executing load tests and demonstrate how these tools are used to visualize performance metrics.
Length: 30 minutes
Session Overview
-------------------------------------------
During this webinar, we will cover the following topics while demonstrating the integrations of JMeter, InfluxDB and Grafana:
- What out-of-the-box solutions are available for real-time monitoring JMeter tests?
- What are the benefits of integrating InfluxDB and Grafana into the load testing stack?
- Which features are provided by Grafana?
- Demonstration of InfluxDB and Grafana using a practice web application
To view the webinar recording, go to:
https://www.rttsweb.com/jmeter-integration-webinar
"Impact of front-end architecture on development cost", Viktor TurskyiFwdays
I have heard many times that architecture is not important for the front-end. Also, many times I have seen how developers implement features on the front-end just following the standard rules for a framework and think that this is enough to successfully launch the project, and then the project fails. How to prevent this and what approach to choose? I have launched dozens of complex projects and during the talk we will analyze which approaches have worked for me and which have not.
GraphRAG is All You need? LLM & Knowledge GraphGuy Korland
Guy Korland, CEO and Co-founder of FalkorDB, will review two articles on the integration of language models with knowledge graphs.
1. Unifying Large Language Models and Knowledge Graphs: A Roadmap.
https://arxiv.org/abs/2306.08302
2. Microsoft Research's GraphRAG paper and a review paper on various uses of knowledge graphs:
https://www.microsoft.com/en-us/research/blog/graphrag-unlocking-llm-discovery-on-narrative-private-data/
Key Trends Shaping the Future of Infrastructure.pdfCheryl Hung
Keynote at DIGIT West Expo, Glasgow on 29 May 2024.
Cheryl Hung, ochery.com
Sr Director, Infrastructure Ecosystem, Arm.
The key trends across hardware, cloud and open-source; exploring how these areas are likely to mature and develop over the short and long-term, and then considering how organisations can position themselves to adapt and thrive.
Search and Society: Reimagining Information Access for Radical FuturesBhaskar Mitra
The field of Information retrieval (IR) is currently undergoing a transformative shift, at least partly due to the emerging applications of generative AI to information access. In this talk, we will deliberate on the sociotechnical implications of generative AI for information access. We will argue that there is both a critical necessity and an exciting opportunity for the IR community to re-center our research agendas on societal needs while dismantling the artificial separation between the work on fairness, accountability, transparency, and ethics in IR and the rest of IR research. Instead of adopting a reactionary strategy of trying to mitigate potential social harms from emerging technologies, the community should aim to proactively set the research agenda for the kinds of systems we should build inspired by diverse explicitly stated sociotechnical imaginaries. The sociotechnical imaginaries that underpin the design and development of information access technologies needs to be explicitly articulated, and we need to develop theories of change in context of these diverse perspectives. Our guiding future imaginaries must be informed by other academic fields, such as democratic theory and critical theory, and should be co-developed with social science scholars, legal scholars, civil rights and social justice activists, and artists, among others.
Smart TV Buyer Insights Survey 2024 by 91mobiles.pdf91mobiles
91mobiles recently conducted a Smart TV Buyer Insights Survey in which we asked over 3,000 respondents about the TV they own, aspects they look at on a new TV, and their TV buying preferences.
Dev Dives: Train smarter, not harder – active learning and UiPath LLMs for do...UiPathCommunity
💥 Speed, accuracy, and scaling – discover the superpowers of GenAI in action with UiPath Document Understanding and Communications Mining™:
See how to accelerate model training and optimize model performance with active learning
Learn about the latest enhancements to out-of-the-box document processing – with little to no training required
Get an exclusive demo of the new family of UiPath LLMs – GenAI models specialized for processing different types of documents and messages
This is a hands-on session specifically designed for automation developers and AI enthusiasts seeking to enhance their knowledge in leveraging the latest intelligent document processing capabilities offered by UiPath.
Speakers:
👨🏫 Andras Palfi, Senior Product Manager, UiPath
👩🏫 Lenka Dulovicova, Product Program Manager, UiPath
Accelerate your Kubernetes clusters with Varnish CachingThijs Feryn
A presentation about the usage and availability of Varnish on Kubernetes. This talk explores the capabilities of Varnish caching and shows how to use the Varnish Helm chart to deploy it to Kubernetes.
This presentation was delivered at K8SUG Singapore. See https://feryn.eu/presentations/accelerate-your-kubernetes-clusters-with-varnish-caching-k8sug-singapore-28-2024 for more details.
State of ICS and IoT Cyber Threat Landscape Report 2024 previewPrayukth K V
The IoT and OT threat landscape report has been prepared by the Threat Research Team at Sectrio using data from Sectrio, cyber threat intelligence farming facilities spread across over 85 cities around the world. In addition, Sectrio also runs AI-based advanced threat and payload engagement facilities that serve as sinks to attract and engage sophisticated threat actors, and newer malware including new variants and latent threats that are at an earlier stage of development.
The latest edition of the OT/ICS and IoT security Threat Landscape Report 2024 also covers:
State of global ICS asset and network exposure
Sectoral targets and attacks as well as the cost of ransom
Global APT activity, AI usage, actor and tactic profiles, and implications
Rise in volumes of AI-powered cyberattacks
Major cyber events in 2024
Malware and malicious payload trends
Cyberattack types and targets
Vulnerability exploit attempts on CVEs
Attacks on counties – USA
Expansion of bot farms – how, where, and why
In-depth analysis of the cyber threat landscape across North America, South America, Europe, APAC, and the Middle East
Why are attacks on smart factories rising?
Cyber risk predictions
Axis of attacks – Europe
Systemic attacks in the Middle East
Download the full report from here:
https://sectrio.com/resources/ot-threat-landscape-reports/sectrio-releases-ot-ics-and-iot-security-threat-landscape-report-2024/
The Art of the Pitch: WordPress Relationships and SalesLaura Byrne
Clients don’t know what they don’t know. What web solutions are right for them? How does WordPress come into the picture? How do you make sure you understand scope and timeline? What do you do if sometime changes?
All these questions and more will be explored as we talk about matching clients’ needs with what your agency offers without pulling teeth or pulling your hair out. Practical tips, and strategies for successful relationship building that leads to closing the deal.
Epistemic Interaction - tuning interfaces to provide information for AI supportAlan Dix
Paper presented at SYNERGY workshop at AVI 2024, Genoa, Italy. 3rd June 2024
https://alandix.com/academic/papers/synergy2024-epistemic/
As machine learning integrates deeper into human-computer interactions, the concept of epistemic interaction emerges, aiming to refine these interactions to enhance system adaptability. This approach encourages minor, intentional adjustments in user behaviour to enrich the data available for system learning. This paper introduces epistemic interaction within the context of human-system communication, illustrating how deliberate interaction design can improve system understanding and adaptation. Through concrete examples, we demonstrate the potential of epistemic interaction to significantly advance human-computer interaction by leveraging intuitive human communication strategies to inform system design and functionality, offering a novel pathway for enriching user-system engagements.
2. The high-end approach is also evident in the operating
features. When equipped with a tracking generator up to
18 GHz, the R&S®FSL18 is an easily portable, microwave
scalar network analyzer. As with the higher-class analyzers
from Rohde & Schwarz, the main functions of the R&S®FSL
are directly accessible by fixed-assignment function keys,
with additional functions accessed using softkeys and ta-
bles. This shortens the learning curve for new users.
Its compact size and low weight, plus its optional battery
pack, make the R&S®FSL ideal for mobile use.
The R&S®FSL has unique plug & play upgrade abilities.
All options can be added without opening the instrument.
Main features
❙❙ Frequency range 9 kHz to 3 GHz/6 GHz/18 GHz
❙❙ 3 GHz, 6 GHz and 18 GHz models with and without
tracking generator
❙❙ Best RF characteristics in its class
❙❙ Largest signal analysis bandwidth in its class (28 MHz)
❙❙ Low measurement uncertainty, even in microwave range
❙❙ High resolution filter accuracy owing to all-digital
implementation
❙❙ Robust and compact
❙❙ Carrying handle and low weight (<8 kg/18 lbs)
❙❙ Optional battery operation
❙❙ Wide range of functions, simple operation
❙❙ Easy on-site upgrading with options
2
You no longer have to make comprises when buying
a spectrum analyzer. You can now get high-end
features without stretching your budget
– the R&S®FSL.
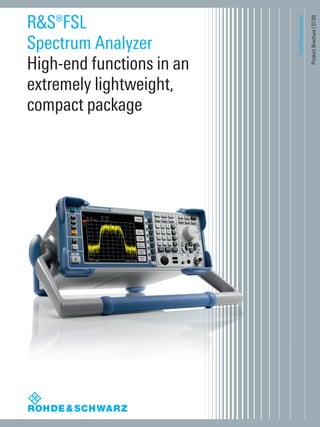
The R&S®FSL is an extremely lightweight and compact
spectrum analyzer that is ideal for a large number of appli-
cations in development, service and production.
Despite its compact size, it offers a wealth of functions
more typical of the high-end range, thus ensuring an ex-
cellent price/performance ratio. The R&S®FSL is the only
instrument in its class that features a tracking generator
up to 18 GHz and can analyze signals with a bandwidth
of 28 MHz. In addition, the R&S®FSL18, which operates
at frequencies up to 18 GHz, supports applications in the
microwave range.
R&S®FSL
Spectrum Analyzer
At a glance
The R&S®FSL is a full-featured analyzer with the widest demodulation bandwidth and the best RF characteristics in its class.
FSL_bro_en_0758_2790_12.indd 2 08.07.2013 10:02:35
3. Exceptional performance for its class
❙❙ Continuous RF frequency range from 9 kHz to 18 GHz
and 28 MHz demodulation bandwidth
❙❙ Low measurement uncertainty even in microwave range
▷▷ page 4
Fast and versatile in production
❙❙ High measurement speed and time-saving routines
improve throughput
❙❙ Remote control via LAN or IEC/IEEE bus in line with SCPI
▷▷ page 5
At home in every development lab
❙❙ Excellent price/performance ratio
❙❙ General-purpose signal analysis
❙❙ Wide range of personalities for various wireless/cellular
digital standards
▷▷ page 6
Lightweight and compact for on-site installation,
maintenance and service
❙❙ Easy portability due to small size and low weight
❙❙ Optional internal battery pack for cordless use
❙❙ Power measurements with R&S®NRP-Zxx power sensors
▷▷ page 7
Easy upgrades and a wide range of interfaces
❙❙ On-site plug & play installation of options without opening
the instrument
❙❙ Additional interfaces expand the application range of the
R&S®FSL
▷▷ page 8
Wide range of functions – simple operation
❙❙ Comprehensive set of measurement functions and
features more typical of high-end analyzers
❙❙ Built-in measurement routines and versatile selection of
firmware options
▷▷ page 9
Rohde & Schwarz R&S®FSL Spectrum Analyzer 3
R&S®FSL
Spectrum Analyzer
Benefits and
key features
FSL_bro_en_0758_2790_12.indd 3 08.07.2013 10:02:35
4. Exceptional
performance
for its class
With phase noise of typ. –103 dBc (1 Hz) at 10 kHz from
the carrier, a third order intercept point of typ. +18 dBm, a
bandwidth range from 10 Hz to 10 MHz, and a displayed
average noise level (DANL) of typ. –162 dBm, the R&S®FSL
compares favorably with high-end analyzers. This makes
it very useful in production, service, field use and in labs.
The RF attenuator, which is adjustable in steps of 5 dB,
and the optional preamplifier ensure an optimum usable
dynamic range.
Continuous RF frequency range from 9 kHz to
18 GHz and 28 MHz demodulation bandwidth
The R&S®FSL is the only instrument in its class with a
bandwidth of 28 MHz. Featuring an analysis bandwidth of
28 MHz, the spectrum analyzer is ideal for measuring both
spectral and modulation parameters of broadband signals
such as WLAN and WiMAX™, including harmonic signals
up to 18 GHz. In the time domain, its fast digitizer allows
the detection of pulsed signals and the measurement of
pulse widths.
There are six different R&S®FSL models available
(see page 21 for specifications):
❙❙ R&S®FSL3: 9 kHz to 3 GHz
(available with and without tracking generator)
❙❙ R&S®FSL6: 9 kHz to 6 GHz
(available with and without tracking generator)
❙❙ R&S®FSL18: 9 kHz to 18 GHz (20 GHz overrange,
available with and without tracking generator)
The R&S®FSL18 covers frequencies up to 18 GHz, which
makes it ideal for a large number of development, service
and production applications at microwave frequencies.
Examples include the installation and maintenance of
radar systems and microwave links, as well as the produc-
tion of microwave components or satellite surveillance.
Low measurement uncertainty
Another unrivaled characteristic in its class is the low over-
all measurement uncertainty, which yields accurate and
reliable results even in the microwave range.
The analyzer's low measurement uncertainty makes tests
and alignment more accurate and reliable and allows a
separate power meter to be replaced. Moreover, it reduces
the margin needed for test instrument uncertainty and
thus increases the margin left for the DUT.
Typical applications of the R&S®FSL18 include measurements in the mi-
crowave range, for example measuring the pulse width using the n-dB
down marker.
4
FSL_bro_en_0758_2790_12.indd 4 08.07.2013 10:02:35
5. Input command
SENSE:LIST:POW
100MHz,-0dBm,10dB,10dB,NORM,1MHz,3MHz,434us,0,
200MHz,-20dBm,10dB,0dB,NORM,30kHz,100kHz,1ms,0,
300MHz,-20dBm,10dB,0dB,NORM,30kHz,100kHz,1ms,0;
Output ¸FSL
-28.3,
-30.6,
-38.1
Fast and versatile
in production
The R&S®FSL’s high speed of >80 sweeps/s in zero
span, including remote output of data (or trace data),
ensures high production throughput. Even a simple level
calibration can be streamlined and accelerated with the
R&S®FSL’s integrated complex measurement functions
– a special multisummary marker measures different levels
in the time domain in a single sweep. This eliminates reset
and remote control overhead time. For fast synchroniza-
tion or triggering, the R&S®FSL-B5 additional interfaces
option – which includes a special trigger interface – can be
added.
In addition, the R&S®FSL offers the following functions:
❙ Fast ACP measurements in the time domain for the major
wireless communications standards, with very good
repeatability and short measurement times
❙ List mode: measurements with up to 300 analyzer
settings with a single IEC/IEEE bus command
❙ Fast power measurement in the time domain using
channel or RRC filters
❙ Fast frequency counter with 1 Hz resolution and
measurement times <50 ms
Remote control via LAN or IEC/IEEE bus in line
with SCPI
The standard remote interface is a 10/100BaseT LAN
interface that provides significantly higher speeds than
an IEC/IEEE bus for transferring large data volumes. It
also offers considerable cost advantages over IEC/IEEE
bus wiring. However, IEC/IEEE bus remote control can be
added by installing the R&S®FSL-B10 option.
The command set of the R&S®FSL follows SCPI conven-
tions and is thus largely compatible with the R&S®FSP and
R&S®FSU analyzers.
The R&S®FSL is ideal for fast, easy measurements
during production. A quick check of the level and
frequency is often all that‘s needed.
Remote control of the R&S®FSL via IEC/IEEE bus in list mode cuts down on measurement time.
Rohde&Schwarz R&S®FSL Spectrum Analyzer 5
FSL_bro_en_0758_2790_12.indd 5 08.07.2013 10:02:37
6. At home in every
development lab
The R&S®FSL‘s excellent price/performance ratio makes
it a must for every developer‘s lab bench, as indispens-
able as an oscilloscope or multimeter. Its range of func-
tions and operation are largely identical with those of the
R&S®FSU high-end analyzers, simplifying the reproducible
verification of measurements.
❙❙ Good RF performance at a low price
❙❙ Widest I/Q demodulation bandwidth in its class
❙❙ Quasi-peak detectors and EMC bandwidths of 200 Hz,
9 kHz and 120 kHz for EMC checks during development
and precompliance testing
❙❙ Tracking generator for transmission and reflection
measurements (e.g. with the R&S®ZRB2 or R&S®FSH-Z2
VSWR bridge)
❙❙ High measurement accuracy
❙❙ Easy output of measurement results to USB printer,
network printer or file
❙❙ Easy remote control via LAN
❙❙ Connection to MATLAB®
The R&S®FSL’s wide scope of functions also
extends to channel/adjacent channel power
measurements. To simplify use, many default
settings can be selected by pressing a button.
The R&S®FSL offers many different firmware
options (see page 22). The user can switch be-
tween the different applications.
6
FSL_bro_en_0758_2790_12.indd 6 08.07.2013 10:02:37
7. The low weight (<8 kg), the small size and the ruggedized
housing make the R&S®FSL ideal for mobile applications.
Due to these properties it is easy to carry to remote or
hard-to-reach locations. The carrying bag with space for
an extra battery pack and accessories and the protective
hardcover are also very convenient for field use.
Optional internal battery pack for cordless use
When equipped with the optional internal battery pack
(R&S®FSL-B31), the R&S®FSL can be used independent of
the mains supply for at least one hour. Easy and fast bat-
tery exchange in the field increases battery operation time.
In addition, a DC power supply (R&S®FSL-B30) is available
for the R&S®FSL. This option allows the R&S®FSL to be
used anywhere where DC power is available, e.g. in a car.
Power measurements with R&S®NRP-Zxx power
sensors
Another special feature of the R&S®FSL is the fact that you
can directly connect a power sensor from the R&S®NRP-Z
series. The R&S®FSL-K9 option and a connected power
sensor allow very precise measurements of the DUT pow-
er – an enormous advantage for applications where level
accuracy is crucial. The R&S®FSL can thus replace a power
meter. This is particularly important in mobile applications.
Ideal for service
❙❙ Cost-effectiveness
❙❙ High measurement accuracy
❙❙ Extensive evaluation options
❙❙ Wide range of functions
❙❙ Built-in frequency counter
❙❙ AM/FM audio demodulator for interference identification
❙❙ Extensive functions for power measurements
❙❙ Storage of settings and measurement results in the
R&S®FSL or on a USB memory stick
Lightweight
and compact for
on‑site installation,
maintenance and
service
Soft carrying bag for the R&S®FSL.
Rohde & Schwarz R&S®FSL Spectrum Analyzer 7
FSL_bro_en_0758_2790_12.indd 7 08.07.2013 10:02:38
8. The R&S®FSL has unique plug & play upgrade abilities. All
options can be added without opening the instrument.
This has several important advantages:
❙❙ No extra alignment after installation
❙❙ No recalibration
❙❙ No need to send in the instrument, thus negligible
downtime
❙❙ No installation costs
❙❙ Easy installation of additional functions
The wide range of additional interfaces provided by the
R&S®FSL-B5 option expands the application range of the
R&S®FSL:
❙❙ IF output/video output for connecting further instruments
❙❙ 28 V, switchable for connecting noise sources
❙❙ Trigger interface for fast measurement on frequency lists
❙❙ Connector for an R&S®NRP-Zxx power sensor (replaces
the USB adapter for the R&S®NRP-Zxx power sensors)
Easy upgrades and
a wide range of
interfaces
Battery pack (R&S®FSL-B31)
DC power supply (R&S®FSL-B30)
IEC/IEEE (GPIB) bus interface
(R&S®FSL-B10)
OCXO (R&S®FSL-B4,
standard in the R&S®FSL18)
Additional interfaces
(R&S®FSL-B5)
8
FSL_bro_en_0758_2790_12.indd 8 08.07.2013 10:02:43
9. Wide range of
functions – simple
operation
The R&S®FSL offers a comprehensive set of measurement
functions and features that are more typical of high-end
analyzers. A versatile selection of firmware options helps
save costs as a low-budget spectrum analyzer can be used
whenever the specifications of a high-end spectrum ana-
lyzer are not required. An intuitive user interface supports
users with measurements in line with standards. In addi-
tion, preconfigured, built-in measurement routines help
the user to quickly get results.
Measurement routines for:
Third order intercept measurement (TOI)
Occupied bandwidth measurement (OBW)
Time domain power measurement
Channel power measurement (CP)
Adjacent channel power and multicarrier adjacent channel power
measurement (ACP and MC-ACP)
Fast adjacent channel power measurement (ACP)
Carrier-to-noise ratio measurement (C/N, C/N0
)
Modulation depth measurement (AM%)
Standard features
28 MHz I/Q demodulation bandwidth
Complete range of detectors
RRC and channel filters
FFT filters 1 Hz/300 Hz to 30 kHz
Frequency counter
Noise and phase noise markers
n-dB down marker
Limit lines
Level units
Selectable number of trace points
Transducer factors
LAN interface
USB
Help function
Application firmware for general-purpose signal
analysis
AM/FM/φM measurement demodulator (R&S®FSL-K7 option, page 14)
Power measurement with R&S®NRP-Zxx power sensors (R&S®FSL-K9
option)
Spectrogram measurements (R&S®FSL-K14 option, page 13)
Cable TV measurements (R&S®FSL-K20 option, page 16)
Noise figure and gain measurement (R&S®FSL-K30 option, page 17)
TV trigger (R&S®FSL-B6 option, page 11)
Gated sweep (R&S®FSL-B8 option, page 11)
Application firmware for varios wireless/cellular
standards
Bluetooth® modulation and spectrum measurements (R&S®FSL-K8 option,
page 15)
WCDMA (R&S®FSL-K72 option)
CDMA2000®/1xEV-DO modulation and spectrum measurement
(R&S®FSL-K82/-K84 options, page 18)
WLAN transmitter measurements (R&S®FSL-K91/-K91n options,
page 19)
WiMAX™ modulation and spectrum measurements
(R&S®FSL-K92/-K93 options)
Rohde & Schwarz R&S®FSL Spectrum Analyzer 9
FSL_bro_en_0758_2790_12.indd 9 08.07.2013 10:02:44
10. Scalar network analysis
Models .13, .16 and .28 of the R&S®FSL, which include
a tracking generator, can quickly and easily measure fre-
quency response, filters and attenuation. The n-dB down
marker determines the 3 dB bandwidth of a bandpass filter
at the press of a button, for example. The R&S®FSL mea-
sures return loss or matching by using an external VSWR
bridge. Precision is enhanced by Through, Short and Open
normalization methods.
Third order intercept (TOI)
The R&S®FSL can determine the TOI from the spectrum
at the press of a button. It automatically detects the use-
ful carriers and thus determines the intermodulation
sidebands. The instrument‘s maximum dynamic range of
95 dB is high for its class. RF attenuation steps of 5 dB
further enhance its usefulness.
Modulation depth measurement (AM%)
The R&S®FSL measures the modulation depth of an AM
signal at the press of a button. The AM% marker function
positions three markers – one each on the carrier, the up-
per sideband and the lower sideband – and uses the side-
band suppression to determine the modulation depth. The
modulation depth of a two-tone signal can be determined
selectively by predefining the modulation frequency, for
example by starting with a 90 Hz sideband and then mov-
ing to the 150 Hz sideband of an ILS signal. The high lin-
earity of <0.2 dB ensures a small absolute measurement
error.
10
FSL_bro_en_0758_2790_12.indd 10 08.07.2013 10:02:45
11. Spurious emissions measurements
Spurious emissions measurements very often require
different measurement bandwidths for different frequency
ranges. They can easily be performed by using the
spurious emissions functions in the sweep list table, which
allows to set parameters such as RBW, VBW, detector,
level, number of sweep points individually for different fre-
quency ranges. This makes a complete spurious emissions
measurement very fast and easy as setup and measure-
ment is made only once and not separately for each fre-
quency range. A segmented sweep can also easily be set
up using this function.
Gated sweep
The R&S®FSL uses the gated sweep function (R&S®FSL-B8
option) for burst signal measurements. This function can
display the modulation spectrum of a GSM signal or a
burst WLAN signal (as shown in the example).
TV trigger option
The R&S®FSL-B6 TV trigger generates a trigger in response
to selectable lines and the horizontal or vertical blanking
interval. Video formats with 525 or 625 lines with positive
or negative modulation are covered.
Rohde & Schwarz R&S®FSL Spectrum Analyzer 11
FSL_bro_en_0758_2790_12.indd 11 08.07.2013 10:02:45
12. Channel power measurements
Channel power measurements use integration to deter-
mine the power within a defined channel bandwidth. The
full-featured RMS detector is used to measure the correct
power independent of the signal, which ensures good
repeatability and accuracy. The channel width can be
defined by the user or selected from an extensive list of
transmission standards.
Adjacent channel power (ACP, MC-ACP)
measurements, for example cdmaOne
The ACP measurement function determines the adjacent
channel power as an absolute value or relative to the use-
ful carrier. The R&S®FSL offers predefined settings for
many transmission standards, but parameters can also be
user-defined, with channel widths and spacings for up 12
channels and up to 12 adjacent channels.
Fast ACP in time domain with standard-compliant
channel filters
The fast ACP function measures the adjacent channel
power in the time domain using standard-compliant chan-
nel filters. This reduces the measurement time necessary
for a specific repeatability by a factor of 10. It also provides
an easy way to determine transient, time-dependent adja-
cent channel power.
12
FSL_bro_en_0758_2790_12.indd 12 08.07.2013 10:02:46
13. Burst power measurement: time domain power
This feature allows the burst power to be measured in the
time domain. Display lines delimit the evaluation area, thus
making it possible to determine the power during the 147
useful bits of a GSM burst, for example.
Occupied bandwidth (OBW)
OBW is a measure of the bandwidth occupied by the sig-
nal. The R&S®FSL determines the bandwidth containing,
for example, 99 % of the signal power from the total power
within the span. The points from the right and left edge
of the trace are summed up until 1 % of the power is
reached. The remaining power then corresponds to 99 %
of the power and the distance between the two frequency
markers is the occupied bandwidth, which is displayed in
the marker field. The fully synchronous frequency sweep
and the high number of trace points make this measure-
ment very precise.
Spectrogram measurements
The R&S®FSL-K14 option adds a spectrogram display and
trace recording to the R&S®FSL. The spectrogram view
shows a history of the spectrum and helps to analyze in-
termittent problems or variations in frequency and level
versus time. It also adds a new trigger, i.e. a time trigger
that makes it possible to record a trace at a regular time
interval.
❙❙ Recording of up to 20 000 traces: approx. 5.5 h
continuous monitoring with repetition interval set at 1 s
❙❙ Time trigger, repetition interval 100 ms to 5000 s:
allows unattended continuous monitoring
❙❙ Scrolling through recorded traces with markers:
replay and repeatedly analyze the recorded data
Rohde & Schwarz R&S®FSL Spectrum Analyzer 13
FSL_bro_en_0758_2790_12.indd 13 08.07.2013 10:02:46
14. Display and evaluation capabilities
❙❙ Modulation signal versus time
❙❙ Spectrum of modulation signal (FFT)
❙❙ RF signal power versus time
❙❙ Spectrum of RF signal (FFT versus max. 18 MHz)
❙❙ Table with numeric display of
■■
Deviation or modulation depth,
+Peak, –Peak, ± Peak/2 and RMS weighted
■■
Modulation frequency
■■
Carrier frequency offset
■■
Carrier power
■■
Total harmonic distortion (THD) and SINAD
Condensed data
Demodulation bandwidth 100 Hz to 18 MHz
Recording time (depends on
demodulation bandwidth)
12.5 ms to 3276 s
AF filters
Highpass filter 50 Hz, 300 Hz
Lowpass filter 3 kHz, 15 kHz, 150 kHz and 5 %,
10 % or 25 % of demodulation
bandwidth
Deemphasis 25/50/75/750 µs
Modulation frequency < 5 MHz, max. 0.5 × demodulation
bandwidth
Measurement uncertainty
(deviation or modulation depth)
3 %
R&S®FSL-K7 option
AM/FM/φM
measurement
demodulator
The R&S®FSL-K7 AM/FM/φM measurement
demodulator converts the R&S®FSL into an analog
modulation analyzer for amplitude-, frequency- or
phase-modulated signals. It measures not only char-
acteristics of the useful modulation, but also factors
such as residual FM or synchronous modulation.
THD measurement on an amplitude-modulated signal: The first harmonic
of the modulation signal is well suppressed by 69 dB. This corresponds to
a THD (D2) of less than 0.1 %.
Frequency deviation measurement: display of modulation signal together
with peak and RMS deviation, carrier frequency offset and carrier power.
14
FSL_bro_en_0758_2790_12.indd 14 08.07.2013 10:02:47
15. All measurements are carried out in line with the
Bluetooth® RF Test Specification (Bluetooth® SIG)
Rev. 2.0+EDR and cover basic rate as well as EDR.
Integrated limit value monitoring is provided for all
measurements and allows analysis of the results in the
development and production of Bluetooth® modules.
R&S®FSL-K8 option
Transmitter
measurements for
Bluetooth®
V2.0
and EDR
Adjacent channel power (ACP): This measurement determines the power
of all adjacent channels. The power of up to 79 channels in total can be
measured. For EDR inband spurious, the measurement can be gated.
Modulation characteristics: This measurement determines the maximum
frequency deviation of all 8-bit test sequences of the payload. In addition, the
average value of the maximum frequency deviations per packet is calculated
and displayed.
Relative transmit power: The EDR relative transmit power determines
the power of the GFSK-modulated and the DPSK-modulated part and the
power difference.
The R&S®FSL-K8 application firmware enhances
the range of applications of the R&S®FSL spectrum
analyzer to include measurements on Bluetooth®
transmitters.
Bluetooth® measurements
Basic rate measurements
Output power
ACP over up to 79 channels
Modulation characteristics
Initial carrier frequency tolerance
Carrier frequency drift
EDR measurements
Output power and relative transmit power
Inband spurious emissions, gated
Carrier frequency stability and modulation accuracy (DEVM)
Differential phase encoding
Rohde & Schwarz R&S®FSL Spectrum Analyzer 15
FSL_bro_en_0758_2790_12.indd 15 08.07.2013 10:02:47
16. TV standards
Selectable analog TV standards Selectable digital cable TV
standards
B/G, D/K, I, K1, L, M, N QAM J.83/A (EU), J.83/B (US),
J.83/C (Japan)
PAL, NTSC, SECAM 4QAM to 1024QAM
Symbol rate: 0.1 Msymbol/s to
7.15 Msymbol/s
Measurements
Analog TV Digital TV
Carrier levels
(picture and sound carriers)
Channel power
C/N
(in-service, off-service, quiet line)
Modulation parameters and errors:
carrier frequency offset, symbol
frequency offset, MER, EVM,
phase jitter, carrier suppression,
quadrature offset, imbalance
CTB (composite triple beat) and
CSO (composite second order),
off-service or during quiet line
Constellation diagram
Vision modulation Echo pattern
Hum Signal statistics/CCDF, APD
Video scope function for detailed
line analysis
Tilt: determines the frequency
response of the cable TV network
by measuring the channel power of
every channel
R&S®FSL-K20 option
Analog and
digital cable TV
measurements
The R&S®FSL-K20 CATV option provides easy-to-use
push-button measurements for analog and digital ca-
ble TV networks as well as for analog TV transmitters.
Channel tables
Channel tables make it possible to preconfigure the
R&S®FSL for a specific network:
❙❙ Channel numbers can be assigned to frequencies
❙❙ The signal type for each channel can be defined (analog
TV signal, digital TV signal) as well as even more detailed
properties such as the position of test lines
The R&S®FSL is set up correctly just by entering the
channel number. Channel tables can be easily copied and
multiplied between different instruments.
Video scope function (video line analysis) and
vision modulation
A dedicated video line trigger allows selected lines of the
video signals to be displayed for detailed analysis. The
vision modulation measurement further determines the
modulation depth and residual picture carrier level.
Digital TV signals
A table provides a quick overview of the most important
modulation quality parameters such as MER, EVM (both
peak and RMS), carrier frequency offset and symbol fre-
quency offset.
Typical I/Q modulator impairments such as quadrature
offset or gain imbalance can be evaluated from the modu-
lation error table (see picture). A constellation diagram en-
ables further analysis of faults and their cause.
16
FSL_bro_en_0758_2790_12.indd 16 08.07.2013 10:02:48
17. The following parameters can be measured at a specified
frequency or in a selectable frequency range:
❙❙ Noise figure in dB
❙❙ Noise temperature in K
❙❙ Gain in dB
Compared with conventional noise measurement sys-
tems, R&S®FSL-K30 has the advantage that a wide vari-
ety of further RF measurements can also be performed.
The R&S®FSL also allows the measurement of harmonics,
intermodulation, spurious responses and many other RF-
relevant criteria (for measurements on amplifiers and on
frequency-converting DUTs, e.g. low-noise converters).
Noise measurements
❙❙ Measurement range 0 dB to 35 dB
❙❙ Resolution 0.01 dB
❙❙ Measurement accuracy ±0.3 dB (measurement with
external preamplifier (gain 30 dB, noise figure <5 dB) and
1 MHz resolution bandwidth, valid for DUTs with noise
figure 1 dB to 10 dB and gain >10 dB)
Gain measurements
❙❙ Measurement range 0 dB to 60 dB
❙❙ Resolution 0.01 dB
❙❙ Measurement accuracy ±0.2 dB (measurement with
preamplifier (gain 30 dB, noise figure <5 dB) and 1 MHz
resolution bandwidth)
Required hardware
❙❙ R&S®FSL-B5 noise source power supply
(via 28 V connector on the R&S®FSL rear panel)
❙❙ Noise source, e.g. NoiseCom NC346
❙❙ External preamplifier (for improved accuracy and
repeatability of measurements)
R&S®FSL-K30 option
Noise figure and
gain measurements
Measurements on an amplifier.Tabular representation of measurement results.
Test setup (schematics).
The R&S®FSL-K30 application firmware provides the
R&S®FSL spectrum analyzer with features other-
wise only provided by special noise measurement
analyzers.
Rohde & Schwarz R&S®FSL Spectrum Analyzer 17
FSL_bro_en_0758_2790_12.indd 17 08.07.2013 10:02:48
18. The R&S® FSL is the ideal tool for CDMA2000® base sta-
tion transmitter measurements in service and production.
The main application is the determination of the power
in the individual code channels referred to as code do-
main power measurement. The power ratios between
the individual channels, for example, can be checked for
compliance with the nominal values. Moreover, this mea-
surement is a very efficient tool for detecting transmitter
impairments such as clipping or intermodulation that are
not obvious from the spectrum alone.
Equipped with the R&S®FSL-K82/-K84, the R&S®FSL pro-
vides the functionality needed for base station testing as
well as the related parameters:
❙❙ Code domain power (code domain analyzer)
❙❙ Code domain power versus time (R&S®FSL-K82)
❙❙ Power versus chip (R&S®FSL-K84)
❙❙ Rho
❙❙ Error vector magnitude (EVM)
❙❙ Peak code domain error
❙❙ Power versus symbol
❙❙ Symbol constellation
❙❙ Channel table
❙❙ Code domain error power
For 1xEV-DO, the rho measurement is subdivided into sev-
eral new measurements due to the time division structure:
❙❙ RhoMAC
❙❙ Rhodata
❙❙ Rhopilot
❙❙ Rhooverall-1
❙❙ Rhooverall-2
R&S®FSL-K82/-K84
options
CDMA2000®/
1xEV-DO transmitter
measurements
The code domain power measurement displays the active and inactive
channels in bit-reversed order. The result summary provides a quick over-
view of the main parameters of the signal at a glance, e.g. total power,
channel power, rho and EVM.
The upper part of the screen shows an overview of the detected channels
and a number of parameters such as power and timing offset. The lower
part shows the composite constellation diagram of the signal.
The R&S®FSL-K82 application firmware enhances
the application range of the R&S®FSL spectrum
analyzer to include code domain power and modu-
lation measurements on CDMA2000® signals for
radio configurations 1 to 5 and 10. The R&S®FSL-K84
application firmware adds capability for the analysis
of 1xEV-DO signals.
18
FSL_bro_en_0758_2790_12.indd 18 08.07.2013 10:02:48
19. R&S®FSL-K91/-K91n
options
WLAN transmitter
measurements
The excellent price/performance ratio, the compact
size and the capability to be remote-controlled make
the R&S®FSL an ideal WLAN tester in production. The
R&S®FSL’s analysis and evaluation capabilities, which en-
able measurements beyond the scope of the standard,
make it indispensable for applications in development
and troubleshooting. Functions, operation and remote
control commands are essentially identical to those of
the R&S®FSQ signal and spectrum analyzer with the
R&S®FSQ-K91/-K91n option.
Measurement
❙❙ Output power
❙❙ Spectrum mask with limit lines and pass/fail indication
❙❙ Adjacent channel power
❙❙ Burst rise and fall times
❙❙ EVM
❙❙ EVM versus carrier or time
❙❙ Constellation diagram (for specific or all carriers)
❙❙ Constellation overview
❙❙ Selectable tracking: phase, level, timing
❙❙ RF carrier leakage
❙❙ Carrier frequency and symbol clock error
❙❙ CCDF and crest factor
❙❙ Bit stream
❙❙ Header information
❙❙ Automatic modulation selection
Setup tables provide a quick overview of the selected settings and quick
access to the setting parameters.
The result summary provides a quick overview of the most important
measurement values.
OFDM allows the constellation diagram to be displayed for all or for
selected carriers.
The R&S®FSL-K91 WLAN application firmware
expands the application range of the R&S®FSL
spectrum analyzer by spectrum and modulation
measurements on signals in line with the WLAN
IEEE 802.11a/b/g/j standards. The R&S®FSL-K91n
application firmware adds capability to analyze
20 MHz signals in line with IEEE 802.11n.
Rohde & Schwarz R&S®FSL Spectrum Analyzer 19
FSL_bro_en_0758_2790_12.indd 19 08.07.2013 10:02:49
20. PC for controlling
the ¸FSL¸FSL
Server Ethernet
network
Printer
Versatile documentation and networking
capabilities
The Windows® XP Embedded operating system coupled
with a wide variety of interfaces makes it easy to insert
measurement results into documentation. Simply save the
screen contents as a BMP or WMF file and import the file
into your word processing system. To process trace data,
save it as an ASCII file (CSV format), together with the
main instrument settings.
Make use of the advantages offered by
networking
The standard LAN interface opens up versatile networking
capabilities:
❙ Link to standard network (Ethernet 10/100BaseT)
❙ Running under Windows® XP Embedded, the R&S®FSL
can be configured for network operation. Applications
such as data output to a central network printer or saving
results on a central server can easily be implemented.
The R&S®FSL can thus be optimally matched to any work
environment
❙ You can import screen contents directly into Word
for Windows® or, by using an Excel macro, into your
documentation programs and thus immediately create
data sheets for your products or documents for quality
assurance
❙ The R&S®FSL is LXI class C compliant. LXI is the LAN-
based successor to the IEC/IEEE bus, combining the
advantages of Ethernet with the simplicity and familiarity
of the IEC/IEEE bus. LXI instruments use the VXI11
protocol for remote control, which is supported by all
VISA implementations. The common LAN configuration
of LXI instruments makes integration into a network easy
The standard USB host interface allows functions such as
the following:
❙ Quick firmware update from a USB flash memory stick or
a USB CD-ROM drive
❙ Connection of PC peripheral devices (mouse, keyboard)
❙ Simple file transfer, including large volumes of data via a
USB flash memory stick
Benefit from the
advantages of
networking
20
The R&S®FSL in a network
FSL_bro_en_0758_2790_12.indd 20 08.07.2013 10:02:49
21. Specifications in brief
R&S®FSL3,
model .03
R&S®FSL3,
model .13
R&S®FSL6,
model .06
R&S®FSL6,
model .16
R&S®FSL18
model .18
R&S®FSL18
model .28
Frequency range 9 kHz to 3 GHz 9 kHz to 3 GHz 9 kHz to 6 GHz 9 kHz to 6 GHz 9 kHz to 18 GHz (overrange 20 GHz)
Frequency accuracy 1 × 10⁻⁶
With R&S®FSL-B4, OCXO 1 × 10⁻⁷
standard with the R&S®FSL18
Resolution bandwidths
Standard 300 Hz to 10 MHz in 1/3 sequence, zero span additionally 20 MHz
With R&S®FSL-B7 10 Hz to 10 MHz in 1/3 sequence, additionally 1 Hz (FFT filter)
Video bandwidths 10 Hz to 10 MHz
Signal analysis bandwidth 28 MHz
Phase noise typ. –103 dBc (1 Hz) at 10 kHz from carrier, 1 GHz
Displayed average noise level (DANL)
With 300 Hz RBW typ. –117 dBm
With 1 Hz FFT RBW and
preamplifier (R&S®FSL-B7,
R&S®FSL-B22 options)
500 MHz: typ. –162 dBm
3 GHz: typ. –158 dBm
Third order intercept (TOI) typ. +18 dBm
Detectors pos/neg peak, auto peak, RMS, quasi-peak, average, sample
Level measurement uncertainty < 0.5 dB (30 kHz ≤ f ≤ 3 GHz), < 0.8 dB (3 GHz < f ≤ 6 GHz), < 1.2 dB (6 GHz < f ≤ 18 GHz)
Tracking generator no yes no yes no yes
Frequency range – 1 MHz to 3 GHz – 1 MHz to 6 GHz – 10 MHz to 18 GHz
Output level – –20 dBm to 0 dBm – –20 dBm to 0 dBm – –30 dBm to –10 dBm
Rohde & Schwarz R&S®FSL Spectrum Analyzer 21
FSL_bro_en_0758_2790_12.indd 21 08.07.2013 10:02:49
22. Ordering information
Designation Type Order No.
Spectrum Analyzer, 9 kHz to 3 GHz R&S®FSL3 1300.2502.03
Spectrum Analyzer, 9 kHz to 3 GHz, with tracking generator R&S®FSL3 1300.2502.13
Spectrum Analyzer, 9 kHz to 6 GHz R&S®FSL6 1300.2502.06
Spectrum Analyzer, 9 kHz to 6 GHz, with tracking generator R&S®FSL6 1300.2502.16
Spectrum Analyzer, 9 kHz to 18 GHz (overrange 20 GHz) R&S®FSL18 1300.2502.18
Spectrum Analyzer, 9 kHz to 18 GHz, with tracking generator R&S®FSL18 1300.2502.28
Options
Designation Type Order No. Comments
OCXO Reference Frequency, aging 1 × 10⁻⁷
/year R&S®FSL-B4 1300.6008.02 standard with the R&S®FSL18
Additional Interfaces R&S®FSL-B5 1300.6108.02 video out, IF out, noise source
control, AUX port, connector for
R&S®NRP-Zxx power sensors
TV Trigger R&S®FSL-B6 1300.5901.02
Narrow Resolution Filters R&S®FSL-B7 1300.5601.02
Gated Sweep R&S®FSL-B8 1300.5701.02
GPIB Interface R&S®FSL-B10 1300.6208.02
RF Preamplifier (3/6 GHz) R&S®FSL-B22 1300.5953.02
DC Power Supply, 12 V to 28 V R&S®FSL-B30 1300.6308.02
NiMH Battery Pack R&S®FSL-B31 1300.6408.02 requires R&S®FSL-B30
Firmware/options
AM/FM/φM Measurement Demodulator R&S®FSL-K7 1300.9246.02
Transmitter Measurements for Bluetooth® V2.0 and EDR R&S®FSL-K8 1301.9398.02
Power Sensor Support R&S®FSL-K9 1301.9530.02 requires R&S®FSL-B5 or
R&S®NRP-Z3/4 and R&S®NRP-Zxx
power sensor
Spectrogram Measurements R&S®FSL-K14 1302.0913.02
Cable TV Measurements R&S®FSL-K20 1301.9675.02
Application Firmware for Noise Figure and Gain Measurements R&S®FSL-K30 1301.9817.02 requires R&S®FSL-B5 and
preamplifier
3GPP FDD BTS Application Firmware R&S®FSL-K72 1302.0620.02 see separate brochure
CDMA2000® Base Station Analysis R&S®FSL-K82 1302.7803.02
1xEV-DO Base Station Analysis R&S®FSL-K84 1302.0159.02
WLAN Transmitter Measurements for IEEE 802.11a, b, g, j R&S®FSL-K91 1302.0094.02
Upgrade of R&S®FSL-K91 to IEEE 802.11n R&S®FSL-K91n 1308.7903.02
WiMAX™ IEEE 802.16 OFDM Application Firmware R&S®FSL-K92 1302.0236.02 see separate brochure
WiMAX™ IEEE 802.16 OFDM/OFDMA Application Firmware R&S®FSL-K93 1302.0736.02 see separate brochure
Upgrade from R&S®FSL-K92 to R&S®FSL-K93 R&S®FSL-K92U 1302.0307.02 see separate brochure
The Bluetooth® word mark and logos are owned by the Bluetooth SIG, Inc. and any use of such marks by Rohde & Schwarz is under license.
CDMA2000® is a registered trademark of the Telecommunications Industry Association (TIA-USA).
“WiMAX Forum“ is a registered trademark of the WiMAX Forum. “WiMAX,“ the WiMAX Forum logo, “WiMAX Forum Certified,“ and the WiMAX Forum Certified logo are
trademarks of the WiMAX Forum.
22
FSL_bro_en_0758_2790_12.indd 22 08.07.2013 10:02:50
23. Recommended extras
Designation Type Order No.
19" Rackmount Adapter R&S®ZZA-S334 1109.4487.00
Soft Carrying Bag R&S®FSL-Z3 1300.5401.00
Protective Hard Cover R&S®EVS-Z6 5201.7760.00
Additional Charger Unit R&S®FSL-Z4 1300.5430.02
Matching Pad 75 Ω, L section R&S®RAM 0358.5414.02
Matching Pad 75 Ω, series resistor 25 Ω R&S®RAZ 0358.5714.02
Matching Pad 75 Ω, L section, N to BNC R&S®FSH-Z38 1300.7740.02
SWR Bridge, 5 MHz to 3 GHz R&S®ZRB 2 0373.9017.52
SWR Bridge, 40 kHz to 4 GHz R&S®ZRC 1039.9492.52
SWR Bridge, 10 MHz to 3 GHz
(incl. Open, Short, Load calibration standards)
R&S®FSH-Z2 1145.5767.02
Power sensors supported by R&S®FSL-K9
Designation Type Order No.
Average Power Sensor, 10 MHz to 8 GHz, 200 mW R&S®NRP-Z11 1138.3004.02
Average Power Sensor, 10 MHz to 18 GHz, 200 mW R&S®NRP-Z21 1137.6000.02
Average Power Sensor, 10 MHz to 18 GHz, 2 W R&S®NRP-Z22 1137.7506.02
Average Power Sensor, 10 MHz to 18 GHz, 15 W R&S®NRP-Z23 1137.8002.02
Average Power Sensor, 10 MHz to 18 GHz, 30 W R&S®NRP-Z24 1137.8502.02
Average Power Sensor, 9 kHz to 6 GHz, 200 mW R&S®NRP-Z91 1168.8004.02
Thermal Power Sensor, 0 Hz to 18 GHz, 100 mW R&S®NRP-Z51 1138.0005.02
Thermal Power Sensor, 0 Hz to 40 GHz, 100 mW R&S®NRP-Z55 1138.2008.02
Rohde & Schwarz R&S®FSL Spectrum Analyzer 23
FSL_bro_en_0758_2790_12.indd 23 08.07.2013 10:02:50