
Download as PDF, PPTX


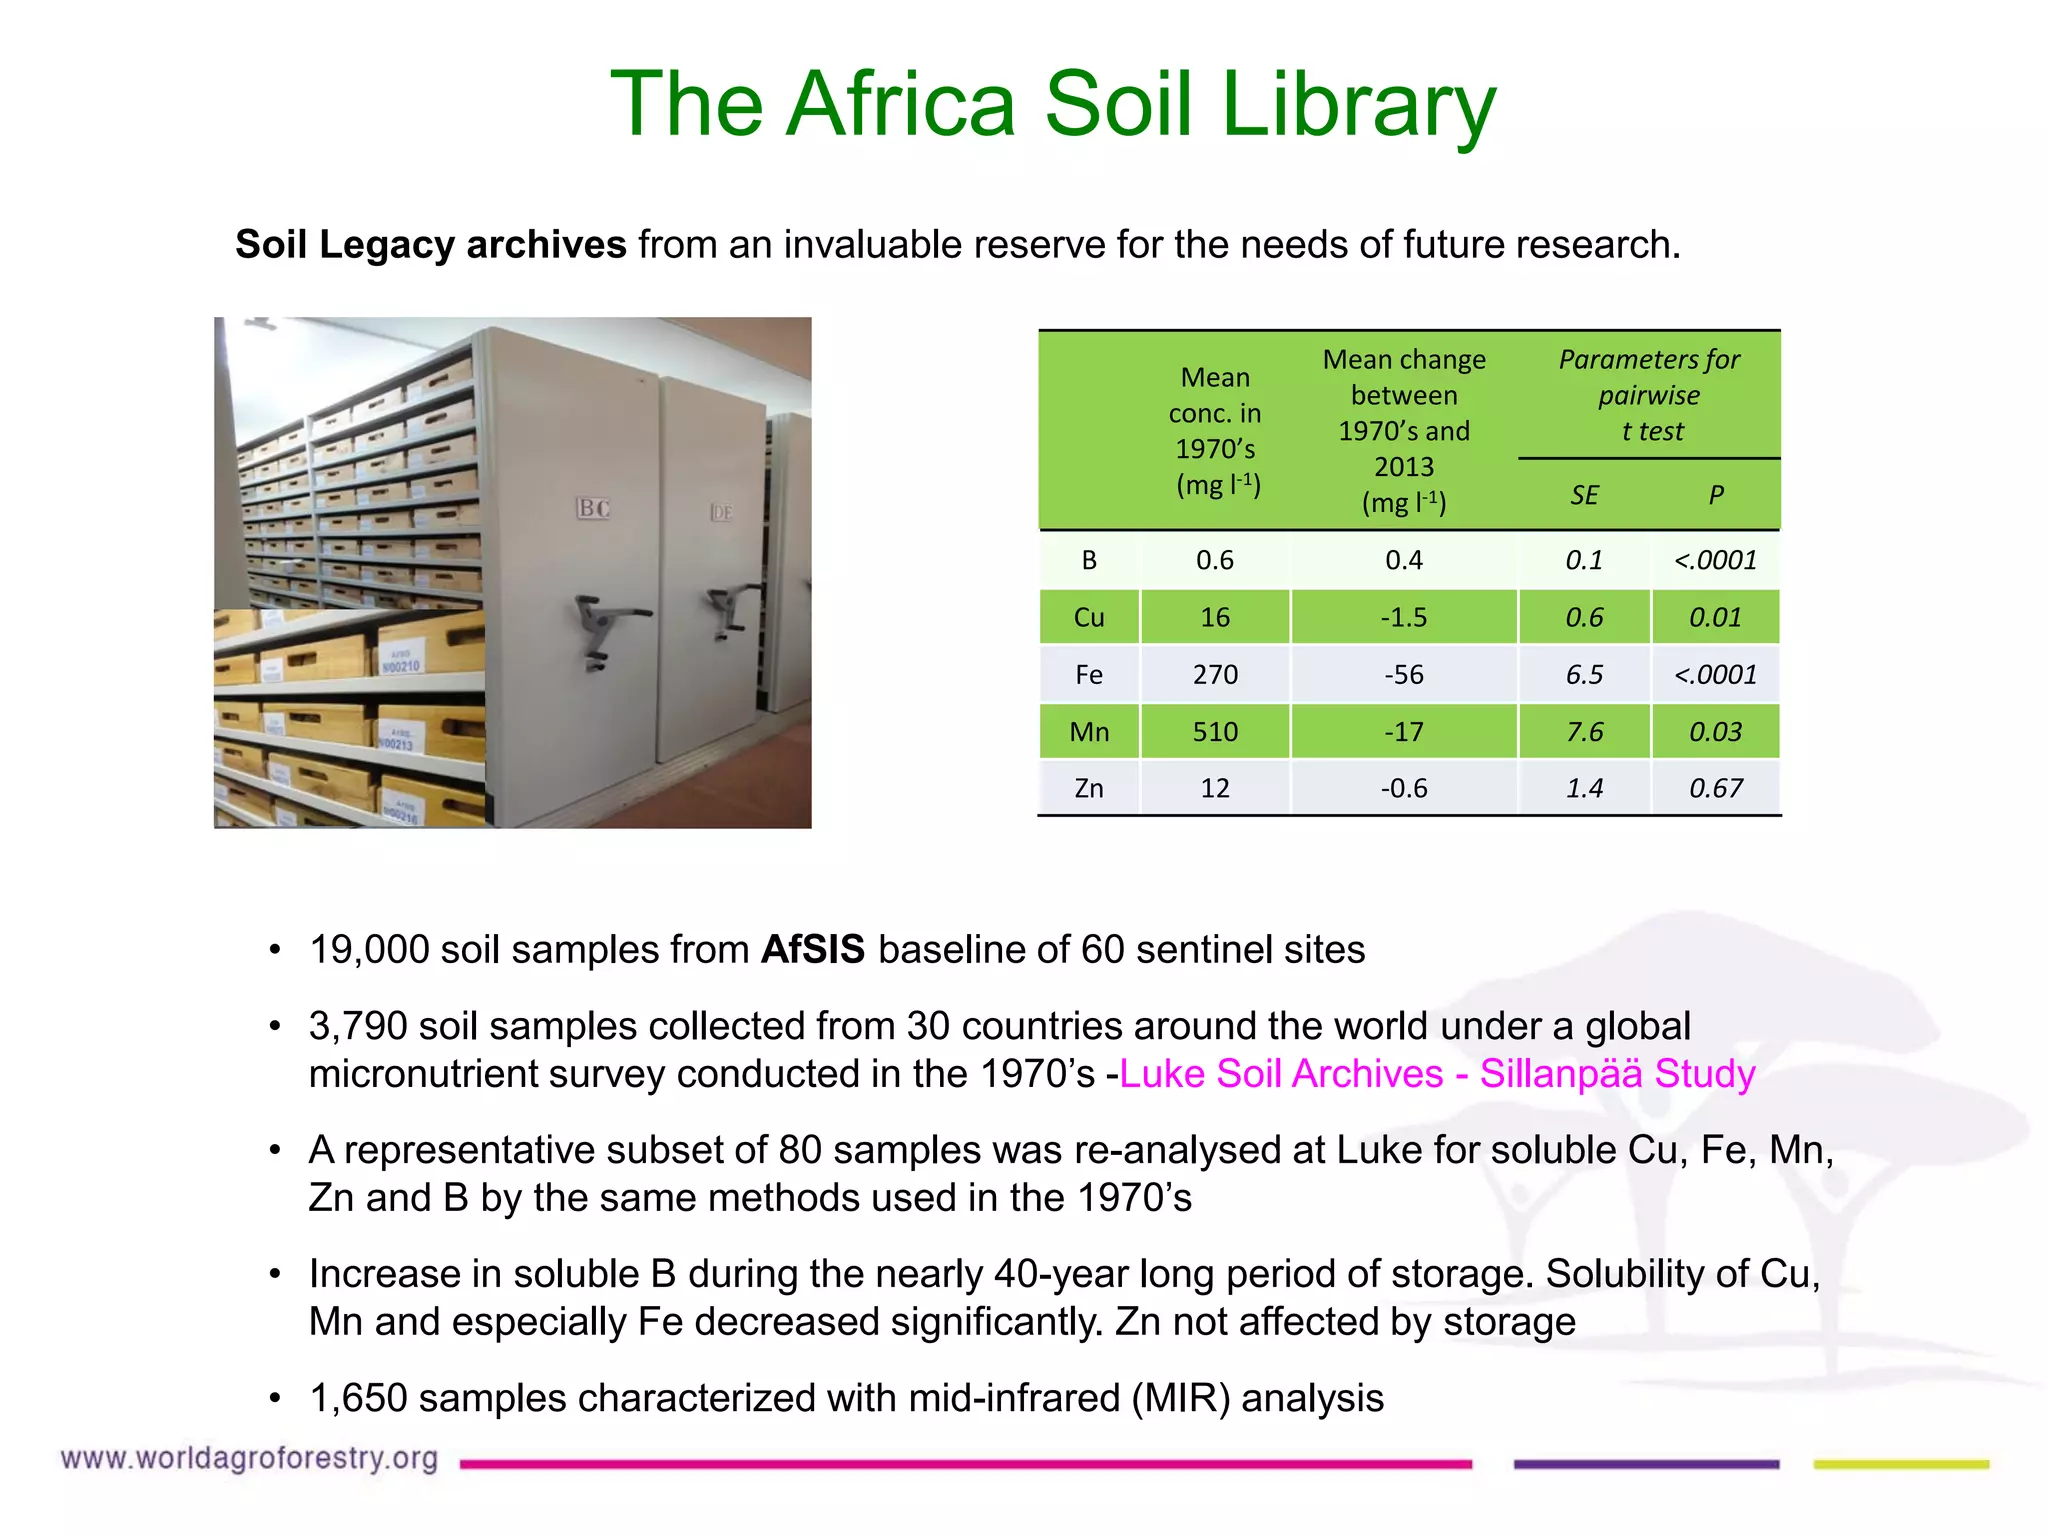


The document outlines initiatives to improve food security in West and East Africa by addressing soil micronutrient deficiencies and enhancing agricultural capacity through research and information dissemination. It highlights the significance of micronutrient availability for plant, animal, and human nutrition, and emphasizes the need for rapid and efficient soil testing methodologies in Sub-Saharan Africa. The objectives include developing diagnostic techniques, establishing soil micronutrient baselines, and strengthening local expertise to enhance agricultural practices and outputs.


