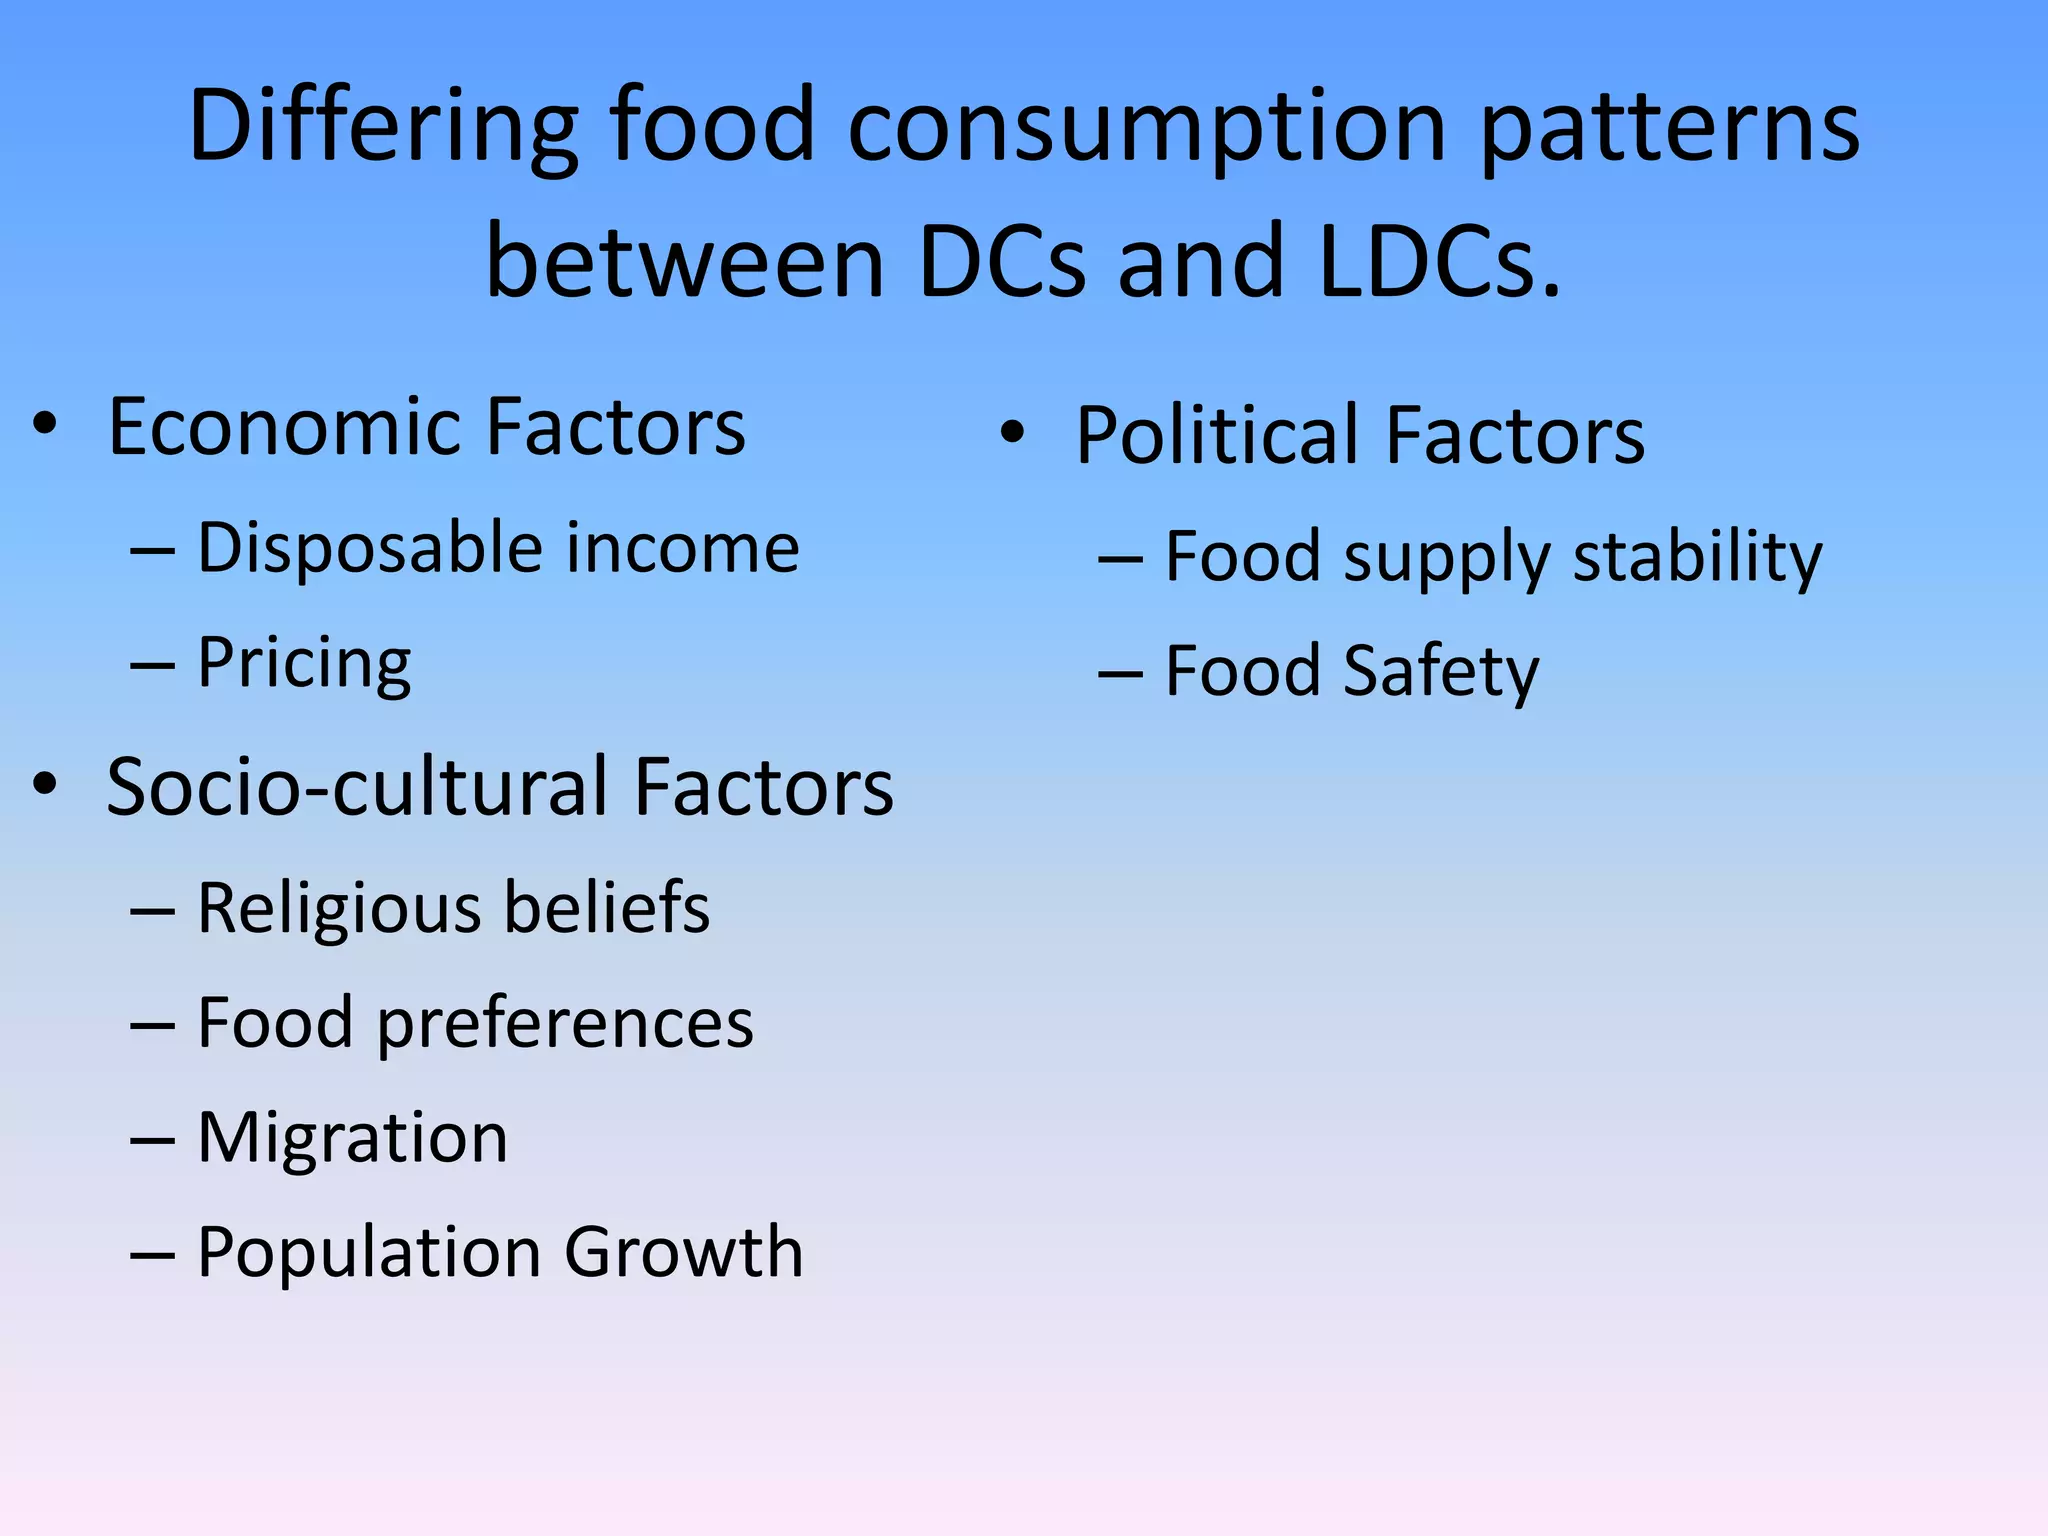
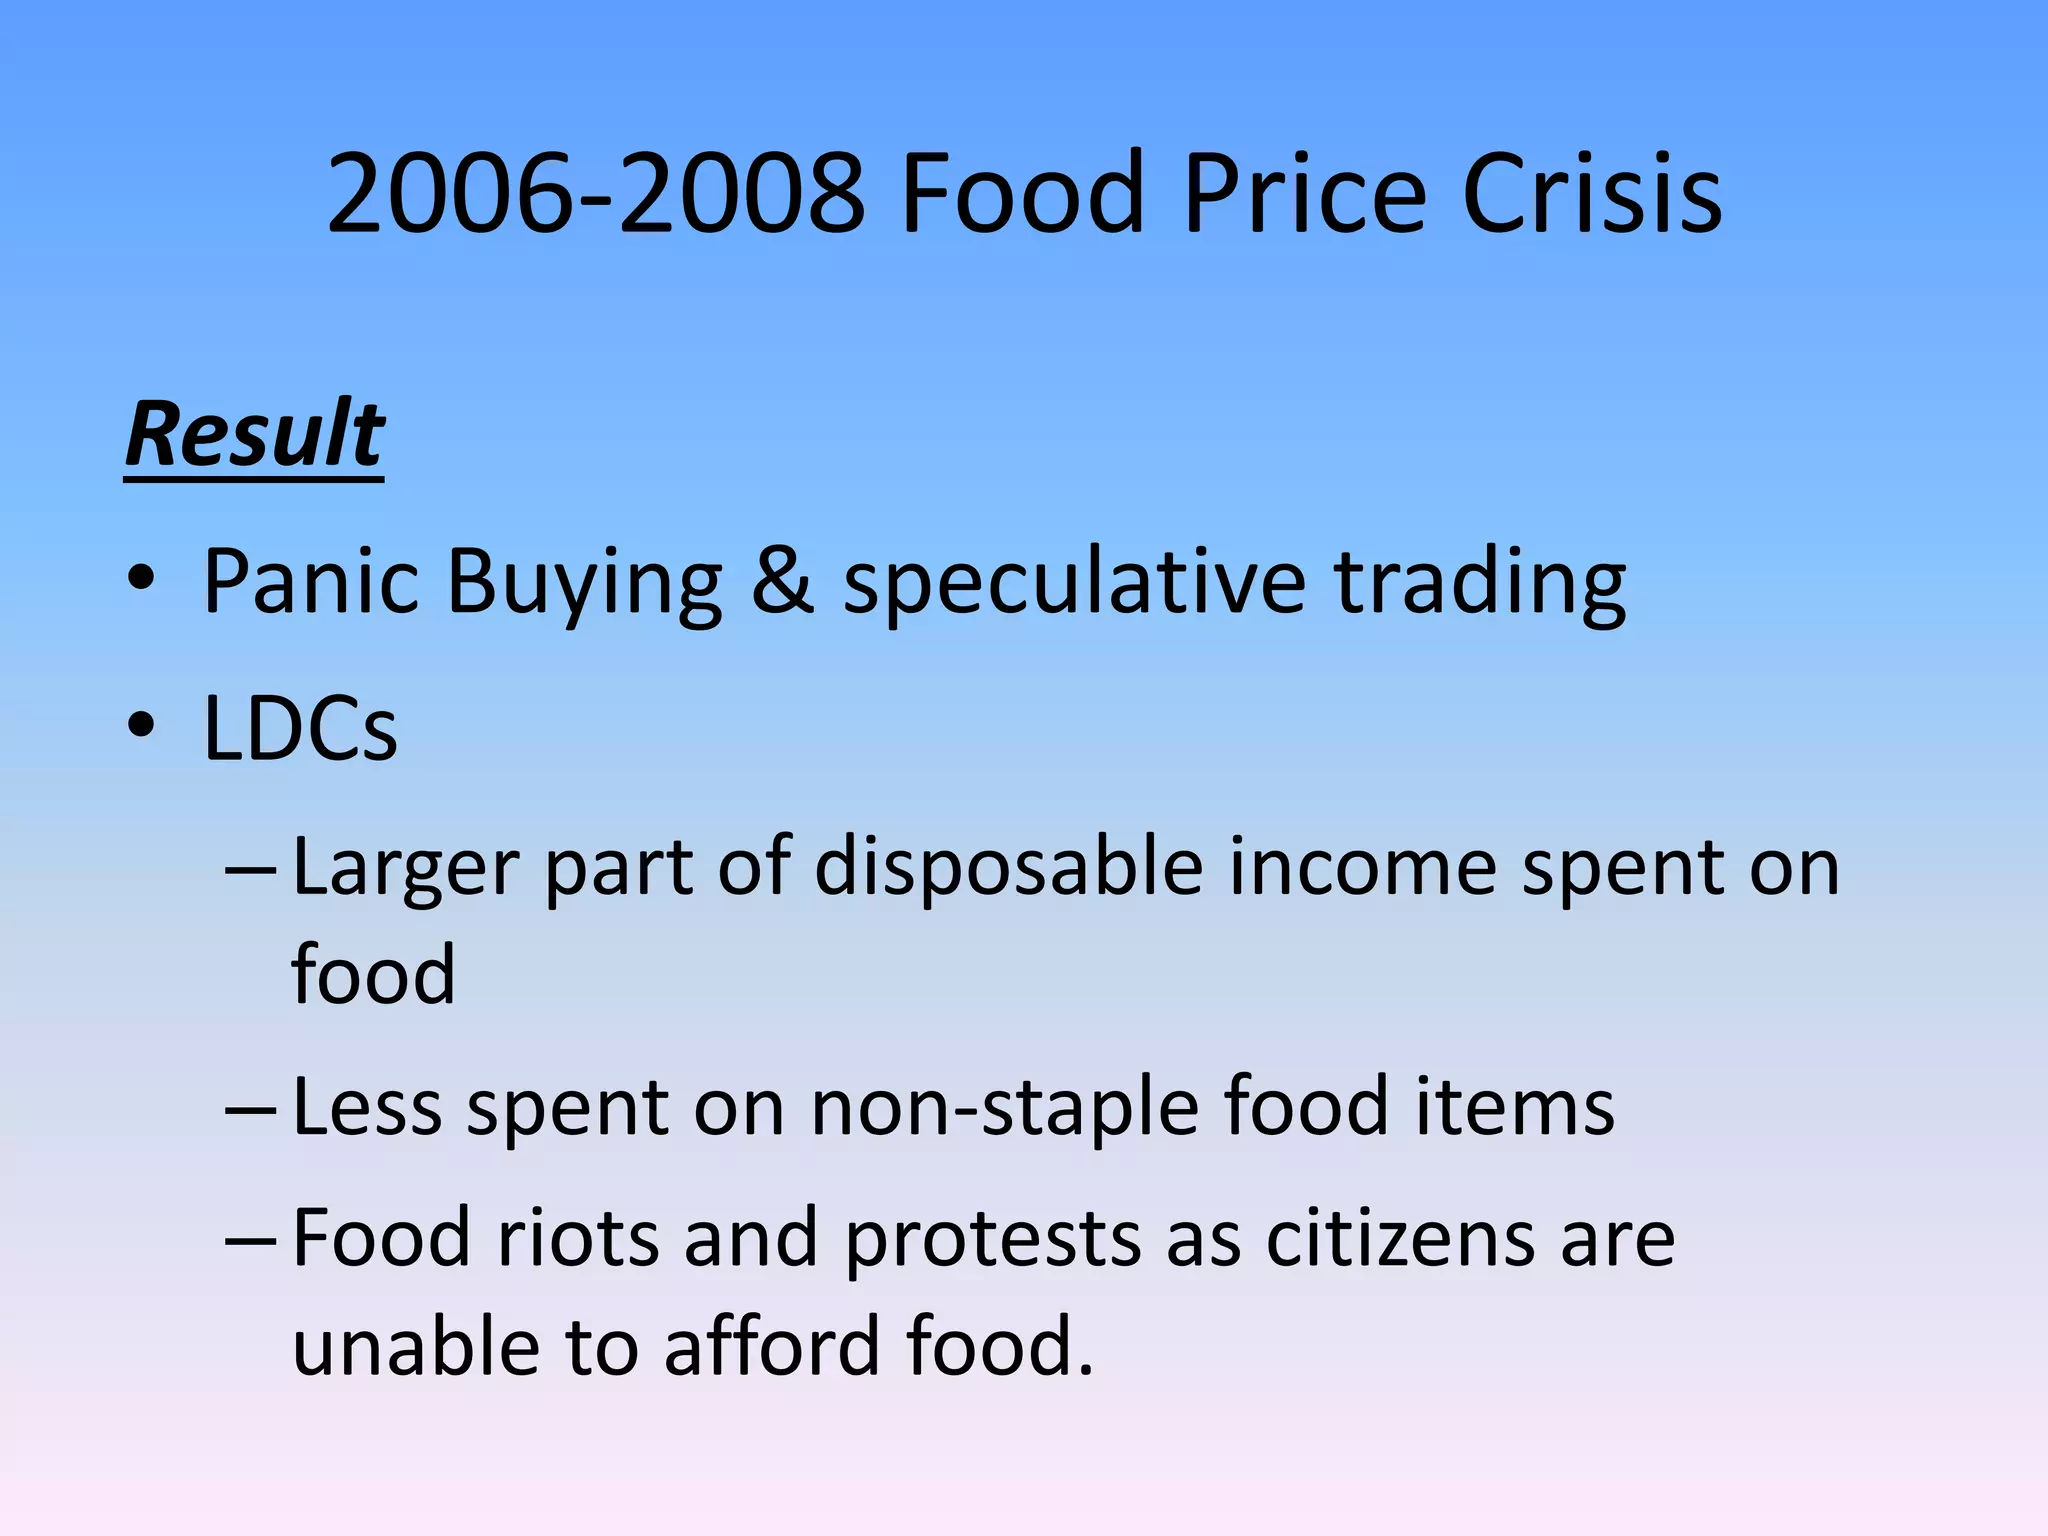
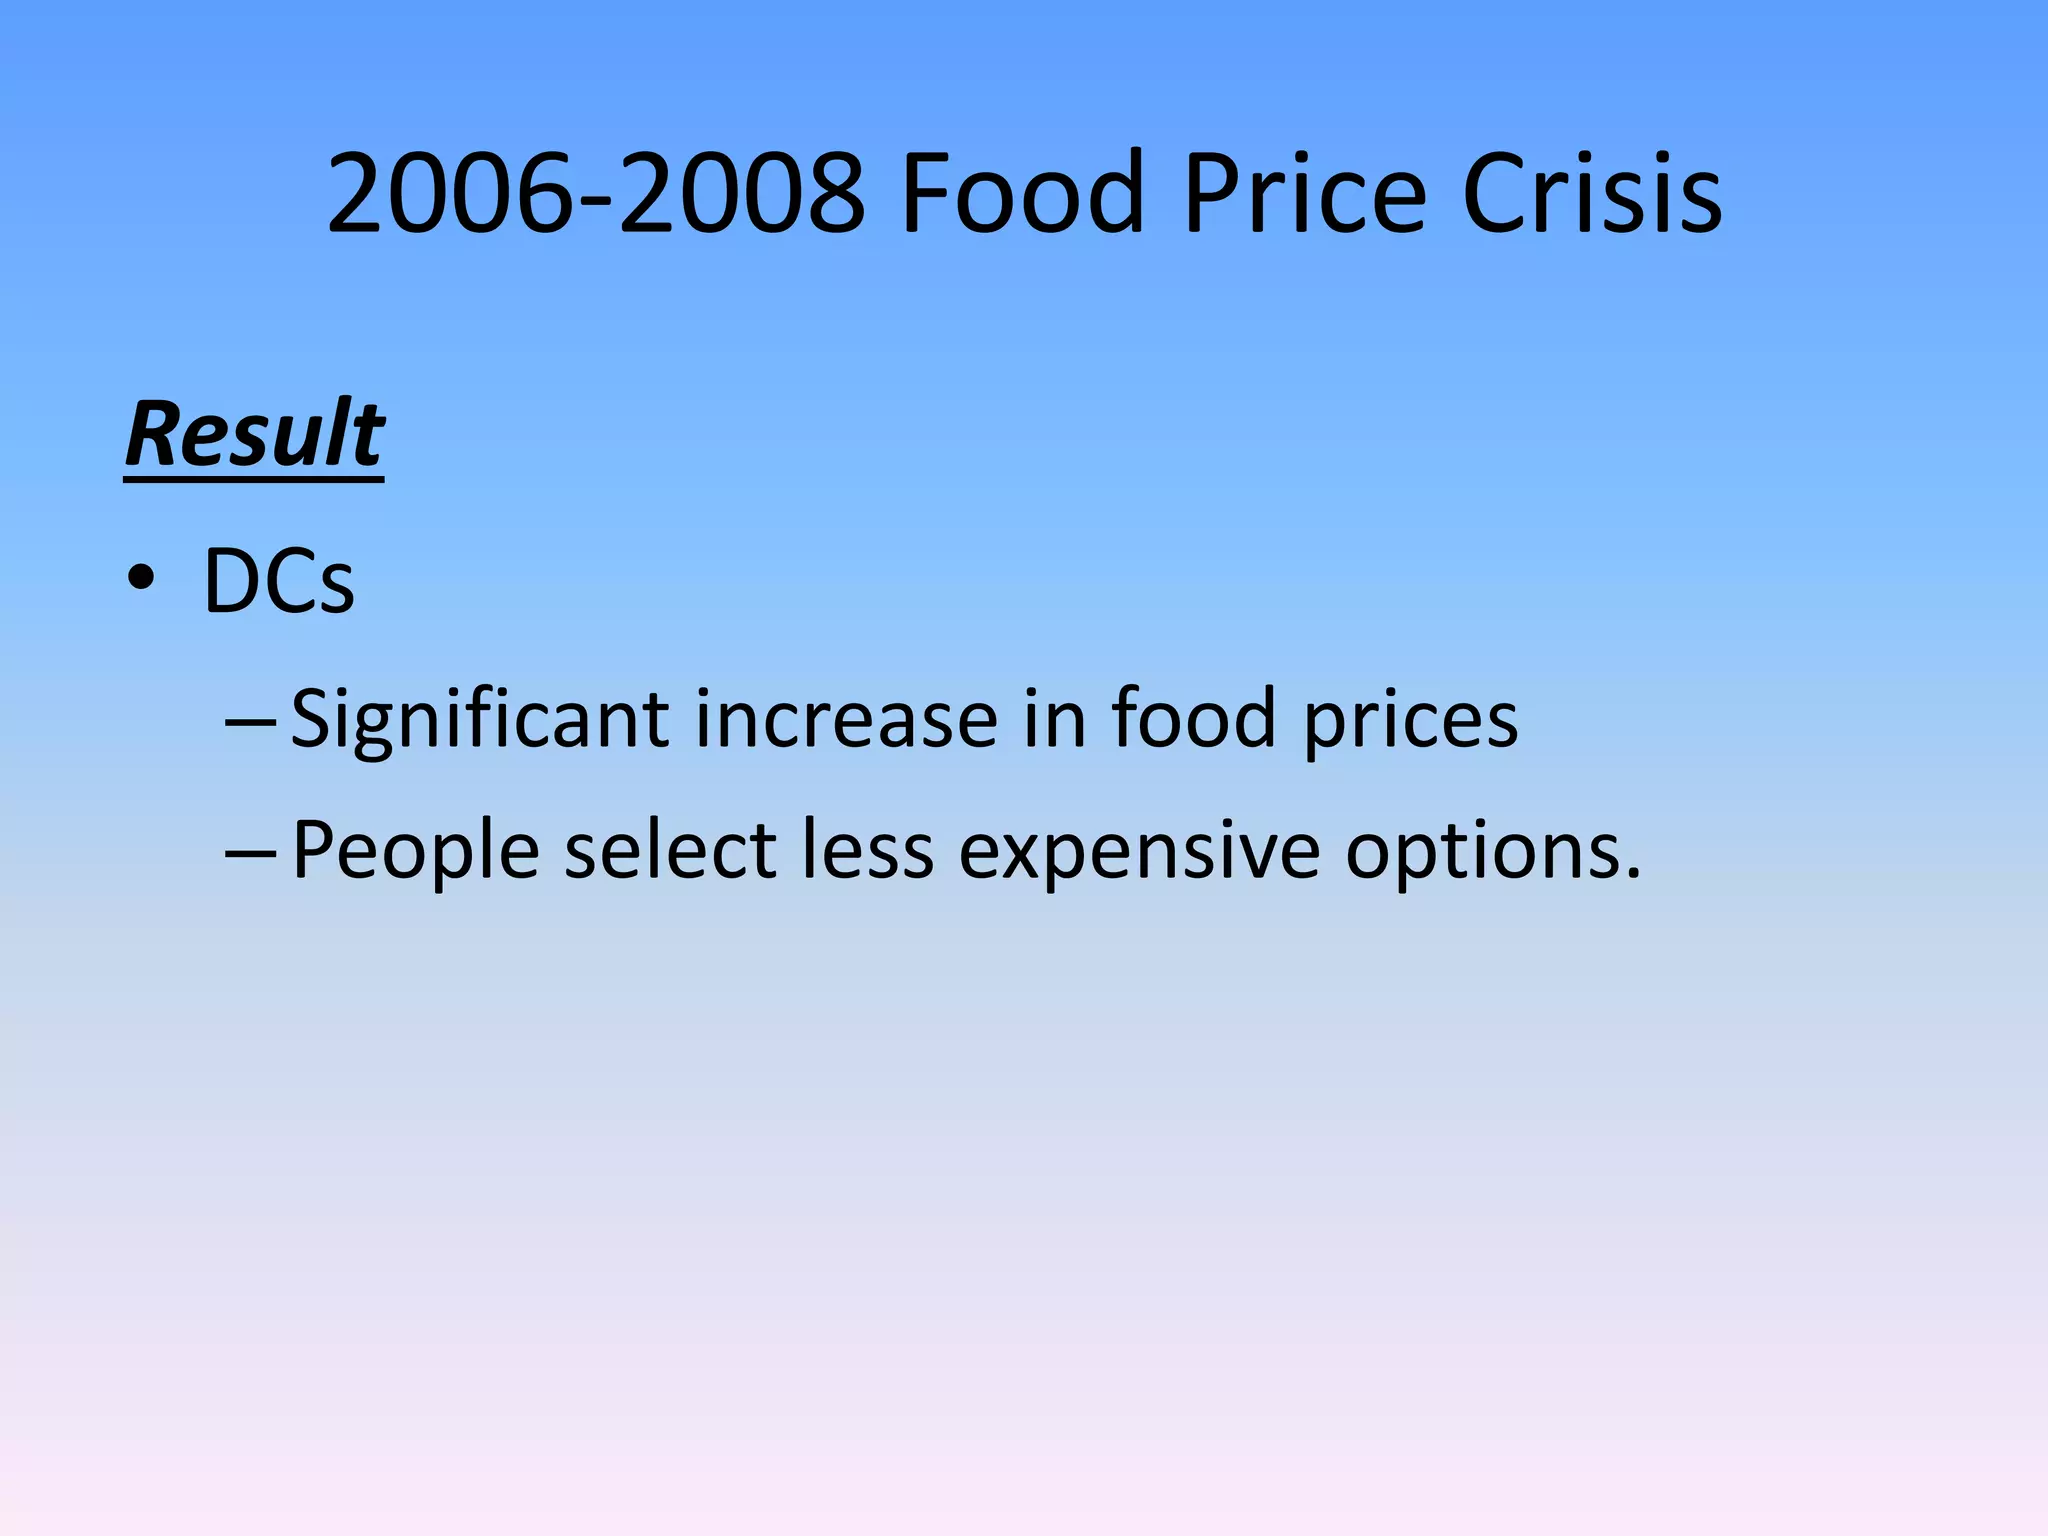
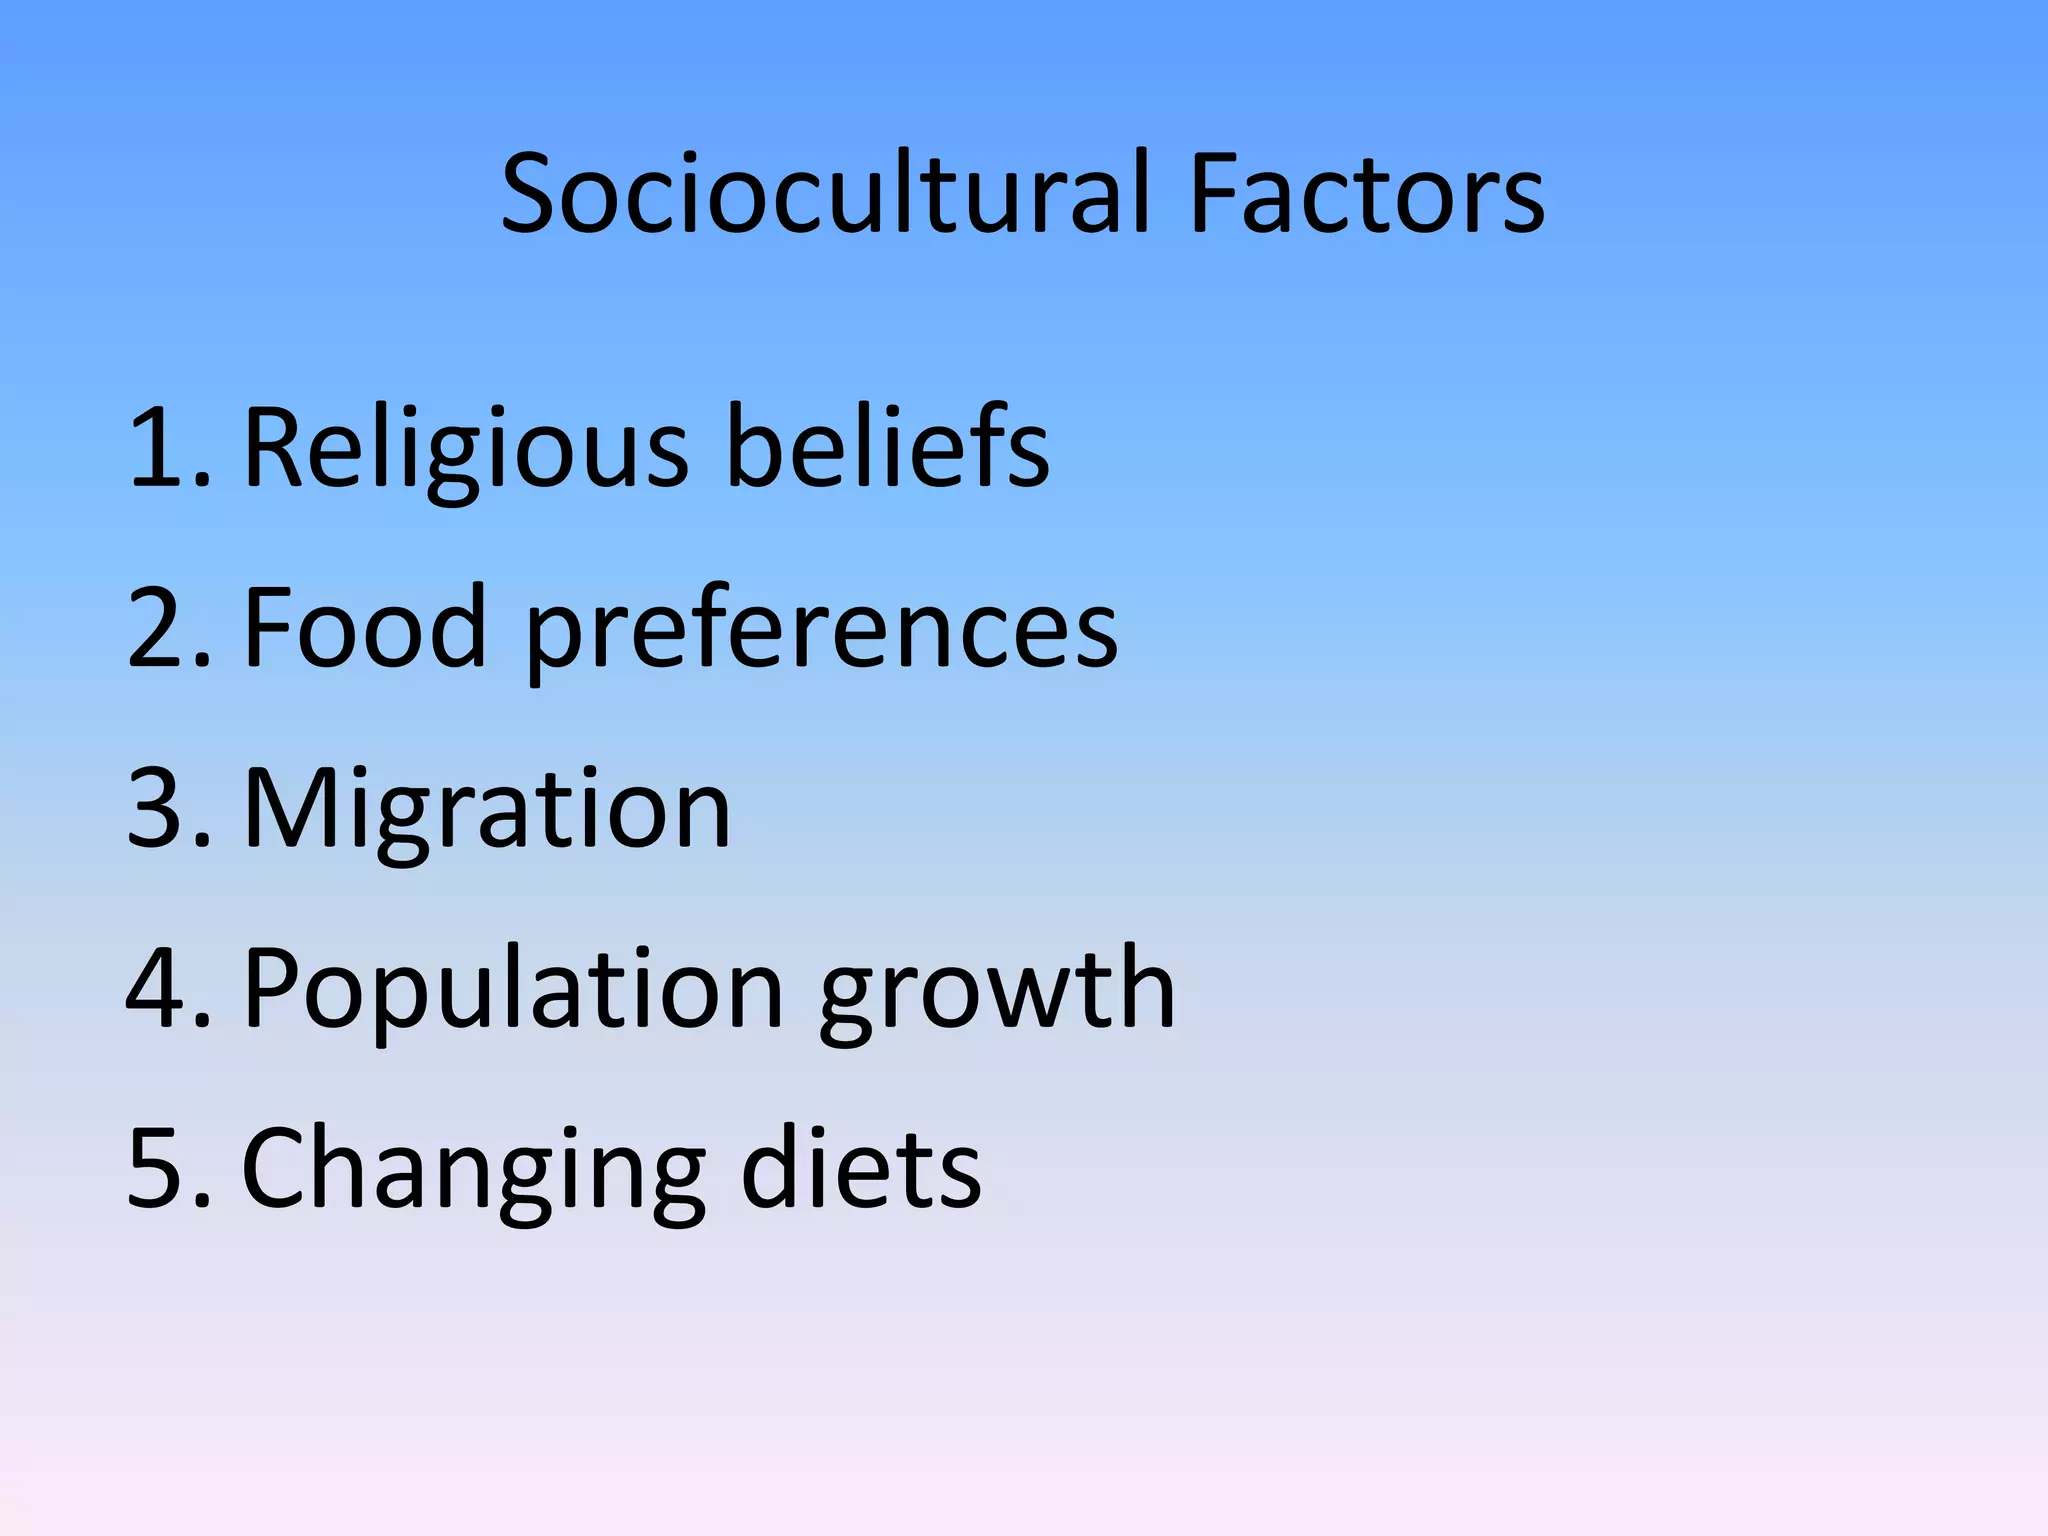
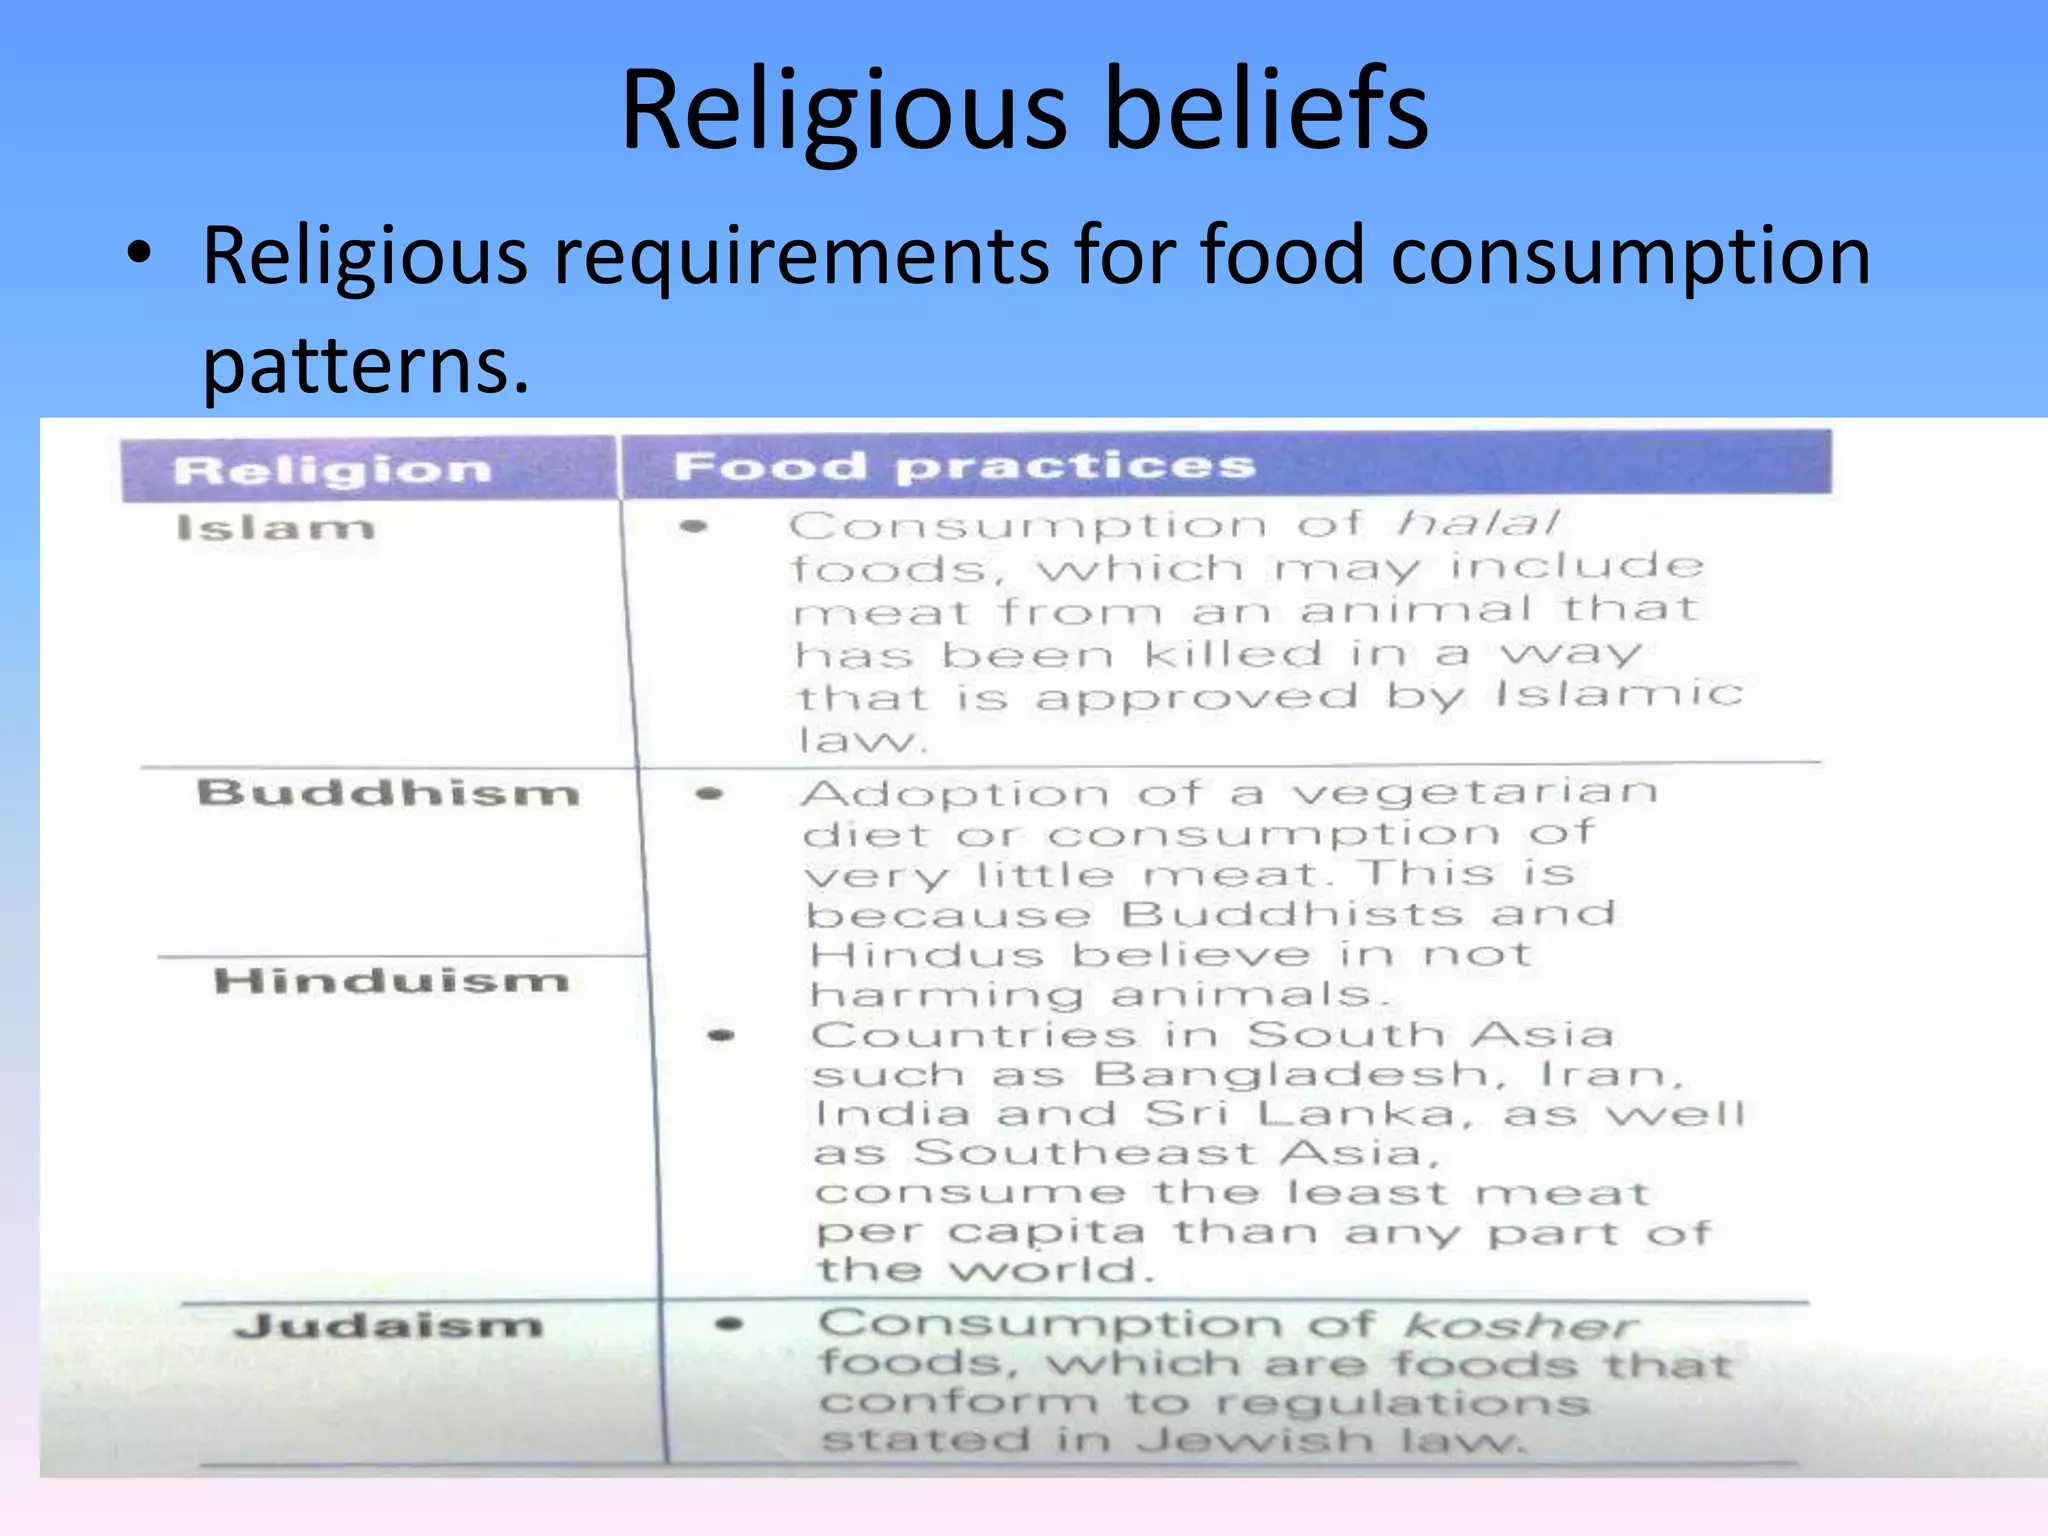
CBSS Humanities
Flip Classroom Package
Lesson 2
This lesson must be completed by
Term 2 week 6
2016
Pure
Geog
Changing food preferences
• The choice of one food type over
another.
• Diet changes pushed mainly by income
fluctuations.
• Increase in income per capita leads to
rises in demand for meat protein.
• Key benchmark food groups are:
–Cereals
–Meat
–Fruits and Vegetables
Cereals
• Up to 50% of global calorie intake.
• Common cereals in Asia are Rice and Wheat
• With increased income, more rice is replaced
by wheat (noodles and bread).
• With further increases in income, cereal
consumption falls – simultaneous higher
demand for meat.
• Obvious in Japan, China and South Korea.
Meat
• Domesticated animals like cows, pigs, sheep
or chickens.
• Meat and dairy products provide protein.
• Increase in income bring increase in meat
consumption.
• Type of meat consumed varies based on
cultural preferences.
• Egg consumption tends to be the 1st
observable increase.
Meat (cont’)
• In highly developed countries, the trend
is a reduction in red meat consumption.
• Health push for less red meat
–Obesity and heart disease.
• Overall global meat consumption is still
rapidly rising.
Fruits and vegetables
• Overall increase in consumption in both
LDC and DC.
• Different reasons for increase in each
group.
• LDCs consume more due to higher
income.
• DCs consume more due to the focus on
health and perceived benefits of more
fruit and vegetables in the diet.
Differing food consumption patterns
between DCs and LDCs.
• Economic Factors
– Disposable income
– Pricing
• Socio-cultural Factors
– Religious beliefs
– Food preferences
– Migration
– Population Growth
• Political Factors
– Food supply stability
– Food Safety
Economic Factor 1
• Disposable income
–Amount of income left after taxes paid.
–Increasing in both DCs and LDCs.
–In DCs, an increase of US $1 in disposable
income triggers a 20% of the increase is
spent on food.
–In LDCs, an increase of US $1 in disposable
income triggers a 60% of the increase is
spent on food.
• With increase in disposable income, food
consumption variety and amount increases.
• Among lower income groups, increase will
trigger a switch from cereals to meat.
• Among higher income groups, increase
triggers a move to better quality food.
– Move for healthier food types (organic food, olive
oil)
Economic Factor 2
• Pricing
– Poor (LDCs) are affected more by food prices than
the rich (DCs).
– Food Price Crisis in 2006-2008 saw populations in
LDCs suffering.
– Unable to afford staple food, fall into chronic
hunger and poverty.
– DCs have options to switch to less costly
alternatives, LDCs do not and lead to riots instead.
2006-2008 Food Price Crisis
Causes
• Bad weather leading to crop failure
• Increase use of farmland for non-food crops –
biofuel crops.
• Rising energy prices – increased transport
costs
• Trade restrictions & Governmental price
control
2006-2008 Food Price Crisis
Result
• Panic Buying & speculative trading
• LDCs
–Larger part of disposable income spent on
food
–Less spent on non-staple food items
–Food riots and protests as citizens are
unable to afford food.
2006-2008 Food Price Crisis
Result
• DCs
–Significant increase in food prices
–People select less expensive options.
Sociocultural Factors
1. Religious beliefs
2. Food preferences
3. Migration
4. Population growth
5. Changing diets
Religious beliefs
• Religious requirements for food consumption
patterns.
Food Preferences
• Fast Food
– Meals that are prepared easily in advance.
– Convenience for populations living in DCs.
– Meals that are made for fast consumption and to
be readily packed for take away.
• McDonalds, KFC, Domino’s, etc….
– More people in DCs are moving away from fast
food with more awareness of possible health risks.
Organic Food
• Health concerns increasingly altering the food
preferences of people in DCs.
• Move towards organic foods (within income
means)
– Organic food – food grown without the use of
artificial inputs, chemical fertilizers or growth
hormones.
Refer to
Figure 220b
Pg 104
Migration
• Migrants bring new food to places.
• Demand for new food products due
to change in food preferences.
• Indian migrants to UK bring curry
and it has entrenched itself into the
local culture.
Population growth
• Population has increased exponentially in the
past 1000 years.
• Increased humans lead to more need for food.
• Population growth rates are higher in LDCs
than DCs.
• There is a greater demand for food in the LDCs
than the DCs.
Changing Diet
• Diets of people DCs and LDCs will
constantly change.
• Globalisation and migration leads to
increase exposure and fusion.
• Traditional rice-eating societies will
move to more ‘western’ cereal
sources – wheat (bread, cakes and
pastries).
Political Factors
1.Stability of food supply
2.Food Safety
Stability of food supply
• Safe and nutritious food is available to all
people at all times.
• Food supply can be unsafe due to external
threats.
• Governments take proactive steps to reduce
food supply instability.
– Increase domestic production
– Diversity food source origin
Civil War outbreak
• Libya during 2011’s civil war, food
reserves were rapidly depleted.
• Cities and areas in the fight suffered
food shortages.
• Safety concerns restricted people
from venturing out to find/buy food.
Natural Disasters
• Zimbabwe suffered severe drought in
2008.
• Widespread crop failure and food
shortage.
• Rural areas were most affected due
to poverty and dependence on local
food source.
Case-study Pg107
• Please read the casestudy on Pg 107 of your
textbook on Zimbabwe’s drought in 2008.
Food Safety
• Food Safety refers to guidelines that ensure
food consumed is safe for the general public.
• General aim is to reduce the contamination by
bacteria.
• 4 main ways to keep food safe
– Clean surfaces (hands and food surfaces)
– Separate (no cross-contamination of food)
– Chill (Refrigerate to avoid rotting)
– Cook (Cook at proper temperature)
Food safety threats
• Sudden disasters
– Fukushima nuclear accident led to ban of food
imports from Japan for several months.
– ‘Mad Cow Disease’ outbreak in USA and Canada in
2005. Prompt action by local government to stop
the spread of the disease.
Pitstop 5
• Read the news article on pg 109.
• Prepare Question 1 to 4 for discussion in class.

Food resources gateway 1 lesson 2 flipped classroom sec 4 express only

  • 1.
    CBSS Humanities Flip ClassroomPackage Lesson 2 This lesson must be completed by Term 2 week 6 2016 Pure Geog
  • 2.
    Changing food preferences •The choice of one food type over another. • Diet changes pushed mainly by income fluctuations. • Increase in income per capita leads to rises in demand for meat protein. • Key benchmark food groups are: –Cereals –Meat –Fruits and Vegetables
  • 3.
    Cereals • Up to50% of global calorie intake. • Common cereals in Asia are Rice and Wheat • With increased income, more rice is replaced by wheat (noodles and bread). • With further increases in income, cereal consumption falls – simultaneous higher demand for meat. • Obvious in Japan, China and South Korea.
  • 5.
    Meat • Domesticated animalslike cows, pigs, sheep or chickens. • Meat and dairy products provide protein. • Increase in income bring increase in meat consumption. • Type of meat consumed varies based on cultural preferences. • Egg consumption tends to be the 1st observable increase.
  • 7.
    Meat (cont’) • Inhighly developed countries, the trend is a reduction in red meat consumption. • Health push for less red meat –Obesity and heart disease. • Overall global meat consumption is still rapidly rising.
  • 8.
    Fruits and vegetables •Overall increase in consumption in both LDC and DC. • Different reasons for increase in each group. • LDCs consume more due to higher income. • DCs consume more due to the focus on health and perceived benefits of more fruit and vegetables in the diet.
  • 10.
    Differing food consumptionpatterns between DCs and LDCs. • Economic Factors – Disposable income – Pricing • Socio-cultural Factors – Religious beliefs – Food preferences – Migration – Population Growth • Political Factors – Food supply stability – Food Safety
  • 11.
    Economic Factor 1 •Disposable income –Amount of income left after taxes paid. –Increasing in both DCs and LDCs. –In DCs, an increase of US $1 in disposable income triggers a 20% of the increase is spent on food. –In LDCs, an increase of US $1 in disposable income triggers a 60% of the increase is spent on food.
  • 12.
    • With increasein disposable income, food consumption variety and amount increases. • Among lower income groups, increase will trigger a switch from cereals to meat. • Among higher income groups, increase triggers a move to better quality food. – Move for healthier food types (organic food, olive oil)
  • 13.
    Economic Factor 2 •Pricing – Poor (LDCs) are affected more by food prices than the rich (DCs). – Food Price Crisis in 2006-2008 saw populations in LDCs suffering. – Unable to afford staple food, fall into chronic hunger and poverty. – DCs have options to switch to less costly alternatives, LDCs do not and lead to riots instead.
  • 14.
    2006-2008 Food PriceCrisis Causes • Bad weather leading to crop failure • Increase use of farmland for non-food crops – biofuel crops. • Rising energy prices – increased transport costs • Trade restrictions & Governmental price control
  • 15.
    2006-2008 Food PriceCrisis Result • Panic Buying & speculative trading • LDCs –Larger part of disposable income spent on food –Less spent on non-staple food items –Food riots and protests as citizens are unable to afford food.
  • 16.
    2006-2008 Food PriceCrisis Result • DCs –Significant increase in food prices –People select less expensive options.
  • 17.
    Sociocultural Factors 1. Religiousbeliefs 2. Food preferences 3. Migration 4. Population growth 5. Changing diets
  • 18.
    Religious beliefs • Religiousrequirements for food consumption patterns.
  • 19.
    Food Preferences • FastFood – Meals that are prepared easily in advance. – Convenience for populations living in DCs. – Meals that are made for fast consumption and to be readily packed for take away. • McDonalds, KFC, Domino’s, etc…. – More people in DCs are moving away from fast food with more awareness of possible health risks.
  • 20.
    Organic Food • Healthconcerns increasingly altering the food preferences of people in DCs. • Move towards organic foods (within income means) – Organic food – food grown without the use of artificial inputs, chemical fertilizers or growth hormones. Refer to Figure 220b Pg 104
  • 21.
    Migration • Migrants bringnew food to places. • Demand for new food products due to change in food preferences. • Indian migrants to UK bring curry and it has entrenched itself into the local culture.
  • 22.
    Population growth • Populationhas increased exponentially in the past 1000 years. • Increased humans lead to more need for food. • Population growth rates are higher in LDCs than DCs. • There is a greater demand for food in the LDCs than the DCs.
  • 23.
    Changing Diet • Dietsof people DCs and LDCs will constantly change. • Globalisation and migration leads to increase exposure and fusion. • Traditional rice-eating societies will move to more ‘western’ cereal sources – wheat (bread, cakes and pastries).
  • 24.
    Political Factors 1.Stability offood supply 2.Food Safety
  • 25.
    Stability of foodsupply • Safe and nutritious food is available to all people at all times. • Food supply can be unsafe due to external threats. • Governments take proactive steps to reduce food supply instability. – Increase domestic production – Diversity food source origin
  • 26.
    Civil War outbreak •Libya during 2011’s civil war, food reserves were rapidly depleted. • Cities and areas in the fight suffered food shortages. • Safety concerns restricted people from venturing out to find/buy food.
  • 27.
    Natural Disasters • Zimbabwesuffered severe drought in 2008. • Widespread crop failure and food shortage. • Rural areas were most affected due to poverty and dependence on local food source.
  • 28.
    Case-study Pg107 • Pleaseread the casestudy on Pg 107 of your textbook on Zimbabwe’s drought in 2008.
  • 29.
    Food Safety • FoodSafety refers to guidelines that ensure food consumed is safe for the general public. • General aim is to reduce the contamination by bacteria. • 4 main ways to keep food safe – Clean surfaces (hands and food surfaces) – Separate (no cross-contamination of food) – Chill (Refrigerate to avoid rotting) – Cook (Cook at proper temperature)
  • 30.
    Food safety threats •Sudden disasters – Fukushima nuclear accident led to ban of food imports from Japan for several months. – ‘Mad Cow Disease’ outbreak in USA and Canada in 2005. Prompt action by local government to stop the spread of the disease.
  • 31.
    Pitstop 5 • Readthe news article on pg 109. • Prepare Question 1 to 4 for discussion in class.

Editor's Notes

  • #14 http://www.youtube.com/watch?v=zIVcJKwudMo China price rises
  • #20 http://www.youtube.com/watch?v=ZwJH2fZhYSk McDonalds advertisement
  • #28 http://www.youtube.com/watch?v=u-G77F-hgf8 Zimbabwe food shortage due to drought