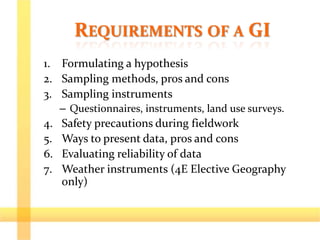
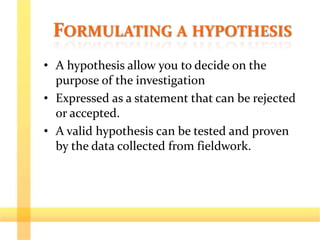
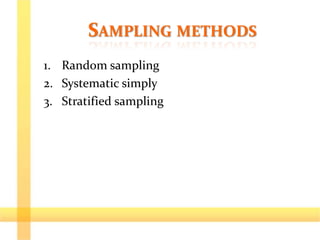
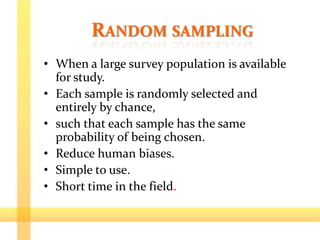
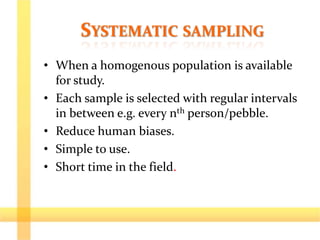
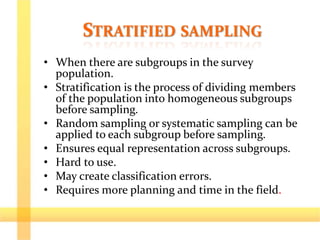
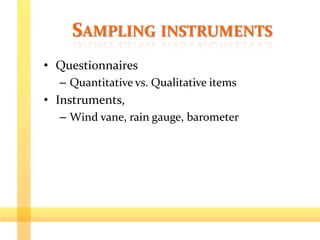
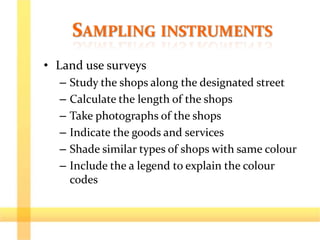
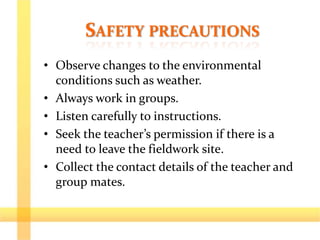
GEOGRAPHICAL INVESTIGATION
What you need to know
BY THE END OF THE LESSON
We will be able to
1. Know the basic requirements of conducting
a geographical investigation.
REQUIREMENTS OF A GI
1. Formulating a hypothesis
2. Sampling methods, pros and cons
3. Sampling instruments
– Questionnaires, instruments, land use surveys.
4. Safety precautions during fieldwork
5. Ways to present data, pros and cons
6. Evaluating reliability of data
7. Weather instruments (4E Elective Geography
only)
FORMULATING A HYPOTHESIS
• A hypothesis allow you to decide on the
purpose of the investigation
• Expressed as a statement that can be rejected
or accepted.
• A valid hypothesis can be tested and proven
by the data collected from fieldwork.
SAMPLING METHODS
1. Random sampling
2. Systematic simply
3. Stratified sampling
RANDOM SAMPLING
• When a large survey population is available
for study.
• Each sample is randomly selected and
entirely by chance,
• such that each sample has the same
probability of being chosen.
• Reduce human biases.
• Simple to use.
• Short time in the field.
SYSTEMATIC SAMPLING
• When a homogenous population is available
for study.
• Each sample is selected with regular intervals
in between e.g. every nth person/pebble.
• Reduce human biases.
• Simple to use.
• Short time in the field.
STRATIFIED SAMPLING
• When there are subgroups in the survey
population.
• Stratification is the process of dividing members
of the population into homogeneous subgroups
before sampling.
• Random sampling or systematic sampling can be
applied to each subgroup before sampling.
• Ensures equal representation across subgroups.
• Hard to use.
• May create classification errors.
• Requires more planning and time in the field.
SAMPLING INSTRUMENTS
• Questionnaires
– Quantitative vs. Qualitative items
• Instruments,
– Wind vane, rain gauge, barometer
SAMPLING INSTRUMENTS
• Land use surveys
– Study the shops along the designated street
– Calculate the length of the shops
– Take photographs of the shops
– Indicate the goods and services
– Shade similar types of shops with same colour
– Include the a legend to explain the colour
codes
SAFETY PRECAUTIONS
• Observe changes to the environmental
conditions such as weather.
• Always work in groups.
• Listen carefully to instructions.
• Seek the teacher’s permission if there is a
need to leave the fieldwork site.
• Collect the contact details of the teacher and
group mates.
WAYS TO PRESENT DATA
• Table
• Simple line graphs
– Contain one dependent variable and one
independent variable
• Comparative line graphs
– Consists more than one dependent variable
• Compound line graphs
– Consists two or more subsets of a set of data
WAYS TO PRESENT DATA
• Simple bar graphs
– Contain one dependent variable and one
independent variable
• Comparative bar graphs
– Compares two or more sets of data
• Compound bar graphs
– Consists two or more subsets of a set of data
• Pie charts
• Scatter graphs
QUESTION
• What are the pros and cons of presenting data
in the following ways.
– Table
– Line graphs
– Bar graphs
– Pie charts
EVALUATING RELIABILITY OF DATA
• Inaccessibility to some areas may result in
unequal collection of samples.
• Data is more accurate if there are a greater
number of collection sites and data is
collected more frequently.
• Unusual weather conditions may skew data
collected.
• Parallax error when reading off an instrument
will produce inaccurate results.

Geographical Inquiry

  • 1.
  • 2.
    BY THE ENDOF THE LESSON We will be able to 1. Know the basic requirements of conducting a geographical investigation.
  • 3.
    REQUIREMENTS OF AGI 1. Formulating a hypothesis 2. Sampling methods, pros and cons 3. Sampling instruments – Questionnaires, instruments, land use surveys. 4. Safety precautions during fieldwork 5. Ways to present data, pros and cons 6. Evaluating reliability of data 7. Weather instruments (4E Elective Geography only)
  • 4.
    FORMULATING A HYPOTHESIS •A hypothesis allow you to decide on the purpose of the investigation • Expressed as a statement that can be rejected or accepted. • A valid hypothesis can be tested and proven by the data collected from fieldwork.
  • 5.
    SAMPLING METHODS 1. Randomsampling 2. Systematic simply 3. Stratified sampling
  • 6.
    RANDOM SAMPLING • Whena large survey population is available for study. • Each sample is randomly selected and entirely by chance, • such that each sample has the same probability of being chosen. • Reduce human biases. • Simple to use. • Short time in the field.
  • 7.
    SYSTEMATIC SAMPLING • Whena homogenous population is available for study. • Each sample is selected with regular intervals in between e.g. every nth person/pebble. • Reduce human biases. • Simple to use. • Short time in the field.
  • 8.
    STRATIFIED SAMPLING • Whenthere are subgroups in the survey population. • Stratification is the process of dividing members of the population into homogeneous subgroups before sampling. • Random sampling or systematic sampling can be applied to each subgroup before sampling. • Ensures equal representation across subgroups. • Hard to use. • May create classification errors. • Requires more planning and time in the field.
  • 9.
    SAMPLING INSTRUMENTS • Questionnaires –Quantitative vs. Qualitative items • Instruments, – Wind vane, rain gauge, barometer
  • 10.
    SAMPLING INSTRUMENTS • Landuse surveys – Study the shops along the designated street – Calculate the length of the shops – Take photographs of the shops – Indicate the goods and services – Shade similar types of shops with same colour – Include the a legend to explain the colour codes
  • 11.
    SAFETY PRECAUTIONS • Observechanges to the environmental conditions such as weather. • Always work in groups. • Listen carefully to instructions. • Seek the teacher’s permission if there is a need to leave the fieldwork site. • Collect the contact details of the teacher and group mates.
  • 12.
    WAYS TO PRESENTDATA • Table • Simple line graphs – Contain one dependent variable and one independent variable • Comparative line graphs – Consists more than one dependent variable • Compound line graphs – Consists two or more subsets of a set of data
  • 13.
    WAYS TO PRESENTDATA • Simple bar graphs – Contain one dependent variable and one independent variable • Comparative bar graphs – Compares two or more sets of data • Compound bar graphs – Consists two or more subsets of a set of data • Pie charts • Scatter graphs
  • 14.
    QUESTION • What arethe pros and cons of presenting data in the following ways. – Table – Line graphs – Bar graphs – Pie charts
  • 15.
    EVALUATING RELIABILITY OFDATA • Inaccessibility to some areas may result in unequal collection of samples. • Data is more accurate if there are a greater number of collection sites and data is collected more frequently. • Unusual weather conditions may skew data collected. • Parallax error when reading off an instrument will produce inaccurate results.