1. The biological basis for predicting nitrogen and sulfur isotope ratio discrimination in animals is complicated by mixed diets of varying protein quality and quantity consumed by omnivores.
2. The study examines how protein quality, defined as the relative amount of the most limiting amino acid, and protein quantity determine nitrogen (D15N) and sulfur (D34S) isotope discrimination in mammals and birds. Low protein quality and high protein content have the potential to increase D15N by increasing protein turnover.
3. Protein quality accounted for most variation in D15N for diets of intermediate protein quality and quantity, but diets with exceptionally high or low protein quality showed different discrimination than predicted by quality alone. Supplementation

![of such models to accurately predict nitrogen, carbon, or
sulphur discriminations, particularly for foods in mixed
diets, may lead to unacceptable errors in estimating assimi-
lated diets of ancestral humans and wild animals (Caut,
Angulo & Courchamp 2008; Robbins, Felicetti & Florin
2010).
Current approaches to estimating unknown discrimina-
tions for foods consumed by free-ranging animals include:
(i) feeding wild-collected foods to captive animals and directly
measuring their discrimination, which is not always feasible
and may rarely simulate field complexity; (ii) using a grand
mean for all foods (e.g. 2Æ0–3Æ4& for nitrogen and 0& for
sulphur), which ignores the three- to fourfold variation in
D15
N (e.g. c. )2 to 6&) and D34
S (e.g. c. )3 to 8&); or (iii)
using various regressions between dietary isotope values and
discriminations that have been determined with captive wild-
life consuming a wide range of foods, which describe very
general relationships that may not be cause-effect (Peterson
& Fry 1987; McCutchan et al. 2003; Vanderklift & Ponsard
2003; Robbins, Felicetti & Sponheimer 2005; Caut, Angulo &
Courchamp 2009; Martinez del Rio et al. 2009; Robbins,
Felicetti & Florin 2010).
Two major hypotheses have been proposed to explain
much of the dietary-induced variation in D15
N. The protein
quantity hypothesis suggests that as dietary protein content
(%) or intake (g day)1
) increase, D15
N will increase (Pearson
et al. 2003; Martinez del Rio et al. 2009). The protein quality
hypothesis suggests that as protein quality decreases, D15
N
will increase (Roth & Hobson 2000; Robbins, Felicetti &
Sponheimer 2005; Robbins, Felicetti & Florin 2010). Both
are based on the observation or hypothesis that as dietary
protein intake or amino acid scavenging increase, nitrogen
excretion will increase and lead to the preferential retention of
15
N which will elevate the animal’s d15
N value relative to the
diet.
Although Robbins, Felicetti & Sponheimer (2005) and
Robbins, Felicetti & Florin (2010) found no support for the
protein quantity hypothesis when plotting either nitrogen
content or carbon : nitrogen ratios against D15
N, such plots
are confounded by lower protein, largely plant-based diets of
poorer protein quality at one end of the regression and higher
protein, largely animal-based diets of higher protein quality
at the other. If both protein quality and quantity are impor-
tant, D15
N may be elevated when plant-based diets are con-
sumed primarily because of their poorer protein quality and
when animal-based diets are consumed primarily because of
their higher protein content. Thus, we hypothesized that both
protein quality and quantity may be important, but the rela-
tionships are more complex than either proposal alone sug-
gests.
Thus far, little use has been made of sulphur isotopes for
estimating assimilated diet, although the consumer’s isotope
value should reflect the dietary isotope value (Felicetti et al.
2003; McCutchan et al. 2003; Arneson & MacAvoy 2005).
D15
N and D34
S may be related in that sulphur amino acids
(methionine, cystine, cysteine and taurine) are important
sources of organic sulphur (Arneson & MacAvoy 2005).
If sulphur amino acids are important in determining protein
quality, dietary sulphur amino acid content may be important
in determining both D15
N and D34
S. Consequently, we sought
a unified concept incorporating both protein quality and
quantity that could be used to understand and accurately pre-
dict D15
N, D34
S and assimilated diets of omnivores.
Materials and methods
QUANTIF YING PROTEIN QUANT ITY AND QUALIT Y
While nitrogen or protein quantity (N · 6Æ25) has been measured in
virtually all studies, protein quality has not. There are many measures
of protein quality. Some are based on feeding studies (e.g. protein effi-
ciency ratio, biological value, or net protein utilization) and others
are based on how well the essential amino acid profile of a particular
food matches a hypothetical perfect protein or the animal’s require-
ments (e.g. chemical score). The latter estimates are appealing in that
amino acid profiles of many foods have been determined and very
extensive effort has been made to define the amino acid requirements
of domestic and laboratory animals [NRC (National Research Coun-
cil) 1995].
The complete amino acid profiles of Chinook salmon (Oncorhyn-
chus tshawytscha) and white-tailed deer (Odocoileus virginianus) fed to
brown bears (Ursus arctos) and American black bears (Ursus americ-
anus) (Hilderbrand et al. 1996; Felicetti et al. 2003) and various diets
composed of corn, wheat, alfalfa, soybean meal, lentils, chicken meal,
pork meat and bone meal and fish meal fed to laboratory rats (Rob-
bins, Felicetti & Florin 2010; current study) were determined at the
University of Missouri Agricultural Experiment Station Chemical
Laboratories. Briefly, acid and alkaline hydrolysates were analysed
using a high-performance liquid chromatographic amino acid ana-
lyzer. Additional amino acid profiles or protein contents of foods not
reported by other investigators were estimated from the compilations
of NRC (1994), Davis et al. (1994), American Casein Co. (Burling-
ton, NJ, USA) and the USDA National Nutrient Database for
Standard Reference, Agricultural Research Service (http://www.nal.
usda.gov/fnic/foodcomp/search/) (see Table S1, Supporting informa-
tion).
The basis for estimating protein quality was to express the concen-
tration of each essential amino acid in the diet as a percent of the diet’s
crude protein (N · 6Æ25) content. This relative concentration of each
amino acid was compared with the estimated dietary requirement of
that amino acid as a percent of the total protein requirement for
growth by laboratory rats (Rattus rattus) (NRC 1995) to determine
which amino acid might be most limiting. Amino acid requirements
for growing laboratory rats were used as the standard for all animals
because (i) the amino acid requirements for wild animals are almost
entirely unknown; (ii) the current and previous study (Robbins, Felic-
etti & Florin 2010) used laboratory rats; and (iii) laboratory rats have
not been heavily selected for meat, milk, or egg production as have
many other domestic animals (e.g. livestock and poultry) and, there-
fore, may be a more appropriate comparison with wild animals.
SELECTING NITR OGEN AND SULPHUR DISCRIMINA-
TION VALUES
D15
N and D34
S values for serum, plasma, whole blood, or red blood
cells were sought for diets that covered the widest possible ranges of
protein quality and quantity, had been fed long enough to ensure diet
to animal equilibration and had been fed by multiple investigators or
Ó 2010 The Authors. Functional Ecology Ó 2010 British Ecological Society, Functional Ecology, 25, 519–526
520 S. T. Florin et al.](https://image.slidesharecdn.com/adda734c-53c0-4780-b1e7-84cfafcdfb41-160412012039/85/Florin_et_al-2011-Functional_Ecology-2-320.jpg)
![in various combinations to ensure that the reported isotope discrimi-
nations were reliable. Unfortunately, results on commercial rodent
and poultry diets as well as several other diets could not be used
because of the impossibility of estimating amino acid profiles. Simi-
larly, feeding studies that used pelleted diets were excluded because of
concern about protein damage (Robbins, Felicetti & Florin 2010),
and studies that fed fungi, crustacea, or insects [e.g. mealworms (Ten-
ebrio molitor)] were excluded because much of their nitrogen occurs as
chitin (a nitrogen-containing carbohydrate) (Claridge et al. 1999;
Pearson et al. 2003). For example, van Tets & Hulbert (1999)
estimated that 69% of the nitrogen in mealworms occurred as non-
protein chitin.
TESTING THE INTERACTION BETWEEN PR OT EIN
QUANTIT Y, QUALITY AND D1 5
N
Two approaches were used to test the interactions between protein
quantity and quality in determining D15
N. The first approach was an
indirect test in which the relative amount of the most limiting essential
amino acid was compared with the D15
N for several diet–animal com-
binations used in the current and previous studies (Hobson & Clark
1992; Hilderbrand et al. 1996; Hobson et al. 1996; Ben-David &
Schell 2001; Jenkins et al. 2001; Bearhop et al. 2002; Lesage, Hammill
& Kavacs 2002; Felicetti et al. 2003; Sponheimer et al. 2003; Ogden,
Hobson & Lank 2004; Arneson & MacAvoy 2005; Cherel, Hobson &
Hassani 2005; Robbins, Felicetti & Sponheimer 2005; Podlesak &
McWilliams 2006; Darr & Hewitt 2008; Tsahar et al. 2008; Robbins,
Felicetti & Florin 2010) (see Table S2). If the protein quality hypothe-
sis is valid, D15
N should decrease as the concentration of the most lim-
iting amino acid increases across diets. Similarly, if the protein
quantity hypothesis is valid, D15
N should increase above the relation-
ship determined by protein quality alone once the most limiting
amino acid is no longer the sole determinant of dietary protein turn-
over.
The second approach was a direct test in which foods ranging in
both protein quality and quantity were supplemented with additional
energy to dilute the protein concentration and thereby reduce daily
protein intake. The D15
N and D34
S of animals consuming the energy-
supplemented diets should be less than the non-supplemented diets
when protein quantity becomes important in determining discrimina-
tion. Specifically, we hypothesized that D15
N values for plant-based
diets would be less likely to decrease with energy dilution than ani-
mal-based diets.
Thus, the diets used included fish meal (Brevoortia tyrannus),
chicken meal, pork meat and bone meal, soybean meal, lentils and
wheat because they cover a wide range in both protein quantity and
quality in both plants and animals. All feeds were purchased as single
batches, finely ground and mixed thoroughly to ensure that composi-
tion and isotopic values were constant. Each diet was fed in the undi-
luted form followed immediately by the diluted form to the same 10
rats. The diluted diets were supplemented with nitrogen- and sulphur-
free sucrose, starch and corn oil in the ratio of 5 : 2 : 2 : 1, such that
the protein concentration was reduced by 50%. Further dilution was
not attempted because of concern about creating nutritional deficien-
cies.
Ten male, Sprague–Dawley laboratory rats were used in all feeding
trials. Each feeding trial lasted 21 days to ensure that plasma had
equilibrated with the diet and followed the protocol of Robbins,
Felicetti & Florin (2010). Blood samples were collected in heparinized
tubes at the end of each feeding trial. Plasma was separated, frozen,
and freeze-dried. All rats were fed ad libitum to promote positive
energy and protein balance, weight gain, and therefore minimal tissue
mobilization. Rats were weighed weekly.
ISOTOPIC AND STATISTIC AL ANALYSES
d15
N and d34
S values for diets and freeze-dried plasma were deter-
mined with a continuous flow isotope ratio mass spectrometer (Delta
PlusXP; Thermo Finnigan, Bremen, Germany) at the Washington
State University Stable Isotope Core Laboratory. Mean dietary iso-
tope values were based on the analyses of five samples per diet. Nitro-
gen isotope ratios are reported as per mil (&) relative to atmospheric
nitrogen (d15
N). Sulphur isotope ratios are reported as per mil relative
to Vienna Canon Diablo Troilite by assigning a value of )0Æ3& to
IAEA S-1 silver sulphide. Laboratory reference standards (acetanilide
and keratin for nitrogen and sulfanilimide, IAEA S-2, IAEA SO5,
and IAEA S3 for sulphur) were interspersed throughout each analysis
to ensure maintenance of calibration. Analytical errors (±1 SD) for
the above standards were £0Æ1& for nitrogen and £0Æ4& for sulphur.
Linear and curvilinear least squares regressions were used to model
all relationships (SAS 1998). Differences in slopes of regressions were
tested using small sample t-tests (Kleinbaum & Kupper 1978). ANOVA
was used to test for differences in discrimination between diets.
A P-value of <0Æ05 was considered significant. Means are reported
with ±1 SD.
Results
NITROGEN ISOTOPE RAT IO DISCR IMINATION
Protein quality as defined by the relative methionine concen-
tration accounted for 87–90% of the variation in D15
N when
animals consumed diets that ranged from 6Æ9% to 53Æ8% pro-
tein with methionine concentrations ranging from 1Æ3% to
2Æ6% (Fig. 1, see Tables S1 and S2). The inclusion of the
other sulphur-containing amino acids that can partially sub-
stitute for methionine (i.e. cystine, cysteine and taurine) did
not improve the regressions. The pattern of decreasing D15
N
with increasing protein quality occurred for laboratory rats
consuming a wide range of single-item and mixed diets (Rob-
bins, Felicetti & Florin 2010; current study), non-primate
neonates consuming milk (Robbins 1993; Davis et al. 1994;
Jenkins et al. 2001; Robbins, Felicetti & Sponheimer 2005),
wild and domestic ruminants consuming alfalfa or alfalfa and
corn (Jenkins et al. 2001; Sponheimer et al. 2003; Darr & He-
witt 2008), and yellow-vented bulbuls (Pycnonotus xanthopy-
gos) and yellow-rumped warblers (Dendroica coronata)
consuming mixed diets of casein and bananas (Tsahar et al.
2008) or casein, sugar and olive oil (Podlesak & McWilliams
2006).
However, several diets had either higher or lower discrimi-
nations than predicted by the regression equations of Fig. 1.
For example, lentils containing relatively low quality protein
had a much lower D15
N than predicted by the regressions. At
the other extreme, high-protein meat diets containing rela-
tively high quality protein (e.g. fish, fish meal, chicken meal,
ungulates, and quail) fed to various mammals (Canis latrans,
Halichoerus grypus, Mustela vison, Pagophilus groenlandicus,
Phoca hispida, Phoca vitulina, U. americanus, U. arctos) and
Ó 2010 The Authors. Functional Ecology Ó 2010 British Ecological Society, Functional Ecology, 25, 519–526
Understanding nitrogen and sulphur discrimination 521](https://image.slidesharecdn.com/adda734c-53c0-4780-b1e7-84cfafcdfb41-160412012039/85/Florin_et_al-2011-Functional_Ecology-3-320.jpg)
![Nitrogen discriminations can be predicted (R2
= 0Æ81,
F ‡ 68Æ4, P < 0Æ0001, Fig. 3) across the breadth of dietary
data by either one of two equations utilizing both protein
quality and quantity:
D15
N ¼ 7Á62 À 2Á11X þ 0Á015Z eqn 1
D15
N ¼ À6Á02 þ 0Á14X þ 0Á015Z eqn 2
where X is protein quality [eqn 1, methionine content as a
per cent of total dietary protein (Fig. 1a) or eqn 2, the rela-
tive deficit of the most limiting amino acid as a per cent of
the requirement for growth by laboratory rats (Fig. 1b)]
and Z is dietary protein content (% of total dietary dry mat-
ter). The equations utilized all data of Table S2 and Fig. 1
with the exception of the values for lentils (see Discussion).
Protein quality accounted for 75% of the variation
(F ‡ 98Æ9, P < 0Æ0001) and protein quantity for 7%
(F = 2Æ5, P = 0Æ12). More complex regressions, such as
curvilinear regressions or linear and curvilinear regressions
with thresholds for a protein quantity effect (e.g. ‡50%),
produced similar overall predictive capabilities (R2
=
0Æ82–0Æ84, F ‡ 78Æ9, P < 0Æ0001) and estimates of the rela-
tive importance of protein quality (74–76%) and quantity
(5–6%) (eqns 1 and 2).
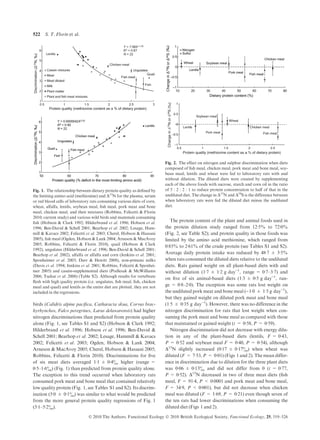
SULPHUR ISOTOPE RATIO DISCRIMINAT ION
Sulphur amino acids accounted for 84 ± 20% of the dietary
sulphur in corn, wheat, alfalfa, soybean meal, fish meal,
chicken meal, and pork meat and bone meal. However, D34
S
was not highly correlated with D15
N (Fig. 4). D34
S did not
change when sucrose, starch and corn oil were added to any
of the six feeds relative to the undiluted diets (mean change in
D34
S values with dilution = 0Æ02 ± 0Æ13, F = 0Æ34–1Æ26,
P = 0Æ08–0Æ77) (Fig. 2). Dietary d34
S accounted for 89% of
the variation in D34
S (see Table S3, Fig. 5). Regressions
between various measures of sulphur amino acid content,
including total sulphur amino acid content, methionine con-
tent, cystine and cysteine content, and methionine to cystine
ratio, had lower correlation coefficients that ranged from
0Æ46 to 0Æ77.
Discussion
Numerous animal and dietary factors have been proposed to
affect nitrogen discrimination by specific tissues. The animal
factors include intake rate, growth rate, metabolic rate, iso-
tope routing, and type of nitrogen excretion (ureotelic or uri-
cotelic), and the dietary factors include protein quality and
quantity (Martinez del Rio et al. 2009; Kelly & Martinez del
Rio 2010; Smith et al. 2010). The animal factors create con-
cern when trying to estimate the assimilated diets of both
ancient and extant animals because they are rarely known.
The current relationships (Fig. 1 and eqns 1 and 2), which
were developed for mammals and birds that were either main-
taining or gaining weight, suggest that most of the variation
in nitrogen discriminations under these conditions is due to
1
3
5
7
1 3 5 7
PredictedΔ15N(‰)
Observed Δ15N (‰)
Y = 0·78 + 0·81X
R2
= 0·81
N = 35
t = 33·8, P < 0·0001
1:1
Fig. 3. The relationship between the observed discriminations of the
diets in Table S2 and their predicted discriminations when solving
eqns 1 and 2 utilizing their respective protein qualities and quantities.
Dashed line is the 1 : 1 relationship between the variables.
Fig. 4. The relationship between nitrogen and sulphur discrimination
for a range of foods fed to laboratory rats (Robbins, Felicetti & Florin
2010; current study) and grizzly bears (Felicetti et al. 2003).
Fig. 5. The relationship between dietary d34
S, plasma or serum d34
S,
and D34
S for diets fed to laboratory rats (Robbins, Felicetti & Florin
2010; current study) and grizzly bears (Felicetti et al. 2003)
(Table S3).
Ó 2010 The Authors. Functional Ecology Ó 2010 British Ecological Society, Functional Ecology, 25, 519–526
Understanding nitrogen and sulphur discrimination 523](https://image.slidesharecdn.com/adda734c-53c0-4780-b1e7-84cfafcdfb41-160412012039/85/Florin_et_al-2011-Functional_Ecology-5-320.jpg)