
Recommended
Recommended
More Related Content
What's hot
What's hot (20)
Viewers also liked
Viewers also liked (14)
Similar to Nwaishi et al. 2016 nutrient cycling
Similar to Nwaishi et al. 2016 nutrient cycling (20)
Recently uploaded
Recently uploaded (20)
Nwaishi et al. 2016 nutrient cycling
- 1. Above and below-ground nutrient cycling: a criteria for assessing the biogeochemical functioning of a constructed fen Felix Nwaishia, *, Richard M. Petroneb , Merrin L. Macraeb , Jonathan S. Priceb , Maria Strackb , Robin Slawsonc , Roxane Andersend a Dept. of Geography & Environmental Studies, Wilfrid Laurier University, Waterloo, Ontario N2L 3C5, Canada b Dept. of Geography & Environmental Management, University of Waterloo, Waterloo, Ontario N2L 3G1, Canada c Dept. of Biology, Wilfrid Laurier University, Waterloo, Ontario N2L 3C5, Canada d Environmental Research Institute, University of the Highlands and Islands, Thurso Caithness, Scotland KW14 7JD, United Kingdom A R T I C L E I N F O Article history: Received 17 August 2015 Received in revised form 15 October 2015 Accepted 19 October 2015 Available online 4 November 2015 Keywords: Nutrient dynamics Microbial activity Peatland reclamation Athabasca oil sands Peatland function A B S T R A C T Recent peatland restoration studies have highlighted the need to modify the conventional approach of monitoring the recovery of biogeochemical functions through above-ground processes by integrating below-ground components, which are potentially sensitive indicators of reclamation trajectory in long- term monitoring programs. In this study, the recovery of nutrient cycling processes were assessed from both above and below-ground perspectives in a fen constructed on a post-mining landscape in the Athabasca oil sands region, Canada. The goal of this study was to understand if and how different revegetation strategies (seedlings (SDL); moss layer transfers (MLT); seedlings with moss transfer (SMLT) and a control treatment (CTRL)) influence the evolution of biogeochemical functions in the constructed fen relative to a natural reference (REF). The treatments were replicated 6 times and monitored over 2 growing seasons. Our results showed that revegetation facilitated both above-ground productivity and the cycling of below-ground nutrients, especially in the species-rich SMLT plots. Supply of labile substrates in the re-vegetated plots increased microbial potential activity. This was reflected in higher rates of respiration (c.7.8 g CO2 mÀ2 dayÀ2 ), nutrient acquisition (net immobilization) and productivity (c. À16.3 g CO2 mÀ2 dayÀ2 ) among revegetated plots relative to the CTRL. Nutrient dynamics within the constructed fen suggest that phosphorus limitation (N:P ratio > 20) could hamper the establishment of a diverse plant community, whereas the build-up of microbial biomass appears to be NO3 À limited. Our results also emphasize the need to track the evolution of nutrients cycling processes through long-term monitoring programs, and identify the potential use of ammonification, nitrogen mineralization and phosphorus availability as functional indicators of a fen’s recovery trajectory towards conditions present in natural fens. ã 2015 Elsevier B.V. All rights reserved. 1. Introduction Theoftenobservedoverlapbetweendepositsofnaturalresources and pristine ecosystems (Durán et al., 2013; Kobayashi et al., 2014) suggests that meeting the increasing global resource demand through mining will inevitably be associated with the loss of vital ecosystems and supported services (Sims et al., 2013; Soni et al., 2014). Resource exploration sites are known hotspots of environ- mental change, where the need to ensure sustainability remains a critical challenge to environmental stakeholders (Audet et al., 2015; Giurco and Cooper, 2012; United Nations, 2012). As with any responsible mining operation around the world, implementation of ecosystem-scale ecological reclamation is a regulatory requirement and a major aspect of mine-closure procedures in the Athabasca oil sandsregion(AOSR),Canada.Inthisregion,minerotrophicpeatlands (fens) are the dominant wetland type inpre-mining landscapes (Vitt et al., 1996). Fens such as those found in the region, are known to support vital ecosystem services such as the regulation of nutrient cyclingandcarbonsequestration,andhenceareofmajorimportance to regional and global biogeochemical cycles (Blodau, 2002; Vitt et al., 2000). These peatlands are lost through oil sands exploration (Rooney et al., 2012); however, reclamation efforts are testing the feasibility of re-creating functional and self-sustaining fen ecosys- tems on post-mining landscapes (Daly et al., 2012). Currently, there are two pilot fen projects in the Athabasca oil sands region, which were built by reconfiguration of the post- * Corresponding author. E-mail address: nwai5240@mylaurier.ca (F. Nwaishi). http://dx.doi.org/10.1016/j.apsoil.2015.10.015 0929-1393/ã 2015 Elsevier B.V. All rights reserved. Applied Soil Ecology 98 (2016) 177–194 Contents lists available at ScienceDirect Applied Soil Ecology journal homepage: www.elsevier.com/locate/apsoil
- 2. mined landscape with overburden materials (Ketcheson et al., 2015). To form the fen watershed, a shallow basin created within the constructed landscape was capped with a layer of peat (0.5– 2 m) from a donor site (Price et al., 2010; Wytrykush et al., 2012). In the fen created on the Suncor Energy Inc. site, vegetation was introduced using four revegetation strategies: a seedling treat- ment; a moss layer transfer treatment; a combination of seedling with moss transfer; and a control (no vegetation) (Daly et al., 2012). Following implementation of these revegetation strategies, a comprehensive ecohydrological monitoring program was initiated to assess the development of ecological and hydrological processes in the constructed fen. One major objective of this monitoring program is to identify the revegetation strategy that has the highest potential to facilitate the recovery of ecosystem biogeo- chemical functioning in a constructed fen, and ensure a stable successional trajectory. Evaluating the functional state of the constructed fen through a comprehensive ecohydrological monitoring program is imperative to understanding the reclamation trajectory. An evaluation based on microbially-mediated nutrients cycling processes has been pro- posed as essential for assessing the functional state of the fen (Nwaishi et al., 2015a). The central aspect of this evaluation involves exploring the recovery of biogeochemical transformation function- ing, an integral mechanism of peatland ecosystem functioning. The appropriateness of this concept is grounded on the potential of exploring the sensitivity of microbial-mediated processes to a range of variability in biotic and abiotic conditions (Artz et al., 2008; Jaatinen et al., 2008; Keller et al., 2006; Lin et al., 2012), which can then be used as a criterion to define the functional characteristics that might evolve in a constructed ecosystem (Harris, 2003; Ruiz- Jaen and Aide, 2005), where multiple successional pathways are possible and an endpoint is unknown. Under pristine conditions, biogeochemical transformations support the cycling of various forms of nutrients, and maintain the continuous flow of energy and matter between ecosystem trophic levels. The overall ecosystem biogeochemical cycling is a combination of above-ground (e.g. net ecosystem exchange of CO2 and gross productivity) and below-ground (e.g. nutrient cycling processes and microbial activity) components. Soil microbes are the biological engine of the below-ground component of nutrients cycling processes, and soil edaphic variables such as substrate quality, water chemistry, moisture conditions and peat tempera- ture control microbial activities, and thus the mineralization rate (Updegraff et al., 1995; Westbrook et al., 2006). At the same time, mineralization is often a major control on nutrient turnover, net ecosystem exchange of CO2 and subsequent productivity of surface vegetation in peatlands (Keller et al., 2006). This feedback loop creates a tight coupling between above and below-ground nutrients cycling processes in natural peatlands. Plants serve as the biological link connecting above and below-ground nutrients cycling processes by supporting microbial activities through rhizodeposition, and depending on microbially-mediated nutrient supply for above and below-ground biomass productivity (Bra- gazza et al., 2015; Van Der Heijden et al., 2008; Wardle et al., 2004). Since the biogeochemical functioning of an ecosystem is sustained by the feedback mechanism between above and below-ground processes, assessing the recovery of this mechanism may be a useful criteria for defining the functional state of a constructed fen ecosystem (Wardle and Peltzer 2007; Nwaishi et al., 2015a). Because fen construction is still at an experimental stage, there is a dearth of information on the state of biogeochemical functionality of these new ecosystems. Previous studies have focused on natural peatlands and provided some indications of key controls on processes such as nutrient mineralization (Aerts et al., 1999; Bridgham et al., 1998), organic matter accumulation (Belyea and Clymo 2001) and carbon cycling (Bellisario et al.,1999; Blodau 2002; Keller et al., 2006; Strack et al., 2009). However, it is not yet known if the mechanisms that sustain the feedback loop between above and below-ground processes can be established in constructed fens. Indeed, since the biotic and abiotic controls of nutrients cycling processesare compromisedinpost-mining landscapes (Johnson and Miyanishi 2008; Rooney and Bayley 2011), there is a possibility that nutrient cycling processes will also be modified. For instance, Nwaishi et al. (2015b) showed that the peat soil used as vegetation establishment substrate in the constructed fen has a higher bulk density, and lower organic matter and moisture content than undisturbed sites. This was attributed to drainage and subsequent decomposition of peat before it was transferred to the constructed fen (Nwaishi et al., 2015b). Studies examining the effect of peat degradation on nutrient dynamics suggest that the quality of peat substrateisamajorcontrolonnutrientscyclingprocesses(Updegraff et al., 1995), which could be attributed to the substrate dependency of below-ground microbial communities (Fisk et al., 2003; Andersen et al., 2010a). Hence, the introduction of labile substrates to the constructed fen is crucial to the recovery of microbially-mediated processes. Although revegetation introduces new plant materials into the constructed ecosystem, the different revegetation strategies under trial in the constructed fen will likely have different effects on below-ground microbial community and function (Fisk et al., 2003; Kowalchuk et al., 2002; Zak et al., 2003), and also on available nutrient pools due to differences in vegetation nutrient demands (Aerts et al., 1999). Our study explores the temporal trends in microbially- mediated processes of carbon (C), nitrogen (N) and phosphorus (P) cycling, as quantifiable proxies of biogeochemical transforma- tion function, by building on established knowledge from previous peatland studies (Andersen et al., 2013; Macrae et al., 2013; Strack et al., 2009; Wood et al., 2015). Here, we report nutrient dynamics and edaphic conditions in a constructed fen over the first and second growing seasons post-construction. The specific objectives of the study are: (1) to evaluate the effect of different revegetation treatments on temporal variability in above and below-ground processes, relative to a natural analogue; (2) to determine the effect of revegetation treatments on the strength of the association between above and below-ground processes, and the relationship with environmental variables; and (3) to identify ecosystem processes that can be explored as potential key indicators of biogeochemical functions in a constructed fen. We hypothesize that nutrient dynamics in the moss transfer plots will mirror the processes dominant in natural analogues, while soil nutrient pools will be reduced in seedling plots in response to high nutrient demands by vegetation. Given the recalcitrant nature of the peat substrate, we also hypothesize that following revegetation; microbial nutrient immobilization will be the dominant process, especially in the seedling plots, as microbes will favour the accumulation of biomass. 2. Materials and methods 2.1. Site description and preparation The field research for this study took place at a natural peatland (Poplar fen) and a constructed fen on the Suncor Energy Inc., Millennium lease (Suncor pilot fen). Both are located within the oil sands development area, about 50 km north of Fort McMurray, Alberta. A general description of the study area, and specific information about the two study sites were presented in Nwaishi et al. (2015b). Six monitoring plots (measuring 2 m2 and 10 m apart) that represent typical site conditions were selected in the natural peatland to serve as a reference for the study (REF). In each reference plot, monitoring spots were located at the interface of micro-topographic features (hummocks and hollows) for relative 178 F. Nwaishi et al. / Applied Soil Ecology 98 (2016) 177–194
- 3. comparison with the constructed fen, which lacks microforms. The 3 ha Suncor pilot fen was constructed with 2 m of peat, whose source was from a treed fen similar to the reference fen. The experimental design was laid out as series of blocks and planted in the summer of 2013, using a randomized split-block design with 12 replicates. Each block had four main vegetation plots that were approximately 16 Â17 m and included: (1) seedlings only (SDL); (2) moss layer transfers (MLT); (3) seedlings with moss transfer (SMLT); (4) a control treatment (CTRL). It is worthy to note that the CTRL plots were split into two, to accommodate a seed sowing treatment. However, only the untreated CTRL (unseeded) plot was used as the CTRL for this study. Each vegetation plot was split into four 8 Â 8.5 m sub-plots to test the effects of wood-strand mulch/ weeding treatment, mulch/no-weeding treatment, no-mulched/ weeding, and no-mulched/no-weeding. For the purpose of this study, monitoring was only conducted on the mulch/weeding and no-mulch/weeding sub-plots. We chose to focus on weeded treatments to allow for a relative comparison of our results with natural analogues with similar peatland plant communities. Thus, in all the plots, unwanted species were clipped at the base throughout the seasons and disposed of off-site. Following Poulin et al. (2013), the species targeted in the weeding campaigns included Ranunculus sceleratus,Sonchus arvensis, Typha latifolia, Brassicaceae sp., Chenopodium album, Urtica dioica, Matricaria matricarioides, and Senecio congestus. The harvested moss layer used in the MLT consisted of plant propagules and target moss species that are regionally abundant (Chee and Vitt, 1989), and have exhibited suitable tolerance to oil sandsprocesswater(Pouliotetal.,2012).Thedominantmossspecies that were introduced through the moss layer transfer included; Campylium stellatum and Tomenthypnumspp. Vascular plants were also transferred with the moss layer as rhizomes and seeds present in the transferred materials. The SDL consist of saline (Juncus balticus seedlings, Calamagrostis inexpansa seedling, Triglochin martima) and freshwater (Carex aquatilis, Betula glandulosa, Oxy- coccus microcarpus, Sarricena purpurens) peatland plant species. Some of these seedlings did not establish successfully. Consequent- ly, in the second growing season (May–August, 2014), the SDL and SMLT plots were dominated by C. aquatilis and J. balticus. However, relative to the SDL plots, the SMLT plots host a more diverse plant community. C. aquatilis and the weeds targeted in the weeding campaigns spontaneously established on some of the CTRL plots in the second growing season. Due to the high degree of heterogeneity within the site, 24 monitoring sub-plots, consisting of four treatments and six replicates (n = 6 per plot for each of the 4 treatments) were selected to represent typical site conditions. 2.2. Peat physicochemical properties Comprehensive ecological monitoring of the constructed fen commenced in July 2013, following completion of vegetation introduction. However, before vegetation was planted on the proposed monitoring plots, a set of two shallow peat cores (15 cm deep) were collected side by side for peat physical and chemical analysis. This sampling campaign was repeated again at the end of the first growing season, and beginning and end of the second growing season. In all cases, samples were processed for bulk density, organic matter content, gravimetric moisture content, soil pH, electrical conductivity and extractable nutrients (KCl-extract- able N and water-extractable P) using the standard techniques as described in detail in Nwaishi et al. (2015b). 2.3. Nutrient mineralization and supply rates The rates of net nutrient mineralization and supply to plant roots were measured simultaneously in all selected monitoring plots. The measurements were conducted twice in the first growing season, and three times in the second growing season to capture early (May–June), middle (June–July) and late (July– August) season nutrient dynamics. In the second growing season, monitoring was extended to the natural site (REF) for relative comparison with the constructed fen. Each measurement cycle in both growing seasons lasted approximately 30 days. For the mineralization experiment, two adjacent “paired” peat cores (15 cm deep) were extracted from all the monitoring plots using a PVC pipe that was cut to the specified depth. One of the extracted cores, referred to as the ‘pre-incubation’ core was processed and analyzed for pre-incubation concentrations of extractable ammo- nium (NH4 + ), nitrate (NO3 À ) and soluble reactive phosphorus (SRP) as described by Hart et al. (1994). The second core was used as the incubation core for in-situ net mineralization, following the buried-bag method described by Eno (1960). After the incubation period, cores in the buried bags were recovered and returned to the lab in a cooler filled with ice-packs, and processed for extractable NO3 À , NH4 + and SRP (Hart et al., 1994). Processing of peat samples for extractable nutrients involved the removal of two sub-samples ($ 10 g wet weight) from each sample and placement in a specimen cup. One sub-sample was extracted with 50 ml of 2 M KCl (for determination of NH4 + and NO3 À ), while the second sub-sample was extracted with double de-ionized water (for determination of SRP). The solutions were shaken for 1 h to dissociate the peat, and the extractants were gravity filtered into another specimen cup using a 1 mm porosity filter paper (Whatman no. 42). Filtered extractants from the processed pre-incubation and incubation cores were frozen until analysis at the Biogeochemistry Lab at University of Waterloo (Bran Luebbe AA3, Seal Analytical, Seattle, U.S.A., Methods G-102-93 (NH4 + ), G-109-94 (NO3 À + NO2 À ), and G-103-93 (SRP)). Since the drying of samples can enhance extractable nutrient pools (e.g. Pote et al.,1996), field moist samples were used for nutrient extractions. However, to permit the expression of extractable nutrient pools and net mineralization rates in per unit dry weight of peat (Macrae et al., 2013), the moisture content of the each peat sample was determined. For every incubation period, net nitrification, net ammonification and net P mineralization rates (mg gÀ1 dry peat dayÀ1 ) were estimated as the average difference between the post-incubation concentrations of NO3 À , NH4 + and SRP in the incubated core, and the pre-incubation concentrations of NO3 À , NH4 + and SRP in the pre-incubated cores. Hence, negative values were used to denote nutrient immobilization, while positive values denote net nutrient release to pore water. Net N mineralization rates were estimated as the sum of net nitrification rate and net ammonification rates. Nutrients supply rates were measured using plant root simulator (PRS)TM probes (Western Ag Innovations Inc., Saskatoon, SK). The PRSTM probe is a 10 cm2 resin membrane held in a plastic applicator handle that can be easily inserted into the soil for in-situ measurement of nutrient anions and cations supply to soil solution, when left to incubate for a set period (MacKenzie and Quideau, 2010). Nutrient supply estimates (mg 10 cmÀ2 incubation periodÀ1 ) obtained with the probes integrate the effect of temperature and moisture on nutrient fluxes during the incubation period (Qian and Schoenau 1995, 2002). The resin membrane in the anion probes (orange colour) are positively-charged to simultaneously attract and adsorb all negatively-charged anions, such as NO3 À , phosphate (H2PO4 À , HPO4 2À ), and sulphate (SO4 2À ). Conversely, the membrane in the cation probes (purple colour) is negatively-charged, to simultaneously attract and adsorb all positively-charged cations, such as ammonium (NH4 + ), potassium (K+ ), calcium (Ca2+ ), and magnesium (Mg2+ ). Prior to use in the field, the anion and cation membranes were recharged by saturation with HCO3 À and Na+ ions, respectively. F. Nwaishi et al. / Applied Soil Ecology 98 (2016) 177–194 179
- 4. Thus, when buried, soil ions displace the counter-ions at a rate that depends on their activity and diffusion rate in soil solution (Western Ag Innovations Inc., Saskatoon, SK). The probes were buried vertically to a depth of 15 cm, at four randomly selected spots in each monitoring plot, and left to incubate (concurrent with nutrient mineralization incubations). At the end of each incubation cycle, the probes were recovered from the plots, washed with deionized water, and stored in a cool box, which was returned to Western Ag Innovations Inc., at the end of each growing season for elution with 0.5 M HCl and subsequent nutrient analysis. Western Ag Innovations determines NO3 À , NH4 + , and PO4 3À with the same standard colorimetric technique used in analyzing the mineraliza- tion incubation nutrient concentration. 2.4. Analysis of microbial potential activity and functional diversity The community level physiological profiles (CLPP) of below- ground microbes was explored as a measure of microbial potential activity and functional diversity, using the MicroRespTM system (Campbell et al., 2003), following a protocol modified for peat as in Andersen et al. (2013). It is worthy to note that this method was applied to screen the active portion of microbial communities associated with nutrient cycling processes. The data from this method will be complemented by ongoing molecular characteri- zation study by the authors. Samples for the analysis were collected from all the monitoring plots, within 2 weeks after the commencement of mineralization and ionic resin incubation experiments. Due to logistical challenges, the analysis was done once in the first growing season (during the late season incubation), but was completed three times (early, middle and late) in the second growing season. For each of these sampling campaigns, peat samples were collected at a depth of 0–15 cm at 5 spots within four randomly selected 2 m2 quadrats (adjacent to the buried bags and probes) in each monitoring plot. The samples were homogenised in a Ziploc bag, and kept at 4 C during transfer from the field to the lab, where analysis commenced within a week of sample collection. In the lab, a portion of each peat sample was used to determine the moisture content gravimetrically. For the analysis, each deep well plate (96 wells) contained samples from three monitoring plots (32 each). About 0.30 g of peat was weighed into each well, and incubated for 72 h at 25 C, in the absence of light. After the incubation, 15 carbon sources and water (as a negative control) were added to the peat in each deep well, and replicated twice for each sample. Fourteen (14) out of the 15 carbon sources used in this study included a selection of carbohydrates (fructose, arabinose, glucose, trehalose, N-acetylglucosamine), amino acids (arginine, lysine, alanine) and carboxylic acid (oxalic acid, citric acid, malic acid, g-aminobutyric acid, a-ketoglutarate, cysteine) commonly found in root exudates. Oil sands process water (OSPW) was also used as a carbon source, since it is anticipated to be the main water source from the constituent materials used in constructing the slopes surrounding the fen (Nwaishi et al., 2015a). It is worthy to note that cysteine, oxalic acid and OSPW were not available during the first growing season’s analysis. Detection plates, containing indicator gel made from selected compounds were read in a microplate reader at an absorbance wavelength of 570 nm before and after 6 h of incubation at 25 C. The difference between the absorbance for each deep well after 6 h and at time zero (0) was used to estimate the rates of CO2 production from individual wells. Microbial potential activity for each sample was estimated as the average well colour develop- ment (AWCD) = Spi/n (p), where Spi is the sum of respiration activities induced by response of soil microbes to all substrates and (p) is the number of carbon substrates used. Microbial functional diversity consists of both catabolic richness and evenness (Degens et al., 2001; Zak et al., 1994). Since all the substrates were utilized by soil microbes, we focused on the comparison of catabolic evenness as a measure of functional diversity between plots. Catabolic evenness, the variability in substrate use across the range of substrates tested, was estimated from the respiration response profiles as E = 1/Spi2 (Magurran, 1988; Degens et al., 2001). 2.5. Field measurement of net exchange of CO2 Fluxes of CO2 were measured from all the monitoring plots in the natural and constructed fen. Measurements were made simultaneously with all the nutrient incubation experiment cycles, on a biweekly basis. An average of all the flux measurements obtained for individual plots, during growing season was used to estimate the average daily plot-scale fluxes for the same periods as the other experiments in both growing seasons. In the SDL and SMLT plots, flux measurements were duplicated to capture any difference between the saline (J. balticus) and fresh water (C. aquatilis) vegetation communities. The procedure and instruments used in measuring CO2 fluxes followed the description of Munir et al. (2014). Briefly, a chamber made of clear acrylic, with a dimension of 60 Â 60 Â 30 cm (L ÂW Â H), was placed over a 60 Â 60 cm steel collar, and permanently inserted $20 cm into the ground for the measure- ment. Instantaneous CO2 concentration in the chamber was monitored with a portable infrared gas analyser (PP Systems, USA, EGM—4). To achieve equilibrium in CO2 concentration between measurements, the chamber was lifted from the collar until temperature and CO2 concentrations returned to ambient levels. Two small battery-operated fans were attached to the chamber to continuously circulate the air inside during the measurement. Other measurements taken simultaneously with the flux measurement included the temperature inside the chamber, measured with a thermocouple thermometer (VWR Int., USA); and photosynthetically active radiation (PAR), measured with a quantum sensor (PP Systems, USA) placed at the top of the chamber. All measurements were taken at 15 s intervals for up to 1.75 min. Soil temperature was also measured in all the plots, at the depths of 2, 5, 10, 15, and 20 cm using a thermocouple. Plot-scale net exchange of CO2 (NEps) was calculated using linear change in CO2 concentration inside the chamber headspace with time, as a function of volume, air temperature and pressure inside the chamber, according to the ideal gas law. To obtain an estimate of plot scale respiration (Rps), CO2 flux measurements were also taken in the dark by covering the clear chamber with an opaque shroud. Plot scale productivity (GEPps) was estimated as the difference between NEps and Rps. 2.6. Statistical analyses R (R Development Core Team, 2013) was used to perform all the statistical analyses. Prior to analyses, all the response variables were tested for normality of distribution, and when required, appropriate transformations were implemented to meet the assumptions of parametric statistics. We tested the effect of the mulch treatment on all the measured variables, and only found significant effects on EC. Hence, for data analysis, we treated the mulch and no-mulch plots as replicates of the revegetation treatments. We used a one-way analysis of variance (function “aov”, package “stats” (Chambers et al.,1992)) to test the difference in soil physicochemical properties and environmental variable between the study plots. Linear mixed effect model (function “lme”, package “nlme” (Pinheiro et al., 2011)) was used to test the effect of revegetation treatments (fixed factor) on above and below-ground process over the growing season monitoring cycles (random factor). A multiple comparison test for significant 180 F. Nwaishi et al. / Applied Soil Ecology 98 (2016) 177–194
- 5. difference between the revegetation treatments was conducted on the model output using post hoc analyses (Tukey) built into a general linear hypothesis function (“glht”, package “multcomp” (Bretz et al., 2015)). The temporal variability in above and below-ground processes was also tested with a one-way permutational ANOVAs (function “lm”, package “stats”). Pearson’s correlation analysis was used to analyse the strength of associations (potential biological link) between above and below-ground processes in each revegetation treatment. To identify ecosystem processes that are potential indicators of ecosystem function, we used principle response curve (function “prc”, package “vegan”), which was suggested as an efficient approach to identify drivers of change in the context of ecological restoration (Poulin et al., 2013). Growing season nutrient cycling data, collected in the first 14 months after revegetation of the constructed fen was used to construct the PRC graphs (Fig. 4a and b). Data collection within the 14 months period focused on the frost-free months; as below-ground processes are known to slow during the winter months as a result of changes in edaphic conditions such as temperature (Devito et al., 1999). The significant level for all statistical tests was p 0.05. 3. Results 3.1. Physicochemical properties and environmental variables Relative to the natural fen (REF), peat in the constructed fen plots had significantly lower organic matter (F4, 90 = 27.9, p 0.001), and peat moisture content (F4, 90 = 16.37, p 0.001) but higher bulk density (F4, 90 = 19.79, p 0.001) and EC (F4, 91 = 10.77, p 0.001; Table 1). Post hoc tests indicated that in the constructed fen, re-introduction of vegetation through the moss transfer treatment (i.e. MLT and SMLT) significantly increased the organic matter content (p = 0.008) and reduced bulk density (p = 0.005) over time, especially when combined with the seedling treatment (SMLT). Peat with high organic matter content also had higher moisture content (R = 0.74, p 0.001), lower EC (R = À0.54, p 0.001) and lower bulk densities (R = À0.89, p 0.001). Bulk density correlated negatively with moisture content (R = À0.83, p 0.001) and positively with EC (R = 0.45, p 0.001). Environmental control variables such as, water table depth, peat temperature and PAR showed a similar seasonal trend in all the sites, but also varied between the natural and constructed fen plots (Table 2). Water table depths decreased throughout the growing season, whereas peat temperature increased; however, water table position and temperature were not correlated (p 0.05). Relative to the natural fen, the constructed fen had a deeper water table (F4,133 = 5.18,p 0.001),highertemperature(F4,133 = 11.3, p 0.001) and PAR (F4, 109 = 6.38, p 0.001; Table 2). The lower water table in theconstructedfenwasconsistentforallplotsexcepttheSMLTplots that maintained a shallow water table that was not significantly deeper than that of the natural fen (p 0.05; Table 2). 3.2. Nutrient dynamics Seasonal patterns in NO3ÀÀN dynamics were observed in all the sites. Inthe constructed fen, concentrationof extractable NO3 À pools increased through the growing season but decreased in the REF (Fig. 1a). However, when the three incubations were pooled, extractable NO3 À pools did not differamong the REFand constructed fen treatments. Net nitrification exhibited negative rates (i.e. immobilization or denitrification) at all the sites, except in the REF where dailynet nitrification rates increasedlaterin the growing season (Fig. 1b). This late season increase in net nitrification was reflected in an increase of NO3 À supply in the natural fen (Fig.1c). In contrast to what was observed for extractable NO3 À pools (Fig. 1a), no distinct seasonal pattern was observed for NO3 À supply rates in the constructed fen (Fig. 1c). NO3 À supply rates were greater in the CTRL and MLT plotsrelative totheREFand plotswith vascular plants (SDL and SMLT). A strong correlation (R = 0.82, p 0.001) was observed between NO3ÀÀN cycling processes in the natural fen whereas in the constructed fen, a stronger correlationwas observed between extractable NO3 À pools and net nitrification rates in the SDL (R = À0.95, p 0.001) and SMLT (R = À0.97, p 0.001) plots. NO3ÀÀN cycling processes were comparable across the study sites, but proceeded at significantly different rates at different times over the growing season (F1, 136 = 3.33, p = 0.03). Concentration of extractable NH4 + ÀÀN pool was lower in the constructed fen (Fig. 2d; F4, 131 = 8.77, p 0.001), and did not vary over the growing season except in the SMLT plot, which followed a decreasing seasonal pattern similar tothat observed in REF (Fig.1d). Net ammonification rates showed a decreasing seasonal pattern in the REF, but remained positive for all sites through the growing season. Net ammonification rates were significantly lower in the constructed fen (F4, 131 = 28.94, p 0.001) but did not differ among treatments within the constructed fen. Given that NH4 + dominated total inorganic N (TIN) cycling processes across sites, net N- mineralization(Fig. 2b;F4,131 = 48.22,p 0.001)andconcentrations of TIN pools (Fig. 2a; F4, 131 = 5.51, p 0.001) were higher in the REF andalsodecreasedoverthegrowingseason.Amongtheconstructed fen plots, similar seasonal patterns and higher rates of net N- mineralization were observed in the SDL and SMLT plot (Fig. 2b). Net P mineralization rates (Fig. 2e) did not vary significantly (F4, 131 = 1.83, p 0.05) among the study sites. Seasonal patterns in Table 1 Physicochemical properties (mean Æ std. dev.) of the control (CTRL), moss layer transfer (MLT), seedling (SDL), seedling + moss (SMLT) and the natural reference site (REF) showing organic matter, bulk density, pH and electrical conductivity (EC). The characters a, b, and c are used to indicate significant differences (Tukey HSD test) between treatments. Sites Organic matter (%) Bulk density (g cmÀ3 ) pH EC (ms cmÀ1 ) REF 85 Æ 3c 0.09 Æ 0.01a 6.9 Æ 0.4a 226 Æ 68a MLT 66 Æ 4b 0.24 Æ 0.05bc 7.8 Æ 0.1b 1022 Æ 426b SDL 61 Æ 8ab 0.25 Æ 0.06bc 7.8 Æ 0.2b 1211 Æ 566b SMLT 65 Æ 6b 0.22 Æ 0.03b 7.8 Æ 0.2b 1043 Æ 527b CTRL 57 Æ 12a 0.29 Æ 0.11c 7.8 Æ 0.2b 1226 Æ 656b Table 2 Growing season profiles of environmental variables showing means (Æstd. dev.) of water table, moisture content, average peat temperature and photosynthetically active radiation (PAR) at the beginning (B), middle (M) and late (L) periods of the growth seasons across the study sites. Sites Watertable depth (cm) Moisture content (% Grav.) Average peat temp. 0–15 cm depth ( C) PAR (mmol mÀ2 sÀ1 ) Begin Mid Late Begin Mid Late Begin Mid Late Begin Mid Late REF 0.8 Æ 0.2 À0.2 Æ 0.4 À5.3 Æ 0.5 90 Æ 2 90 Æ 1 89 Æ 1 11.4 Æ 1.7 14.7 Æ 1.2 17.3 Æ 0.7 359 Æ 289 423 Æ 415 267 Æ 126 MLT À11.5 Æ 14 À11.5 Æ 13 À9.4 Æ 13 78 Æ 2 78 Æ 4 79 Æ 2 15.8 Æ 2.3 17.6 Æ 1.2 18.2 Æ 1.8 880 Æ 156 1039 Æ 450 882 Æ 352 SDL À3.7 Æ 5 À6.6 Æ 5 À7.1 Æ 5 78 Æ 2 77 Æ 6 76 Æ 7 17.4 Æ 2.6 17.7 Æ 1.3 18.3 Æ 1.9 578 Æ 333 1039 Æ 438 821 Æ 330 SMLT À1.0 Æ 2 À3.9 Æ 3 À4.4 Æ 4 82 Æ 2 81 Æ 3 77 Æ 7 16.2 Æ 0.6 17.4 Æ 0.5 17.9 Æ 1.4 534 Æ 106 929 Æ 439 787 Æ 386 CTRL À3.7 Æ 5 À7.2 Æ 8 À6.5 Æ 8 76 Æ 7 73 Æ 10 71 Æ 11 15.5 Æ 1.5 17.0 Æ 1.1 18.3 Æ 1.7 465 Æ 309 1057 Æ 307 772 Æ 277 F. Nwaishi et al. / Applied Soil Ecology 98 (2016) 177–194 181
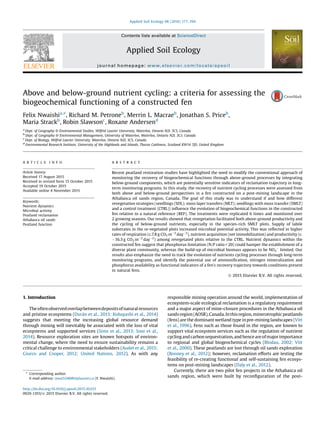
- 6. the concentration of SRP pools (Fig. 2d) were similar between the natural fen and the plots that received the moss treatment, but different from the CTRL and SDL plots. Concentrations of SRP were significantly higher (F4, 131 = 4.03, p 0.001) in the REF and SMLT than all the other study plots. The daily supply rate of SRP (Fig. 2f) was negligible in the constructed fen plots, and was significantly higher (F4, 131 = 24.67, p 0.001) in the natural fen. There was no significant association (R = 0.02, p 0.05) between P cycling processes in all the sites. 3.3. CO2 exchange and plot scale productivity Average seasonal NEEps rates differed significantly among the study sites (Table 3; F4, 107 = 2.71, p = 0.03). However, post hoc tests µgNO3g-1drysoil CTRL B M L MLTMLT B M L SDL B M L SMLT B M L REF B M L a) Extractable NO3 - 05101520 a a a a a µgNO3g -1 drysoilday -1 CTRL B M L MLT B M L B M L SDL SMLT B M L REF B M L b) Net Nitrification -0.4-0.20.00.20.4 a a a a a Fig. 1. Growing season dynamics of extractable NO3 À (a) and NH4 + (d) pools (mean Æ std. err.), daily net nitrification rate (b) and ammonification rates (e; mean Æ std. err.), and daily NO3 À (c) and NH4 + (f) supply rates (mean Æ std. err.) across the control (CTRL), moss layer transfer (MLT), seedling (SDL), seedling + moss (SMLT) and the natural reference site (REF) in the beginning (B), middle (M) and late (L) periods of the growth seasons. The characters a, b, and c are used to indicate significant differences (Tukey HSD test) between treatments. 182 F. Nwaishi et al. / Applied Soil Ecology 98 (2016) 177–194
- 7. showed that the difference between NEEps of CTRL and SMLT (p = 0.009, Table 3) was a major source of variation within the constructed fen. Relative to the CTRL plots, re-introduction of vegetation in the constructed fen significantly increased the NEEps sink potential and consequently, higher average seasonal rates of Rps and GEPps, especially in the SMLT plots (Table 3; p 0.001). Generally, among the constructed fen plots, average seasonal rates of NEEps, Rps and GEPps increased with an increase in vegetation density and diversity as follows: SMLT SDL MLT CTRL. CTRL B M L MLT B M L SDL B M L SMLT B M L REF B M L c) NO3 Supply Rate 0.00.10.20.30.40.5 a a a a a µgNO310cm- 2 day -1 CTRL B M L MLT B M L SDL B M L SMLT B M L REF B M L d) Extractable NH4 0 102030405060 a a a a b µgNH4g -1 drysoil Fig. 1. (Continued) F. Nwaishi et al. / Applied Soil Ecology 98 (2016) 177–194 183
- 8. 3.4. Microbial potential activity and functional diversity The microbial potential activity was not significantly different between the study sites (Fig. 3a; F4, 107 = 1.33, p 0.05), but it varied significantly over the growing season (F1, 112 = 10.15, p = 0.002). Apart from the MLT plot, microbial potential activity in all of the other monitoring sites decreased linearly over the growing season (Fig. 3a). However, among the sites that followed a similar linear decrease in microbial potential activity, the CTRL plots had the lowest activity rate at the early season peak (Fig. 3a). Microbial potential activity was positively correlated with concentrations of extractable N (R = 0.43, p 0.036) and SRP (R = 0.65, p 0.001) in CTRL B M L MLT B M L SDL B M L SMLT B M L REFREF B M L e) Net Ammonification 0246810 a ab b b c µgNH4 g -1 drysoilday -1µgNH4 10cm -2 day -1 CTRL B M L a MLT B M L SDL B M L SMLT B M L REFREF B M L f) NH4 Supply Rate 0.000.050.100.150.200.250.30 a a a b Fig. 1. (Continued) 184 F. Nwaishi et al. / Applied Soil Ecology 98 (2016) 177–194
- 9. CTRL B M L MLT B M L SDL B M L SMLT B M L REF B M L a) Total Inorganic N 010203040506070 a a a a b µgNg -1 drysoil B M L CTRL MLT B M L B M L SDL SMLT B M L REF B M L b) Net N-mineralization 02468 a ab b b c µgNg -1 drysoilday -1 Fig. 2. Growing season’s dynamics of total inorganic N (a) and SRP (d) pools (mean Æ std. err.), daily net N (b) and P (e) mineralization rates (mean Æ std. err.), and daily N (c) and P (f) supply rates (mean Æ std. err.) across the control (CTRL), moss layer transfer (MLT), seedling (SDL), seedling + moss (SMLT) and the natural reference site (REF) in the beginning (B), middle (M) and late (L) periods of the growth seasons. The characters a, b, and c are used to indicate significant differences (Tukey HSD test) between treatments. F. Nwaishi et al. / Applied Soil Ecology 98 (2016) 177–194 185
- 10. the constructed fen, but with only SRP in the natural fen (R = 0.52, p = 0.026). Microbial functional diversity, decreased significantly over time in the constructed fen plots (F1, 112 = 11.3, p 0.001), but remained stable throughout the growing season in the natural fen (Fig. 3b). 4. Discussion 4.1. Impact of revegetation strategies on the recovery edaphic variables A major challenge in reclamation is recreating suitable edaphic conditions such as the peat physical properties that support bc CTRL B M L MLT ac B M L ab SDL B M L B M L SMLT c REF B M L c) TIN Supply Rate 0.00.10.20.30.4 a µgN10cm -2 day -1 a CTRL B M L ab MLT B M L ab SDL B M L b SMLTSMLT B M L b REF B M L d) SRP 0.00.51.01.52.0 µgPg -1 drysoil Fig. 2. (Continued) 186 F. Nwaishi et al. / Applied Soil Ecology 98 (2016) 177–194
- 11. ecosystem processes of natural analogues (Audet et al., 2015). Consistent with the findings of a previous study (Nwaishi et al., 2015b), results here confirm that two growing seasons after revegetation of the constructed fen, characteristics of the peat (e.g. moisture content, organic matter and bulk density) still vary significantly from that of the natural fen. The key role of these peat characteristics in nutrient transformation processes (Updegraff et al., 1995) implies that poor peat quality would likely influence the biogeochemical functioning of the constructed fen. However, our finding that organic matter content and bulk density in MLT and SMLT treatments evolved towards conditions at REF is in line with the idea that revegetation should facilitate the recovery of natural-like peat characteristics (Nwaishi et al., 2015b). Thus, introducing fragments from a natural peatlands in reclamation such as in our moss transfer plots, appears to be an efficient means of facilitating the recovery of a functional soil a CTRL B M L a MLT B M L a SDL B M L a SMLT B M L a B M L REF e) Net P-Mineralization -0.020.000.020.040.060.080.10 µgPg -1 drysoilday -1 a CTRL B M L a MLT B M L a SDL B M L a SMLT B M L b REF B M L f) P Supply Rate 0.000.050.100.150.20 µgP10cm -2 day -1 Fig. 2. (Continued) F. Nwaishi et al. / Applied Soil Ecology 98 (2016) 177–194 187
- 12. (Bradshaw, 1997; Mackenzie and Naeth, 2010). Similar to other studies (Bradshaw 2000; Tordoff et al., 2000), the improved soil characteristics observed in the SMLT plots supports the idea that artificially introducing plants can complement the re-establish- ment and influence of transferred live vegetation (moss) by providing structural protection and suitable microclimate, espe- cially under extreme edaphic conditions such as those present in the constructed fen (Nwaishi et al., 2015b). Our data shows that the mosses in the MLT plots could not sustain a near surface water table, which could be attributed to the inability of regenerating mosses to sustain a strong capillary rise of water and efficient water retention capacity under degraded peat substrate (McCarter and Price, 2013). However, in the SMLT plots where MLT was combined with SDL, we observed a modulation of near surface water table (Table 2), which is essential to create the redox conditions that support efficient nutrient cycling in natural analogues (Nwaishi et al., 2015a). 4.2. Belowground processes in the natural and constructed fens Revegetation strategies implemented in the constructed fen influenced belowground processes in different ways, and these processes also varied from the natural fen. Our study suggest that the revegetation of degraded peat facilitates the supply of photosynthetically-derived carbon sources (through rhizodeposi- tion), which stimulates belowground microbial activity, and subsequent increase in nutrient uptake (Andersen et al., 2013; Elliott et al., 2015). For instance, relative to the natural fen, net ammonification (the process of transforming organic-bound N to NH4 + ) was likely limited by substrate constraints (recalcitrant peat) in the constructed fen. However, the input of fresh carbon by the rhizosphere in plots re-vegetated with seedling treatments (SDL and SMLT) could over-ride the substrate limitation, resulting in net ammonification rates that are significantly higher (p = 0.003) than rates observed in the un-vegetated CTRL. This is similar to what was reported in studies looking at microbial processes in oil sand sites reclaimed using a mixture of peat and mineral soil as a soil capping layer (peat-mineral mix, PMM), where nitrogen in the pore water and roots derived from the PMM were the most important stimulants for microbial growth (Dimitriu et al., 2010; Noah et al., 2014) In the natural fen, seasonal variations in the rate and direction of N-cycling processes (Fig. 2) suggests that belowground processes change from anaerobic dominance (e.g. ammonification) to become aerobically favourable later in the season, in response to redox conditions driven by water table fluctuation (Table 2). Lower rates of microbial potential activity following seasonal water table drawdown adds support to a dominance of anaerobic microbial nutrient transformation processes in natural peatlands (Croft et al., 2001; Andersen et al., 2006). Although anaerobic N-mineralization also dominated N-cycling processes in the constructed fen, NO3 À mineralization (nitrification) rates did not increase (Fig. 1b) as redox conditions became aerobically favourable with water table drawdown later in the growing season (Table 2). This could be attributed to a dominance of ammonifying bacteria biomass over nitrifying bacteria in the exposed catotelm peat, which is anticipated due to absence of the original acrotelm peat (a niche for nitrifying bacteria) in the constructed fen (Nwaishi et al., 2015b). Given that microbial catabolic evenness in the constructed fen (Fig. 3b) correlated positively with water table drawdown (Table 2), it can be argued that the catabolic potential may be adversely affected by temporal variation in edaphic conditions due to low functional diversity (Allison and Martiny, 2008) in the reclamation plots. Further evaluation of the microbial community through molecular approaches will help connect belowground processes with changes in key groups of organisms that may be associated with disturbances typically found in post oil–sand landscapes, such as potential contaminants (e.g. poly-aromatic hydrocarbons) (Noah et al., 2014). The difference in NO3 À supply rates between the CTRL and seedling treatment plots (SDL and SMLT; Fig. 1c) suggests a higher competitive demand between vegetation and microbial commu- nities in the rhizosphere of these plots. Despite the seasonal decline in nitrification rate (Fig. 1b), we observed an increasing concentration of extractable NO3 À in the constructed fen later in the growing season (Fig. 1a), which is not reflected in the supply rate (Fig. 1c). Indeed, the strong positive correlation between late season spikes in extractable NO3 À pools and immobilization of NO3 À in the constructed fen concurs with our hypothesis that following revegetation, microbial nutrient immobilization will be a dominant process (Weintraub and Schimel, 2003; Westbrook and Devito, 2004). This is especially true in the seedling plots, as microbes will favour biomass build-up. Similarly, studies looking at microbial communities in degraded peat have shown that the presence of biological drivers such as rhizosphere effect reactivates microbial activity, which leads to subsequent immobilization of available N pools and development of an active microbial biomass (Andersen et al., 2006; Artz, 2009; Fisk et al., 2003; Urbanová et al., 2011). Consistent with these studies, our results suggest that interactions between the chemical and biological component of belowground processes is central to the development of a functional microbial community, without which the recovery of biogeochemical functioning in the constructed fen will not be possible. We suggest that this functional recovery can be delineated as the time in subsequent growing seasons, from which microbial immobilization of NO3 À is compensated by increased mineralization rate, leading to the release of NO3 À for vegetative uptake. The ratio of NH4 + /NO3 À has been shown to be higher in natural peatlands, while lower ratios have been reported as a consequence of accelerated nitrification associated with peatland disturbances (Macrae et al., 2013; Nwaishi et al., 2015b; Elliott et al., 2015). Therefore, the balance between NH4 + /NO3 À concentrations can be explored as a functional indicator of the status of N-cycling in the constructed fen. Unlike the low ratio previously reported by Nwaishi et al. (2015b), our results indicate that the constructed fen now has a higher NH4 + /NO3 À ratio, which is not significantly different from that of the natural fen (F4, 131 = 1.20, p 0.05). This balance of inorganic-N ratio may be explained by either the reduction of NO3 À following rewetting of the constructed fen or the high assimilation of NO3 À in the rhizosphere of vascular plants (Limpens et al., 2004; Wiedermann et al., 2009), which are the dominant plant species in the constructed fen. Although N- mineralization rates were very low in the constructed fen plots (Fig. 2b), the concentration of N available for plant assimilation was similar to that of the natural fen, where higher mineralization was observed (Figure 2c). The latter suggest the possibility of an Table 3 Mean (Æstd. err.) growing season’s measurement of net ecosystem exchange of CO2 (NEE), ecosystem respiration (ER) and gross ecosystem productivity (GEP) across the control (CTRL), moss layer transfer (MLT), seedling (SDL), seedling + moss (SMLT) and the natural reference site (REF). Negative values indicate CO2 removal from the atmosphere, while positive means release to the atmosphere. The characters a, b, and c are used to indicate significant differences (Tukey HSD test) between treatments. Sites NEE ER GEP g CO2 mÀ2 dayÀ1 REF À7.4 Æ 2.5ab 13.6 Æ 1.9c À21.0 Æ 2.7a MLT À7.5 Æ 2.0ab 5.1 Æ 1.1b À12.6 Æ 2.9ab SDL À7.8 Æ 1.4ab 7.4 Æ 1.1ab À15.2 Æ 2.3ab SMLT À10.3 Æ 1.6b 10.9 Æ 1.7ac À21.2 Æ 3.1a CTRL À1.0 Æ 0.7a 3.9 Æ 1.0b À4.9 Æ 1.6b 188 F. Nwaishi et al. / Applied Soil Ecology 98 (2016) 177–194
- 13. exogenous N source overriding microbial N immobilization in the constructed fen (Gerdol et al., 2006). A study looking at exogenous N deposition in the Athabasca Oil Sands Region has shown that terrestrial sites within $30 km radius from the main oil sands developments are significantly affected by industrial contributions to atmospheric NO3 À and NH4 + deposition (Proemse et al., 2013). The location of the constructed fen makes it susceptible to elevated deposition of inorganic N from adjacent industrial sites, which will consequently affect the inorganic N ratio and the balance of N cycling processes. The reclamation approach used in the constructed fen involved the removal of the upper (30 cm) peat horizon to avoid complicating the vegetation re-introduction experiment with seedbanks transferred from the donor to the constructed fen. Considering that higher P concentrations are usually found in the lost upper peat horizon (Andersen et al., 2006; Damman, 2014; Litaor et al., 2005), we anticipated a low concentration of P in the constructed fen. Conversely, our results shows that re-introduction of live moss and vascular plant rhizomes as part of MLT increased the average seasonal concentration of SRP, especially in the SMLT plot, which did not vary significantly from the natural fen. Consistent with previous studies (Andersen et al., 2013; Chapin et al., 2003), P mineralization was negligible in both the natural and constructed fen over the two study periods. However, the concentration of SRP available for plant root assimilation was significantly higher in the natural fen (Fig. 2f), where the upper peat layer is still intact, and the chance of leaching is reduced by a stable water table. 4.3. Effect of revegetation strategies on above and below-ground linkages The role of plants as the biological link between above and below-ground processes have been hypothesized and tested in ecological studies (Kowalchuk et al., 2002; Wardle et al., 2004; Wardle Peltzer, 2007). In the species-rich natural fen, a strong positive association between above-ground plant productivity and below-ground microbial activities were observed (Table 4). Nitrification and P availability are also paramount to the significant correlation between above and below-ground processes in the natural fen. Interestingly, these below-ground processes are both known to be limited in natural peatlands (Devito et al., 1999; Chapin et al., 2003). Thus, peatlands found in the vicinity of industrial setting might experience an increase in productivity linked with greater availability of nutrients that are usually found to be limited in natural peatlands. Relative to CTRL, the re-vegetated plots in the constructed fen showed stronger correlations between above-ground productivity AWCD CTRL B M L MLT SDL SMLT REF a) Microbial Potential Activity 0103050 b) Catabolic Evenness 05 101520 B M LB M LB M LB M L B M L B M LB M L B M L B M L CTRL MLT SDL SMLT REF a a a a b a a a a a 1/Simpsonindex Fig. 3. Patterns of (a) Microbial potential activity (mean Æ std. err.) and (b) catabolic evenness (mean Æ std. err.) during the growing seasons across the control (CTRL), moss layer transfer (MLT), seedling (SDL), seedling + moss (SMLT) and the natural reference site (REF) in the beginning (B), middle (M) and late (L) periods of the growth seasons. The characters a, b, and c are used to indicate significant differences (Tukey HSD test) between treatments. F. Nwaishi et al. / Applied Soil Ecology 98 (2016) 177–194 189
- 14. and below-ground nutrient cycling processes. The significant positive correlation between above-ground productivity and N cycling processes in the re-vegetated plots (Table 4) suggest that higher productivity, especially in the seedling plots, is associated with N availability. However, P availability significantly correlated with above-ground processes in plots where mosses were established. Similar patterns were reported by studies looking at N and P availability in species-rich ecosystems, which suggested that the P requirements of mosses are larger than those of vascular plants; hence P limitation and N availability decreases above- ground productivity of mosses and may alter the plant species composition to the benefit vascular plants (Aerts et al., 1999; Niinemets Kull, 2005; Andersen et al., 2006; Limpens et al., 2011). The highest productivity observed in the vascular plant plots (Table 3), with N:P ratios greater than 20 (data not shown) indicates that the nutrient status in the constructed fen is more favourable to vascular plant establishment. In agreement with findings from restoration studies on post-harvested peatlands in Eastern Canada (Andersen et al., 2010b), our results also suggest that the availability of P will be a good indicator of the successful re-establishment of a species-rich plant community in the constructed fen, but P fertilization might be required to enhance above-ground productivity of mosses at the initial stage of revegetation. 4.4. Temporal changes in below-ground processes and functional trajectory of the constructed fen Principal response curves (PRC) have been suggested as an effective approach for tracking the trajectory of reclaimed sites relative to a natural reference in ecological monitoring (Poulin et al., 2013; Andersen et al., 2010b). We used PRC analyses to summarize the dominant temporal patterns in below-ground processes, and also to identify the key processes that can be used as functional indicator of ecosystem trajectory. From the first axis of the RDA (Fig. 4a), it appears that ammonification (Fig. 1e) followed by N-mineralization (Fig. 2b) and P supply (Fig. 2f) were the dominant processes driving the temporal differences between the natural and constructed fen plots over the period studied. The observed differences increased at the middle of the growing seasons, which corresponds with the summer peak, when below- ground processes have been reported to be most active (Andersen et al., 2010a, 2013; Macrae et al., 2013). Our results also shows that the vegetated plots, especially the SMLT were on a closer trajectory to the natural fen than the CTRL, and seemingly became more comparable to each other towards the end of the second growing season (converging lines). Given that the peak of the difference between the constructed fen and the natural fen is higher in the first than the second growing season, in the future, it will be interesting to see if the trajectory of these dominant processes in the vegetated plots continues a downward trend towards the natural reference, or if it will remain different than the reference over time, as was observed in other ecological restoration studies (Elliott et al., 2015; Mastrogianni et al., 2014). The second axis of the RDA (Fig. 4b) highlights the secondary temporal trajectory of below-ground processes in the constructed fen relative to the natural fen. The PRC shows that relative to the REF, the concentration of SRP in the nutrient pools is increasing over time in the constructed fen plots, while N supply processes (NO3, NH4, and TIN) are decreasing. Considering the variability in timing of the treatment lines crossing through the reference point (7 months for SMLT, 8 for SDL,10 for CTRL and 12 for MLT), it can be hypothesized that the higher demand for N in vascular plant- dominated plots could be driving a reduction in the N:P ratio over time, leading to the increasing SRP concentration in the nutrient pools. Lowering of the water table and subsequent redox conditions could also be contributing to the late season increase in SRP concentration (Shenker et al., 2005; Zak et al., 2010). With the exception of the CTRL, convergence of the trajectory lines for all the re-vegetated plots at the beginning and end of this preliminary monitoring highlight the influence of vegetation on the recovery of below-ground process. Given that PRC results are greatly Table 4 Pearson’s correlation coefficients for significantly correlated interactions between above and below-ground processes in the the control (CTRL), moss layer transfer (MLT), seedling (SDL), seedling + moss (SMLT) and the natural reference site (REF). Vegetation treatments Aboveground Belowground SRP P supply rate Microbial activity Nitrification rate Extractable NO3 NO3 supply rate NH4 supply rate TIN supply rate REF NEE 0.53a 0.61b 0.65b 0.55b GEP 0.74c 0.75c ER À0.46a 0.47a SMLT NEE 0.41a À0.52b 0.56b 0.61b 0.68c 0.73c GEP À0.59c 0.61b 0.62c 0.70c 0.74c ER 0.59c À0.58c À0.56b À0.64c À0.68c SDL NEE GEP 0.55b 0.64c 0.66c ER À0.58b À0.74c À0.73c MLT NEE À0.49a 0.52b GEP À0.55b 0.55b ER 0.55b À0.47a CTRL NEE À0.51a GEP ER a Significant at the 0.05 probability level. b Significant at the 0.01 probability level. c Significant at the 0.001 probability level. 190 F. Nwaishi et al. / Applied Soil Ecology 98 (2016) 177–194
- 15. influenced by the choice of reference site, in the future, the identification of potential functional indicators will be most efficient if data from more than one reference site within the study region is used in constructing the PRC plots (Suganuma and Durigan, 2015) 5. Conclusion and recommendations for future monitoring of constructed fens By exploring the temporal patterns in above and below-ground processes, this study highlights the importance of integrating these processes in reclamation monitoring. Re-introduction of 2 4 6 8 10 12 14 -1.5-1.0-0.50.00.51.0 Months after revegetation PRCaxis1(51.59%) Ammonification Mineralization PSR eraliMine NH4SR PSR NH4S SRP EXNH4EXN TIN TINSRTINSR EXNO3EXNO3 Nitrification PMineralizationPMi NO3SR Treatment REF CTRL MLT SDL SMLT 2 4 6 8 10 12 14 -1.5-1.0-0.50.00.51.0 Months after revegetation PRCaxis2(14.67%) NO3SR NH4SR TINSRTINS PSRPSR TINTIN EXNO3 TIN EXNO3 EXNH4 Nitrification PMineralization Mineralization PMineralization Mineralization Ammonification SRP Treatment REF CTRL MLT SDL SMLT a b Fig. 4. PRC for the first axis of RDA testing the effect of site  time on below-ground processes and showing (a) the dominant temporal trajectory in nutrient cycling processes and (b) representing a secondary temporal trajectory in nutrient cycling processes across the control (CTRL), moss layer transfer (MLT), seedling (SDL), seedling + moss (SMLT) relative to the zero line, which represents the natural reference site (REF). F. Nwaishi et al. / Applied Soil Ecology 98 (2016) 177–194 191
- 16. vegetation through the combination of moss layer transfer and seedling establishment improved the peat quality (e.g. higher organic matter) relative to the non-vegetated CTRL plots. The improved peat quality and associated supply of labile substrates reactivated microbial communities driving below-ground process- es, which was reflected in higher rates of above and below-ground respiration in plots with most diverse plant species, specifically the SMLT plots. Higher rates of plant productivity, nutrient cycling and acquisition observed in the SMLT plots could be explained as the key responses commonly associated with species-rich plant communities in restoration experiments. Thus, the biological link between above and below-ground processes are most likely to be established in plots where fresh substrate supply through rhizodeposition and/or application of a live moss layer is capable of reactivating dominant microbial-mediated processes. From a management perspective, we recommend that future ecological monitoring aimed at tracking the recovery of biogeo- chemical functions in constructed fens should initially focus on the state of microbial-mediated nutrient cycling processes before progressing to their output (e.g. nutrient pools) and subsequent above-ground productivity. Based on the findings of this study, ammonification and N-mineralization present potential functional indicators of a fen’s trajectory towards conditions present in a natural reference. Finally, timing of monitoring within the growing season is also important to capture the range of seasonal variabilities, while a continuous multi-year monitoring will be useful to identifying inter-annual variabilities for predicting long- term trajectory of biogeochemical functions in a constructed fen. Aknowledgements We acknowledge that funding for this project was provided through an NSERC Collaborative Research and Development Grant (CRD), # 418557-2011, entitled “Evaluating the success of fen creation in the post oil sands landscape” with funding from Suncor Energy Inc., Shell Canada Ltd., Imperial Oil Resources Ltd. This initiative is a part of a Joint Industry Project convened under Canada’s Oil Sands Innovation Alliance (COSIA), Land Environ- mental Priority Area (EPA) led by Suncor Energy with Shell Canada and Imperial Oil. Special thanks to all the staff and graduate students at the Environmental Reseach Institute, Thurso Scotland for hosting the corresponding author during data analyses, Vito Lam for assistance with nutrient analyses, Vinay Date for assistance with microbial assays, and finally Adam Green and Kimberly Murray for field assistance. References Aerts, R., Verhoeven, J.T.A., Whigham, D.F., 1999. Plant-mediated controls on nutrient cycling in temperate fens and bogs. Ecology 80, 2170–2181 10.1890/ 0012-9658080[2170:PMCONC]2.0.CO;2. Allison, S.D., Martiny, J.B.H., 2008. Colloquium paper: resistance, resilience, and redundancy in microbial communities. Proc. Natl. Acad. Sci. U. S. A. 105 (suppl), 11512–11519. doi:http://dx.doi.org/10.1073/pnas.0801925105. Andersen, R., Francez, A.J., Rochefort, L., 2006. The physicochemical and microbiological status of a restored bog in Québec: identification of relevant criteria to monitor success. Soil Biol. Biochem. 38, 1375–1387. doi:http://dx.doi. org/10.1016/j.soilbio.2005.10.012. Andersen, R., Grasset, L., Thormann, M.N., Rochefort, L., Francez, A.J., 2010a. Changes in microbial community structure and function following Sphagnum peatland restoration. Soil Biol. Biochem. 42, 291–301. doi:http://dx.doi.org/10.1016/j. soilbio.2009.11.006. Andersen, R., Rochefort, L., Poulin, M., 2010b. Peat, water and plant tissue chemistry monitoring: a seven-year case-study in a restored peatland. Wetlands 30, 159– 170. doi:http://dx.doi.org/10.1007/s13157-009-0015-0. Andersen, R., Wells, C., Macrae, M., Price, J., 2013. Nutrient mineralisation and microbial functional diversity in a restored bog approach natural conditions 10 years post restoration. Soil Biol. Biochem. 64, 37–47. doi:http://dx.doi.org/ 10.1016/j.soilbio.2013.04.004. Artz, R., 2009. Microbial community structure and carbon substrate use in northern peatlands. Carbon Cycl. North. Peatlands 111–129. Artz, R.R.E., Chapman, S.J., Siegenthaler, A., Mitchell, E.A.D., Buttler, A., Bortoluzzi, E., Gilbert, D., Yli-Petays, M., Vasander, H., Francez, A.J., 2008. Functional microbial diversity in regenerating cutover peatlands responds to vegetation succession. J. Appl. Ecol. 45, 1799–1809. doi:http://dx.doi.org/10.1111/j.1365- 2664.2008.01573.x. Audet, P., Pinno, B.D., Thiffault, E., 2015. Reclamation of boreal forest after oil sands mining: anticipating novel challenges in novel environments. Can. J. For. Res. 45, 364–371. doi:http://dx.doi.org/10.1139/cjfr-2014-0330. Bellisario, L.M., Bubier, J.L., Moore, T.R., Chanton, J.P., 1999. Controls on CH4 emissions from a northern peatland. Glob. Biogeochem. Cycles 13, 81–91. doi: http://dx.doi.org/10.1029/1998GB900021. Belyea, L.R., Clymo, R.S., 2001. Feedback control of the rate of peat formation. Proc. Biol. Sci. 268, 1315–1321. doi:http://dx.doi.org/10.1098/rspb.2001.1665. Blodau, C., 2002. Carbon cycling in peatlands—a review of processes and controls. Environ. Rev. doi:http://dx.doi.org/10.1139/a02-004. Bradshaw, A., 1997. Restoration of mined lands—using natural processes. Ecol. Eng. doi:http://dx.doi.org/10.1016/s0925-8574(97) 00022-0. Bradshaw, A., 2000. The use of natural processes in reclamation – advantages and difficulties. Landsc. Urban Plan. 51, 89–100. doi:http://dx.doi.org/10.1016/ s0169-2046(00)00099-2. Bragazza, L., Bardgett, R.D., Mitchell, E.A.D., Buttler, A., 2015. Linking soil microbial communities to vascular plant abundance along a climate gradient. New Phytol. 1175–1182. Bretz, F., Westfall, P., Heiberger, R.M., Schuetzenmeister, A., Scheibe, S., 2015. Multiple comparison using R (Package “multcomp”). CRC Press. Bridgham, S.D., Updegraff, K., Pastor, J., 1998. Carbon, nitrogen, and phosphorus mineralization in northern wetlands. Ecology 79, 1545–1561. doi:http://dx.doi. org/10.1890/0012-9658079[1545:CNAPMI]2.0. CO;2. Campbell, C.D., Chapman, S.J., Cameron, C.M., Davidson, M.S., Potts, J.M., 2003. A rapid microtiter plate method to measure carbon dioxide evolved from carbon substrate amendments so as to determine the physiological profiles of soil microbial communities by using whole soil a rapid microtiter plate method to measure carbon dioxide ev. Appl. Environ. Microbiol. 69, 3593–3599. doi:http:// dx.doi.org/10.1128/AEM.69.6.3593. Chambers, J.M., Freeny, A., Heiberger, R.M., 1992. Analysis of variance; designed experiments. In: Chambers, J.M., Hastie, T.J. (Eds.), Chapter 5 of Statistical Models in S. Wadsworth Brooks/Cole, pp. 145–193. Chapin, C.T., Bridgham, S.D., Pastor, J., Updegraff, K., 2003. Nitrogen, phosphorus, and carbon mineralization in response to nutrient and lime additions in peatlands. Soil Sci. doi:http://dx.doi.org/10.1097/01.ss.0000075286.87447.5d. Chee, W.-L., Vitt, D.H., 1989. The vegetation, surface water chemistry and pear chemistry of moderate-rich fens in Central Alberta, Canada. Wetlands 9, 227– 261. Croft, M., Rochefort, L., Beauchamp, C.J., 2001. Vacuum-extraction of peatlands disturbs bacterial population and microbial biomass carbon. Appl. Soil Ecol. 18, 1–12. doi:http://dx.doi.org/10.1016/s0929-1393(01) 00154-8. Daly, C., Price, J., Rezanezhad, F., Pouliot, R., Rochefort, L., Graf, M.D., 2012. Initiatives in oil sand reclamation: considerations for building a fen peatland in a post- mined oil sands landscape. In: Vitt, D.H., Bhatti, J.S. (Eds.), Restoration and Reclamation of Boreal Ecosystems: Attaining Sustainable Development. Cambridge University Press, New York, New York, pp. 179–201. Damman, A., 2014. Distribution and movement of elements in ombrotrophic peat bogs. Oikos 30, 480–495. doi:http://dx.doi.org/10.2307/3543344. Degens, B.P., Schipper, L.A., Sparling, G.P., Duncan, L.C., 2001. Is the microbial community in a soil with reduced catabolic diversity less resistant to stress or disturbance? Soil Biol. Biochem. 33, 1143–1153. doi:http://dx.doi.org/10.1016/ s0038-0717(01)00018-9. Devito, K.J., Westbrook, C.J., Schiff, S.L., 1999. Nitrogen mineralization and nitrification in upland and peatland forest soils in two Canadian shield catchments. Can. J. For. Res. doi:http://dx.doi.org/10.1139/x99-148. Dimitriu, P.A., Prescott, C.E., Quideau, S.A., Grayston, S.J., 2010. Impact of reclamation of surface-mined boreal forest soils on microbial community composition and function. Soil Biol. Biochem. 42, 2289–2297. doi:http://dx.doi.org/10.1016/j. soilbio.2010.09.001. Durán, A.P., Rauch, J., Gaston, K.J., 2013. Global spatial coincidence between protected areas and metal mining activities. Biol. Conserv. 160, 272–278. doi: http://dx.doi.org/10.1016/j.biocon.2013.02.003. Elliott, D.R., Caporn, S.J.M., Nwaishi, F., Nilsson, R.H., Sen, R., 2015. Bacterial and fungal communities in a degraded ombrotrophic peatland undergoing natural and managed re-vegetation. PLoS One 10, e0124726. doi:http://dx.doi.org/ 10.1371/journal.pone.0124726. Eno, C.F., 1960. Nitrate production in the field by incubating the soil in polyethylene bags1. Soil Sci. Soc. Am. J. doi:http://dx.doi.org/10.2136/ sssaj1960.03615995002400040019x. Fisk, M.C., Ruether, K.F., Yavitt, J.B., 2003. Microbial activity and functional composition among northern peatland ecosystems. Soil Biol. Biochem. 35, 591– 602. doi:http://dx.doi.org/10.1016/s0038-0717(03) 00053-1. Gerdol, R., Bragazza, L., Brancaleoni, L., 2006. Microbial nitrogen cycling interacts with exogenous nitrogen supply in affecting growth of Sphagnum papillosum. Environ. Exp. Bot. 57, 1–8. doi:http://dx.doi.org/10.1016/j. envexpbot.2005.03.005. Giurco, D., Cooper, C., 2012. Mining and sustainability: asking the right questions. Miner. Eng. 29, 3–12. doi:http://dx.doi.org/10.1016/j.mineng.2012.01.006. Harris, J.A., 2003. Measurements of the soil microbial community for estimating the success of restoration. Eur. J. Soil Sci. 54, 801–808. doi:http://dx.doi.org/ 10.1046/j.1351-0754.2003.0559.x. 192 F. Nwaishi et al. / Applied Soil Ecology 98 (2016) 177–194
- 17. Hart, S.C., Nason, G.E., Myrold, D.D., Perry, D.A., 1994. Dynamics of gross nitrogen transformations in an old-growth forest: the carbon connection. Ecology 75, 880–891. doi:http://dx.doi.org/10.2307/1939413. Jaatinen, K., Laiho, R., Vuorenmaa, A., Del Castillo, U., Minkkinen, K., Pennanen, T., Penttilä, T., Fritze, H., 2008. Responses of aerobic microbial communities and soil respiration to water-level drawdown in a northern boreal fen. Environ. Microbiol. 10, 339–353. doi:http://dx.doi.org/10.1111/j.1462-2920.2007.01455. x. Johnson, E.A., Miyanishi, K., 2008. Creating new landscapes and ecosystems: the Alberta Oil Sands. Ann. N. Y. Acad. Sci. doi:http://dx.doi.org/10.1196/ annals.1439.007. Keller, J.K., Bauers, A.K., Bridgham, S.D., Kellogg, L.E., Iversen, C.M., 2006. Nutrient control of microbial carbon cycling along an ombrotrophic-minerotrophic peatland gradient. J. Geophys. Res. Biogeosci. 111 doi:http://dx.doi.org/10.1029/ 2005jg000152. Ketcheson, S.J., Price, J.S., Carey, S.K., Petrone, R.M., Mendoza, C.A., Devito, K., 2015. Can fen peatlands be successfully constructed in post-mining oil sands landscapes? Earth Sci. Rev. (in review). Kobayashi, H., Watando, H., Kakimoto, M., 2014. A global extent site-level analysis of land cover and protected area overlap with mining activities as an indicator of biodiversity pressure. J. Clean. Prod. doi:http://dx.doi.org/10.1016/j. jclepro.2014.04.049. Kowalchuk, G.A., Buma, D.S., De Boer, W., Klinkhamer, P.G.L., Van Veen, J.A., 2002. Effects of above-ground plant species composition and diversity on the diversity of soil-borne microorganisms. Antonie van Leeuwenhoek. Int. J. Gen. Mol. Microbiol. 81, 509–520. doi:http://dx.doi.org/10.1023/A.1020565523615. Limpens, J., Berendse, F., Klees, H., 2004. How phosphorus availability affects the impact of nitrogen deposition on Sphagnum and vascular plants in bogs. Ecosystems 7, 793–804. doi:http://dx.doi.org/10.1007/s10021-004-0274-9. Limpens, J., Granath, G., Gunnarsson, U., Aerts, R., Bayley, S., Bragazza, L., Bubier, J., Buttler, A., van den Berg, L.J.L., Francez, A.J., Gerdol, R., Grosvernier, P., Heijmans, M.M.P.D., Hoosbeek, M.R., Hotes, S., Ilomets, M., Leith, I., Mitchell, E.A.D., Moore, T., Nilsson, M.B., Nordbakken, J.F., Rochefort, L., Rydin, H., Sheppard, L.J., Thormann, M., Wiedermann, M.M., Williams, B.L., Xu, B., 2011. Climatic modifiers of the response to nitrogen deposition in peat-forming sphagnum mosses: a meta-analysis. New Phytol. 191, 496–507. doi:http://dx.doi.org/ 10.1111/j.1469-8137.2011.03680.x. Lin, X., Green, S., Tfaily, M.M., Prakash, O., Konstantinidis, K.T., Corbett, J.E., Chanton, J.P., Cooper, W.T., Kostka, J.E., 2012. Microbial community structure and activity linked to contrasting biogeochemical gradients in bog and fen environments of the glacial lake agassiz peatland. Appl. Environ. Microbiol. 78, 7023–7031. doi: http://dx.doi.org/10.1128/AEM.01750-12. Litaor, M.I., Reichmann, O., Haim, A., Auerswald, K., Shenker, M., 2005. Sorption characteristics of phosphorus in peat soils of a semiarid altered wetland. Soil Sci. Soc. Am. J. doi:http://dx.doi.org/10.2136/sssaj2005.0068. Mackenzie, D.D., Naeth, M.A., 2010. The role of the forest soil propagule bank in assisted natural recovery after oil sands mining. Restor. Ecol. 18, 418–427. doi: http://dx.doi.org/10.1111/j.1526-100X.2008.00500.x. MacKenzie, M.D., Quideau, S.A., 2010. Microbial community structure and nutrient availability in oil sands reclaimed boreal soils. Appl. Soil Ecol. 44, 32–41. doi: http://dx.doi.org/10.1016/j.apsoil.2009.09.002. Macrae, M.L., Devito, K.J., Strack, M., Waddington, J.M., 2013. Effect of water table drawdown on peatland nutrient dynamics: implications for climate change. Biogeochemistry 112, 661–676. doi:http://dx.doi.org/10.1007/s10533-012- 9730-3. Magurran, A.E., 1988. Ecological Diversity and its Measurements. Princet. Univ. Press, New Jersey, pp. 177pp. Mastrogianni, A., Papatheodorou, E.M., Monokrousos, N., Menkissoglu-Spiroudi, U., Stamou, G.P., 2014. Reclamation of lignite mine areas with Triticum aestivum: the dynamics of soil functions and microbial communities. Appl. Soil Ecol. 80, 51–59. doi:http://dx.doi.org/10.1016/j.apsoil.2014.03.009. McCarter, C.P.R., Price, J.S., 2013. The hydrology of the bois-des-bel bog peatland restoration: 10 years post-restoration. Ecol. Eng. 55, 73–81. doi:http://dx.doi. org/10.1016/j.ecoleng.2013.02.003. Munir, T.M., Xu, B., Perkins, M., Strack, M., 2014. Responses of carbon dioxide flux and plant biomass to water table drawdown in a treed peatland in Northern Alberta: a climate change perspective. Biogeosciences 11, 807–820. doi:http:// dx.doi.org/10.5194/bg-11-807-2014. Noah, M., Lappe, M., Schneider, B., Vieth-Hillebrand, A., Wilkes, H., Kallmeyer, J., 2014. Tracing biogeochemical and microbial variability over a complete oil sand mining and recultivation process. Sci. Total Environ. 499, 297–310. doi:http:// dx.doi.org/10.1016/j.scitotenv.2014.08.020. Nwaishi, F., Petrone, R.M., Price, J.S., Andersen, R., 2015a. Towards developing a functional-based approach for constructed peatlands evaluation in the Alberta Oil Sands Region, Canada. Wetlands doi:http://dx.doi.org/10.1007/s13157-014- 0623-1. Nwaishi, F., Petrone, R.M., Price, J.S., Ketcheson, S.J., Slawson, R., Andersen, R., 2015b. Impacts of donor-peat management practices on the functional characteristics of a constructed fen. Ecol. Eng. 81, 471–480. doi:http://dx.doi.org/10.1016/j. ecoleng.2015.04.038. Pinheiro, J., Bates, D., DebRoy, S., Sarkar, D., 2011. R Development Core Team 2010. nlme: Linear and Nonlinear Mixed Effects Models. R Packag. version 3, pp. 1–97. Pote, D.H., Daniel, T.C., Moore, P.A., Nichols, D.J., Sharpley, A.N., Edwards, D.R., 1996. Relating extractable soil phosphorus to phosphorus losses in runoff. Soil Sci. Soc. Am. J. doi:http://dx.doi.org/10.2136/sssaj1996.03615995006000030025x. Poulin, M., Andersen, R., Rochefort, L., 2013. A new approach for tracking vegetation change after restoration: a case study with peatlands. Restor. Ecol. 21, 363–371. doi:http://dx.doi.org/10.1111/j.1526-100X.2012.00889.x. Pouliot, R., Rochefort, L., Graf, M.D., 2012. Impacts of oil sands process water on fen plants: implications for plant selection in required reclamation projects. Environ. Pollut. 167, 132–137. doi:http://dx.doi.org/10.1016/j. envpol.2012.03.050. Price, J.S., McLaren, R.G., Rudolph, D.L., 2010. Landscape restoration after oil sands mining: conceptual design and hydrological modelling for fen reconstruction. Int. J. Mining Reclam. Environ. doi:http://dx.doi.org/10.1080/ 17480930902955724. Proemse, B.C., Mayer, B., Fenn, M.E., Ross, C.S., 2013. A multi-isotope approach for estimating industrial contributions to atmospheric nitrogen deposition in the Athabasca oil sands region in Alberta, Canada. Environ. Pollut. 182, 80–91. doi: http://dx.doi.org/10.1016/j.envpol.2013.07.004. Qian, P., Schoenau, J.J., 1995. Assessing nitrogen mineralization from soil organic matter using anion exchange membranes. Fertil. Res. doi:http://dx.doi.org/ 10.1007/bf00750099. Qian, P., Schoenau, J.J., 2002. Practical applications of ion exchange resins in agricultural and environmental soil research. Can. J. Soil Sci. doi:http://dx.doi. org/10.4141/s00-091. Rooney, R.C., Bayley, S.E., 2011. Setting reclamation targets and evaluating progress: submersed aquatic vegetation in natural and post-oil sands mining wetlands in Alberta, Canada. Ecol. Eng. 37, 569–579. doi:http://dx.doi.org/10.1016/j. ecoleng.2010.11.032. Rooney, R.C., Bayley, S.E., Schindler, D.W., 2012. Oil sands mining and reclamation cause massive loss of peatland and stored carbon. Proc. Natl. Acad. Sci. doi: http://dx.doi.org/10.1073/pnas.1117693108. Ruiz-Jaen, M.C., Aide, T.M., 2005. Restoration success: how is it being measured? Restor. Ecol. doi:http://dx.doi.org/10.1111/j.1526-100X.2005.00072.x. Shenker, M., Seitelbach, S., Brand, S., Haim, A., Litaor, M.I., 2005. Redox reactions and phosphorus release in re-flooded soils of an altered wetland. Eur. J. Soil Sci. 56, 515–525. doi:http://dx.doi.org/10.1111/j.1365-2389.2004.00692.x. Sims, D.B., Hooda, P.S., Gillmore, G.K., 2013. Mining activities and associated environmental impacts in arid climates: a literature review. Environ. Pollut. 2, 22–43. doi:http://dx.doi.org/10.5539/ep.v2n4p22. Soni, A.K., Mishra, B., Singh, S., 2014. Pit lakes as an end use of mining: a review. J. Min. Environ. 5, 99–111. Strack, M., Waddington, J.M., Lucchese, M.C., Cagampan, J.P., 2009. Moisture controls on CO2 exchange in a Sphagnum-dominated peatland: results from an extreme drought field experiment. Ecohydrology 2, 454–461. doi:http://dx.doi.org/ 10.1002/eco.68. Suganuma, M.S., Durigan, G., 2015. Indicators of restoration success in riparian tropical forests using multiple reference ecosystems. Restor. Ecol. 23, 238–251. doi:http://dx.doi.org/10.1111/rec.12168. Team, R., 2013. R Development Core Team. R A Lang. Environ. Stat. Comput.. Tordoff, G.M., Baker, A.J.M., Willis, A.J., 2000. Current approaches to the revegetation and reclamation of metalliferous mine wastes. Chemosphere 41, 219–228. doi: http://dx.doi.org/10.1016/s0045-6535(99) 00414-2. United Nations, 2012. The Millennium Development Goals report 2012. United Nations 2012, New York, pp. 35 doi:RePEc:adb:adbmdg:399. Updegraff, K., Pastor, J., Bridgham, S.D., Johnston, C.A., 1995. Environmental and substrate controls over carbon and nitrogen mineralization in northern wetlands. Ecol. Appl. 5, 151–163. doi:http://dx.doi.org/10.2307/1942060. Urbanová, M., Kopecký, J., Valášková, V., Ságová-Mare9cková, M., Elhottová, D., Kyselková, M., Moënne-Loccoz, Y., Baldrian, P., 2011. Development of bacterial community during spontaneous succession on spoil heaps after brown coal mining. FEMS Microbiol. Ecol. 78, 59–69. doi:http://dx.doi.org/10.1111/j.1574- 6941.2011.01164.x. Van Der Heijden, M.G.A., Bardgett, R.D., Van Straalen, N.M., 2008. The unseen majority: soil microbes as drivers of plant diversity and productivity in terrestrial ecosystems. Ecol. Lett. doi:http://dx.doi.org/10.1111/j.1461- 0248.2007.01139.x. Vitt, D.H., Halsey, L.A., Bauer, I.E., Campbell, C., 2000. Spatial and temporal trends in carbon storage of peatlands of continental western Canada through the Holocene. Can. J. Earth Sci. doi:http://dx.doi.org/10.1139/e99-097. Vitt, D.H., Halsey, L.A., Thormann, M.N., Martin, T., 1996. Peatland Inventory of Alberta Phase I: Overview of Peatland Resources in the Natural Regions and Subregions of the Province. Publicatio. Wardle, D.A., Bardgett, R.D., Klironomos, J.N., Setälä, H., van der Putten, W.H., Wall, D.H., 2004. Ecological linkages between aboveground and belowground biota. Science 304, 1629–1633. doi:http://dx.doi.org/10.1126/science.1094875. Wardle, D.A., Peltzer, D.A., 2007. Aboveground-belowground linkages, ecosystem development, and ecosystem restoration. Linking Restoration and Ecological Succession, , pp. 45–68. doi:http://dx.doi.org/10.1007/978-0-387-35303-6_3. Weintraub, M.N., Schimel, J.P., 2003. Interactions between carbon and nitrogen mineralization and soil organic matter chemistry in arctic tundra soils. Ecosystems 6, 129–143. doi:http://dx.doi.org/10.1007/s10021-002-0124-6. Westbrook, C.J., Devito, K.J., 2004. Gross nitrogen transformations in soils from uncut and cut boreal upland and peatland coniferous forest stands. Biogeochemistry 68, 33–49. doi:http://dx.doi.org/10.1023/B: BIOG.0000025739.04821.8e. Westbrook, C.J., Devito, K.J., Allan, C.J., 2006. Soil N cycling in harvested and pristine boreal forests and peatlands. For. Ecol. Manag. 234, 227–237. doi:http://dx.doi. org/10.1016/j.foreco.2006.07.004. F. Nwaishi et al. / Applied Soil Ecology 98 (2016) 177–194 193
- 18. Wiedermann, M.M., Gunnarsson, U., Ericson, L., Nordin, A., 2009. Ecophysiological adjustment of two Sphagnum species in response to anthropogenic nitrogen deposition. New Phytol. 181, 208–217. doi:http://dx.doi.org/10.1111/j.1469- 8137.2008.02628.x. Wood, M.E., Macrae, M.L., Strack, M., Price, J.S., Osko, T.J., Petrone, R.M., 2015. Spatial variation in nutrient dynamics among five different peatland types in the Alberta Oil sands region. Ecohydrology doi:http://dx.doi.org/10.1002/eco.1667. Wytrykush, C., Vitt, D.H., McKenna, G., Vassov, R., 2012. Designing Landscapes to Support Peatland Development on Soft Tailings Deposits. Restoration and Reclamation of Boreal Ecosystems: Attaining Sustainable Development:161. Cambridge University Press. Zak, D., Wagner, C., Payer, B., Augustin, J., Gelbrecht, J., 2010. Phosphorus mobilization in rewetted fens: the effect of altered peat properties and implications for their restoration. Ecol. Appl. 20, 1336–1349. doi:http://dx.doi. org/10.1890/08-2053.1. Zak, D.R., Holmes, W.E., White, D.C., Peacock, A.D., Tilman, D., 2003. Plant diversity, soil microbial communities, and ecosystem function: are there any links? Ecology 84, 2042–2050. doi:http://dx.doi.org/10.1890/02-0433. Zak, J.C., Willig, M.R., Moorhead, D.L., Wildman, H.G., 1994. Functional diversity of microbial communities: a quantitative approach. Soil Biol. Biochem. 26, 1101– 1108. doi:http://dx.doi.org/10.1016/0038-0717(94) 90131-7. 194 F. Nwaishi et al. / Applied Soil Ecology 98 (2016) 177–194