Download to read offline
![S30 KIRKWOOD
TABLE 1
Maintenance or average daily metabolizable energy
requirements for some groups of animals
in relation to body mass
GroupCaptive
snakes'Passerine
birds,30°CNon-passerines,
30°CCaptive
raptorsCaptive
eutherianmammalsCaptive
eutherianmammalsRodents,
captiveADMR1Insectivores,
captiveADMR2Captive
primatesCaptive
prosimiansEnergy
Requirementk]/d-45
M075481
M°«41
4M075456
M°•"•607
M°•"586
M°•"356
M°"280
M043406
M°"264-573
M°"SourceGili
&Kirkwood,unpublisheddataRef.
10Ref.
10Ref.
11Ref.
12Ref.
6Ref.
13Ref.
13Ref.
14Ref.
15
1Snakes maintained at temperatures close to 28°C.
2Average daily metabolic rate.
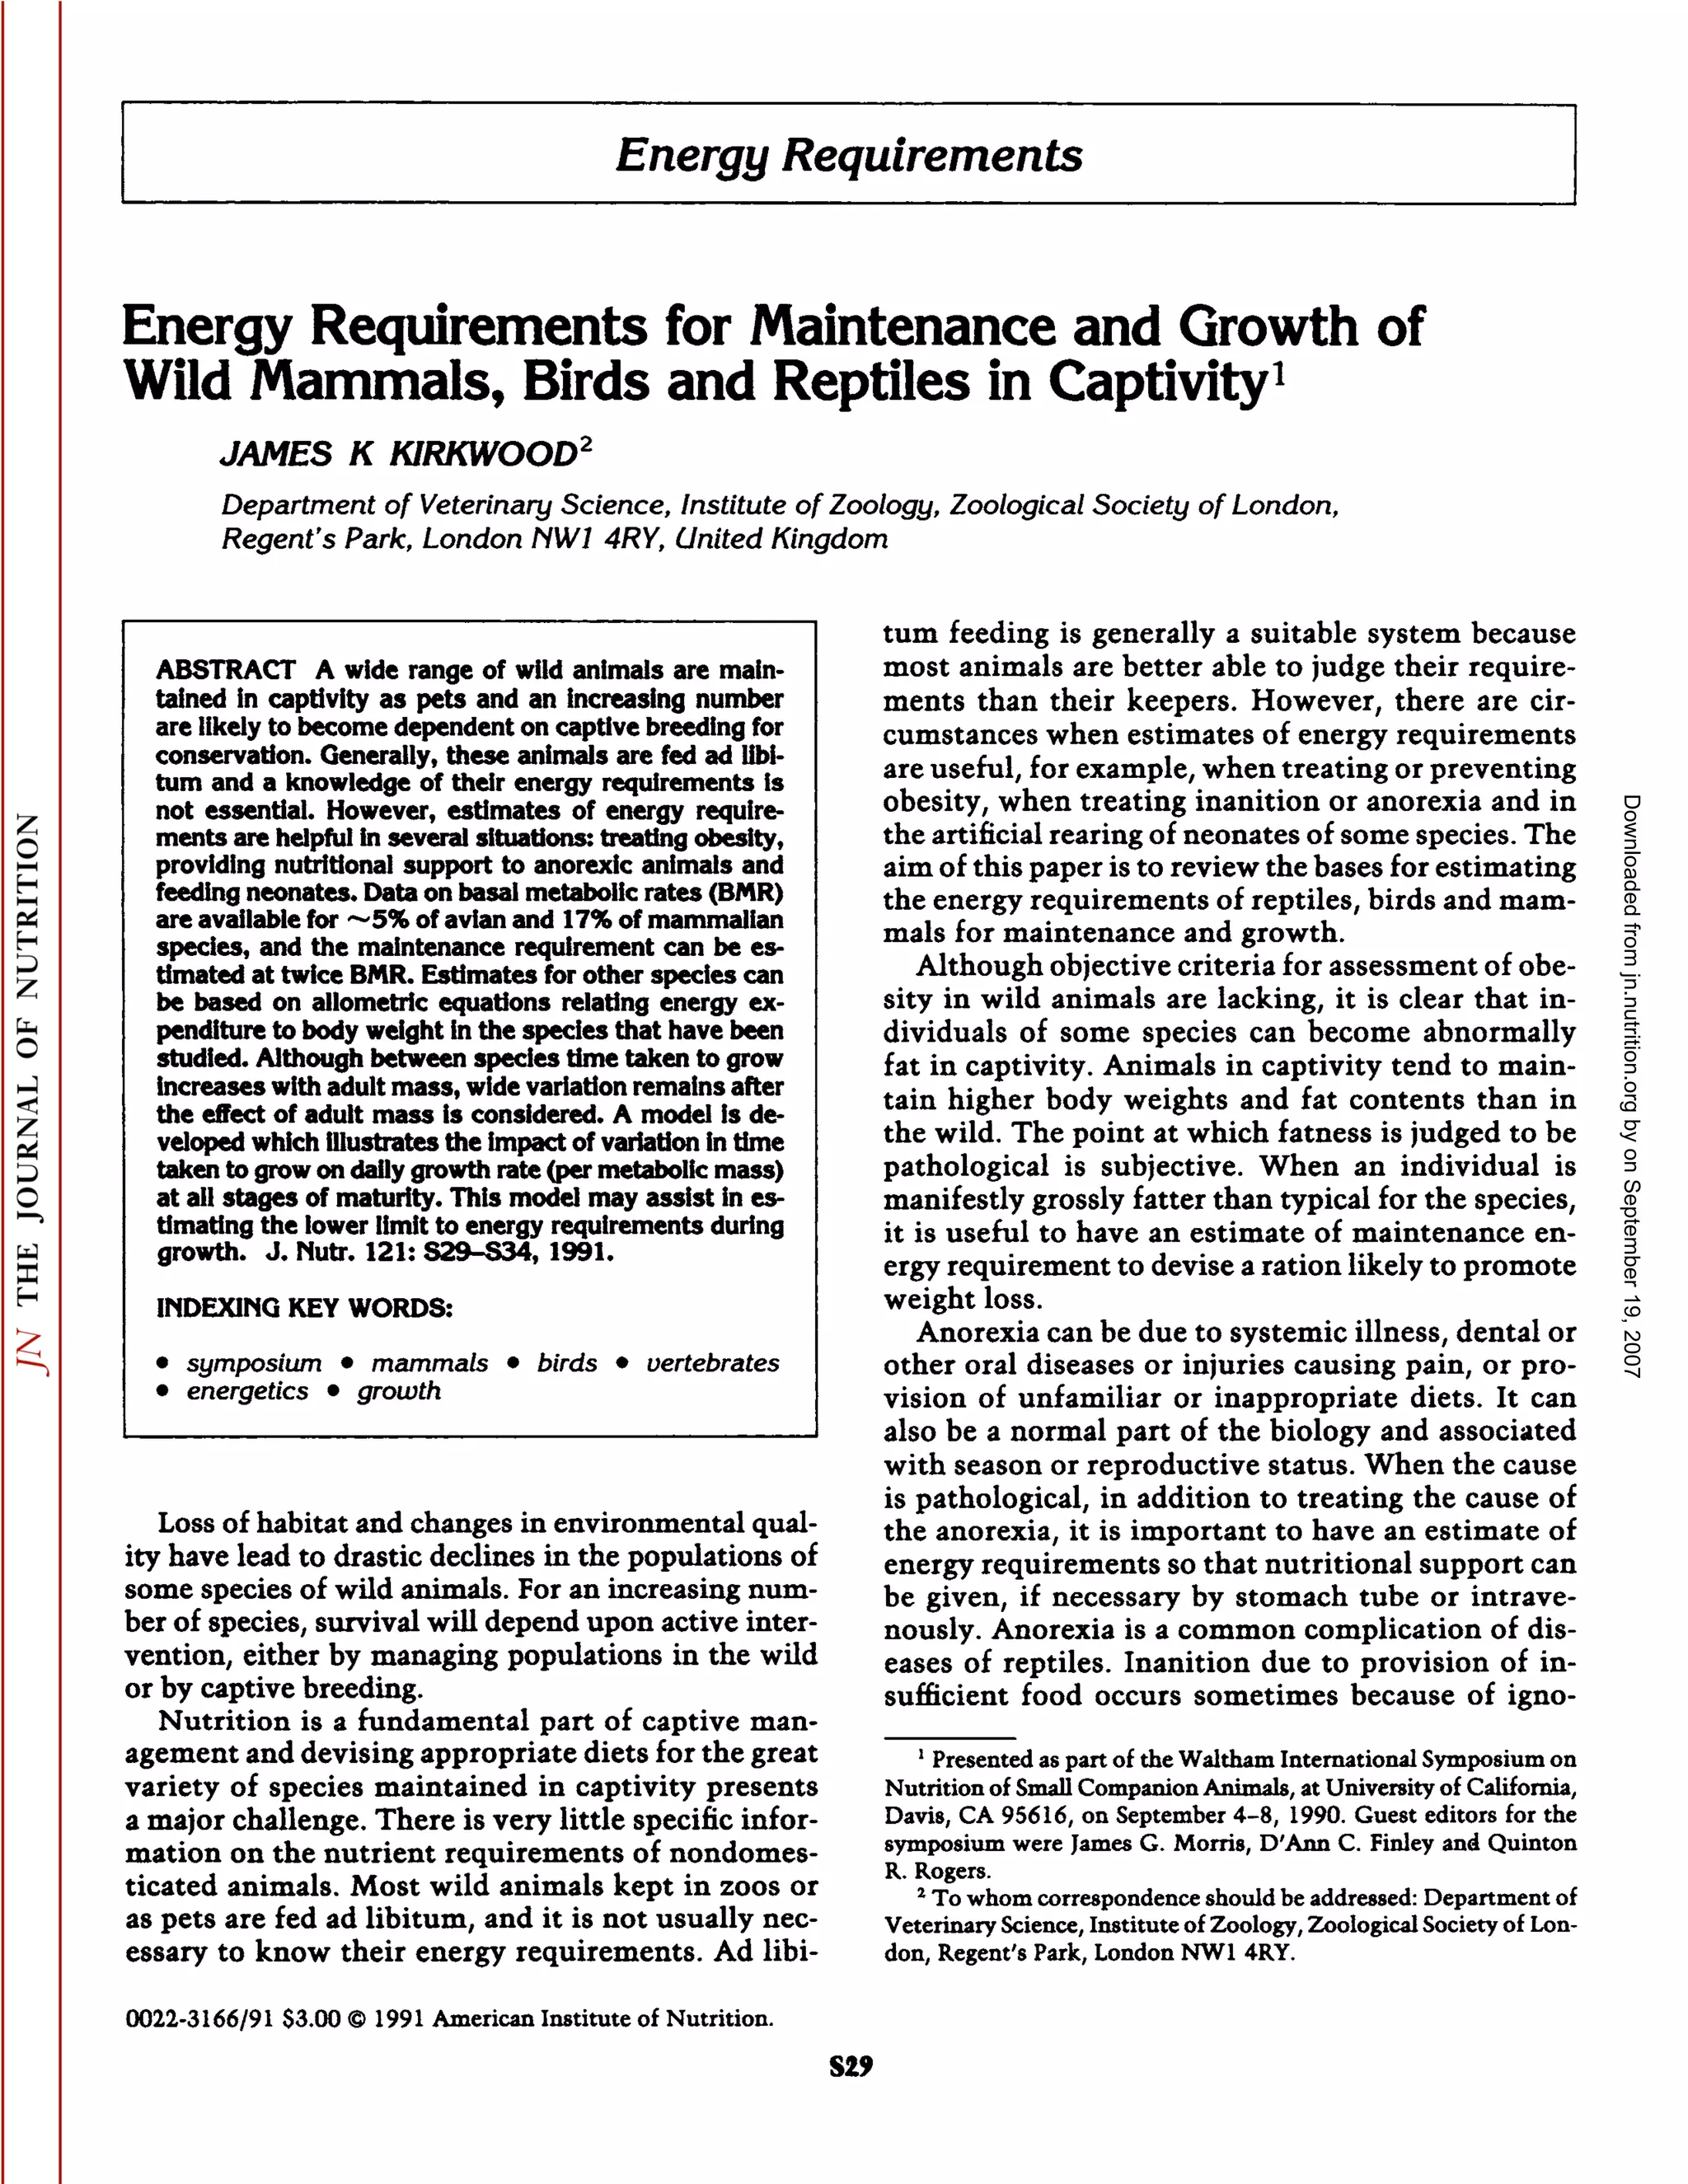
ranee of requirements and failure to recognize the
effects.
It is quite often necessary to artificially rear wild
animals born in captivity either because mother or
baby are ill or because of inadequate maternal behav
ior. The need also arises when eggs are removed for
artificial incubation to increase clutch size and pro
ductivity (1). In some species, clutch or litter sizes of
ten exceed the number that the mother can rear. For
example, common marmosets often have triplet litters
but can rear only two babies (2), giant pandas fre
quently have twins but rear only one (3) and some
eagles incubate two eggs but rear only one hatchling
(4). In these cases the surplus neonates can be hand-
reared. It can be difficult to judge how much food to
provide and an estimate of what the requirements are
likely to be is useful so that gross over- or underfeeding
is avoided.
Estimates of energy requirements can therefore be
useful, but can useful estimates be made? Intra- and
interspecies variation makes the precise prediction of
the energy requirements of an individual impossible,
but enough is known about the influence of body size
and taxonomic position for it to be possible to make
adequate first approximations. Intakes in excess of
~ 1700 kj/d per metabolic mass (M in kg raised to the
I power) are very unlikely under any circumstances
since there seems to be a limit to intake at about this
level (5). In this paper, information relevant to the es
timation of energy requirements for maintenance is
reviewed, and a model is developed that predicts a
lower limit to the energy requirements for growth in
relation to stage of maturity and time taken to grow.
METABOLIZABLE ENERGY REQUIREMENTS
FOR MAINTENANCE
The metabolizable energy requirements for main
tenance of adult animals in energy balance and kept
in a comfortable thermal environment approximate
twice the basal metabolic rate (BMR) (6) and recom
mendations for maintenance are often based on this
(7).This is a useful guide in practice because, although
energy requirements for maintenance or captive ex
istence have been measured in relatively few species,
data on BMR are available for many. For example,
Bennett and Harvey (8) collected data on resting met
abolic rate for 399 species of birds from the literature
for a review of the effects of body size and other fac
tors, and Heusner (9) studied data from 685 mammal
species.
Allometric equations relating maintenance energy
requirements or the average daily metabolism in cap
tivity in relation to body mass for several groups of
animals are shown in Table 1. The BMRs of mono-
tremésand marsupials are lower than typical for eu
therian mammals (16, 17) and their maintenance re
quirements are likely to be correspondingly low. The
mean maintenance energy requirement per metabolic
mass of three species of macropod marsupials for
which data are cited by Loudon (18)was 427 kj/d. The
prosimians also tend to have lower metabolic rates
than the mean for eutherian mammals (15, 19).
Average daily metabolic rates have been measured
in free-living individuals of quite a wide range of spe
cies and some allometric equations are listed in Table
2. Where the captive conditions mimic the wild en
vironment closely, estimates of requirements based
on these equations may be more appropriate.
ENERGY REQUIREMENTS DURING GROWTH
During growth, energy is required both for mainte
nance functions and also for deposition of new tissue.
The amount by which the total daily requirement ex
ceeds the maintenance requirement depends upon the
rate of tissue deposition and the composition of tissue
TABLE 2
Average daily metabolic rate ¡ADMR]of free-living animals
Species ADMR Source
Free-living lizards
Free-living birds
Free-living birds
Free-living rodents
ki/d
54 Ma>0
854 M0<1
920 M0<1
753 M067
Ref. 20
Ref. 21
Ref. 8
Ref. 22
byonSeptember19,2007jn.nutrition.orgDownloadedfrom](https://image.slidesharecdn.com/energyrequirements-150106213524-conversion-gate01/75/Energy-requirements-2-2048.jpg)

![ENERGY REQUIREMENTS OF CAPTIVE WILD ANIMALS S33
model greatly. Second, the energy density of tissue
deposited usually increases with stage of maturity (u)
due to an increase in proportion of fat to protein de
posited. In wild animals the energy density of weight
gain typically increases from ~6300 kj/kg in the early
stages of growth to ~ 12,600 kj/g in the late stages
[see Figs 10.4-10.8 in Robbins (6)]but is higher than
this in some species (e.g., seals and storm petrels) and
in domestic animals [e.g., cattle, (60)]. If we assume
that the efficiency of deposition of energy available
for growth is 0.75, then the energy required for each
gram weight gain will typically increase from 8400 to
16,800 kj as adult mass is approached. Assuming the
energy cost of weight gain (c, kj/kg) increases with u
as follows:
c = 8400 + 8400u (13)
then Pg can be calculated:
Pg/M°75= (8400 + 8400u)
- 1.57c/0u°25ln(u) (14)
Taking the increasing cost of tissue deposition with
stage of maturity into account in this way skews the
predicted energy requirements to the right (Figs. IE,
F). Third, the maintenance component of the energy
budget during growth varies between species (see
above) and is unlikely to remain constant throughout
growth. In some altricial species it appears to be below
adult level (per metabolic mass) before developing en-
dothermy (33). It may increase during growth as ex
penditure on activity increases and there is evidence
that it is linked with growth intensity (60). Rapid
growth demands a relatively high food intake and thus
a relatively large digestive system (61) and there is ev
idence that this metabolically active tissue is relatively
expensive to maintain (62).
For the reasons outlined above, equation 20 is likely
to underestimate the actual requirements, and com
parison of the predictions with energy budget data
provided by Kirkwood and Webster (33) suggests that
it fairly consistently does so. However, no generaliza
tions can be made about the costs of other components
of the energy budget so they cannot be taken into ac
count.
In conclusion, the energy requirement of an indi
vidual cannot be predicted precisely but approximate
estimates of energy requirements usually suffice when
they are needed in practice. Adequate estimates of
maintenance requirements can be generated from
BMR data or from interspecies allometric relation
ships.
The energy requirements for growth are more dif
ficult to estimate. The models generated here approx
imate the patterns of growth in homeotherms quite
well but usually underestimate total daily energy in
takes. They can provide some guidance about the
magnitude of the impact of variation in time taken to
grow on weight gain at various stages of growth, pre
dictions of the lower limit of energy requirements
during growth, and an estimate of how energy re
quirements for tissue deposition may change during
growth.
ACKNOWLEDGMENT
I am most grateful to Moya Foreman for preparing
this manuscript.
LITERATURE CITED
1. PORTER,R. D. (1975) Experimental alterations of clutch-size
of captive American kestrels. Ibis 117: 510-515.
2. POOLE,T. B. & EVANS,R. G. (1982) Reproduction, infant sur
vival and productivity of a colony of common marmosets (Cal-
lithrix jacchus jacchus). Lab. Anim. 16: 88-97.
3. KNIGHT,J. A., BUSH,M., CELMA,M., GARCIADELCAMPO,A. L.,
GOLTENBOTH, R., HEARN, J. P., HODGES, J. K-, JONES, D. M.,
K.LOS, H. G., MONSALVE, L., MONTALI, R. & MOORE,
H. D. M. (1985) Veterinary aspects of reproduction in the giant
panda (Ailuropoda melanoleuca). Bongo 10: 93-126.
4. NEWTON, I. (1979) The Population Ecology of Raptors. T. &
A. D. Poyser, Berkhamsted, England, pp. 114-117.
5. KIRKWOOD,J. K. (1983) A limit to metabolisable energy intake
in mammals and birds. Comp. Biochem. Physiol. [A] 75A: 1-3.
6. ROBBINS, C. T. (1983) Wildlife Feeding and Nutrition. Aca
demic Press, New York, NY, pp. 207-233.
7. ULLREY,D. &. ALLEN,M. E. (1986) Principles of zoo animal
nutrition. In: Zoo and Wild Animal Medicine (Fowler, M. E.,
éd.),pp. 516-532. W. B. Saunders Co, Philadelphia, PA.
8. BENNETT,P. M. & HARVEY,P. H. (1987) Active and resting
metabolism in birds: allometry, phylogeny and ecology. J. Zool.
213: 327-363.
9. HEUSNER, A. A. (1991) Basal metabolism and body mass in
dogs. Abstracts of the Waltham International Symposium on
the Nutrition of Small Companion Animals, University of Cal
ifornia, Davis, CA, 4-8 September 1990. /. Nutr. 120: xx-xx.
10. KENDEIGH,S. C. (1970) Energy requirements for existence in
relation to size of bird. Condor 72: 60-65.
11. KIRKWOOD,J. K. (1981) Maintenance energy requirements and
rate of weight loss during starvation in birds of prey. In: Recent
Advances in the Study of Raptor Diseases (Cooper, J. E. &
Greenwood, A. G., eds.), pp. 153-157, Chiron Press, Keighley,
England.
12. EVANS, E. & MILLER,D. S. (1968) Comparative nutrition,
growth and longevity. Proc. Nutr. Soc. 27: 121-129.
13. GRODZINSKI,W. & WUNDER,B. A. (1975) Ecological energetics
of small mammals. In: Small Mammals: Their Productivity and
Population Dynamics. (Golley, F. B., Petrusewicz, K. &. Rysz-
kowski, L., eds.), pp. 173-204, Cambridge University Press,
Cambridge, England.
14. KIRKWOOD,J. K. & UNDERWOOD,S. J. (1984) Energy require
ments of captive cotton-top tamarins (Saguinus oedipus oedi-
pus}. Folia Primato]. (Base]] 42: 180-187.
15. POLLOCK,J. I. (1986) The management of prosimians in cap
tivity for conservation and research. In: Primates, the Road to
Self-Sustaining Populations. (Benirschke, K., éd.),pp. 269-288,
Springer-Verlag, New York, NY.
16. DAWSON,T. J. & HULBERT,A. J. (1970) Standard metabolism,
body temperature, and surface areas of Australian marsupials.
Am. ]. Physiol 218: 1233-1238.
byonSeptember19,2007jn.nutrition.orgDownloadedfrom](https://image.slidesharecdn.com/energyrequirements-150106213524-conversion-gate01/75/Energy-requirements-5-2048.jpg)
![S34 KIRKWOOD
17. DAWSON,T.}., GRANT,T. R. & FANNING,D. (1979) Standard
metabolism of monotremes and the evolution of homeothermy.
Aust./. Zool. 27:511-515.
18. LOUDON,A. S. I. (1987) The reproductive energetics of lacta
tion in a seasonal macropodid marsupial: comparison of mar
supial and eutherian herbivores. Symp. Zool. Soc. London 57:
127-147.
19. Ross, C. A. (1989) Life-History Strategies of Primates. PhD
Thesis, University College of London, London, England.
20. NAGY,K. A. (1982) Energy requirements of free-living iguanid
lizards. In: iguanas of the World: Their Behaviour, Ecology, and
Conservation. (Burghardt, G. M. & Rand, A. S., eds.), pp. 49-
59. Noyes Publications, Park Ridge, NJ.
21. WALSBERG,G. E. (1983) Avian ecological energetics. In: Avian
Biology (Farner,D. S., King, J.R. & Parkes, K. C., eds.), vol. VII,
pp. 161-220. Academic Press, New York, NY.
22. KING,J. R. (1974) Seasonal allocation of time and energy re
sources in birds. In: Avian Energetics. (Paynter R. A. Jr., ed.),
Publications of the Nuttall Ornithological Club No. 15, pp. 4-
85, Cambridge, MA.
23. KIRKWOOD,J. K. (1985) Patterns of growth in primates./. Zool
205: 123-136.
24. RICKLEFS,R. E. (1968) Patterns of growth in birds. Ibis 110:
419-451.
25. WILSON,B.J. (1977) Growth curves, their analysis and use. In:
Growth and Poultry Meat Production. (Boorman, K. N. & Wil
son, B. J., eds.), pp. 89-115, British Poultry Science, Edinburgh,
Scotland.
26. ZULLINGER,E. M., RlCKLEFS,R. E., REDFORD,K. H. & MACE,
G. M. (1984) Fitting sigmoidal equations to mammalian growth
curves. /. Mammal. 65: 607-636.
27. BRODY,S. (1945) Bioenergéticaand Growth. Hafner Publishing
Co, New York, NY.
28. TAYLOR,ST. C. S. (1965) A relation between mature weight
and time taken to mature in mammals. Anim. Production 7:
203-220.
29. CASE,T. J. (1978) On the evolution and adaptive significance
of post-natal growth rates in the terrestrial vertebrates. Q. Rev.
Biol. 53: 243-282.
30. CALDER,W. A. III. (1982) The pace of growth: an allometric
approach to comparative embryonic and post-embryonic growth.
/.Zool. 198:215-225.
31. HARVEY,P. H. & MACE,G. M. (1982) Comparisons between
taxa and adaptive trends: problems of methodology. In: Current
Problems in Sociobiology. (King's College Sociobiology Group,
eds.), pp. 346-361. Cambridge University Press, Cambridge,
England.
32. RICKLEFS,R. E. (1979) Adaptation, constraint, and compromise
in avian postnatal development. BioJ.Rev. 54: 269-290.
33. KIRKWOOD,J. K. & WEBSTER,A. J. F. (1984) Energy budget
strategies for growth in mammals and birds. Anim. Production
38: 147-155.
34. KIRSCHE,W. (1979) The housing and regular breeding of Med
iterranean tortoises Testudo spp in captivity, int. Zoo Yearbook
19: 42-49.
35. NAULLEAU,G. &.VANDENBRULE,B. (1981) Feeding, growth,
moult and venom production in the Russell's viper Vipera rus-
selli in captivity, int. Zoo Yearbook 21: 163-172.
36. SCRIBANO,E. & BANKS,C. (1968) Hand-rearing fairy penguins
Eudyptula minor at Melbourne Zoo. int. Zoo Yearbook 18: 62-
65.
37. BROWN,C. R. (1988) Energy requirements for growth of Sal-
vin's Prions Pachyptila vittata salvini, Blue Petrels Halobaena
caerulea and Great-winged Petrels Pterodroma macroptera. Ibis
130: 527-534.
38. DUNN, E. H. (1975) Growth, body components and energy
content of nestling double-crested cormorants. Condor 77: 431-
438.
39. SAMOUR,H. J., OLNEY,P. J. S., HERBERT,D., SMITH,F., WHITE,
J. & WOOD,D. (1984) Breeding and hand-rearing the Andean
condor VuJtur gryphus at London Zoo. Int. Zoo Yearbook 23:
7-11.
40. CAVE,A. J. (1968) The breeding of the kestrel Palco tinnun-
culus L., in the reclaimed areaOostelijk Flevoland. Neth. /. Zool.
18: 313-407.
41. PRESCOTT,N. J., WATHES,C. M., KIRKWOOD,J. K. & PERRY,
G. C. (1985) Growth, food intake and development in broiler
cockerels raised to maturity. Anim. Production 41: 239-245.
42. BLEM,C.R. (1978) The energetics of young Japanese quail Co-
turnix coturnix japónica.Comp. Biochem. Pbysiol. [A] 59A:
219-223.
43. BELL,K.J. (1981) Breeding and hand-rearing the Nicobar pigeon
Caloenus nicobarica at the Lincoln Park Zoological Gardens.
Int. Zoo Yearbook 21:217-219.
44. HARRISON,G. J. &. HARRISON,L. R. (1986) Clinical Avian
Medicine and Surgery. W. B. Saunders Co, Philadelphia, PA,
pp. 662-666.
45. BERRY,R. J., TODD,W. & PLASSE,R. (1982) Breeding the Scarlet
cock-of-the-rock Rupicola peruviana at the Houston Zoological
Gardens. Int. Zoo Yearbook 22: 171-175.
46. WESTERTERP,K. (1977) The energy budget of the nestling star
ling, a field study. Õrdea61: 137-158.
47. THOMPSON,V. D. (1987) Parturition and development in the
Queensland koala Phascolarctos cinereus adustus at San Diego
Zoo. Int. Zoo Yearbook 26: 217-222.
48. FORSYTH,D. J. (1976) A field study of growth and development
of nestling masked shrews (Sores,cinereus). /. Mammal 57: 708-
721.
49. BEAMAN,P. &. MALINIAK,E. (1981) Capture, husbandry and
breeding of Rufous elephant shrews ElephantuZus rufescens. Int.
Zoo Yearbook 21: 176-184.
50. GLATSTON,A. R. (1981) The husbandry, breeding and hand-
rearing of the lesser mouse lemur Microcebus murinus at Rot
terdam Zoo. Int. Zoo Yearbook 21: 131-137.
51. MclNTOSH,G. H. &.LOOKER,J. W. (1982) Development of a
marmoset colony in Australia. Lab. Anim. Sci. 32: 677-679.
52. BOURNE,G. H. (ed.) (1975) The Rhesus Monkey. Academic
Press, London.
53. ALTMANN,P. S. &.DITTMER,D. S. (1962) Growth. Federation
of American Sciences for Experimental Biology, Washington,
DC.
54. SUTHERLAND,S. D. & FESTINO,M. F. W. (1987) The guinea-
pig. In: The UFAWHandbook on Care and Management of Lab
oratory Animals. (Poole,T. B., éd.),pp. 393-410, Longman Sci
entific and Technical, Harlow, Essex, England.
55. NORRIS,M. L. (1987) Gerbils. In: The UPAW Handbook on
Care and Management of Laboratory Animals. (Poole, T. B.,
éd.),pp. 360-376. Longman Scientific & Technical, Harlow, Es
sex, England.
5*. ROSENSTEIN,L. & BERMAN,E. (1973) Postnatal bodyweight
changes of domestic cats maintained in an outdoor colony. Am.
/. Vet. Res. 34: 575.
57. CHAKRABORTY,P. K., STEWART,A. P. & SEAGER,S. W. J. (1983)
Relationship of growth and serum growth hormone concentra
tion in the prepubertal labrador bitch. Lab. Anim. Sci. 33: 51-
55.
58. TELLEZGIRON,J. A. (1980) Giant pandas Ailuropoda melan-
oleuca in Chapultepec ParkZoo, Mexico City. Int. Zoo Yearbook
20: 264-269.
59. WEBSTER,A. J. F., AHMED,A. A. M. & FRAPPELL,J. P. (1982) A
note on the growth rates and maturation rates in beef bulls.
Anim. Production 35: 281-284.
60. WEBSTER,A. J. F. (1978) Prediction of the energy requirements
for growth in beef cattle. World Rev. Nutr. Diet. 30: 189-226.
61. KIRKWOOD,J. K. & PRESCOTT,N. J. (1984) Growth rate and
pattern of gut development in mammals and birds. Livestock
Production Sci. 11: 461-474.
62. WEBSTER,A. J. F. (1981) The energetic efficiencyof metabolism.
Proc. Nutr. Soc. 40: 121-128.
byonSeptember19,2007jn.nutrition.orgDownloadedfrom](https://image.slidesharecdn.com/energyrequirements-150106213524-conversion-gate01/75/Energy-requirements-6-2048.jpg)

This document discusses estimating the energy requirements for maintenance and growth of wild mammals, birds, and reptiles kept in captivity. It reviews existing data on basal metabolic rates and maintenance energy requirements for some species. The document develops a model to estimate lower limits of energy requirements during growth, taking into account factors like variation in time to reach maturity and energy density of tissue deposited. Having estimates of energy needs can help with issues like treating obesity or providing nutritional support when animals lose appetite. Overall, the document aims to provide guidance for estimating energy requirements when specific data is lacking for non-domesticated species in captive settings.