Download as PDF, PPTX
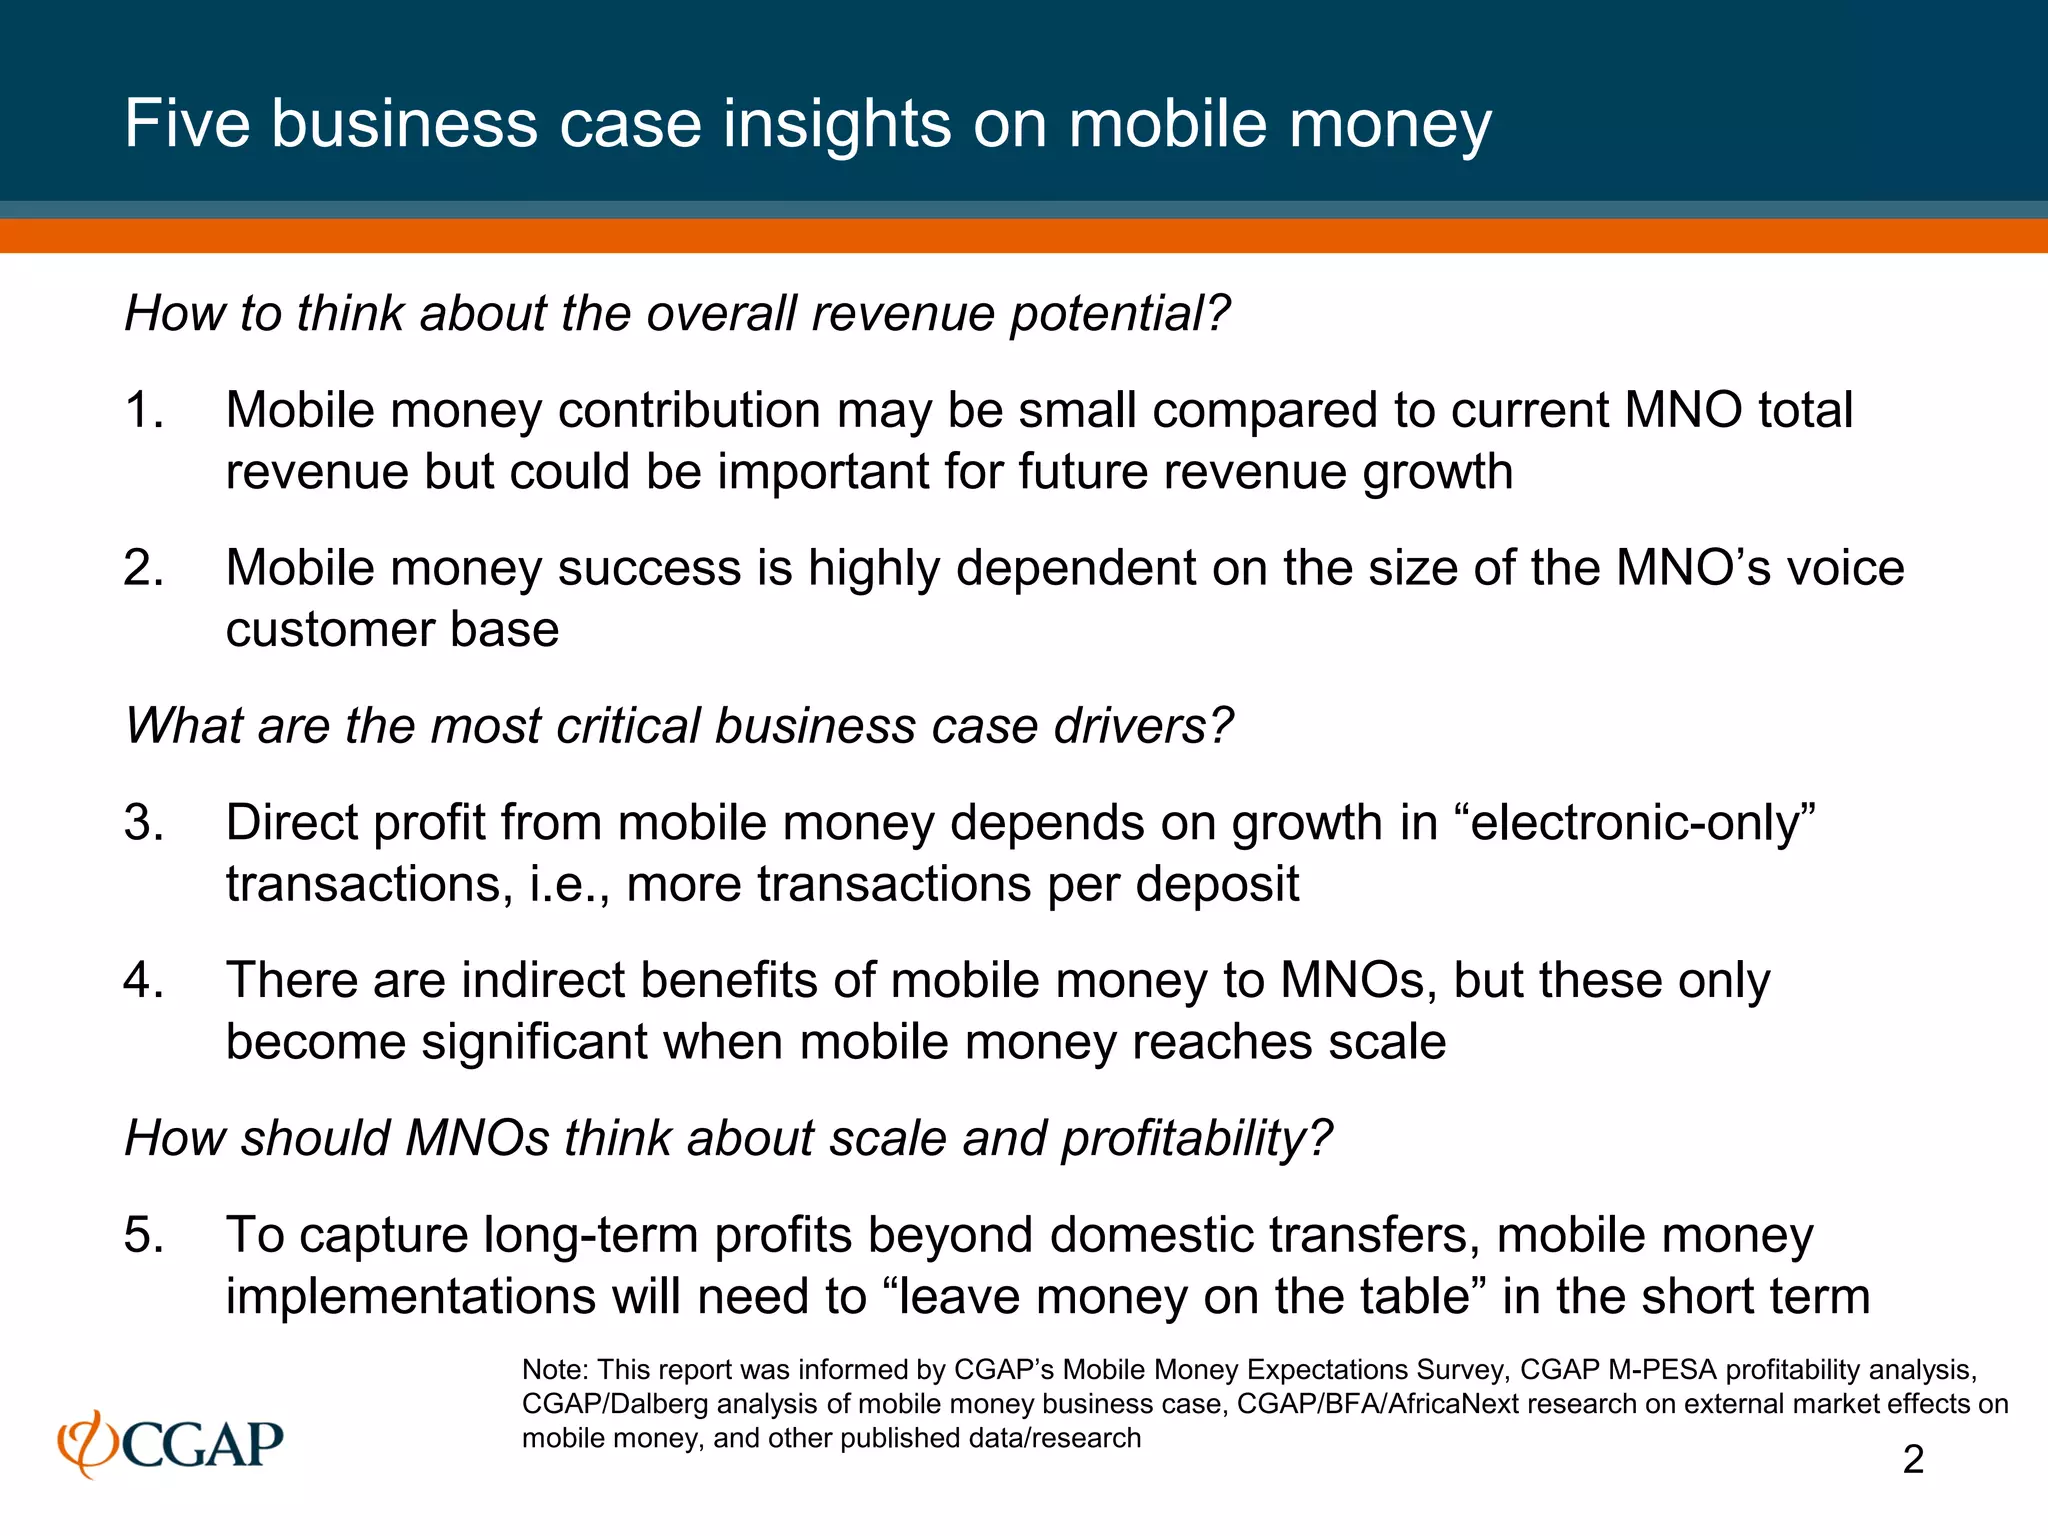
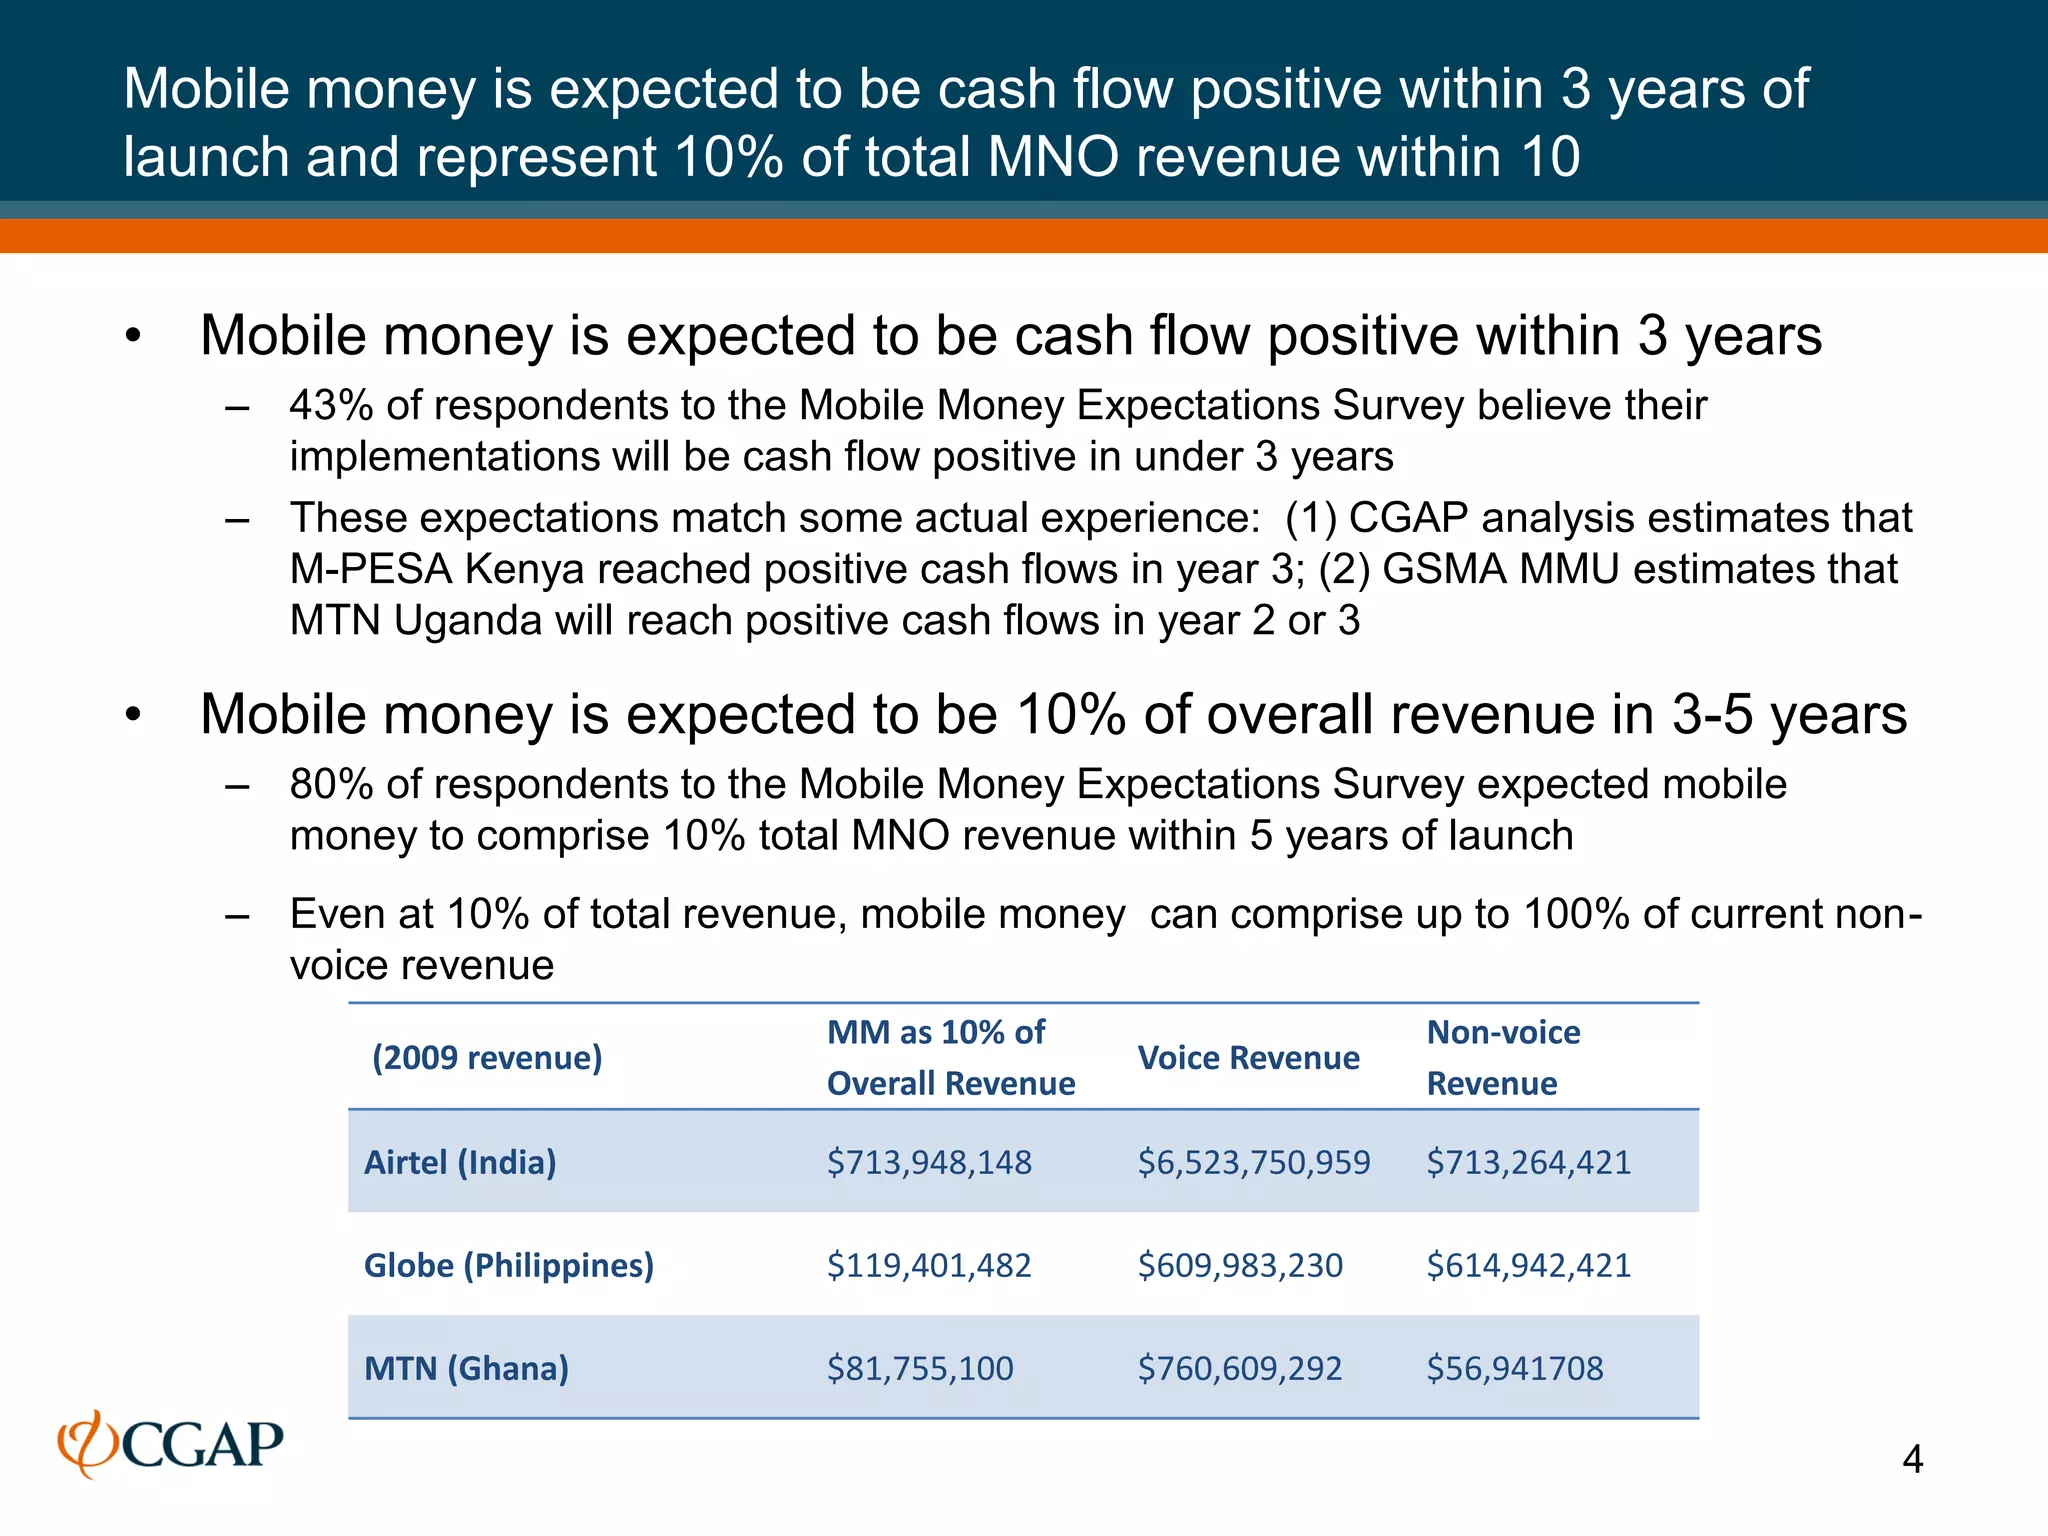
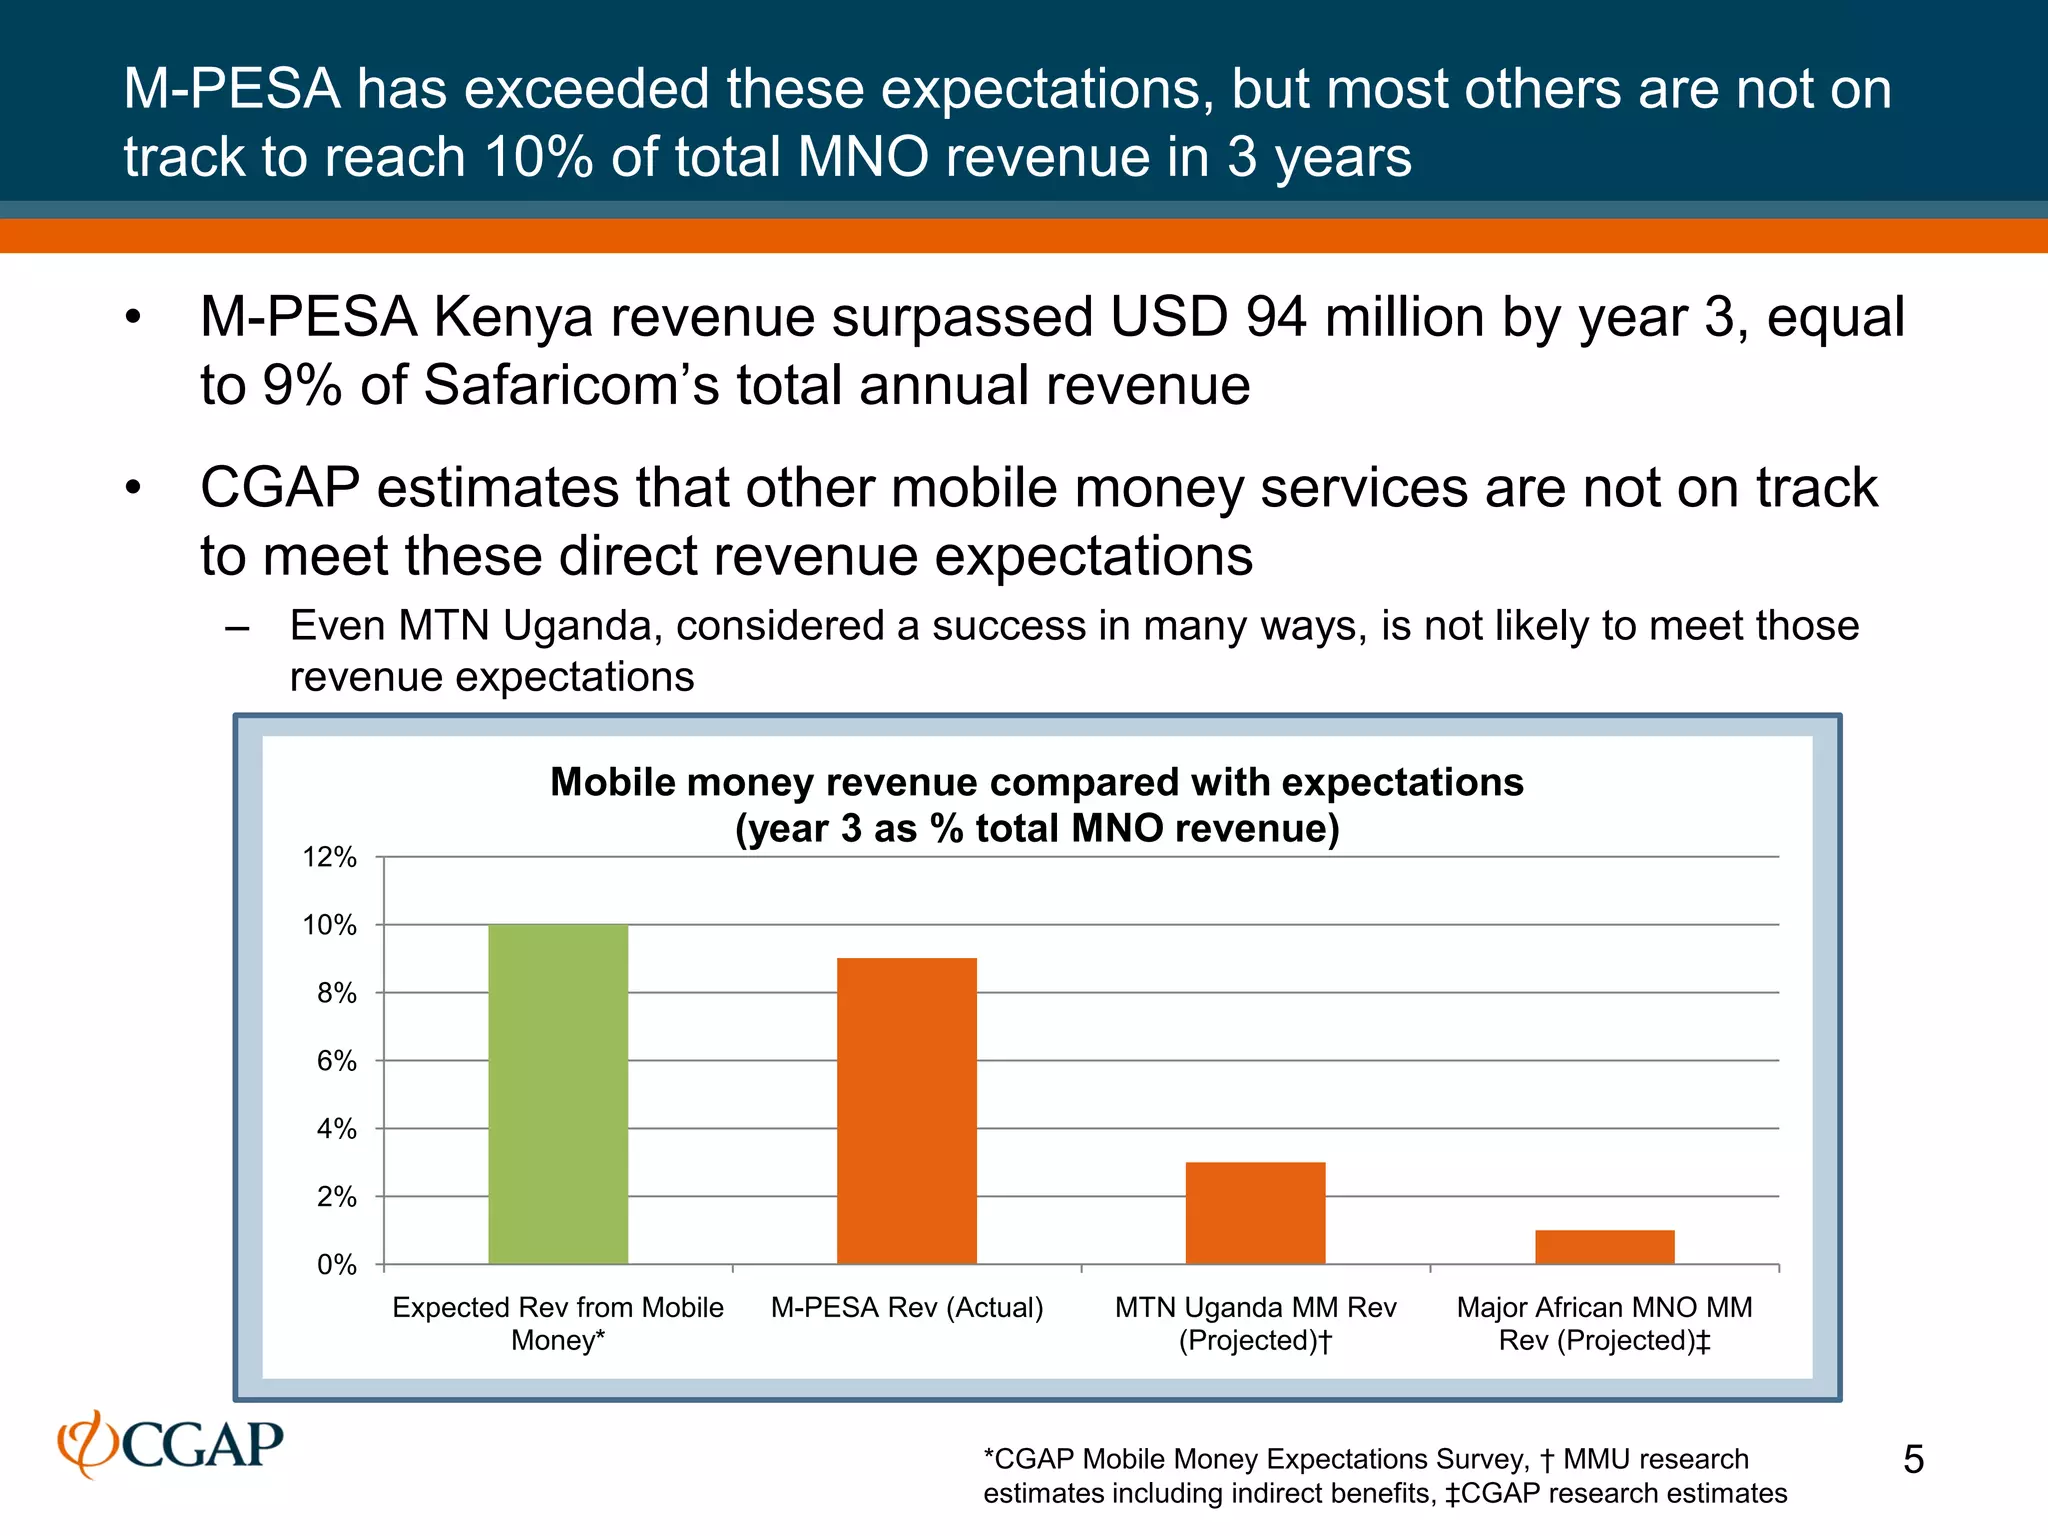
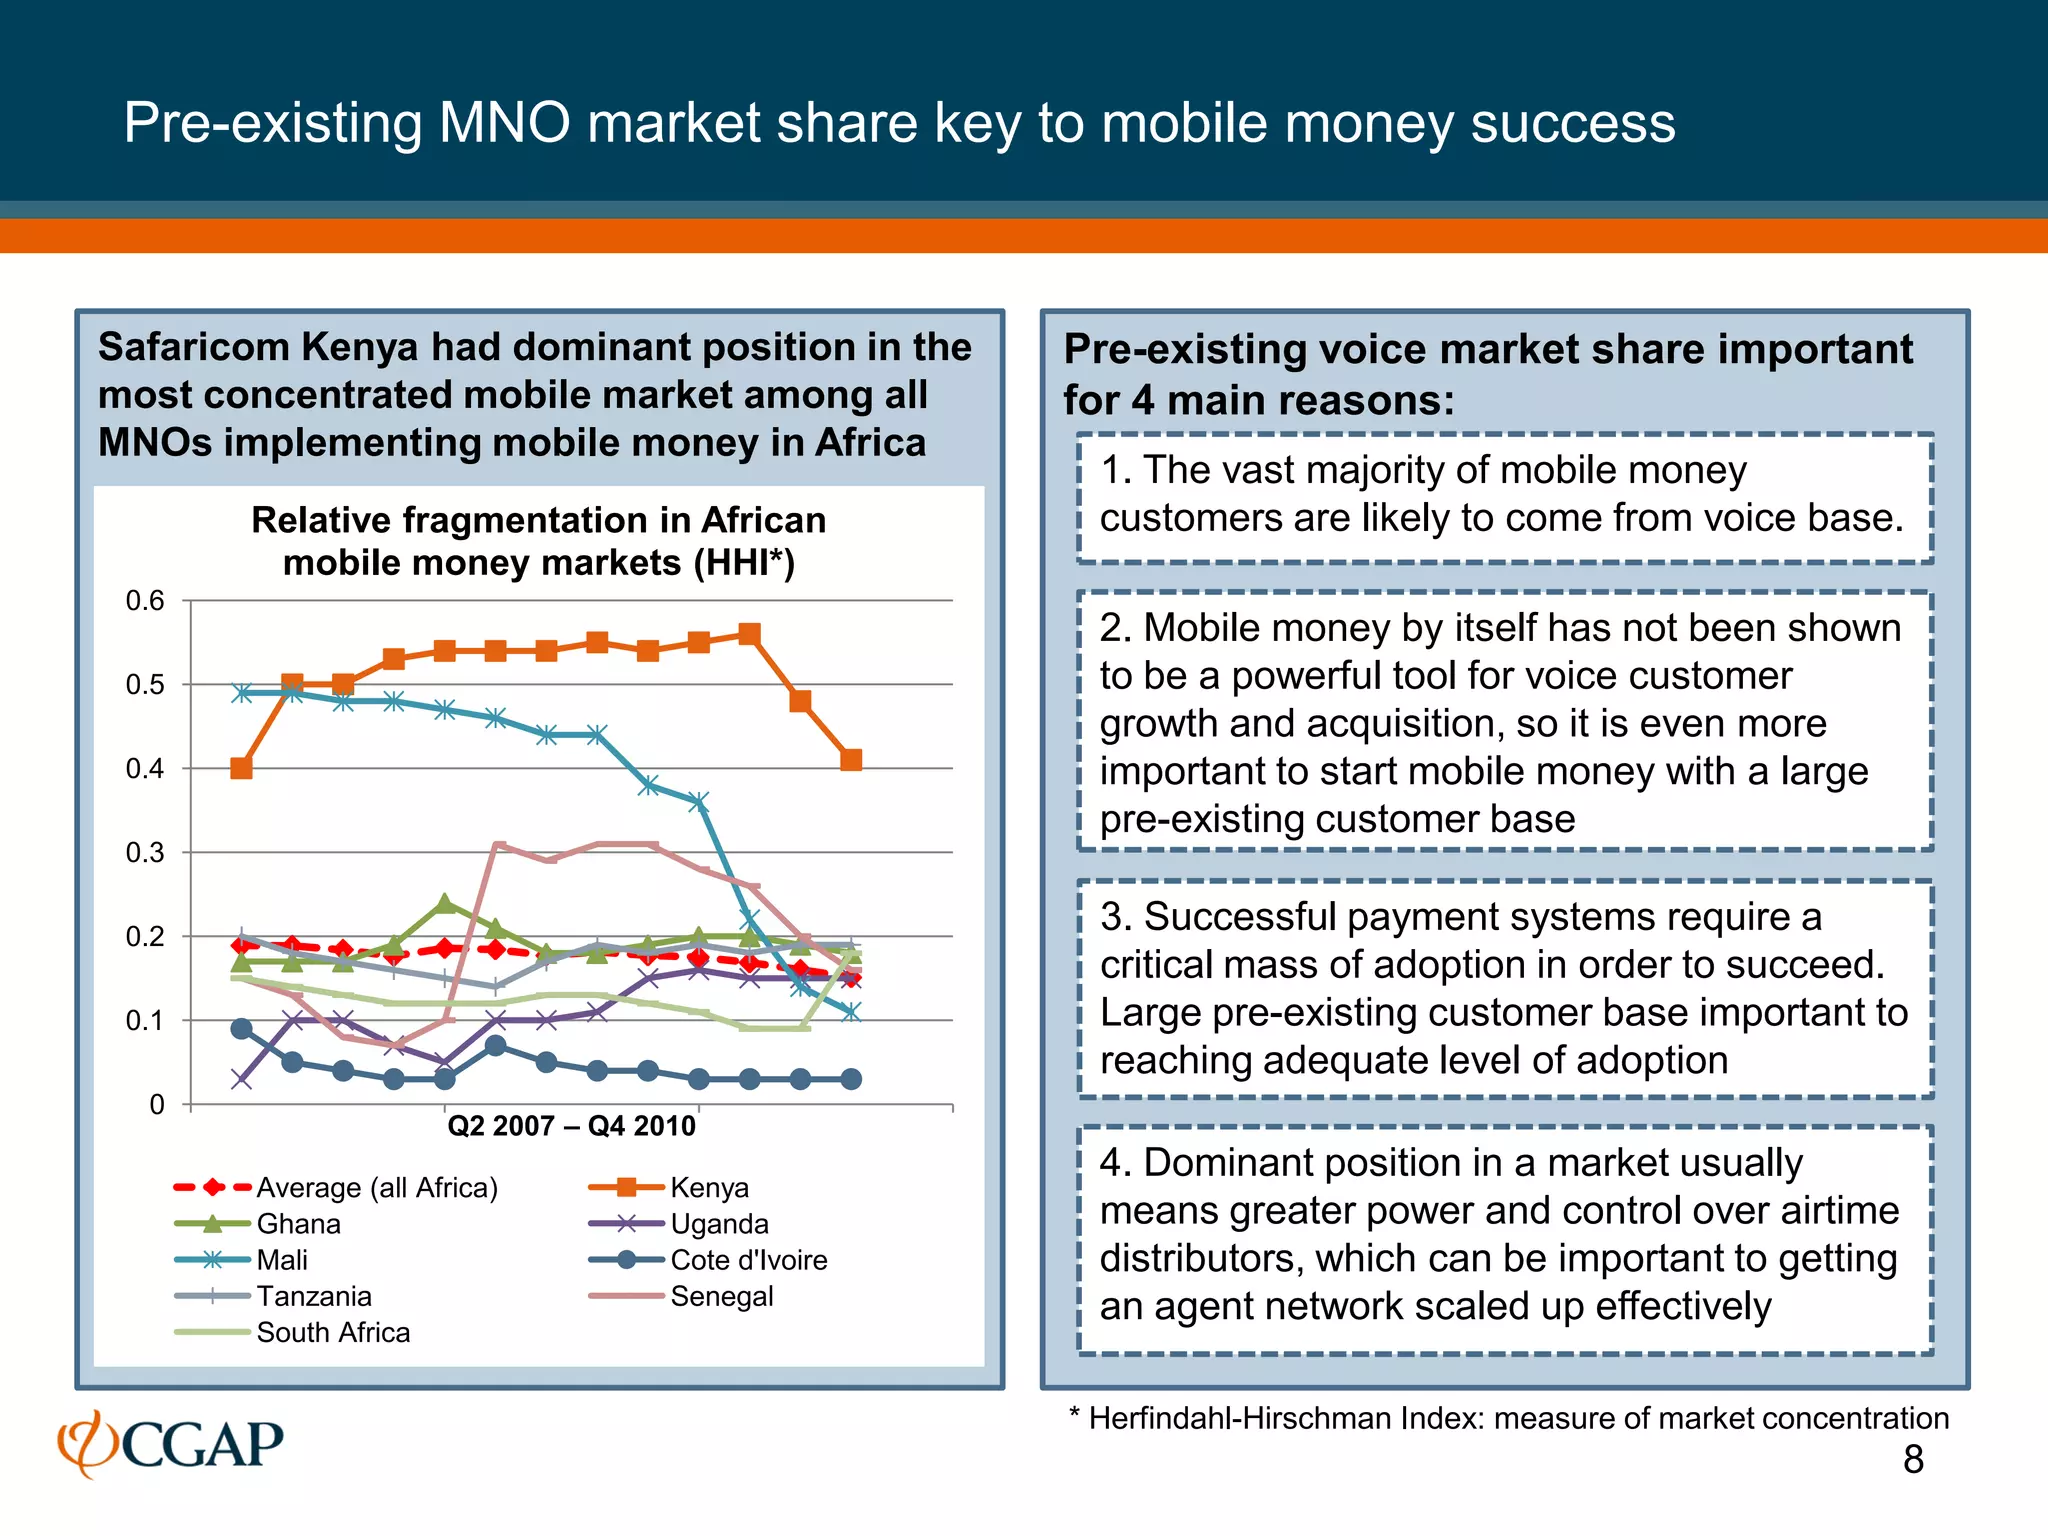

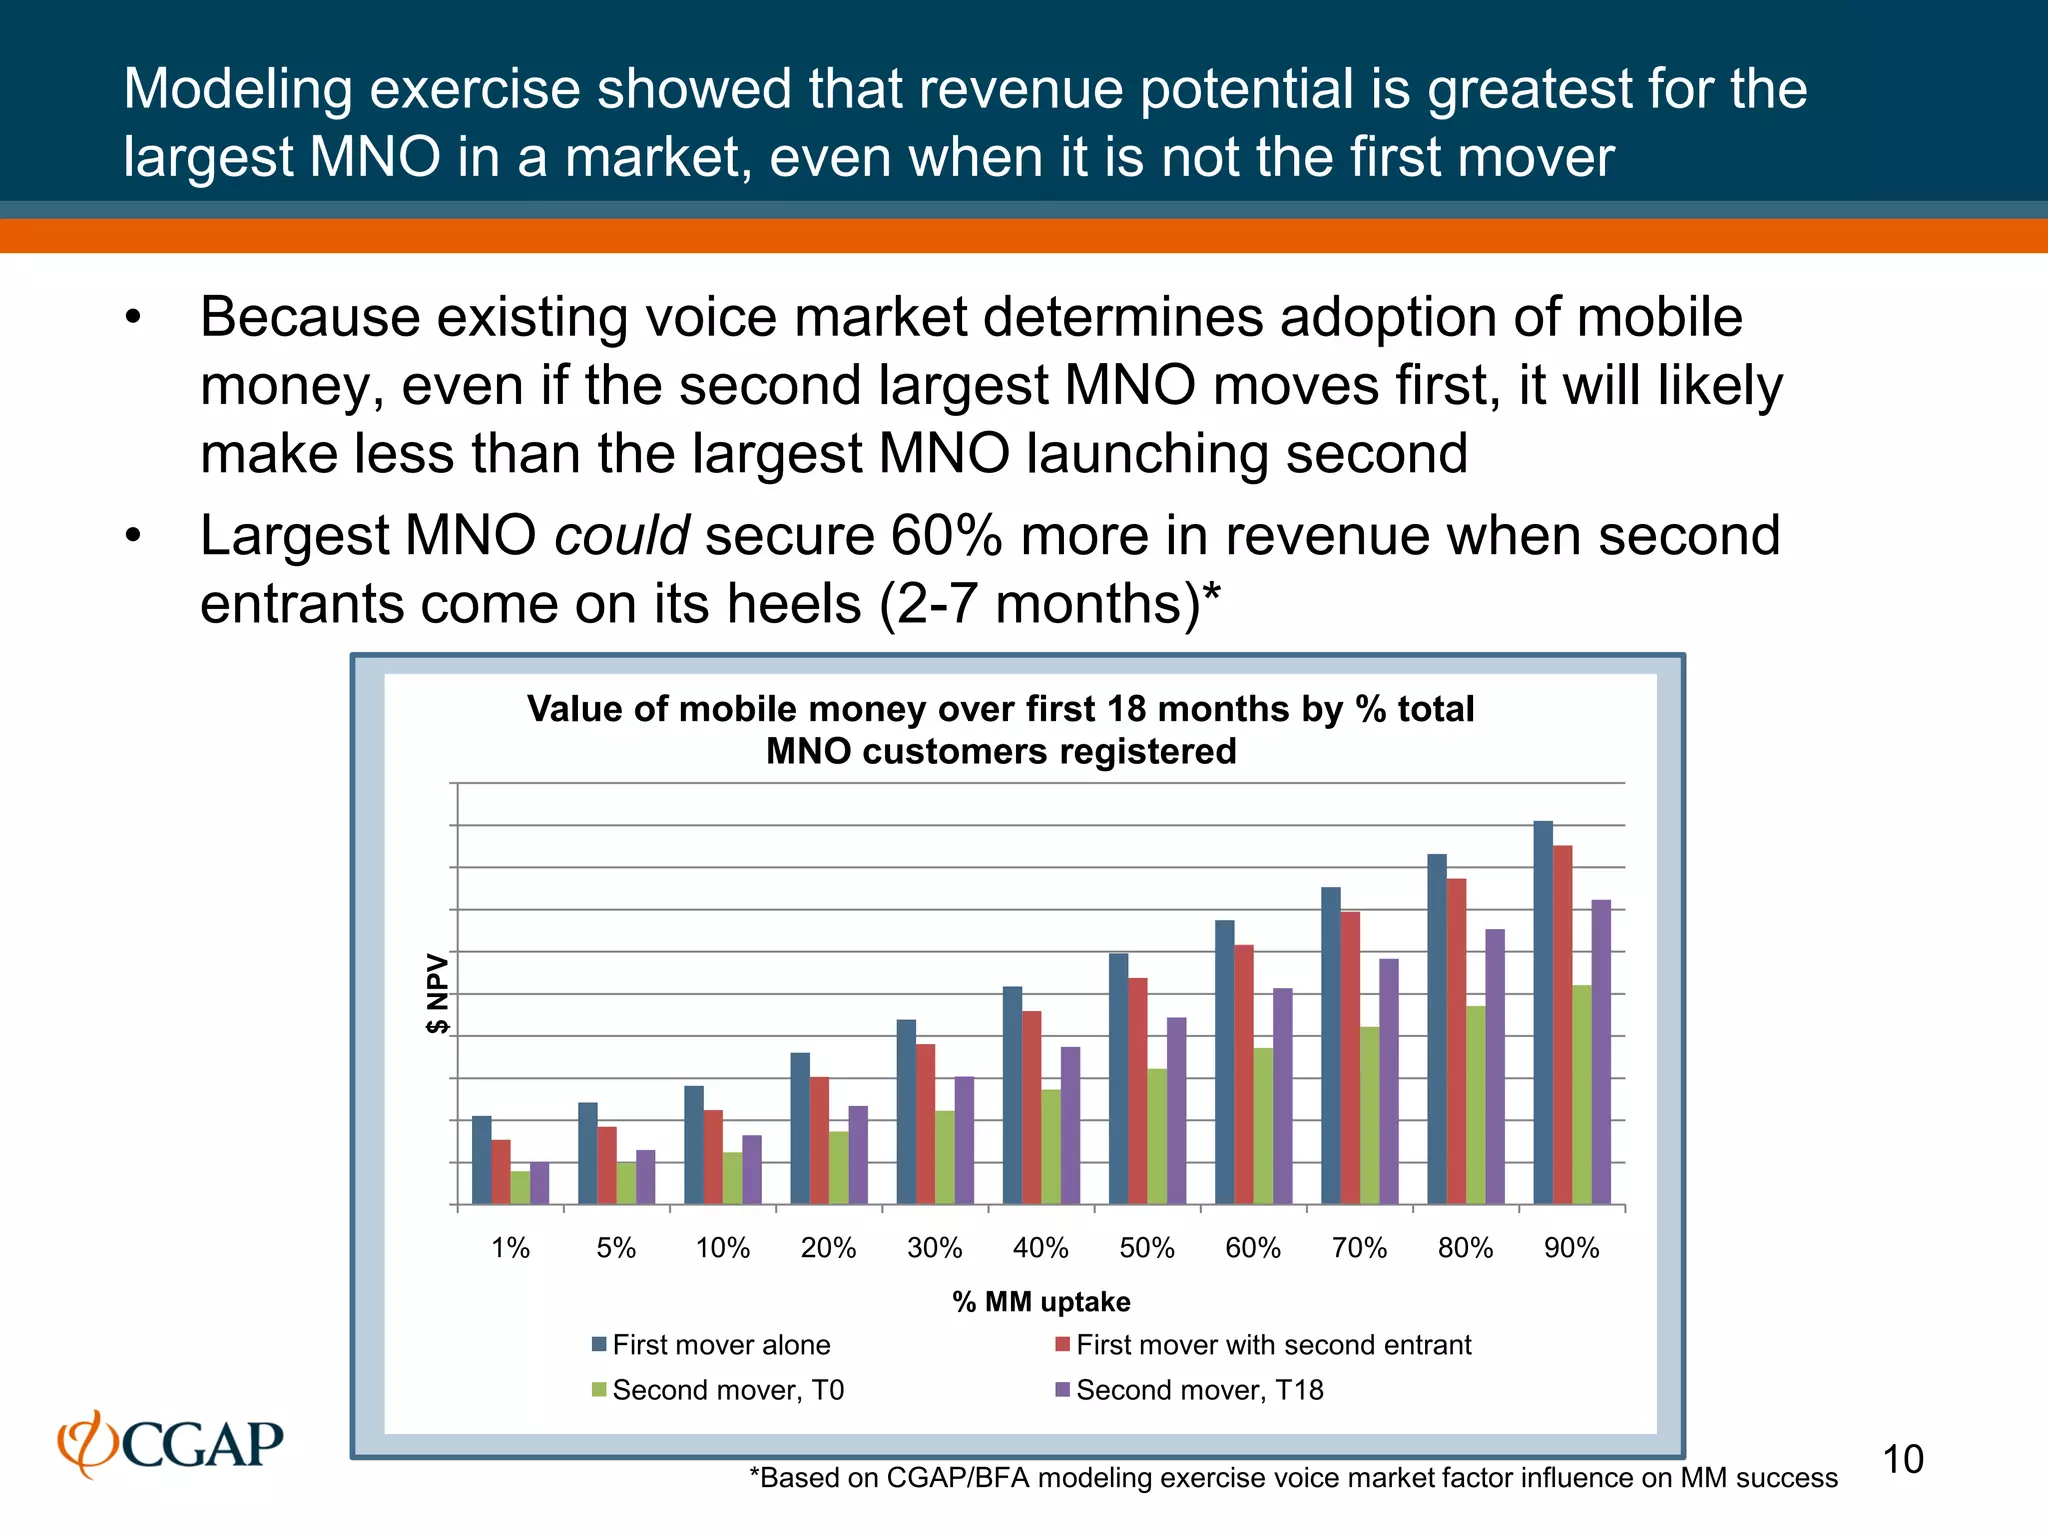


1. Mobile money contribution may be small compared to current MNO total revenue but could be important for future revenue growth. Mobile money is expected to reach 10% of total MNO revenue within 10 years and be cash flow positive within 3 years for many operators. 2. Mobile money success is highly dependent on the size of the MNO's existing voice customer base. Having a large pre-existing customer base is important for driving adoption of mobile money services and reaching critical mass. 3. Modeling shows that even if not the first mover, the revenue potential is greatest for the largest MNO in a given market due to their larger existing customer base driving higher adoption of mobile money services.


