This document discusses mobile virtual network operators (MVNOs). It provides an overview of the MVNO ecosystem and business models, as well as global trends in MVNO regulation and markets. Key points include:
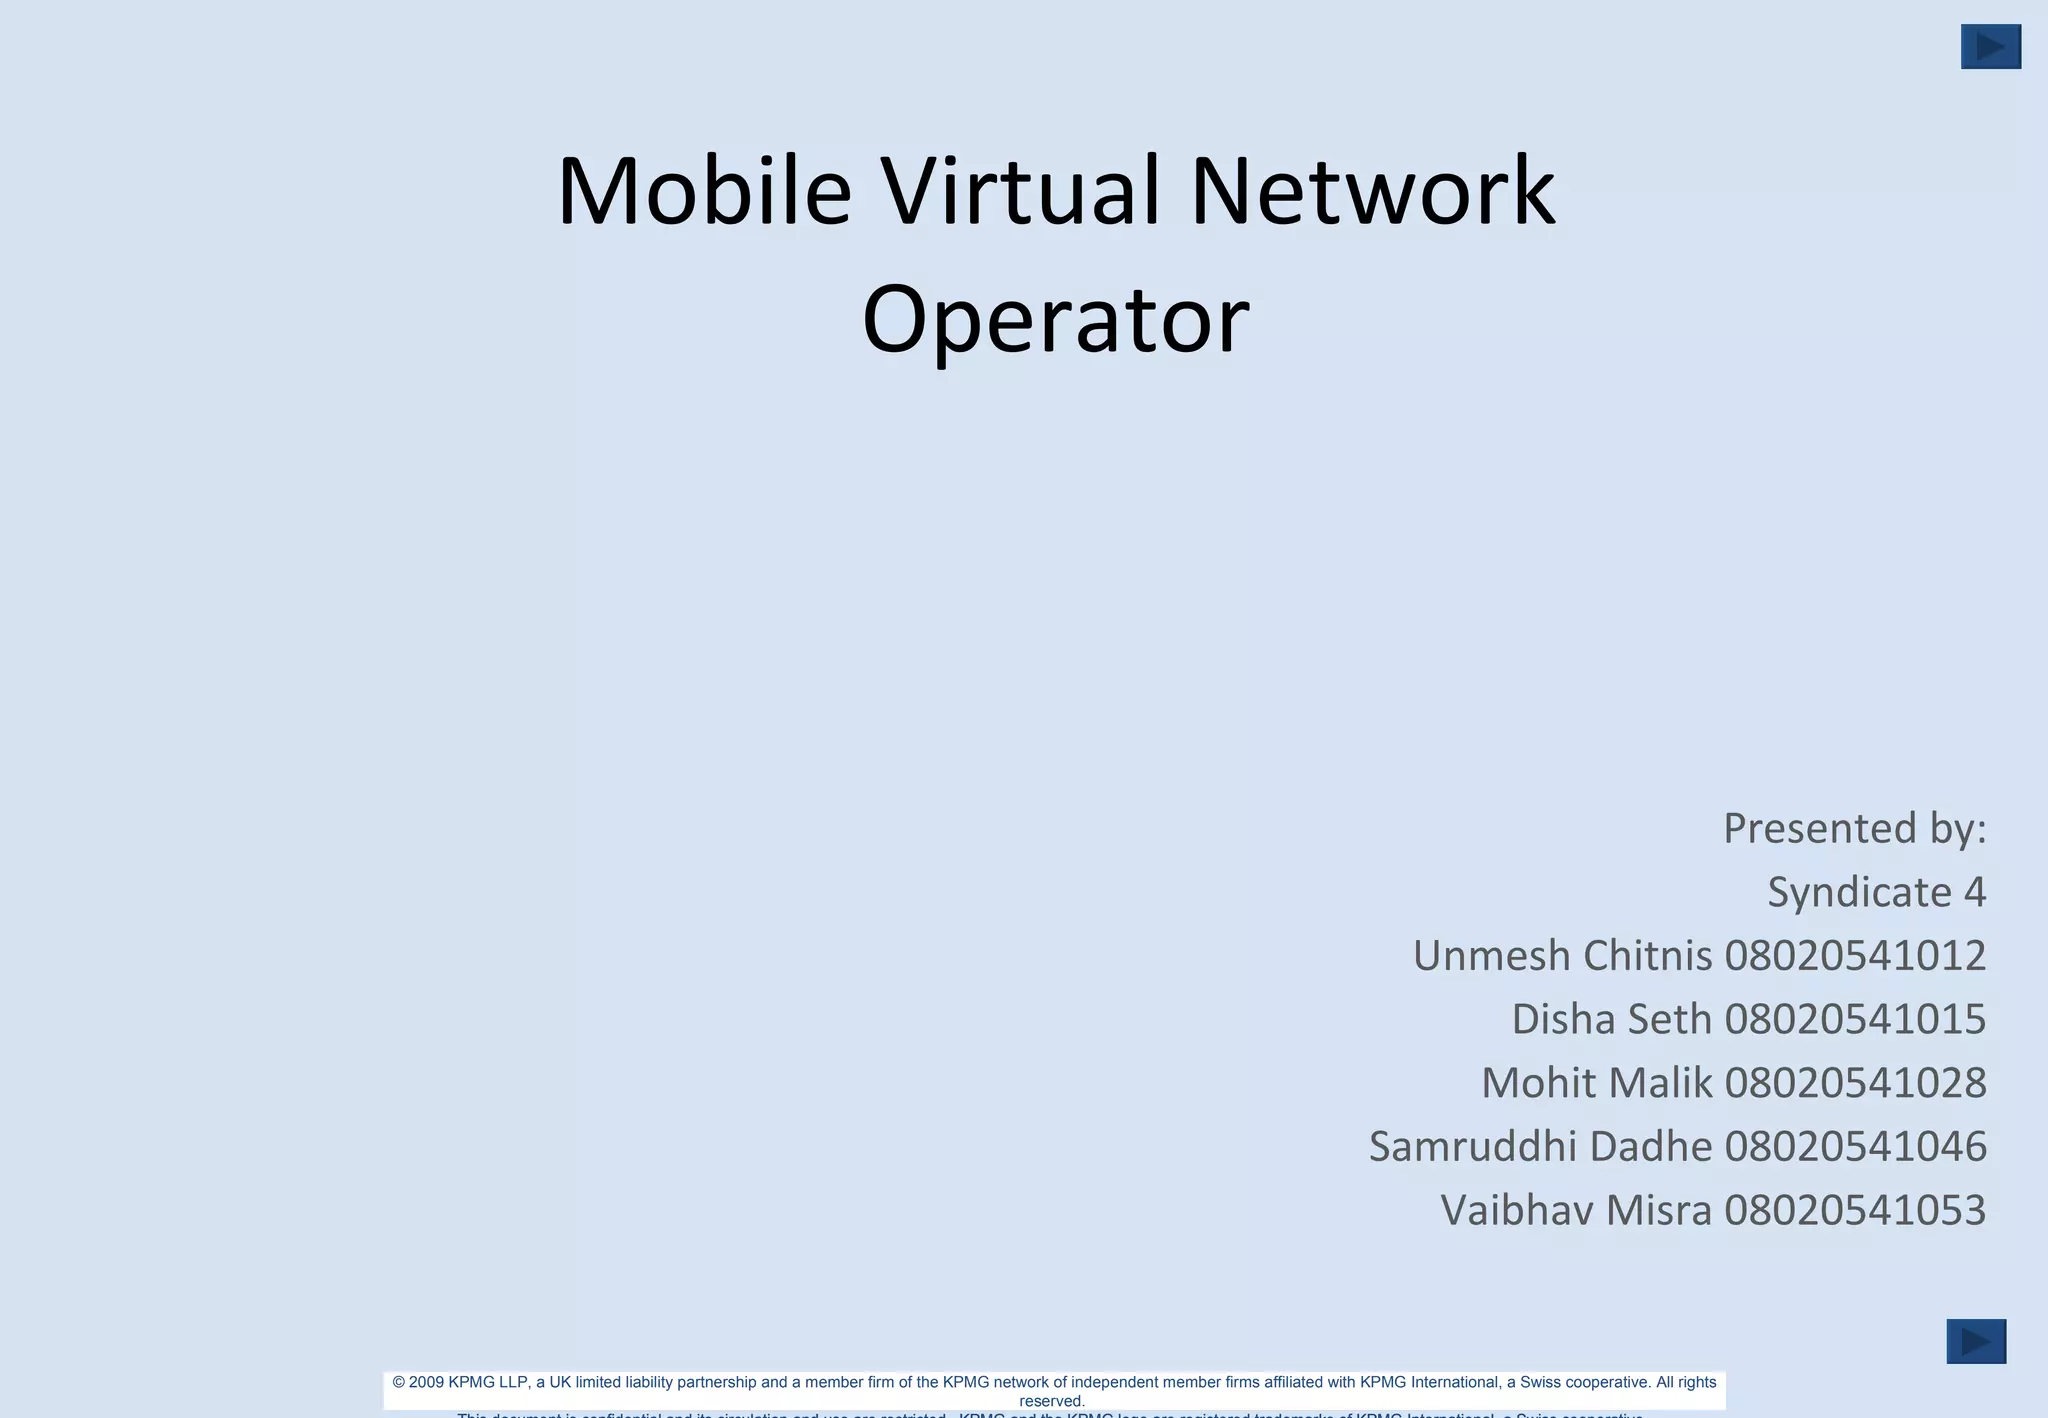
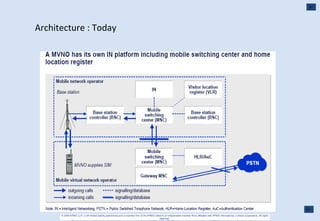
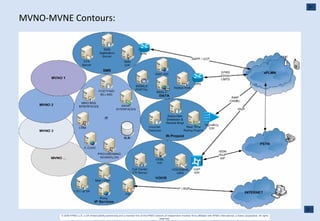
- MVNOs purchase airtime from existing mobile network operators and resell it to customers without owning their own network infrastructure.
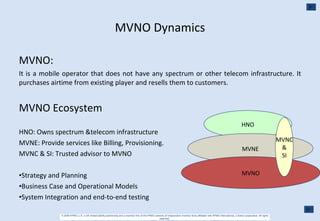
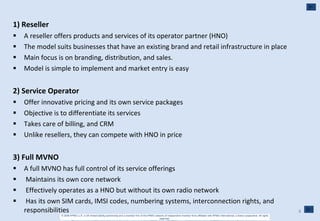
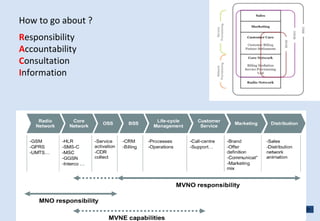
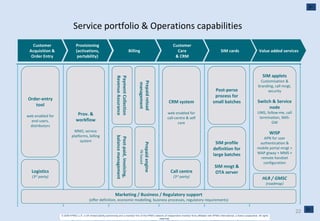
- Common MVNO models include resellers, service operators, and full MVNOs with varying levels of control over offerings.
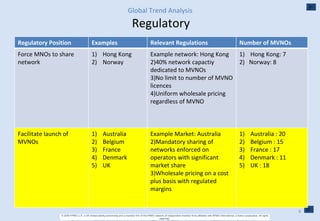
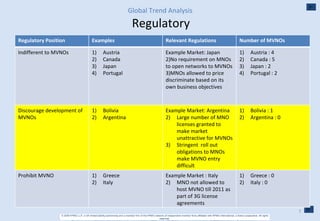
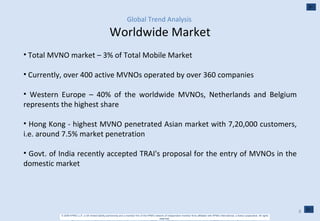
- Global MVNO markets range from countries that actively support MVNOs to those that are indifferent or prohibit them.
- Challenges to the growth of MVNOs in India include mobile number portability, lowering prices, and financial viability.