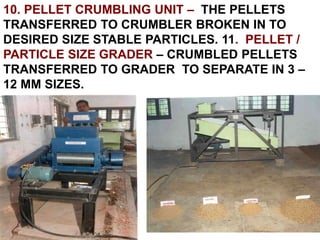
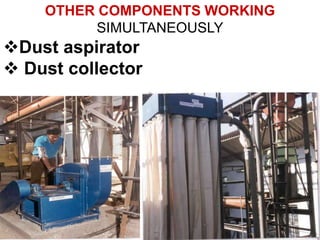
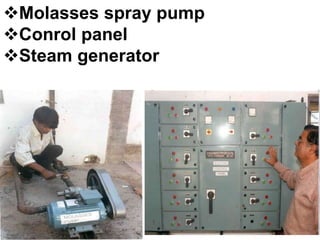
INDIGENOUS FISH FEED
MANUFACTURING PLANT
DR JAI SINGH (ARS)
M. TECH PH D
FORMER HOD
& PRINCIPAL INVESTIGATOR
ICAR – CIAE, BHOPAL
Mob : 8958463808
jsingh.sre@gmail.com
FISHERY STATUS IN INDIA
Potential Production 8.4 mmt
Present Fish Production 6.18 mmt
 Inland 3.16 mmt ( 2ND position in
world)
Marine 3.02 mmt
Inland Fishery Water Resources in
India
29,000 kms of rivers,
 0.3 million ha of estuaries,
 0.19 million ha of backwaters and
lagoons,
 3.15 million ha of reservoirs,
0.2 million ha of floodplain
wetlands and
 0.72 million ha of upland lakes
Marine Fishery Water Resources in India
8129 km long coastline
0.5 million sq km continental shelf
2.o2 sq km exclusive economic zone
Brakish water resources
1.2 million ha – 1.3 lakh tonnes production
Cold Water Fisheries Resources
Water bodies --- AREA
Steams/ Rivers = 10,000 KM
 Natural lakes = 20500HA
 Reservoirs = 50000 HA
Brackish water lakes = 2500 HA
Aquaculture Resources in India (NFDB – 2018)
Coastline 8129 kms
Exclusive Economic Zone 2.02 million sq. km
Continental Shelf 0.506 million sq. km
Rivers and Canals 1,91,024 km
Reservoirs 3.15 million ha
Ponds and Tanks 2.35 million ha
Oxbow lakes and derelict
waters
1.3 million ha
Brackishwaters 1.24 million ha
Estuaries 0.29 million ha
PR0DUCTION STATUS (NFDB)
Present fish Production 6.4 mmt
Inland 3.4 mmt
Marine 3.0 mmt
Potential fish production 8.4 mmt
Fish seed production 21,000 million fry
Hatcheries 1,070
FFDA 422
BFDA 39
Fish Production Systems in India
• Extensive / Low = 2 t / ha
• Semi- extensive / Moderate = 5 t / ha
• Intensive / High input = 8 t / ha
• More intensive / Industrial = 15 t / ha
AQUACULTURE SYSTEMS IN INDIA
•LOW PRODUCING = 2 T / Ha
•MODERATE PRODUCING = 5 T / Ha
•HIGHINPUT BASED = 8 T / HA
PRODUCTIVITY- 10.07 MILLION TONNES
Important fresh water species
ROHU Labeo
Rohita
HILSA – llish
shad
KATLA –
Indian carp
Important fresh
water species
TILAPIA – Cichlid
PRAWN - Fish
IMPORTANT COLD WATER FISH SPECIES
1. Golden mahseer, Tor
putitora
2. 2 Snow trout,
Schizothorax
richardsonii
3. . Common carp,
Cyprinus carpio
4.Silver carp,
Hypophthalmichthys
molitrix
Economic AnalysisIndian Fisheries (NFDB –
2018 ))
Global position 3rd in Fisheries 2nd in Aquaculture
Contribution of Fisheries to GDP (%) 1.07
Contribution to Agril. GDP (%) 5.15
Per capita fish availability (Kg.) 9.0
Annual Export earnings (Rs. In Crore) 33,441.61
Employment in sector (million) 14.0
ANALYSIS OF NEEDS FOR FEED MANUFACTURING
General
 Aqua – based food demand is increasing @ 0.6 % per
 annum
 Fish eating population in India is about 56 %
 Per capita / annum consumption of fish in India is 3.5 Kg
 against 86 Kg in Japan
 Inland fishery in India has increased 14- fold
 Feed cost is 50 – 70 % of the production cost
 Shrimp /Prawn feed is imported at high cost .
Physical form and chemical composition of feed varies
 with species, growth stage and production environment
ANALYSIS OF NEEDS -- CONTD
General
Feed manufacturing units set up in foreign
 collaboration import feed ingredients
 Large capacity units of 5 – 7 t/hr capacity cost Rs 12 –
 14 crores and are mostly under utilized
 Concentration of large capacity factories along coastal
line or in big cities result in high cost on storage,
 Transport and handling for numerous disposal out lets
 Because inland fishery is based on satellite production
farms spread through length and breadth of the state /
country
FEED SPECIFIC ANALYSIS OF NEEDS
 Natural feed based average capture from rivers, lakes and
reservoirs range between 48 to 250 kg per ha per crop.
Average production from ponds on natural feed is about
600 kg per ha per year
Indian average is 2000 Kg / ha/year
Culture – based fishery on small ponds is the most
appropriate management option
Semi – intensive culture with supplementary feed can yield
5000 Kg / ha / year
CONTD …..ANALYSIS OF NEEDS FEED SPECIFIC
Intensive culture with supplementary feed can yield 15000
kg per ha per year
Industrial culture on supplementary feed exhibited yield of
35 to 50 , 000 kg per ha per year
Present feed deficit on extensive culture basis is 88% and
very large for intensive and extensive culture basis.
There is high promise to utilize local produce and local
agro industrial by products.
FISH FEED MANUFACTURING PLANT
COMPONENTS
1.WEIGHING BAANCE - TO WEIGH INGREDIENTS AS
PRESCRIBED , 2. ELEVATOR - TO TRANSFER FEED
INGREDIENTS TO PRE – MIXER , 3. PRE – MIXURE FOR
DRY MIXING OF INGREDIENTS, 4 . ELEVATOR - TO
ELEVATE AND TRANSFER MIXED MATERIAL TO GRINDING
UNIT.
5. SIZE REDUCTION UNIT – GRINDER TO GRIND
INGREDIENTS MIXTURE TO REQUIRED SIZE , 6.
GYRO SCREEN SHIFTER – TO SIEVE AND
TRANSFER ACCEPTED MATERIAL TO COOKER
AND OVER SIZE PARTICLES BACK TO GRINDER.
7. PADDLE –- MIXER - CONVEYOR – TO ADD MOLASSES,
VITAMIN MIX AND STEAM . HERE COOKING AND MIXING
CONTINUES ALON WITH TRANSFER TO CONDITIONER. MIX
GROUND INGREDIENTS , 8. CONDITIONER – STEAM IS
INJECTED TO DISINFECT , MOISTEN AND CONDITIONING
9. PELLETING UNIT - TO PELLETIZE
CONDITINED FEED TO DESIRED DIAMETER
AND LENGTH
10. PELLET CRUMBLING UNIT – THE PELLETS
TRANSFERRED TO CRUMBLER BROKEN IN TO
DESIRED SIZE STABLE PARTICLES. 11. PELLET /
PARTICLE SIZE GRADER – CRUMBLED PELLETS
TRANSFERRED TO GRADER TO SEPARATE IN 3 –
12 MM SIZES.
OTHER COMPONENTS WORKING
SIMULTANEOUSLY
Dust aspirator
 Dust collector
Molasses spray pump
Conrol panel
Steam generator
TO THE DEPARTMENT OF BIOTECHNOLOGY,
GOVT OF INDIA AND COUNCIL OF SCIENCE
AND TECHNOLOGY, GOVT OF MADHYA
PRADESH - Dr jai singh

Fish 2 fish feed manufacturing plant

  • 1.
    INDIGENOUS FISH FEED MANUFACTURINGPLANT DR JAI SINGH (ARS) M. TECH PH D FORMER HOD & PRINCIPAL INVESTIGATOR ICAR – CIAE, BHOPAL Mob : 8958463808 jsingh.sre@gmail.com
  • 2.
    FISHERY STATUS ININDIA Potential Production 8.4 mmt Present Fish Production 6.18 mmt  Inland 3.16 mmt ( 2ND position in world) Marine 3.02 mmt
  • 3.
    Inland Fishery WaterResources in India 29,000 kms of rivers,  0.3 million ha of estuaries,  0.19 million ha of backwaters and lagoons,  3.15 million ha of reservoirs, 0.2 million ha of floodplain wetlands and  0.72 million ha of upland lakes
  • 4.
    Marine Fishery WaterResources in India 8129 km long coastline 0.5 million sq km continental shelf 2.o2 sq km exclusive economic zone Brakish water resources 1.2 million ha – 1.3 lakh tonnes production Cold Water Fisheries Resources Water bodies --- AREA Steams/ Rivers = 10,000 KM  Natural lakes = 20500HA  Reservoirs = 50000 HA Brackish water lakes = 2500 HA
  • 5.
    Aquaculture Resources inIndia (NFDB – 2018) Coastline 8129 kms Exclusive Economic Zone 2.02 million sq. km Continental Shelf 0.506 million sq. km Rivers and Canals 1,91,024 km Reservoirs 3.15 million ha Ponds and Tanks 2.35 million ha Oxbow lakes and derelict waters 1.3 million ha Brackishwaters 1.24 million ha Estuaries 0.29 million ha
  • 6.
    PR0DUCTION STATUS (NFDB) Presentfish Production 6.4 mmt Inland 3.4 mmt Marine 3.0 mmt Potential fish production 8.4 mmt Fish seed production 21,000 million fry Hatcheries 1,070 FFDA 422 BFDA 39
  • 7.
    Fish Production Systemsin India • Extensive / Low = 2 t / ha • Semi- extensive / Moderate = 5 t / ha • Intensive / High input = 8 t / ha • More intensive / Industrial = 15 t / ha AQUACULTURE SYSTEMS IN INDIA •LOW PRODUCING = 2 T / Ha •MODERATE PRODUCING = 5 T / Ha •HIGHINPUT BASED = 8 T / HA PRODUCTIVITY- 10.07 MILLION TONNES
  • 8.
    Important fresh waterspecies ROHU Labeo Rohita HILSA – llish shad KATLA – Indian carp
  • 9.
    Important fresh water species TILAPIA– Cichlid PRAWN - Fish
  • 10.
    IMPORTANT COLD WATERFISH SPECIES 1. Golden mahseer, Tor putitora 2. 2 Snow trout, Schizothorax richardsonii 3. . Common carp, Cyprinus carpio 4.Silver carp, Hypophthalmichthys molitrix
  • 11.
    Economic AnalysisIndian Fisheries(NFDB – 2018 )) Global position 3rd in Fisheries 2nd in Aquaculture Contribution of Fisheries to GDP (%) 1.07 Contribution to Agril. GDP (%) 5.15 Per capita fish availability (Kg.) 9.0 Annual Export earnings (Rs. In Crore) 33,441.61 Employment in sector (million) 14.0
  • 12.
    ANALYSIS OF NEEDSFOR FEED MANUFACTURING General  Aqua – based food demand is increasing @ 0.6 % per  annum  Fish eating population in India is about 56 %  Per capita / annum consumption of fish in India is 3.5 Kg  against 86 Kg in Japan  Inland fishery in India has increased 14- fold  Feed cost is 50 – 70 % of the production cost  Shrimp /Prawn feed is imported at high cost . Physical form and chemical composition of feed varies  with species, growth stage and production environment
  • 13.
    ANALYSIS OF NEEDS-- CONTD General Feed manufacturing units set up in foreign  collaboration import feed ingredients  Large capacity units of 5 – 7 t/hr capacity cost Rs 12 –  14 crores and are mostly under utilized  Concentration of large capacity factories along coastal line or in big cities result in high cost on storage,  Transport and handling for numerous disposal out lets  Because inland fishery is based on satellite production farms spread through length and breadth of the state / country
  • 14.
    FEED SPECIFIC ANALYSISOF NEEDS  Natural feed based average capture from rivers, lakes and reservoirs range between 48 to 250 kg per ha per crop. Average production from ponds on natural feed is about 600 kg per ha per year Indian average is 2000 Kg / ha/year Culture – based fishery on small ponds is the most appropriate management option Semi – intensive culture with supplementary feed can yield 5000 Kg / ha / year
  • 15.
    CONTD …..ANALYSIS OFNEEDS FEED SPECIFIC Intensive culture with supplementary feed can yield 15000 kg per ha per year Industrial culture on supplementary feed exhibited yield of 35 to 50 , 000 kg per ha per year Present feed deficit on extensive culture basis is 88% and very large for intensive and extensive culture basis. There is high promise to utilize local produce and local agro industrial by products.
  • 16.
    FISH FEED MANUFACTURINGPLANT COMPONENTS 1.WEIGHING BAANCE - TO WEIGH INGREDIENTS AS PRESCRIBED , 2. ELEVATOR - TO TRANSFER FEED INGREDIENTS TO PRE – MIXER , 3. PRE – MIXURE FOR DRY MIXING OF INGREDIENTS, 4 . ELEVATOR - TO ELEVATE AND TRANSFER MIXED MATERIAL TO GRINDING UNIT.
  • 17.
    5. SIZE REDUCTIONUNIT – GRINDER TO GRIND INGREDIENTS MIXTURE TO REQUIRED SIZE , 6. GYRO SCREEN SHIFTER – TO SIEVE AND TRANSFER ACCEPTED MATERIAL TO COOKER AND OVER SIZE PARTICLES BACK TO GRINDER.
  • 18.
    7. PADDLE –-MIXER - CONVEYOR – TO ADD MOLASSES, VITAMIN MIX AND STEAM . HERE COOKING AND MIXING CONTINUES ALON WITH TRANSFER TO CONDITIONER. MIX GROUND INGREDIENTS , 8. CONDITIONER – STEAM IS INJECTED TO DISINFECT , MOISTEN AND CONDITIONING
  • 19.
    9. PELLETING UNIT- TO PELLETIZE CONDITINED FEED TO DESIRED DIAMETER AND LENGTH
  • 20.
    10. PELLET CRUMBLINGUNIT – THE PELLETS TRANSFERRED TO CRUMBLER BROKEN IN TO DESIRED SIZE STABLE PARTICLES. 11. PELLET / PARTICLE SIZE GRADER – CRUMBLED PELLETS TRANSFERRED TO GRADER TO SEPARATE IN 3 – 12 MM SIZES.
  • 21.
  • 22.
    Molasses spray pump Conrolpanel Steam generator
  • 23.
    TO THE DEPARTMENTOF BIOTECHNOLOGY, GOVT OF INDIA AND COUNCIL OF SCIENCE AND TECHNOLOGY, GOVT OF MADHYA PRADESH - Dr jai singh