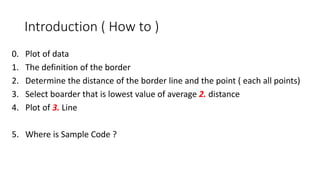
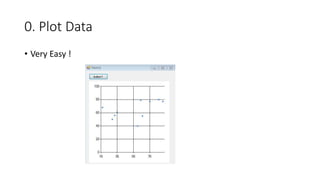
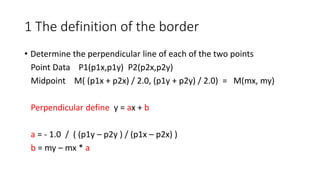
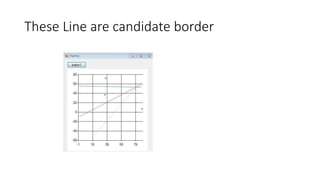
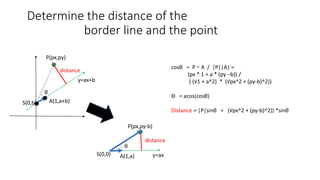
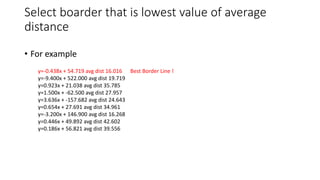
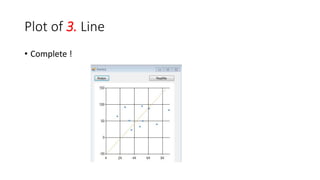
First Step SVM
Yoshinobu Tanno
http://ytanno.herokuapp.com/
Introduction ( How to )
0. Plot of data
1. The definition of the border
2. Determine the distance of the border line and the point ( each all points)
3. Select boarder that is lowest value of average 2. distance
4. Plot of 3. Line
5. Where is Sample Code ?
0. Plot Data
• Very Easy !
1 The definition of the border
• Determine the perpendicular line of each of the two points
Point Data P1(p1x,p1y) P2(p2x,p2y)
Midpoint M( (p1x + p2x) / 2.0, (p1y + p2y) / 2.0) = M(mx, my)
Perpendicular define y = ax + b
a = - 1.0 / ( (p1y – p2y ) / (p1x – p2x) )
b = my – mx * a
These Line are candidate border
Determine the distance of the
border line and the point
P(px,py)
y=ax+b
S(0,b)
θ
distance
A(1,a+b)
cosθ = P ・ A / |P||A| =
(px * 1 + a * (py –b)) /
( (√1 + a^2) * (√px^2 + (py-b)^2))
Θ = acos(cosθ)
Distance = |P|sinθ = (√px^2 + (py-b)^2)) *sinθ
P(px,py-b)
y=axS(0,0)
θ
distance
A(1,a)
Select boarder that is lowest value of average
distance
• For example
y=-0.438x + 54.719 avg dist 16.016 Best Border Line !
y=-9.400x + 522.000 avg dist 19.719
y=0.923x + 21.038 avg dist 35.785
y=1.500x + -62.500 avg dist 27.957
y=3.636x + -157.682 avg dist 24.643
y=0.654x + 27.691 avg dist 34.961
y=-3.200x + 146.900 avg dist 16.268
y=0.446x + 49.892 avg dist 42.602
y=0.186x + 56.821 avg dist 39.556
Plot of 3. Line
• Complete !
Where is sample code ?
• https://github.com/ytanno/svm

First Step SVM

  • 1.
    First Step SVM YoshinobuTanno http://ytanno.herokuapp.com/
  • 2.
    Introduction ( Howto ) 0. Plot of data 1. The definition of the border 2. Determine the distance of the border line and the point ( each all points) 3. Select boarder that is lowest value of average 2. distance 4. Plot of 3. Line 5. Where is Sample Code ?
  • 3.
    0. Plot Data •Very Easy !
  • 4.
    1 The definitionof the border • Determine the perpendicular line of each of the two points Point Data P1(p1x,p1y) P2(p2x,p2y) Midpoint M( (p1x + p2x) / 2.0, (p1y + p2y) / 2.0) = M(mx, my) Perpendicular define y = ax + b a = - 1.0 / ( (p1y – p2y ) / (p1x – p2x) ) b = my – mx * a
  • 5.
    These Line arecandidate border
  • 6.
    Determine the distanceof the border line and the point P(px,py) y=ax+b S(0,b) θ distance A(1,a+b) cosθ = P ・ A / |P||A| = (px * 1 + a * (py –b)) / ( (√1 + a^2) * (√px^2 + (py-b)^2)) Θ = acos(cosθ) Distance = |P|sinθ = (√px^2 + (py-b)^2)) *sinθ P(px,py-b) y=axS(0,0) θ distance A(1,a)
  • 7.
    Select boarder thatis lowest value of average distance • For example y=-0.438x + 54.719 avg dist 16.016 Best Border Line ! y=-9.400x + 522.000 avg dist 19.719 y=0.923x + 21.038 avg dist 35.785 y=1.500x + -62.500 avg dist 27.957 y=3.636x + -157.682 avg dist 24.643 y=0.654x + 27.691 avg dist 34.961 y=-3.200x + 146.900 avg dist 16.268 y=0.446x + 49.892 avg dist 42.602 y=0.186x + 56.821 avg dist 39.556
  • 8.
    Plot of 3.Line • Complete !
  • 9.
    Where is samplecode ? • https://github.com/ytanno/svm