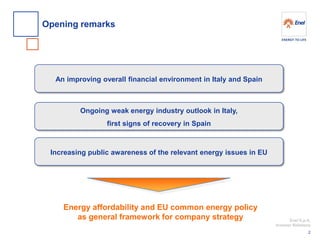
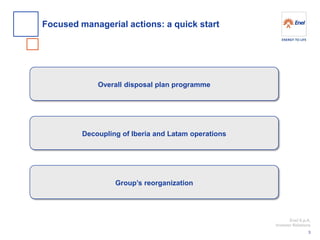
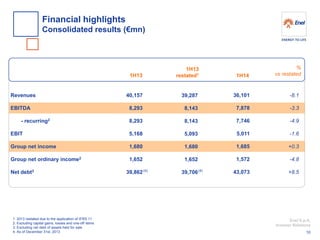
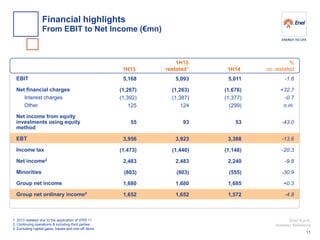
July 31, 2014 
2014 Interim results
Enel S.p.A. 
Investor Relations 
•Opening remarks 
•2014 Interim results 
•Closing remarks 
•Annexes 
Agenda 
1 
F. Starace L. Ferraris F. Starace
Enel S.p.A. 
Investor Relations 
Opening remarks 
2 
Ongoing weak energy industry outlook in Italy, 
first signs of recovery in Spain 
Increasing public awareness of the relevant energy issues in EU 
An improving overall financial environment in Italy and Spain 
Energy affordability and EU common energy policy 
as general framework for company strategy
Enel S.p.A. 
Investor Relations 
Focused managerial actions: a quick start 
3 
Overall disposal plan programme 
Decoupling of Iberia and Latam operations 
Group’s reorganization
Enel S.p.A. 
Investor Relations 
Ongoing disposal programme 
4 
Ca. 4 €bn original target confirmed 
Generation assets in Slovakia / distribution assets in Romania 
Further potential disposals already identified, 
mainly non strategic assets worldwide 
Gain flexibility to cope with a more challenging scenario
Enel S.p.A. 
Investor Relations 
Decoupling of Iberia and Latam operations 
5 
Step 1 Enel Energy Europe acquires 100% of Endesa Latam and 20.3% of Enersis 
Step 2 
Extraordinary dividend Endesa SA in cash 
POST transaction 
A more focused Group’s structure in line with the new organizational model 
PRE transaction 
Listed company 
Not listed company 
Enel SpA 
Enel Energy Europe 
100% 
Endesa SA 
Endesa Latam 
Enersis 
92.06% 
100% 
20,3% 
40.32% 
Enel SpA 
100% 
Endesa SA 
20.30% 
40.32% 
100% 
Enersis 
Endesa Latam 
92.06% 
Enel Energy Europe 
0% 
Extraordinary cash dividend Endesa 
Enel SpA 
100% 
Endesa SA 
20.30% 
40.32% 
100% 
Enersis 
Endesa Latam 
92.06% 
Enel Energy Europe 
0% 
Enel SpA 
100% 
Endesa SA 
20.30% 
40.32% 
100% 
Enersis 
Endesa Latam 
Enel Energy Europe 
92.06%
Enel S.p.A. 
Investor Relations 
Decoupling of Iberia and Latam operations 
6 
Rationale at Group level 
•Refocusing the strategy on clear dedicated value drivers 
 Iberia: efficiency enhancing and capex redeployment 
 Latam: focus on organic growth and business development 
•Further step in increasing the economic interest in Latam 
Benefits for Endesa 
•Industrial plan tailored for the Iberian market 
•More efficient capital structure 
•Visible and stable cash flow as a base for future dividend policy 
Accelerating on Group’s restructuring
Enel S.p.A. 
Investor Relations 
Group’s reorganization 
7 
Global Generation 
Global 
Infrastructures 
& Networks 
Renewable 
Energies 
Global business lines 
A more business oriented and lean 
organization of the Group 
Upstream 
Gas 
Global 
Trading 
Regions 
Italy 
Iberia 
Latam 
East Europe 
Relevant KPIs: 
•Revenues 
•Opex (staff/services) 
•Cash flow 
Relevant KPIs: 
•Capex optimization 
•best practice sharing and efficiency improvements
Enel S.p.A. 
Investor Relations 
Group’s reorganization 
8 
Best practices implementation all throughout the regions 
Unlocking value through a 
business oriented and lean organizational model 
Enhancing efficiencies in capex and opex 
Global business lines coupled with ultimate responsibility at country level 
Centralized capital allocation 
Reduction of complexity
Enel S.p.A. 
Investor Relations 
•Opening remarks 
•2014 Interim results 
•Closing remarks 
•Annexes 
Agenda 
9 
F. Starace L. Ferraris F. Starace
Enel S.p.A. 
Investor Relations 
1H13 restated1 
1H14 
% 
vs restated 
1. 2013 restated due to the application of IFRS 11 
2. Excluding capital gains, losses and one-off items 
3. Excluding net debt of assets held for sale 
4. As of December 31st, 2013 
Revenues 
EBITDA 
- recurring2 
EBIT 
Group net income 
Group net ordinary income2 
Net debt3 
-8.1 
-3.3 
-4.9 
-1.6 
+0.3 
-4.8 
+8.5 
36,101 
7,878 
7,746 
5,011 
1,685 
1,572 
43,073 
39,287 
8,143 
8,143 
5,093 
1,680 
1,652 
39,706 
1H13 
40,157 8,293 8,293 5,168 1,680 1,652 39,862 
Financial highlights 
Consolidated results (€mn) 
10 
(4) 
(4)
Enel S.p.A. 
Investor Relations 
EBIT 
Net financial charges 
Interest charges 
Other 
Net income from equity investments using equity method 
EBT 
Income tax 
Net income2 
Minorities 
Group net income 
Group net ordinary income3 
1H13 
1H14 
% 
vs. restated 
1. 2013 restated due to the application of IFRS 11 
2. Continuing operations & including third parties 
3. Excluding capital gains, losses and one-off items 
1H13 
restated1 
Financial highlights 
From EBIT to Net Income (€mn) 
11 
5,011 (1,676) (1,377) (299) 53 3,388 (1,148) 2,240 (555) 1,685 1,572 
-1.6 
+32.7 
-0.7 
n.m. 
-43.0 
-13.6 
-20.3 
-9.8 
-30.9 
+0.3 
-4.8 
5,093 
(1,263) 
(1,387) 
124 
93 
3,923 
(1,440) 
2,483 
(803) 
1,680 
1,652 
5,168 (1,267) (1,392) 125 55 3,956 (1,473) 2,483 (803) 1,680 1,652
Enel S.p.A. 
Investor Relations 
Latam 
Slovakia 
2015 
100 
2014 
100 
~ 40 
~ 60(1) 
1. Including roll-over and green certificates 2. Not including domestic coal output 
~ 95(1) 
~ 5 
2015 
100 
2014 
100 
~ 65 
~ 35 
2015 
100 
2014 
100 
~ 30 
~ 70 
~ 75 
~ 25 
2015 
100 
2014 
100 
~ 50 
~ 50 
Unhedged 
Hedged 
Italy 
Spain2 
Focus on forward electricity sales 
Level of total production hedged (%) 
12
Enel S.p.A. 
Investor Relations 
8,143 
7,878 
1. 2013 restated due to the application of IFRS 11 (-150 €mn) 
2. Including non recurring item of +50 €mn (remeasurement of fair value of SE Hydropower) 
3. Including the Engineering & Research division and elisions. Including non recurring item of +82 €mn (Arctic Russia price adjustment) 
1H13 
restated1 
G&EM Italy2 
Market 
Italy 
I&N 
Italy 
Iberia & 
Latam 
S&H3 
1H14 
International 
EGP 
Market 
I&N 
S&H 
G&EM 
Iberia & Latam 
International 
EGP 
+107 
+152 
-4 
-584 
-78 
+81 
1,966 
2,118 
509 
505 
3,566 
2,982 
628 
735 
477 
967 
538 
Italian operations: 3,391 €mn 
Iberian operations: 
1,728 €mn 
Latam operations: 
1,254 €mn 
-3.3% 
889 
111 
30 
+61 
Iberian operations: 
1,828 €mn 
Latam operations: 
1,738 €mn 
Group EBITDA evolution (€mn) 
Italian operations: 
3,071 €mn 
13
Enel S.p.A. 
Investor Relations 
+17.0% 
+62 
735 
+41 
Generation margin 
1H14 
Gas 
margin 
Other2 
1H13 
restated1 
628 
+4 
1. Due to the application of IFRS 11 (-39 €mn) 
2. Including non recurring item of +50 €mn remeasurement of fair value of SE Hydropower 
EBITDA evolution: G&EM Italy (€mn) 
14
Enel S.p.A. 
Investor Relations 
-24 
Regulated 
market 
1H14 
Free 
market 
+85 
538 
+12.8% 
1H13 
restated 
477 
EBITDA evolution: Market Italy (€mn) 
15
Enel S.p.A. 
Investor Relations 
-17 
Connection fees 
1H14 
Energy margin 
1,966 
-63 
Other 
2,118 
+232 
+7.7% 
1H13 
restated 
EBITDA evolution: Infrastructure & Networks Italy (€mn) 
16
Enel S.p.A. 
Investor Relations 
509 
-15 
+125 
-11 
505 
-18 
1H13 
restated1 
Russia 
(Enel OGK-5) 
SEE3 
Slovakia 
France, 
Belgium, 
EIH4 
SEE3 
France, Belgium, EIH4 
Slovakia 
Russia (Enel OGK-5) 
1H14 
1. Due to the application of IFRS 11 (-56 €mn) 2. Pertaining to Enel Investment Holding 
-0.8% 
161 
186 
EBITDA evolution: International (€mn) 
17 
271 
146 
-13 
204 
186 
Other items2 
1H13 restated1 adjusted 
634 
-20.3% 
-85 
-2 
3. Romania and Greece 
4. Enel Investment Holding
Enel S.p.A. 
Investor Relations 
1. Enel’s GAAP figures 
2. Due to the application of IFRS 11 equals to (-28 €mn) 
1,728 
1,828 
1H13 
restated2 
Liberalized business 
Regulated business 
1H14 
+150 
-357 
+107 
Other 
-5.5% 
EBITDA evolution1: Endesa - Iberia (€mn) 
18 
Of which, new retroactive measures on non mainland generation: -162 €mn
Enel S.p.A. 
Investor Relations 
1. Enel’s GAAP figure 
2. Due to the application of IFRS 11 equals to (-20 €mn) 
1,254 
1,738 
1H13 
restated2 
Generation 
Distribution 
1H14 
+74 
-315 
-84 
Other 
-159 
Forex effect 
-27.8% 
EBITDA evolution1: Endesa - Latam (€mn) 
19
Enel S.p.A. 
Investor Relations 
Europe 
1H14 
North America 
Latin 
America 
-64 
-15 
Europe 
Latin America 
North America 
+1 
889 
723 
100 
659 
85 
145 
144 
-8.1% 
967 
1H13 restated1 
EBITDA evolution: Enel Green Power (€mn) 
20 
1. Due to the application of IFRS 11 (-6 €mn)
Enel S.p.A. 
Investor Relations 
Net debt evolution (€mn) 
21 
1. Net debt change calculated on continuing operations 
2. Due to the application of IFRS 11 (-156 €mn) 
3. Of which 648 €mn of dividends paid to minorities 
4. Net financial debt of assets held for sale 
December 31, 
2013 
(restated2) 
Capex 
Cash flow 
from operations 
Net financial 
charges 
Extra- 
ordinary 
activities 
June 30, 
2014 
Dividends3 
-39,706 
-361 
+3,253 
-2,485 
-436 
-1,870 
+1(4) 
Taxes 
-1,468 
+10(4) 
-43,073 
+3,367 (1)
Enel S.p.A. 
Investor Relations 
•Opening remarks 
•2014 Interim results 
•Closing remarks 
•Annexes 
Agenda 
22 
F. Starace L. Ferraris F. Starace
Enel S.p.A. 
Investor Relations 
Closing remarks 
23 
Reiterated commitment on deleverage by year end 
Group’s reorganization and restructuring kicked off 
Continue to reduce overall risk profile: 
actions aimed at enhancing cash flow and earnings 
Further upside from growth through faster returning 
and more sustainable investments
Operational and financial annexes
Enel S.p.A. 
Investor Relations 
Group production mix 
CCGT 
Oil & gas 
Coal 
Nuclear 
Other renewables 
Hydro 
135.8 
136.2 
-0.3% 
35.9 
35.2 
-2.0% 
99.9 
101.0 
-1.1% 
Italy 
1H13 
restated 
1H14 
13.3% 
15.5% 
20.7% 
25.0% 
5.8% 
19.7% 
0.9% 
9.2% 
43.9% 
36.2% 
9.8% 
10.1% 
13.9% 
26.7% 
14.6% 
6.8% 
27.9% 
10.5% 
12.8% 
27.2% 
14.5% 
7.8% 
27.2% 
0.5% 
7.1% 
47.0% 
35.7% 
9.7% 
Other Countries 
14.1% 
14.8% 
20.1% 
24.2% 
7.1% 
19.7% 
Production mix (TWh) 
1H13 
restated 
1H14 
1H13 
restated 
1H14 
25
Enel S.p.A. 
Investor Relations 
- 
4,976 
Other 
ren. 
1,586 
1,777 
27 
1,025(2) 
2,256 
6,671 
MW 
Hydro 
12,690 
4,722 
2,329 
19 
9,821 
29,581 
Nuclear 
- 
3,318 
1,814 
- 
- 
5,132 
Coal 
6,486 
5,306 
806 
836 
17,057 
Oil & gas ST/OCGT 
10,767 
2,905 
- 
- 
2,530 
20,877 
Iberia 
Centrel 
Italy 
SEE 
Americas 
TOTAL 
CCGT 
5,199 
5,445 
- 
406(3) 
4,253 
16,112 
1. Including Group renewable capacity 2. Including 178 MW of installed capacity in France 3. Including 406 MW of installed capacity in Belgium 
- 
- 
- 
3,623 
4,675 
Russia 
809 
TOTAL 
36,728 
23,473 
1,450 
19,696 
9,107 
95,430 
1H2014 Group total net installed capacity1: 
breakdown by source and location 
26
Enel S.p.A. 
Investor Relations 
GWh 
Hydro 
Nuclear 
Coal 
Oil & gas ST/OCGT 
Iberia 
Centrel 
Italy 
SEE 
Americas 
TOTAL 
CCGT 
1. Including Group renewable production 2. Including 210 GWh of net production in France 3. Including 307 GWh of net production in Belgium 
Russia 
TOTAL 
Other 
ren. 
- 
9,840 
3,472 
2,416 
28 
1,092(2) 
3,557 
10,565 
12,794 
5,536 
1,897 
29 
16,747 
37,003 
- 
12,578 
7,050 
- 
- 
19,628 
16,878 
8,622 
865 
1,284 
36,960 
172 
2,947 
- 
- 
2,165 
14,221 
2,566 
2,371 
- 
307(3) 
10,053 
17,391 
- 
- 
- 
9,311 
8,937 
2,094 
35,882 
34,470 
1,428 
33,806 
20,342 
135,768 
1H2014 Group total net production1: 
breakdown by source and location 
27
Enel S.p.A. 
Investor Relations 
Geothermal 
MW 
Wind 
Other 
TOTAL 
Hydro 
1,515 
723 
- 
71 
1,574 
732 
318 
2,624 
794 
3,379 
551 
5,445 
244 
12 
29 
285 
Latam 
Europe 
North America 
TOTAL 
5,920 
1,295 
1,933 
9,148 
1H2014 Enel Green Power net installed capacity: 
breakdown by source and location 
28
Enel S.p.A. 
Investor Relations 
Hydro 
Wind 
Other 
TOTAL 
Geothermal 
GWh 
Latam 
Europe 
North America 
TOTAL 
2,738 
2,724 
- 
219 
4,100 
1,365 
543 
6,008 
2,943 
4,006 
506 
7,310 
185 
1 
24 
210 
11,075 
1,872 
3,524 
16,471 
1H2014 Enel Green Power net production: 
breakdown by source and location 
29
Enel S.p.A. 
Investor Relations 
Group EBITDA: regulated/unregulated activities 
47% 
42% 
11% 
1H 2014 EBITDA 
recurring 
7,746 €mn 
Unregulated 
Regulated 
Enel Green Power 
Forward sales and 
hedging procurement 
contracts to protect 
margin 
Stability and high 
visibility 
30
Enel S.p.A. 
Investor Relations 
<12m 2H15 2017 2018 After 2018 
Endesa 
Enel Group (excluding Endesa) 
6,784 
899 
6,243 
4,964 
29,552 
6 years and 8 months 
Average cost of gross debt: 5.0% 
2016 
7,662 
Bonds 
Bank loans and others 
4,844 
1,940 
6,092 
692 
301 
982 
5,261 
760 
4,204 
497 
7,165 
3,306 
26,246 
598 
Enel’s long-term debt maturity profile (€mn) 
31
Enel S.p.A. 
Investor Relations 
Committed credit lines Cash and cash equivalents Total Uncommitted lines Commercial paper Total liquidity 
Amount 
Available 
Outstanding 
15,943 
- 
15,943 
862 
9,293 
26,098 
1.Of which ca. 14.5 €bn with maturity after June 2015 
1,131 
(7,044) 
(5,913) 
84 
2,503 
(3,326) 
14,812 
7,044 
21,856 
778 
6,790 
29,424 
(1) 
Enel Group liquidity analysis (€mn) 
32
Enel S.p.A. 
Investor Relations 
•Average debt maturity: 6 years and 8 months 
•Average cost of gross debt2: 5.0% 
•(Fixed+hedged)/Total gross long-term debt: 81% 
•Rating: Standard&Poor’s = BBB/A-2 Stable Outlook Moody’s = Baa2/P-2 Negative Outlook Fitch = BBB+/F2 Stable 
1. As of June 30th, 2014 
2. Average cost of net debt equal to 6.5% 
December 31, 2013 
% 
€mn 
June 31, 
2014 
45,940 
7,142 
(13,376) 
39,706 
Long-term Short-term3 Cash4 Net debt 
44,454 
9,605 
(10,986) 
43,073 
-3.2 
+34.5 
-17.9 
+8.5 
3. Including current maturities of long-term debt 
4. Including factoring and other current receivables 
Debt structure1 
33
Enel S.p.A. 
Investor Relations 
€mn 
Bank loans – maturities > 12m Bonds – maturities > 12m Preference shares > 12m Other loans – maturities > 12m Financial receivables – maturities > 12m Total net LT debt - maturities > 12m Bank loans – maturities < 12m Bonds – maturities < 12m Preference shares < 12m Other loans – maturities < 12m Financial receivables – maturities < 12m Total net LT debt - maturities < 12m Other ST bank debt Commercial paper Cash Collateral and other derivatives payables Other ST financial debt ST debt Factoring receivables Cash Collateral and other derivatives receivables Other ST financial receivables Cash at banks and marketable securities Total net ST debt (incl. current maturities) Net financial debt 
Enel Group (excluding Endesa) 
12.31.2013 
06.30.2014 
12.31.2013 
06.30.2014 
Group - Total 
06.30.2014 
Endesa 
1.As of June 30th, 2014 
6,340 37,924 - 842 -2,557 
42,550 
1,411 2,062 - 96 -104 3,465 
97 1,388 119 23 1,626 
-263 -1,720 -353 -4,762 -2,007 
40,543 
6,551 36,217 - 706 -2,617 
40,857 
1,466 4,524 - 102 -114 5,978 
42 2,068 194 28 2,332 
-150 -1,817 -365 -4,274 1,704 
42,561 
1,533 3,559 - 706 -2,408 
3,390 
340 
586 - 164 -2,872 -1,782 
21 
814 - 22 857 
- - -175 -3,128 -4,227 
-837 
1,059 3,823 - 964 -2,249 
3,597 
193 
320 - 179 -1,432 -740 
32 
432 - 25 489 
- - -43 -2,791 -3,085 
512 
7,610 40,040 - 1,670 -4,866 
44,454 
1,659 4,844 - 281 -1,546 5,238 
74 2,500 194 53 2,821 
-150 -1,817 -408 -7,065 -1,381 
43,073 
Enel’s group financial debt evolution1 
34
Enel S.p.A. 
Investor Relations 
Enel SpA 
Slovenské 
€mn 
EFI2 
Other 
Total 
Endesa 
EIH2 
EP2 
ED2 
Bonds 
Bank loans 
Other loans 
Commercial paper 
Other 
Total 
1.As of June 30th, 2014 
2.EFI: Enel Finance International; EIH: Enel Investments Holding; EP: Enel Produzione; ED: Enel Distribuzione 
19,493 - (3) - (3,509) 15,981 
44,884 
9,269 
(4,461) 
2,500 
(9,119) 
43,073 
(17) 
2,906 
160 
(1) 
(2,573) 
475 
- 
3,160 
(935) 
- 
(114) 
2,111 
- 
474 
(298) 
- 
(12) 
164 
- 
1,477 
(847) 
- 
(49) 
581 
4,143 1,252 (2,538) 432 (2,777) 512 
20,967 
- 
- 
2,069 
(3) 
23,033 
298 
- 
- 
- 
(82) 
216 
Enel’s group financial debt by subsidiary1 
35
Enel S.p.A. 
Investor Relations 
Average residual maturity (years:months) 
Net financial debt (€bn) 
4.8% 
4.9% 
5.0% 
2012 
2013 
1H 2014 
6.1% 
6.2% 
6.5% 
2012 
2013 
1H 2014 
Fixed + Hedged 
/Total net debt 
Fixed + Hedged 
/Total gross long term debt 
Average cost of net debt 
Average cost of gross debt 
99% 
2012 
2013 
1H 2014 
75% 
80% 
81% 
2012 
2013 
1H 2014 
42.9 
39.9 
43.1 
2012 
2013 
1H 2014 
6:11 
6:11 
6:8 
2012 
2013 
1H 2014 
100% 
Enel’s group financial debt 
106% 
36
Enel S.p.A. 
Investor Relations 
€mn 
Bank loans 
Bonds 
Other 
Total 
<12m 
Enel Group (excluding Endesa) 
2H15 
2016 
After 2018 
€mn 
Bank loans 
Bonds 
Other 
Total 
<12m 
Endesa 
2016 
After 2018 
2017 
2017 
2018 
2018 
394 
158 
46 
598 
1,466 
4,524 
102 
6,092 
637 4,539 85 5,261 
493 
3,636 
75 
4,204 
4,054 
21,776 
416 
26,246 
973 
6,108 
84 
7,165 
48 194 59 301 
193 
320 
179 
692 
350 
520 
112 
982 
285 368 107 760 
267 
2,435 
604 
3,306 
109 
306 
82 
497 
2H15 
Enel’s long-term debt maturity profile (€mn) 
37
Enel S.p.A. 
Investor Relations 
1.As of June 30th, 2014 
2.New credit line signed on February 2013 to extend the maturity to 2018, starting from 2015, for a total amount of 9.4 €bn 
3.Including 1,230 €mn relating to a committed line pertaining to Slovenske Elektrarne 
Revolving Credit Facility (2015)2 
Other committed credit lines 
Total committed credit lines 
Other short-term bank debt - uncommitted lines 
Total credit lines 
Commercial paper 
Total credit lines + CP 
Cash and cash equivalents 
Total liquidity 
Amount 
Available 
Outstanding 
9,440 
2,688 
12,128 
235 
12,363 
6,000 
18,363 
- 
18,363 
- 
1,073 
1,073 
83 
1,156 
2,071 
3,227 
(4,253) 
(1,026) 
9,440 1,615 11,055 152 11,207 3,929 15,136 4,253 19,389 
(3) 
Enel Group liquidity analysis excluding Endesa (€mn)1 
38
Enel S.p.A. 
Investor Relations 
Total committed credit lines 
Other short-term bank debt – uncommitted lines 
Total credit lines 
Commercial paper issued by the Endesa Group 
Total credit lines + CP 
Cash and cash equivalents 
Total liquidity 
Amount 
Available 
Outstanding 
1. As of June 30th, 2014 
3,815 
627 
4,442 
3,293 
7,735 
- 
7,735 
58 1 59 432 491 (2,791) (2,300) 
3,757 
626 
4,383 
2,861 
7,244 
2,791 
10,035 
Endesa liquidity analysis (€mn)1 
39
Enel S.p.A. 
Investor Relations 
1H13 
restated 
1H14 
2,343 
Other2 
1. Continuing operations, gross of connection fees 
2. Including Services & Holding, Engineering & Research, upstream gas and nuclear activities 
2,485 
796 
846 
641 
483 
455 
376 
422 
545 
+6.1% 
94 
62 
-36.0% 
+17.6% 
+6.3% 
+12.2% 
-5.8% 
+79.2% 
-34.0% 
25 
16 
43 
24 
Enel Green Power 
Iberia & Latam 
Infrastructure & 
Networks 
Market 
Generation & 
Energy 
Management 
International 
Capex by business area (€mn)1 
40
Enel S.p.A. 
Investor Relations 
>100% 
30 
+6 
+75 
111 
1H13 restated 
Services 
1H14 
Other 
1. Including Services & Holding, Engineering & Research, upstream gas and nuclear activities 
EBITDA evolution - Other1 (€mn) 
41
Enel S.p.A. 
Investor Relations 
FY13 
restated 
1H14 
% 
€mn 
39,706 
52,832 
92,538 
43,073 
52,874 
95,947 
+8.5 
+0.1 
+3.7 
Net financial debt 
Shareholders’ equity 
Net capital employed 
Balance sheet 
42
Enel S.p.A. 
Investor Relations 
% 
€mn 
Revenues 
EBITDA 
EBIT 
Capex 
Headcount 
-15.1 +17.0 +28.9 -34.0 -0.6 
1H14 
10,278 
735 
508 
62 
5,589 
1H13 
restated 
12,100 
628 
394 
94 
5,621 
Generation & Energy Management - Italy 
(1) 
1. As of December 31st, 2013 
43
Enel S.p.A. 
Investor Relations 
Revenues 
EBITDA 
EBIT 
Capex 
Headcount 
-9.9 +12.8 +35.3 +79.2 - 
7,848 
538 
257 
43 
3,688 
8,712 
477 
190 
24 
3,687 
% 
€mn 
1H14 
1H13 
restated 
Market - Italy 
(1) 
1. As of December 31st, 2013 
44
Enel S.p.A. 
Investor Relations 
% 
€mn 
Revenues 
EBITDA 
EBIT 
Capex 
Headcount 
-1.7 
+7.7 
+9.9 
-5.8 
+6.7 
3,720 
2,118 
1,626 
455 
18,867 
3,784 
1,966 
1,479 
483 
17,689 
1H14 
1H13 
restated 
Infrastructure & Network - Italy 
(1) 
1. As of December 31st, 2013 
45
Enel S.p.A. 
Investor Relations 
Revenues 
EBITDA 
EBIT 
Capex 
Headcount 
-15.5 
-0.8 
+50.5 
+12.2 
-3.0 
% 
€mn 
2,622 
505 
313 
422 
11,091 
3,102 
509 
208 
376 
11,439 
1H14 
1H13 
restated 
International 
(1) 
1. As of December 31st, 2013 
46
Enel S.p.A. 
Investor Relations 
Revenues 
EBITDA 
EBIT 
Capex 
Headcount 
-7.4 
-16.4 
-24.3 
+6.3 
+1.3 
% 
€mn 
14,373 
2,982 
1,625 
846 
22,832 
15,515 
3,566 
2,148 
796 
22,541 
1H14 
1H13 
restated 
Iberia & Latam 
(1) 
1. As of December 31st, 2013 
47
Enel S.p.A. 
Investor Relations 
Revenues 
EBITDA 
EBIT 
Capex 
Headcount 
-7.2 
-8.1 
-11.6 
+17.6 
+1.5 
% 
€mn 
1,365 
889 
618 
641 
3,521 
1,471 
967 
699 
545 
3,469 
1H14 
1H13 
restated 
Enel Green Power 
(1) 
1. As of December 31st, 2013 
48
Enel S.p.A. 
Investor Relations 
1H14 
% 
€mn 
Revenues2 
Holding 
Services 
Engineering & Research 
Upstream 
EBITDA3 
Holding 
Services 
Engineering & Research 
Upstream 
1H13 
restated 
1. Including Services & Holding, Engineering & Research, upstream gas and nuclear activities 
2. Including Other & Elisions of -63 €mn in 1H13 and -52 €mn in 1H14 
3. Including Other & Elisions of 0 €mn in 1H13 and 0 €mn in 1H14 
909 
146 
681 
144 
1 
30 
(12) 
52 
(2) 
(8) 
1,006 
132 
684 
160 
82 
111 
(23) 
58 
5 
71 
+10.7 
-9.6 
+0.4 
+11.1 
>100 
>100 
-91.7 
+11.5 
n.m. 
n.m. 
Other1 (1/2) 
49
Enel S.p.A. 
Investor Relations 
EBIT2 
Holding 
Services & other 
Engineering & Research 
Upstream 
Capex 
Holding 
Services & other 
Engineering & Research 
Upstream 
Headcount 
Holding 
Services & other 
Engineering & Research 
Upstream 
1H14 
% 
€mn 
1H13 
restated 
1. Including Services & Holding, Engineering & Research, upstream gas and nuclear activities 
2. Including Other & Elisions of 0 €mn in 1H13 and 0 €mn in 1H14 
3. As of December 31st, 2013 
(25) 
(17) 
4 
(4) 
(8) 
25 
1 
18 
1 
5 
5,896 
789 
3,865 
1,190 
52 
64 
(27) 
18 
3 
70 
16 
1 
10 
1 
4 
5,816 
786 
3,805 
1,178 
47 
n.m. 
-58.8 
>100 
n.m. 
n.m. 
-36.0 
- 
-44.4 
- 
-20.0 
-1.4 
-0.4 
-1.6 
-1.0 
-9.6 
Other1 (2/2) 
(3) 
50
Enel S.p.A. 
Investor Relations 
1H14 
-1.6% 
Iberia & Latam 
Market 
I&N 
Other1 
G&EM 
International 
EGP 
+35.3% 
+50.5% 
+28.9% 
-11.6% 
-24.3% 
+9.9% 
5,093 
5,011 
699 
1,625 
1,479 
1,626 
394 
508 
208 
313 
1. Including Services & Holding, Engineering & Research, upstream gas and nuclear activities 
-25 
1H13 
restated 
n.m. 
618 
2,148 
64 
EBIT by business area (€mn) 
51 
190 
257
Enel S.p.A. 
Investor Relations 
This presentation contains certain forward-looking statements that reflect the Company’s management’s current views with respect to future events and financial and operational performance of the Company and its subsidiaries. These forward-looking statements are based on Enel S.p.A.’s current expectations and projections about future events. Because these forward-looking statements are subject to risks and uncertainties, actual future results or performance may differ materially from those expressed in or implied by these statements due to any number of different factors, many of which are beyond the ability of Enel S.p.A. to control or estimate precisely, including changes in the regulatory environment, future market developments, fluctuations in the price and availability of fuel and other risks. You are cautioned not to place undue reliance on the forward-looking statements contained herein, which are made only as of the date of this presentation. Enel S.p.A. does not undertake any obligation to publicly release any updates or revisions to any forward-looking statements to reflect events or circumstances after the date of this presentation. This presentation does not constitute a recommendation regarding the securities of the Company. This presentation does not contain an offer to sell or a solicitation of any offer to buy any securities issued by Enel S.p.A. or any of its subsidiaries. 
Pursuant to art. 154-BIS, par. 2, of the Unified Financial Act of February 24, 1998, the executive in charge of preparing the corporate accounting documents at Enel, Luigi Ferraris, declares that the accounting information contained herein correspond to document results, books and accounting records. 
Disclaimer 
52
Enel S.p.A. 
Investor Relations 
Investor Relations Team (investor.relations@enel.com) 
Visit our website at: 
www.enel.com (Investor Relations) 
•Luca Torchia 
•Elisabetta Ghezzi 
•Marco Donati 
•Matteo Cavadini 
•Federica Dori 
•Federica Todaro 
+39 06 8305 3437 
+39 06 8305 2708 
+39 06 8305 9252 
+39 06 8305 2326 
+39 06 8305 7975 
+39 06 8305 9502 
Head of IR 
IR Coordination and Outbound communication 
Inbound communication 
Staff 
Staff 
Staff 
Contact us 
53

1H 2014 Financial Results Presentation

  • 1.
    July 31, 2014 2014 Interim results
  • 2.
    Enel S.p.A. InvestorRelations •Opening remarks •2014 Interim results •Closing remarks •Annexes Agenda 1 F. Starace L. Ferraris F. Starace
  • 3.
    Enel S.p.A. InvestorRelations Opening remarks 2 Ongoing weak energy industry outlook in Italy, first signs of recovery in Spain Increasing public awareness of the relevant energy issues in EU An improving overall financial environment in Italy and Spain Energy affordability and EU common energy policy as general framework for company strategy
  • 4.
    Enel S.p.A. InvestorRelations Focused managerial actions: a quick start 3 Overall disposal plan programme Decoupling of Iberia and Latam operations Group’s reorganization
  • 5.
    Enel S.p.A. InvestorRelations Ongoing disposal programme 4 Ca. 4 €bn original target confirmed Generation assets in Slovakia / distribution assets in Romania Further potential disposals already identified, mainly non strategic assets worldwide Gain flexibility to cope with a more challenging scenario
  • 6.
    Enel S.p.A. InvestorRelations Decoupling of Iberia and Latam operations 5 Step 1 Enel Energy Europe acquires 100% of Endesa Latam and 20.3% of Enersis Step 2 Extraordinary dividend Endesa SA in cash POST transaction A more focused Group’s structure in line with the new organizational model PRE transaction Listed company Not listed company Enel SpA Enel Energy Europe 100% Endesa SA Endesa Latam Enersis 92.06% 100% 20,3% 40.32% Enel SpA 100% Endesa SA 20.30% 40.32% 100% Enersis Endesa Latam 92.06% Enel Energy Europe 0% Extraordinary cash dividend Endesa Enel SpA 100% Endesa SA 20.30% 40.32% 100% Enersis Endesa Latam 92.06% Enel Energy Europe 0% Enel SpA 100% Endesa SA 20.30% 40.32% 100% Enersis Endesa Latam Enel Energy Europe 92.06%
  • 7.
    Enel S.p.A. InvestorRelations Decoupling of Iberia and Latam operations 6 Rationale at Group level •Refocusing the strategy on clear dedicated value drivers  Iberia: efficiency enhancing and capex redeployment  Latam: focus on organic growth and business development •Further step in increasing the economic interest in Latam Benefits for Endesa •Industrial plan tailored for the Iberian market •More efficient capital structure •Visible and stable cash flow as a base for future dividend policy Accelerating on Group’s restructuring
  • 8.
    Enel S.p.A. InvestorRelations Group’s reorganization 7 Global Generation Global Infrastructures & Networks Renewable Energies Global business lines A more business oriented and lean organization of the Group Upstream Gas Global Trading Regions Italy Iberia Latam East Europe Relevant KPIs: •Revenues •Opex (staff/services) •Cash flow Relevant KPIs: •Capex optimization •best practice sharing and efficiency improvements
  • 9.
    Enel S.p.A. InvestorRelations Group’s reorganization 8 Best practices implementation all throughout the regions Unlocking value through a business oriented and lean organizational model Enhancing efficiencies in capex and opex Global business lines coupled with ultimate responsibility at country level Centralized capital allocation Reduction of complexity
  • 10.
    Enel S.p.A. InvestorRelations •Opening remarks •2014 Interim results •Closing remarks •Annexes Agenda 9 F. Starace L. Ferraris F. Starace
  • 11.
    Enel S.p.A. InvestorRelations 1H13 restated1 1H14 % vs restated 1. 2013 restated due to the application of IFRS 11 2. Excluding capital gains, losses and one-off items 3. Excluding net debt of assets held for sale 4. As of December 31st, 2013 Revenues EBITDA - recurring2 EBIT Group net income Group net ordinary income2 Net debt3 -8.1 -3.3 -4.9 -1.6 +0.3 -4.8 +8.5 36,101 7,878 7,746 5,011 1,685 1,572 43,073 39,287 8,143 8,143 5,093 1,680 1,652 39,706 1H13 40,157 8,293 8,293 5,168 1,680 1,652 39,862 Financial highlights Consolidated results (€mn) 10 (4) (4)
  • 12.
    Enel S.p.A. InvestorRelations EBIT Net financial charges Interest charges Other Net income from equity investments using equity method EBT Income tax Net income2 Minorities Group net income Group net ordinary income3 1H13 1H14 % vs. restated 1. 2013 restated due to the application of IFRS 11 2. Continuing operations & including third parties 3. Excluding capital gains, losses and one-off items 1H13 restated1 Financial highlights From EBIT to Net Income (€mn) 11 5,011 (1,676) (1,377) (299) 53 3,388 (1,148) 2,240 (555) 1,685 1,572 -1.6 +32.7 -0.7 n.m. -43.0 -13.6 -20.3 -9.8 -30.9 +0.3 -4.8 5,093 (1,263) (1,387) 124 93 3,923 (1,440) 2,483 (803) 1,680 1,652 5,168 (1,267) (1,392) 125 55 3,956 (1,473) 2,483 (803) 1,680 1,652
  • 13.
    Enel S.p.A. InvestorRelations Latam Slovakia 2015 100 2014 100 ~ 40 ~ 60(1) 1. Including roll-over and green certificates 2. Not including domestic coal output ~ 95(1) ~ 5 2015 100 2014 100 ~ 65 ~ 35 2015 100 2014 100 ~ 30 ~ 70 ~ 75 ~ 25 2015 100 2014 100 ~ 50 ~ 50 Unhedged Hedged Italy Spain2 Focus on forward electricity sales Level of total production hedged (%) 12
  • 14.
    Enel S.p.A. InvestorRelations 8,143 7,878 1. 2013 restated due to the application of IFRS 11 (-150 €mn) 2. Including non recurring item of +50 €mn (remeasurement of fair value of SE Hydropower) 3. Including the Engineering & Research division and elisions. Including non recurring item of +82 €mn (Arctic Russia price adjustment) 1H13 restated1 G&EM Italy2 Market Italy I&N Italy Iberia & Latam S&H3 1H14 International EGP Market I&N S&H G&EM Iberia & Latam International EGP +107 +152 -4 -584 -78 +81 1,966 2,118 509 505 3,566 2,982 628 735 477 967 538 Italian operations: 3,391 €mn Iberian operations: 1,728 €mn Latam operations: 1,254 €mn -3.3% 889 111 30 +61 Iberian operations: 1,828 €mn Latam operations: 1,738 €mn Group EBITDA evolution (€mn) Italian operations: 3,071 €mn 13
  • 15.
    Enel S.p.A. InvestorRelations +17.0% +62 735 +41 Generation margin 1H14 Gas margin Other2 1H13 restated1 628 +4 1. Due to the application of IFRS 11 (-39 €mn) 2. Including non recurring item of +50 €mn remeasurement of fair value of SE Hydropower EBITDA evolution: G&EM Italy (€mn) 14
  • 16.
    Enel S.p.A. InvestorRelations -24 Regulated market 1H14 Free market +85 538 +12.8% 1H13 restated 477 EBITDA evolution: Market Italy (€mn) 15
  • 17.
    Enel S.p.A. InvestorRelations -17 Connection fees 1H14 Energy margin 1,966 -63 Other 2,118 +232 +7.7% 1H13 restated EBITDA evolution: Infrastructure & Networks Italy (€mn) 16
  • 18.
    Enel S.p.A. InvestorRelations 509 -15 +125 -11 505 -18 1H13 restated1 Russia (Enel OGK-5) SEE3 Slovakia France, Belgium, EIH4 SEE3 France, Belgium, EIH4 Slovakia Russia (Enel OGK-5) 1H14 1. Due to the application of IFRS 11 (-56 €mn) 2. Pertaining to Enel Investment Holding -0.8% 161 186 EBITDA evolution: International (€mn) 17 271 146 -13 204 186 Other items2 1H13 restated1 adjusted 634 -20.3% -85 -2 3. Romania and Greece 4. Enel Investment Holding
  • 19.
    Enel S.p.A. InvestorRelations 1. Enel’s GAAP figures 2. Due to the application of IFRS 11 equals to (-28 €mn) 1,728 1,828 1H13 restated2 Liberalized business Regulated business 1H14 +150 -357 +107 Other -5.5% EBITDA evolution1: Endesa - Iberia (€mn) 18 Of which, new retroactive measures on non mainland generation: -162 €mn
  • 20.
    Enel S.p.A. InvestorRelations 1. Enel’s GAAP figure 2. Due to the application of IFRS 11 equals to (-20 €mn) 1,254 1,738 1H13 restated2 Generation Distribution 1H14 +74 -315 -84 Other -159 Forex effect -27.8% EBITDA evolution1: Endesa - Latam (€mn) 19
  • 21.
    Enel S.p.A. InvestorRelations Europe 1H14 North America Latin America -64 -15 Europe Latin America North America +1 889 723 100 659 85 145 144 -8.1% 967 1H13 restated1 EBITDA evolution: Enel Green Power (€mn) 20 1. Due to the application of IFRS 11 (-6 €mn)
  • 22.
    Enel S.p.A. InvestorRelations Net debt evolution (€mn) 21 1. Net debt change calculated on continuing operations 2. Due to the application of IFRS 11 (-156 €mn) 3. Of which 648 €mn of dividends paid to minorities 4. Net financial debt of assets held for sale December 31, 2013 (restated2) Capex Cash flow from operations Net financial charges Extra- ordinary activities June 30, 2014 Dividends3 -39,706 -361 +3,253 -2,485 -436 -1,870 +1(4) Taxes -1,468 +10(4) -43,073 +3,367 (1)
  • 23.
    Enel S.p.A. InvestorRelations •Opening remarks •2014 Interim results •Closing remarks •Annexes Agenda 22 F. Starace L. Ferraris F. Starace
  • 24.
    Enel S.p.A. InvestorRelations Closing remarks 23 Reiterated commitment on deleverage by year end Group’s reorganization and restructuring kicked off Continue to reduce overall risk profile: actions aimed at enhancing cash flow and earnings Further upside from growth through faster returning and more sustainable investments
  • 25.
  • 26.
    Enel S.p.A. InvestorRelations Group production mix CCGT Oil & gas Coal Nuclear Other renewables Hydro 135.8 136.2 -0.3% 35.9 35.2 -2.0% 99.9 101.0 -1.1% Italy 1H13 restated 1H14 13.3% 15.5% 20.7% 25.0% 5.8% 19.7% 0.9% 9.2% 43.9% 36.2% 9.8% 10.1% 13.9% 26.7% 14.6% 6.8% 27.9% 10.5% 12.8% 27.2% 14.5% 7.8% 27.2% 0.5% 7.1% 47.0% 35.7% 9.7% Other Countries 14.1% 14.8% 20.1% 24.2% 7.1% 19.7% Production mix (TWh) 1H13 restated 1H14 1H13 restated 1H14 25
  • 27.
    Enel S.p.A. InvestorRelations - 4,976 Other ren. 1,586 1,777 27 1,025(2) 2,256 6,671 MW Hydro 12,690 4,722 2,329 19 9,821 29,581 Nuclear - 3,318 1,814 - - 5,132 Coal 6,486 5,306 806 836 17,057 Oil & gas ST/OCGT 10,767 2,905 - - 2,530 20,877 Iberia Centrel Italy SEE Americas TOTAL CCGT 5,199 5,445 - 406(3) 4,253 16,112 1. Including Group renewable capacity 2. Including 178 MW of installed capacity in France 3. Including 406 MW of installed capacity in Belgium - - - 3,623 4,675 Russia 809 TOTAL 36,728 23,473 1,450 19,696 9,107 95,430 1H2014 Group total net installed capacity1: breakdown by source and location 26
  • 28.
    Enel S.p.A. InvestorRelations GWh Hydro Nuclear Coal Oil & gas ST/OCGT Iberia Centrel Italy SEE Americas TOTAL CCGT 1. Including Group renewable production 2. Including 210 GWh of net production in France 3. Including 307 GWh of net production in Belgium Russia TOTAL Other ren. - 9,840 3,472 2,416 28 1,092(2) 3,557 10,565 12,794 5,536 1,897 29 16,747 37,003 - 12,578 7,050 - - 19,628 16,878 8,622 865 1,284 36,960 172 2,947 - - 2,165 14,221 2,566 2,371 - 307(3) 10,053 17,391 - - - 9,311 8,937 2,094 35,882 34,470 1,428 33,806 20,342 135,768 1H2014 Group total net production1: breakdown by source and location 27
  • 29.
    Enel S.p.A. InvestorRelations Geothermal MW Wind Other TOTAL Hydro 1,515 723 - 71 1,574 732 318 2,624 794 3,379 551 5,445 244 12 29 285 Latam Europe North America TOTAL 5,920 1,295 1,933 9,148 1H2014 Enel Green Power net installed capacity: breakdown by source and location 28
  • 30.
    Enel S.p.A. InvestorRelations Hydro Wind Other TOTAL Geothermal GWh Latam Europe North America TOTAL 2,738 2,724 - 219 4,100 1,365 543 6,008 2,943 4,006 506 7,310 185 1 24 210 11,075 1,872 3,524 16,471 1H2014 Enel Green Power net production: breakdown by source and location 29
  • 31.
    Enel S.p.A. InvestorRelations Group EBITDA: regulated/unregulated activities 47% 42% 11% 1H 2014 EBITDA recurring 7,746 €mn Unregulated Regulated Enel Green Power Forward sales and hedging procurement contracts to protect margin Stability and high visibility 30
  • 32.
    Enel S.p.A. InvestorRelations <12m 2H15 2017 2018 After 2018 Endesa Enel Group (excluding Endesa) 6,784 899 6,243 4,964 29,552 6 years and 8 months Average cost of gross debt: 5.0% 2016 7,662 Bonds Bank loans and others 4,844 1,940 6,092 692 301 982 5,261 760 4,204 497 7,165 3,306 26,246 598 Enel’s long-term debt maturity profile (€mn) 31
  • 33.
    Enel S.p.A. InvestorRelations Committed credit lines Cash and cash equivalents Total Uncommitted lines Commercial paper Total liquidity Amount Available Outstanding 15,943 - 15,943 862 9,293 26,098 1.Of which ca. 14.5 €bn with maturity after June 2015 1,131 (7,044) (5,913) 84 2,503 (3,326) 14,812 7,044 21,856 778 6,790 29,424 (1) Enel Group liquidity analysis (€mn) 32
  • 34.
    Enel S.p.A. InvestorRelations •Average debt maturity: 6 years and 8 months •Average cost of gross debt2: 5.0% •(Fixed+hedged)/Total gross long-term debt: 81% •Rating: Standard&Poor’s = BBB/A-2 Stable Outlook Moody’s = Baa2/P-2 Negative Outlook Fitch = BBB+/F2 Stable 1. As of June 30th, 2014 2. Average cost of net debt equal to 6.5% December 31, 2013 % €mn June 31, 2014 45,940 7,142 (13,376) 39,706 Long-term Short-term3 Cash4 Net debt 44,454 9,605 (10,986) 43,073 -3.2 +34.5 -17.9 +8.5 3. Including current maturities of long-term debt 4. Including factoring and other current receivables Debt structure1 33
  • 35.
    Enel S.p.A. InvestorRelations €mn Bank loans – maturities > 12m Bonds – maturities > 12m Preference shares > 12m Other loans – maturities > 12m Financial receivables – maturities > 12m Total net LT debt - maturities > 12m Bank loans – maturities < 12m Bonds – maturities < 12m Preference shares < 12m Other loans – maturities < 12m Financial receivables – maturities < 12m Total net LT debt - maturities < 12m Other ST bank debt Commercial paper Cash Collateral and other derivatives payables Other ST financial debt ST debt Factoring receivables Cash Collateral and other derivatives receivables Other ST financial receivables Cash at banks and marketable securities Total net ST debt (incl. current maturities) Net financial debt Enel Group (excluding Endesa) 12.31.2013 06.30.2014 12.31.2013 06.30.2014 Group - Total 06.30.2014 Endesa 1.As of June 30th, 2014 6,340 37,924 - 842 -2,557 42,550 1,411 2,062 - 96 -104 3,465 97 1,388 119 23 1,626 -263 -1,720 -353 -4,762 -2,007 40,543 6,551 36,217 - 706 -2,617 40,857 1,466 4,524 - 102 -114 5,978 42 2,068 194 28 2,332 -150 -1,817 -365 -4,274 1,704 42,561 1,533 3,559 - 706 -2,408 3,390 340 586 - 164 -2,872 -1,782 21 814 - 22 857 - - -175 -3,128 -4,227 -837 1,059 3,823 - 964 -2,249 3,597 193 320 - 179 -1,432 -740 32 432 - 25 489 - - -43 -2,791 -3,085 512 7,610 40,040 - 1,670 -4,866 44,454 1,659 4,844 - 281 -1,546 5,238 74 2,500 194 53 2,821 -150 -1,817 -408 -7,065 -1,381 43,073 Enel’s group financial debt evolution1 34
  • 36.
    Enel S.p.A. InvestorRelations Enel SpA Slovenské €mn EFI2 Other Total Endesa EIH2 EP2 ED2 Bonds Bank loans Other loans Commercial paper Other Total 1.As of June 30th, 2014 2.EFI: Enel Finance International; EIH: Enel Investments Holding; EP: Enel Produzione; ED: Enel Distribuzione 19,493 - (3) - (3,509) 15,981 44,884 9,269 (4,461) 2,500 (9,119) 43,073 (17) 2,906 160 (1) (2,573) 475 - 3,160 (935) - (114) 2,111 - 474 (298) - (12) 164 - 1,477 (847) - (49) 581 4,143 1,252 (2,538) 432 (2,777) 512 20,967 - - 2,069 (3) 23,033 298 - - - (82) 216 Enel’s group financial debt by subsidiary1 35
  • 37.
    Enel S.p.A. InvestorRelations Average residual maturity (years:months) Net financial debt (€bn) 4.8% 4.9% 5.0% 2012 2013 1H 2014 6.1% 6.2% 6.5% 2012 2013 1H 2014 Fixed + Hedged /Total net debt Fixed + Hedged /Total gross long term debt Average cost of net debt Average cost of gross debt 99% 2012 2013 1H 2014 75% 80% 81% 2012 2013 1H 2014 42.9 39.9 43.1 2012 2013 1H 2014 6:11 6:11 6:8 2012 2013 1H 2014 100% Enel’s group financial debt 106% 36
  • 38.
    Enel S.p.A. InvestorRelations €mn Bank loans Bonds Other Total <12m Enel Group (excluding Endesa) 2H15 2016 After 2018 €mn Bank loans Bonds Other Total <12m Endesa 2016 After 2018 2017 2017 2018 2018 394 158 46 598 1,466 4,524 102 6,092 637 4,539 85 5,261 493 3,636 75 4,204 4,054 21,776 416 26,246 973 6,108 84 7,165 48 194 59 301 193 320 179 692 350 520 112 982 285 368 107 760 267 2,435 604 3,306 109 306 82 497 2H15 Enel’s long-term debt maturity profile (€mn) 37
  • 39.
    Enel S.p.A. InvestorRelations 1.As of June 30th, 2014 2.New credit line signed on February 2013 to extend the maturity to 2018, starting from 2015, for a total amount of 9.4 €bn 3.Including 1,230 €mn relating to a committed line pertaining to Slovenske Elektrarne Revolving Credit Facility (2015)2 Other committed credit lines Total committed credit lines Other short-term bank debt - uncommitted lines Total credit lines Commercial paper Total credit lines + CP Cash and cash equivalents Total liquidity Amount Available Outstanding 9,440 2,688 12,128 235 12,363 6,000 18,363 - 18,363 - 1,073 1,073 83 1,156 2,071 3,227 (4,253) (1,026) 9,440 1,615 11,055 152 11,207 3,929 15,136 4,253 19,389 (3) Enel Group liquidity analysis excluding Endesa (€mn)1 38
  • 40.
    Enel S.p.A. InvestorRelations Total committed credit lines Other short-term bank debt – uncommitted lines Total credit lines Commercial paper issued by the Endesa Group Total credit lines + CP Cash and cash equivalents Total liquidity Amount Available Outstanding 1. As of June 30th, 2014 3,815 627 4,442 3,293 7,735 - 7,735 58 1 59 432 491 (2,791) (2,300) 3,757 626 4,383 2,861 7,244 2,791 10,035 Endesa liquidity analysis (€mn)1 39
  • 41.
    Enel S.p.A. InvestorRelations 1H13 restated 1H14 2,343 Other2 1. Continuing operations, gross of connection fees 2. Including Services & Holding, Engineering & Research, upstream gas and nuclear activities 2,485 796 846 641 483 455 376 422 545 +6.1% 94 62 -36.0% +17.6% +6.3% +12.2% -5.8% +79.2% -34.0% 25 16 43 24 Enel Green Power Iberia & Latam Infrastructure & Networks Market Generation & Energy Management International Capex by business area (€mn)1 40
  • 42.
    Enel S.p.A. InvestorRelations >100% 30 +6 +75 111 1H13 restated Services 1H14 Other 1. Including Services & Holding, Engineering & Research, upstream gas and nuclear activities EBITDA evolution - Other1 (€mn) 41
  • 43.
    Enel S.p.A. InvestorRelations FY13 restated 1H14 % €mn 39,706 52,832 92,538 43,073 52,874 95,947 +8.5 +0.1 +3.7 Net financial debt Shareholders’ equity Net capital employed Balance sheet 42
  • 44.
    Enel S.p.A. InvestorRelations % €mn Revenues EBITDA EBIT Capex Headcount -15.1 +17.0 +28.9 -34.0 -0.6 1H14 10,278 735 508 62 5,589 1H13 restated 12,100 628 394 94 5,621 Generation & Energy Management - Italy (1) 1. As of December 31st, 2013 43
  • 45.
    Enel S.p.A. InvestorRelations Revenues EBITDA EBIT Capex Headcount -9.9 +12.8 +35.3 +79.2 - 7,848 538 257 43 3,688 8,712 477 190 24 3,687 % €mn 1H14 1H13 restated Market - Italy (1) 1. As of December 31st, 2013 44
  • 46.
    Enel S.p.A. InvestorRelations % €mn Revenues EBITDA EBIT Capex Headcount -1.7 +7.7 +9.9 -5.8 +6.7 3,720 2,118 1,626 455 18,867 3,784 1,966 1,479 483 17,689 1H14 1H13 restated Infrastructure & Network - Italy (1) 1. As of December 31st, 2013 45
  • 47.
    Enel S.p.A. InvestorRelations Revenues EBITDA EBIT Capex Headcount -15.5 -0.8 +50.5 +12.2 -3.0 % €mn 2,622 505 313 422 11,091 3,102 509 208 376 11,439 1H14 1H13 restated International (1) 1. As of December 31st, 2013 46
  • 48.
    Enel S.p.A. InvestorRelations Revenues EBITDA EBIT Capex Headcount -7.4 -16.4 -24.3 +6.3 +1.3 % €mn 14,373 2,982 1,625 846 22,832 15,515 3,566 2,148 796 22,541 1H14 1H13 restated Iberia & Latam (1) 1. As of December 31st, 2013 47
  • 49.
    Enel S.p.A. InvestorRelations Revenues EBITDA EBIT Capex Headcount -7.2 -8.1 -11.6 +17.6 +1.5 % €mn 1,365 889 618 641 3,521 1,471 967 699 545 3,469 1H14 1H13 restated Enel Green Power (1) 1. As of December 31st, 2013 48
  • 50.
    Enel S.p.A. InvestorRelations 1H14 % €mn Revenues2 Holding Services Engineering & Research Upstream EBITDA3 Holding Services Engineering & Research Upstream 1H13 restated 1. Including Services & Holding, Engineering & Research, upstream gas and nuclear activities 2. Including Other & Elisions of -63 €mn in 1H13 and -52 €mn in 1H14 3. Including Other & Elisions of 0 €mn in 1H13 and 0 €mn in 1H14 909 146 681 144 1 30 (12) 52 (2) (8) 1,006 132 684 160 82 111 (23) 58 5 71 +10.7 -9.6 +0.4 +11.1 >100 >100 -91.7 +11.5 n.m. n.m. Other1 (1/2) 49
  • 51.
    Enel S.p.A. InvestorRelations EBIT2 Holding Services & other Engineering & Research Upstream Capex Holding Services & other Engineering & Research Upstream Headcount Holding Services & other Engineering & Research Upstream 1H14 % €mn 1H13 restated 1. Including Services & Holding, Engineering & Research, upstream gas and nuclear activities 2. Including Other & Elisions of 0 €mn in 1H13 and 0 €mn in 1H14 3. As of December 31st, 2013 (25) (17) 4 (4) (8) 25 1 18 1 5 5,896 789 3,865 1,190 52 64 (27) 18 3 70 16 1 10 1 4 5,816 786 3,805 1,178 47 n.m. -58.8 >100 n.m. n.m. -36.0 - -44.4 - -20.0 -1.4 -0.4 -1.6 -1.0 -9.6 Other1 (2/2) (3) 50
  • 52.
    Enel S.p.A. InvestorRelations 1H14 -1.6% Iberia & Latam Market I&N Other1 G&EM International EGP +35.3% +50.5% +28.9% -11.6% -24.3% +9.9% 5,093 5,011 699 1,625 1,479 1,626 394 508 208 313 1. Including Services & Holding, Engineering & Research, upstream gas and nuclear activities -25 1H13 restated n.m. 618 2,148 64 EBIT by business area (€mn) 51 190 257
  • 53.
    Enel S.p.A. InvestorRelations This presentation contains certain forward-looking statements that reflect the Company’s management’s current views with respect to future events and financial and operational performance of the Company and its subsidiaries. These forward-looking statements are based on Enel S.p.A.’s current expectations and projections about future events. Because these forward-looking statements are subject to risks and uncertainties, actual future results or performance may differ materially from those expressed in or implied by these statements due to any number of different factors, many of which are beyond the ability of Enel S.p.A. to control or estimate precisely, including changes in the regulatory environment, future market developments, fluctuations in the price and availability of fuel and other risks. You are cautioned not to place undue reliance on the forward-looking statements contained herein, which are made only as of the date of this presentation. Enel S.p.A. does not undertake any obligation to publicly release any updates or revisions to any forward-looking statements to reflect events or circumstances after the date of this presentation. This presentation does not constitute a recommendation regarding the securities of the Company. This presentation does not contain an offer to sell or a solicitation of any offer to buy any securities issued by Enel S.p.A. or any of its subsidiaries. Pursuant to art. 154-BIS, par. 2, of the Unified Financial Act of February 24, 1998, the executive in charge of preparing the corporate accounting documents at Enel, Luigi Ferraris, declares that the accounting information contained herein correspond to document results, books and accounting records. Disclaimer 52
  • 54.
    Enel S.p.A. InvestorRelations Investor Relations Team (investor.relations@enel.com) Visit our website at: www.enel.com (Investor Relations) •Luca Torchia •Elisabetta Ghezzi •Marco Donati •Matteo Cavadini •Federica Dori •Federica Todaro +39 06 8305 3437 +39 06 8305 2708 +39 06 8305 9252 +39 06 8305 2326 +39 06 8305 7975 +39 06 8305 9502 Head of IR IR Coordination and Outbound communication Inbound communication Staff Staff Staff Contact us 53