Download to read offline

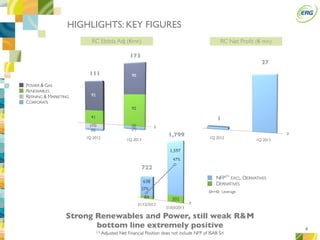

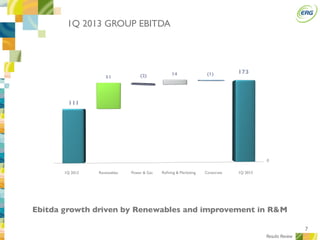
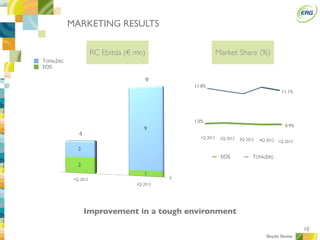
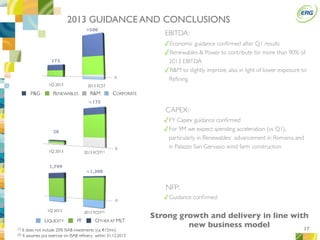

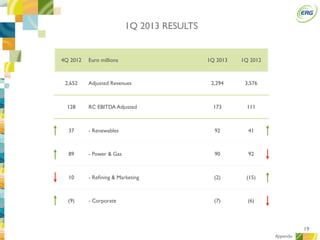

In the first quarter of 2013, ERG reported a 27% increase in adjusted EBITDA to €173 million compared to the same period last year, driven by strong performance in renewables and improvements in refining and marketing. Renewables and power contributed over 90% of EBITDA for the quarter. Net debt was reduced to €1.8 billion and guidance for the full year was confirmed, with EBITDA expected to exceed €500 million and net debt to decrease to around €1.3 billion.


