Download to read offline

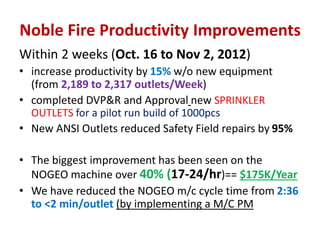
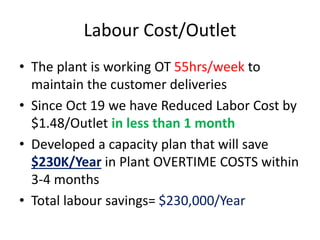
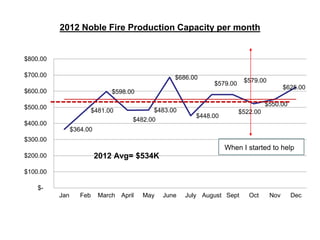
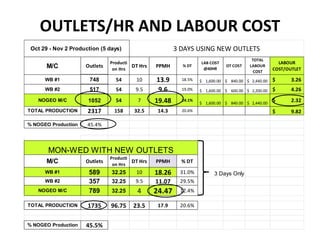
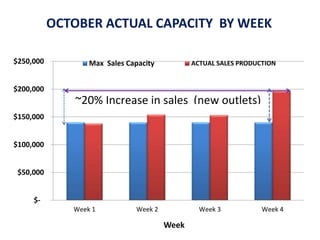
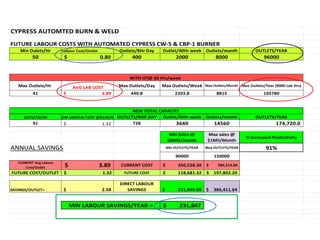
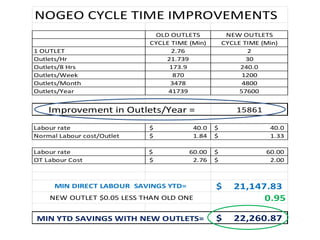
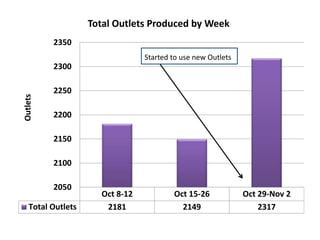
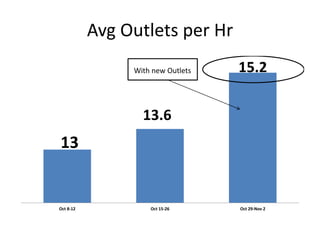


The document discusses productivity improvements made at the Noble Fire plant over a two week period in October 2012. Key points: - Productivity was increased by 15% without new equipment, raising output from 2,189 to 2,317 units per week. A new sprinkler outlet design reduced safety field repairs by 95%. - The biggest gains were seen on the NOGEO machine, where output rose by over 40% (from 17 to 24 units per hour), saving an estimated $175,000 per year. Cycle times on this machine were reduced from 2:36 to under 2 minutes. - Labor costs per unit were reduced by $1.48 within the first month, and additional savings of $230,


