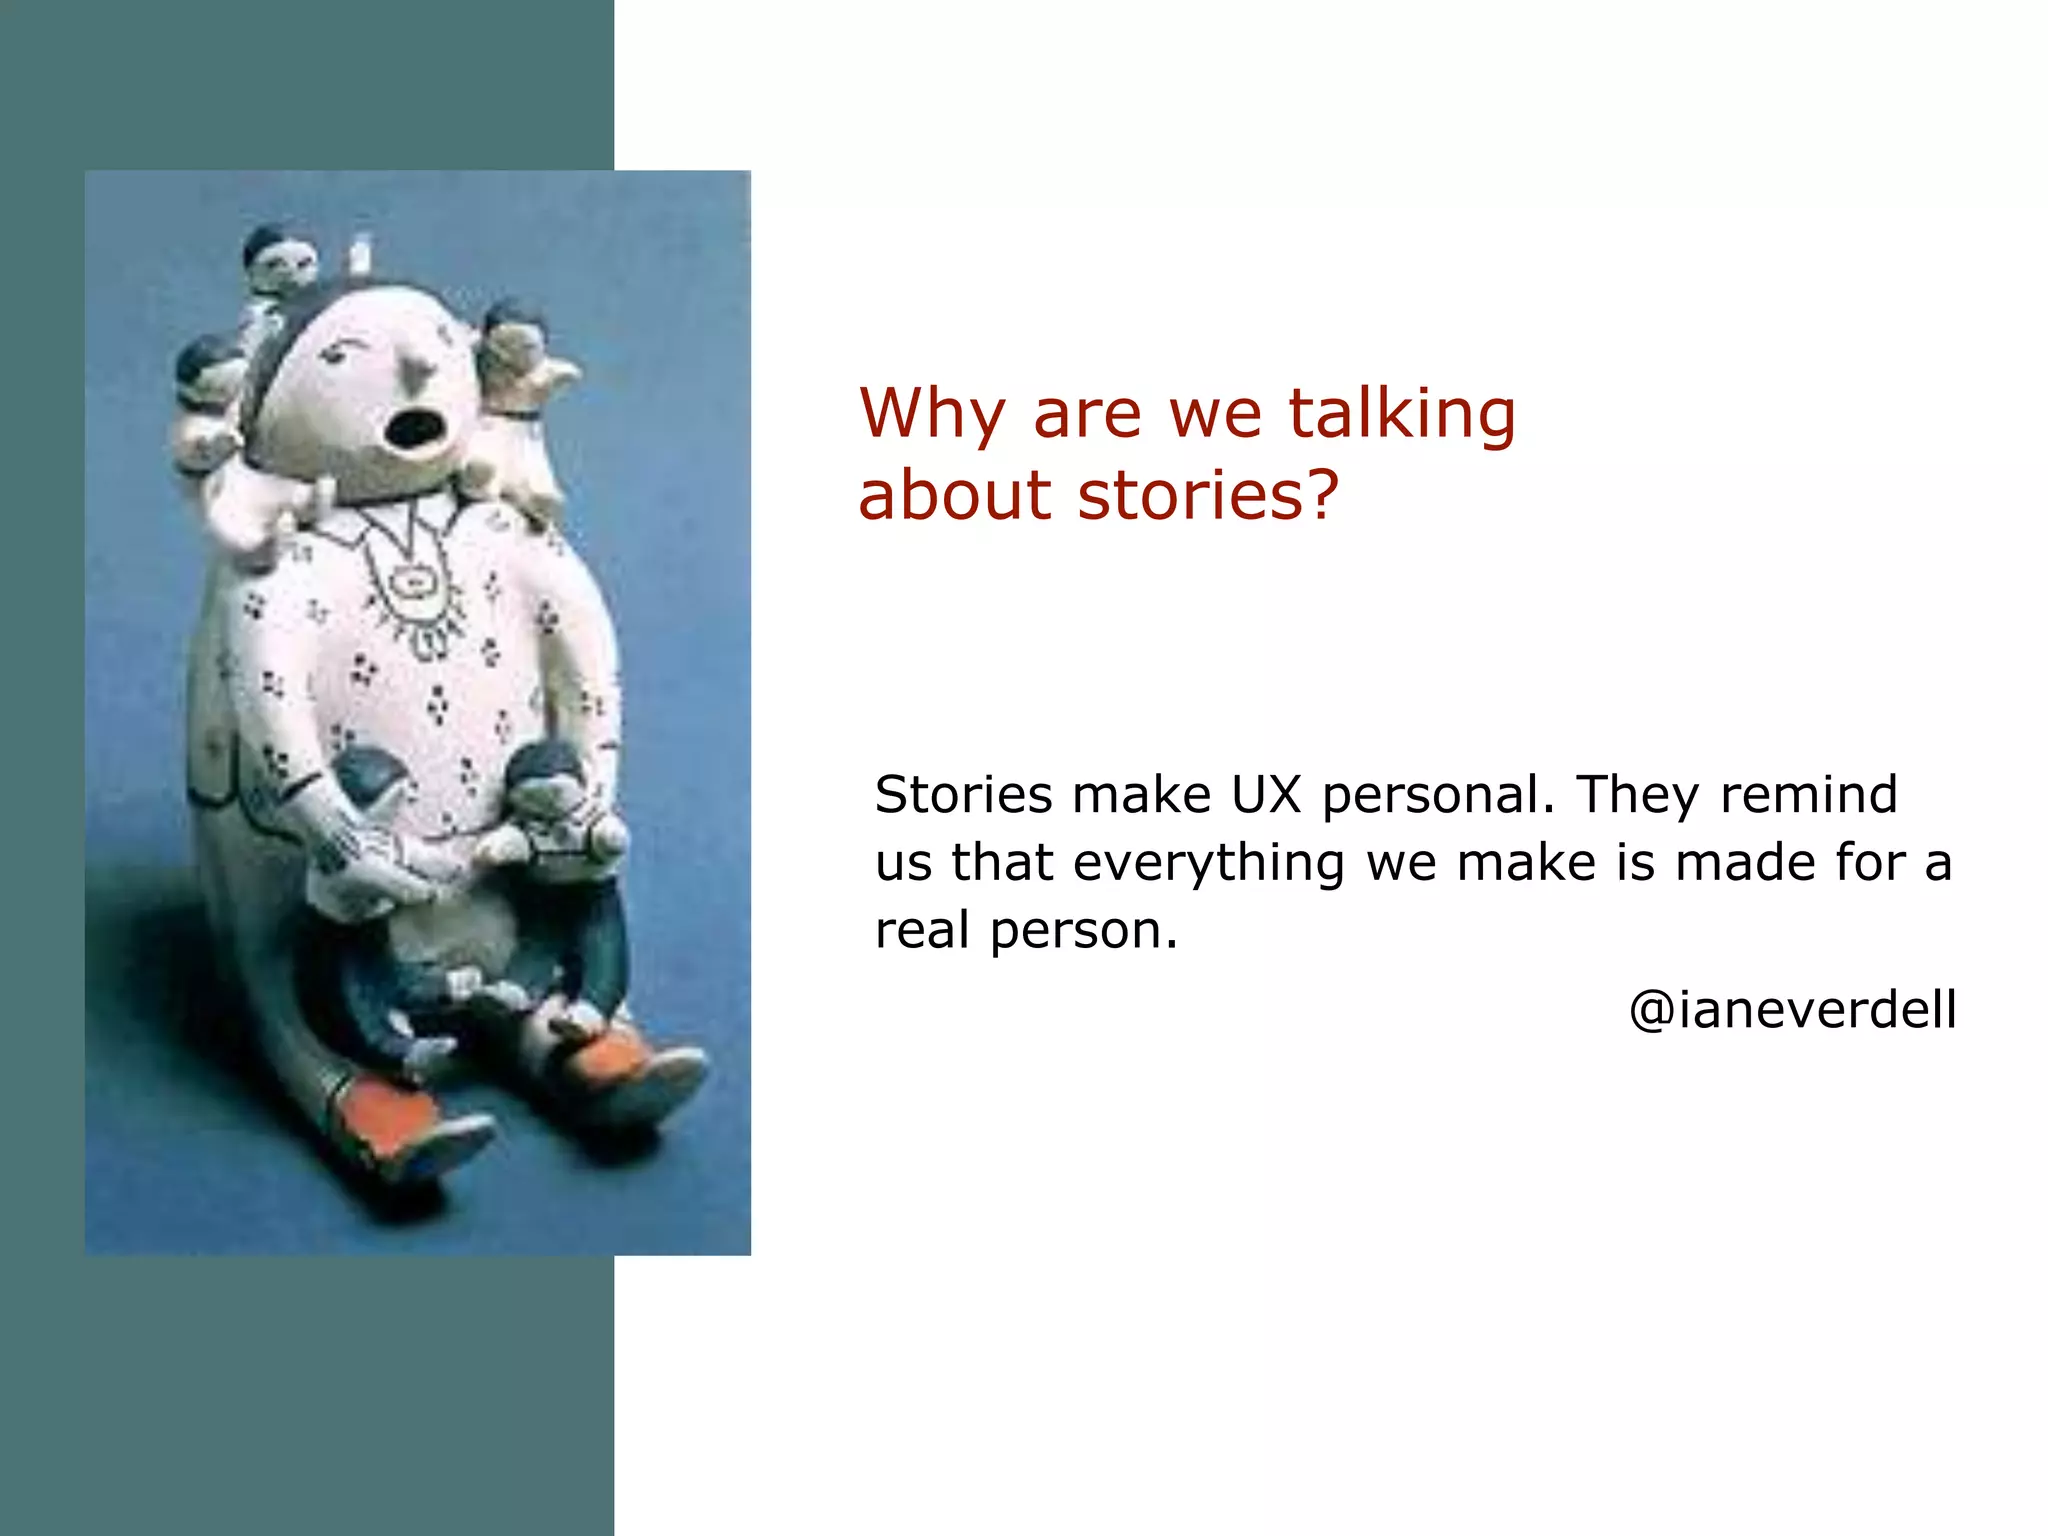
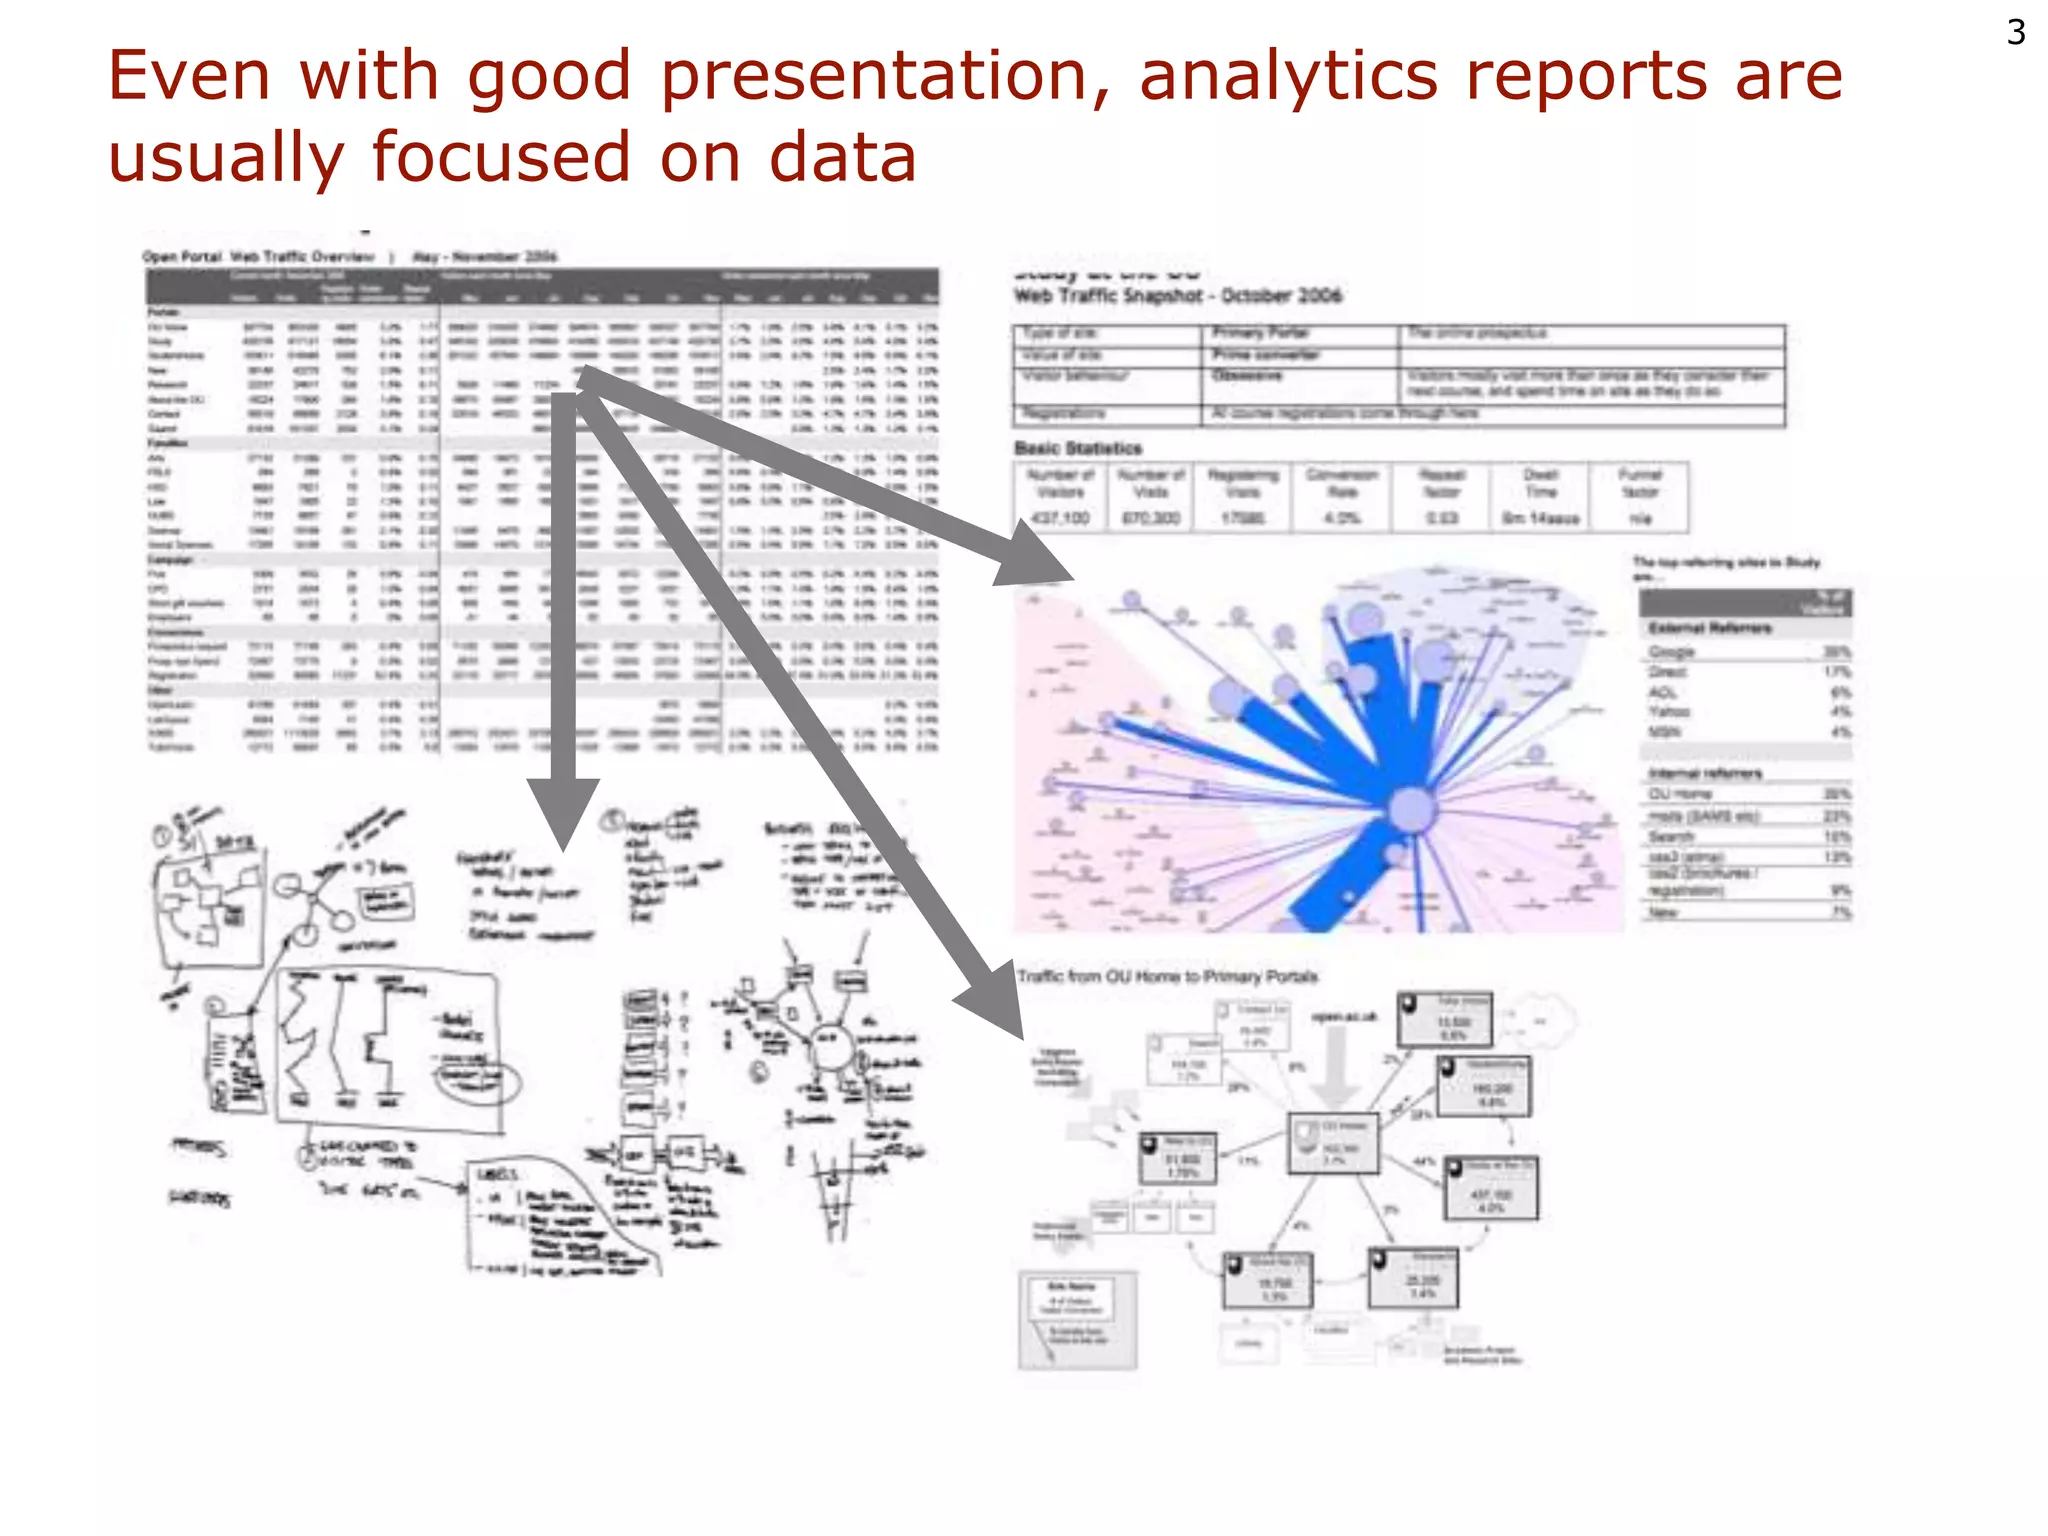
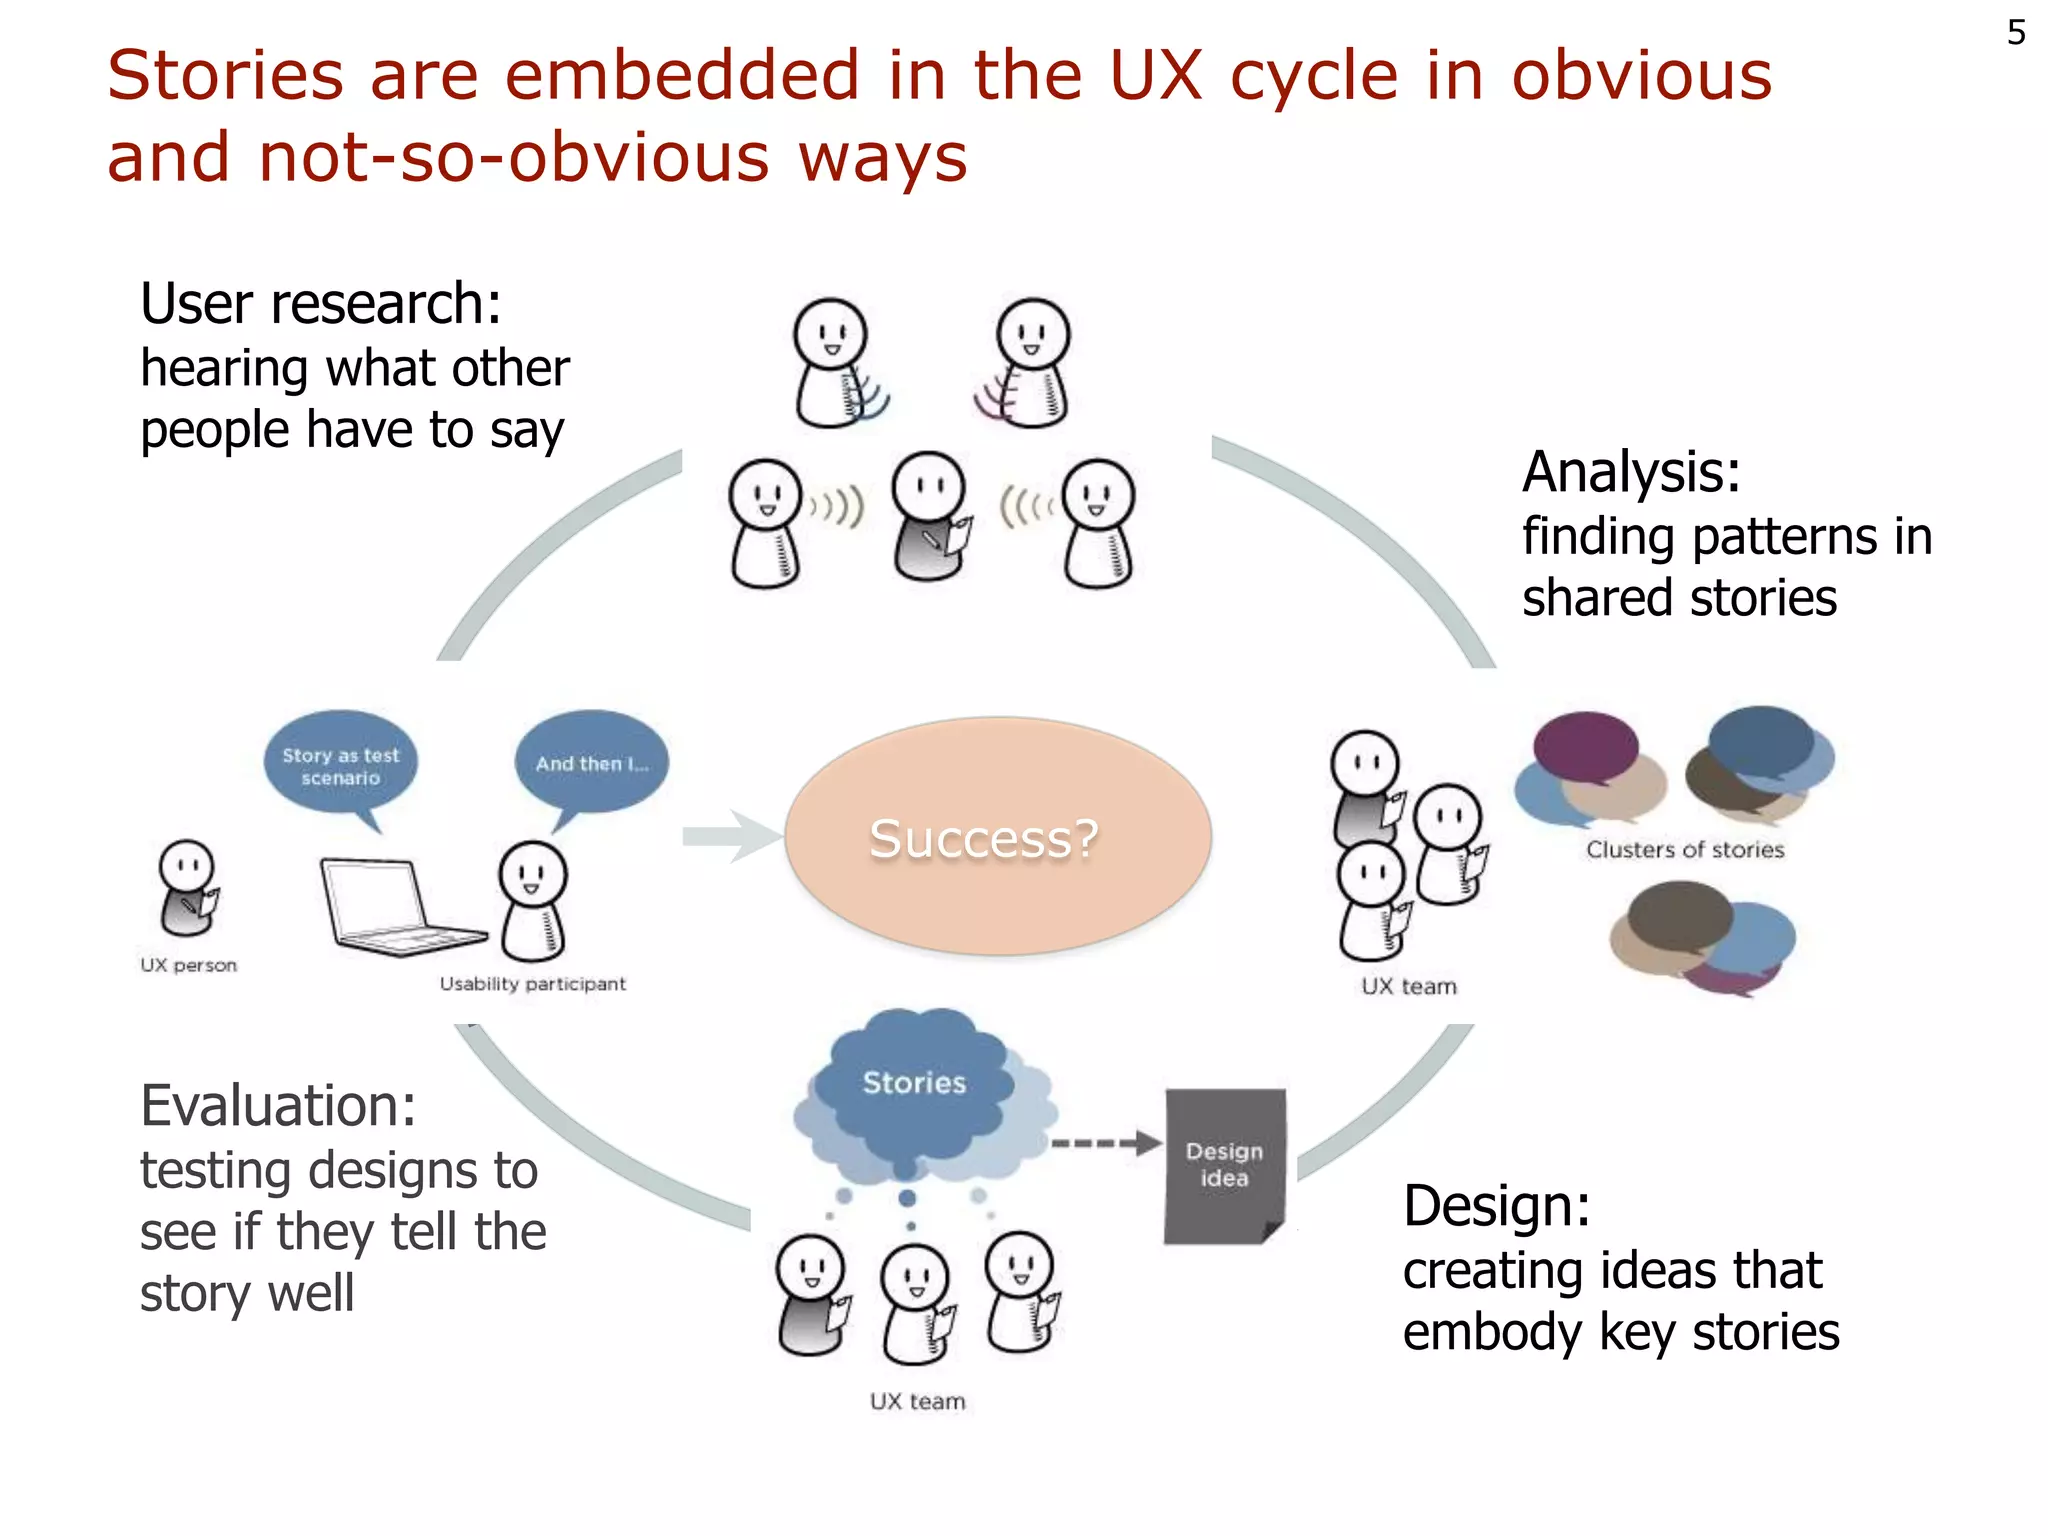
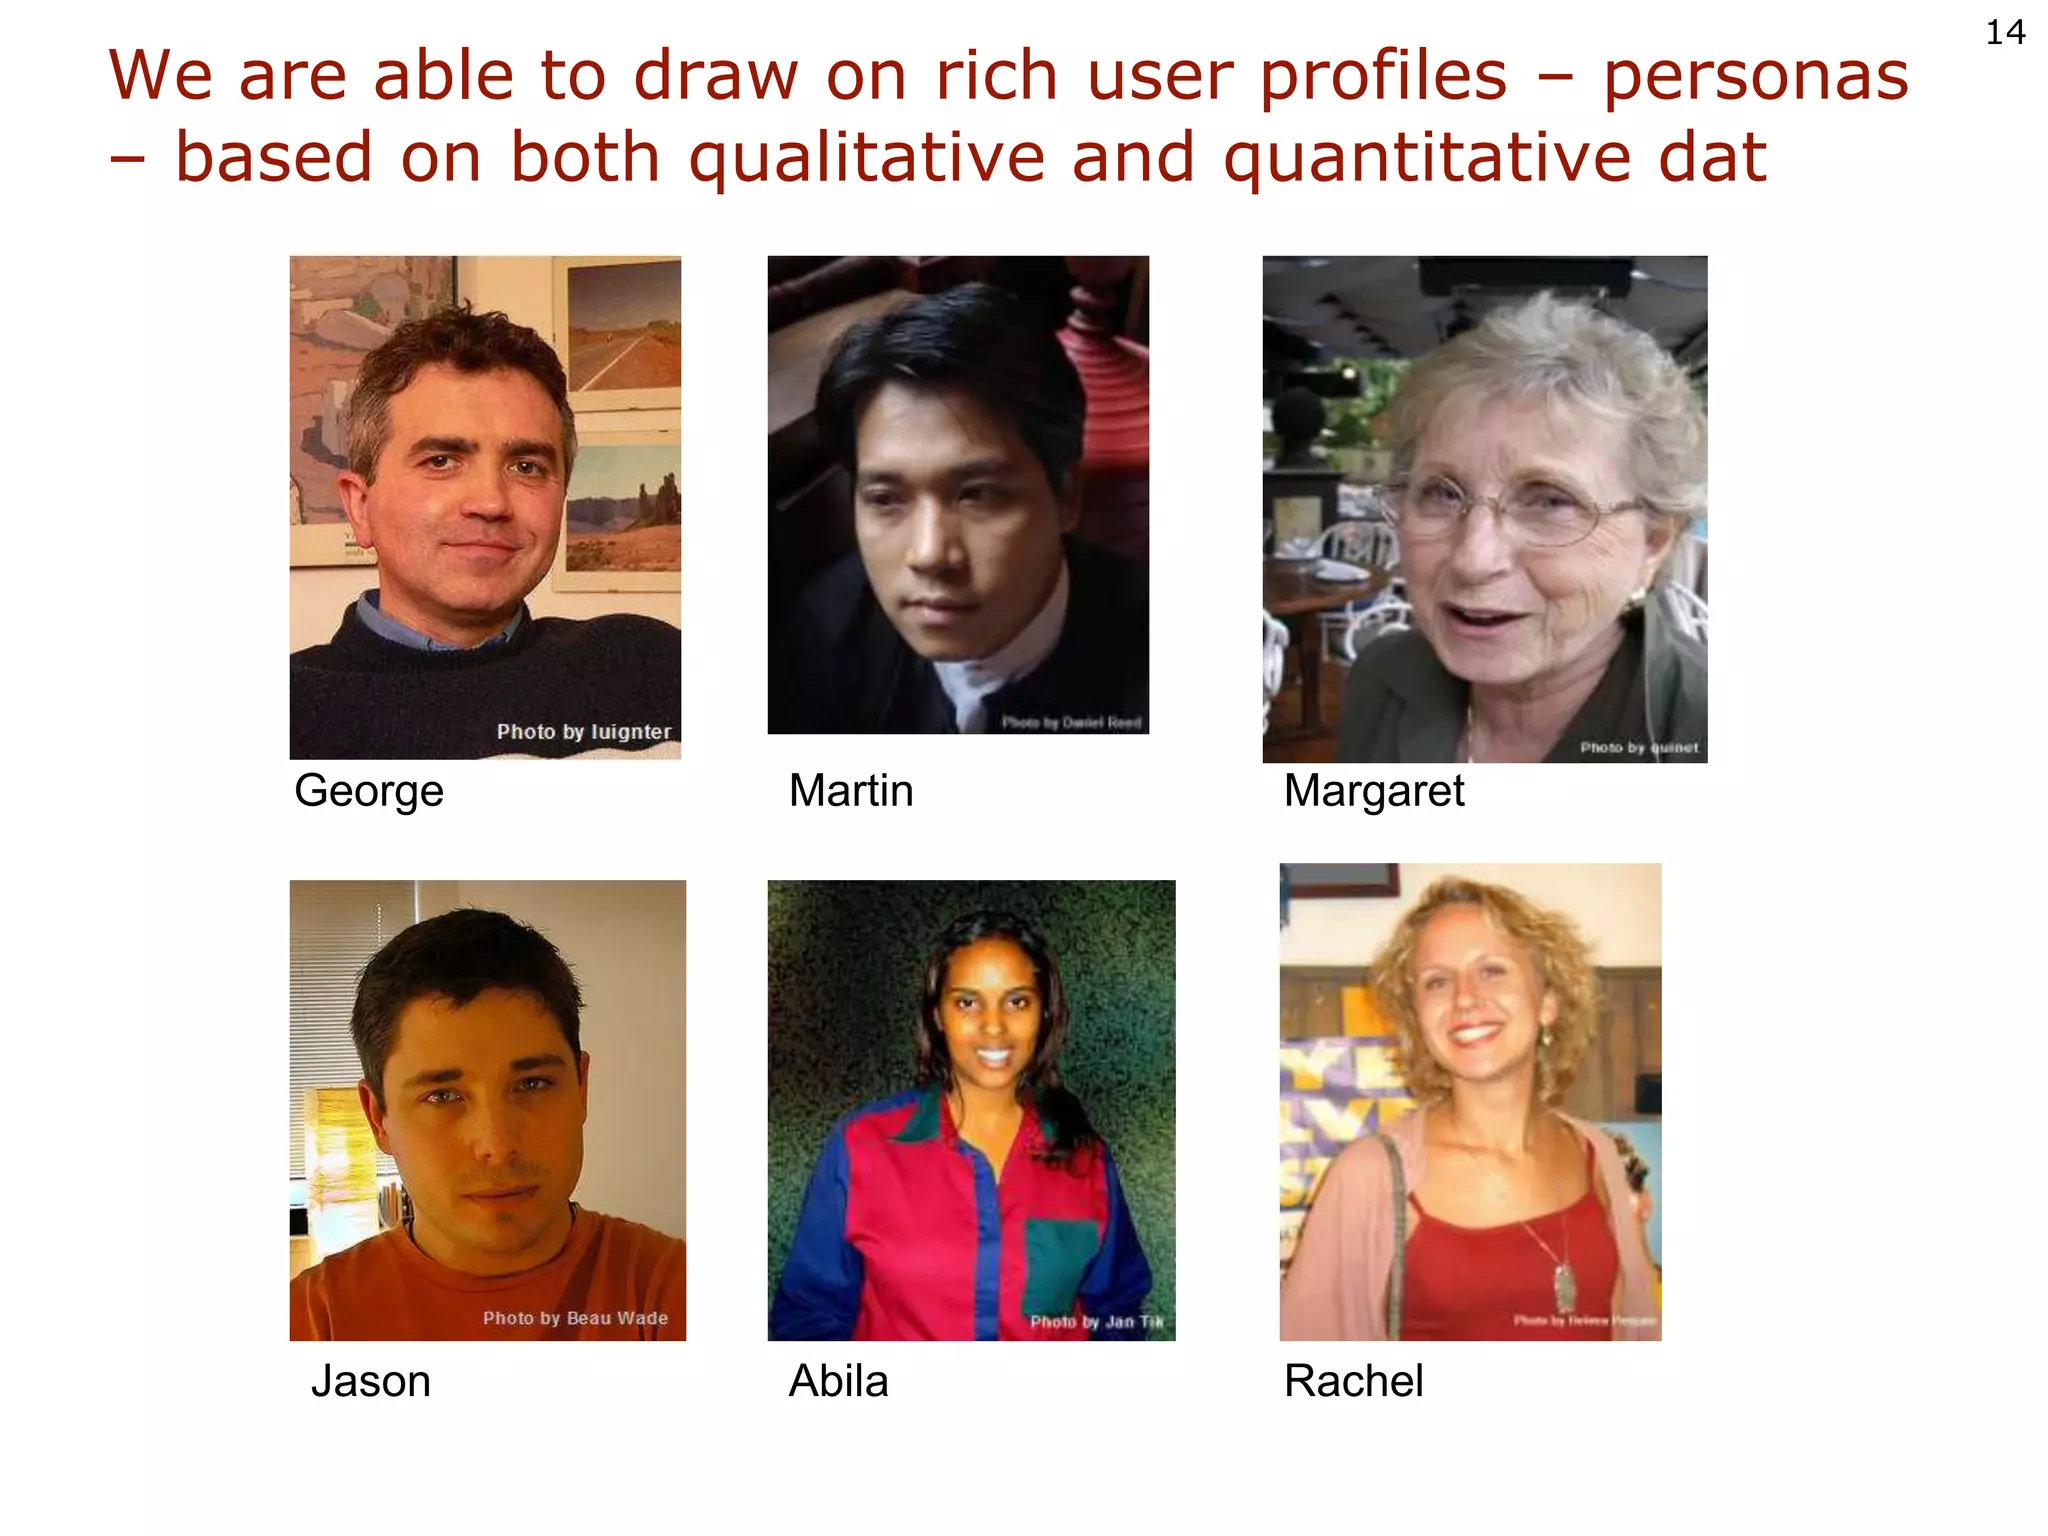
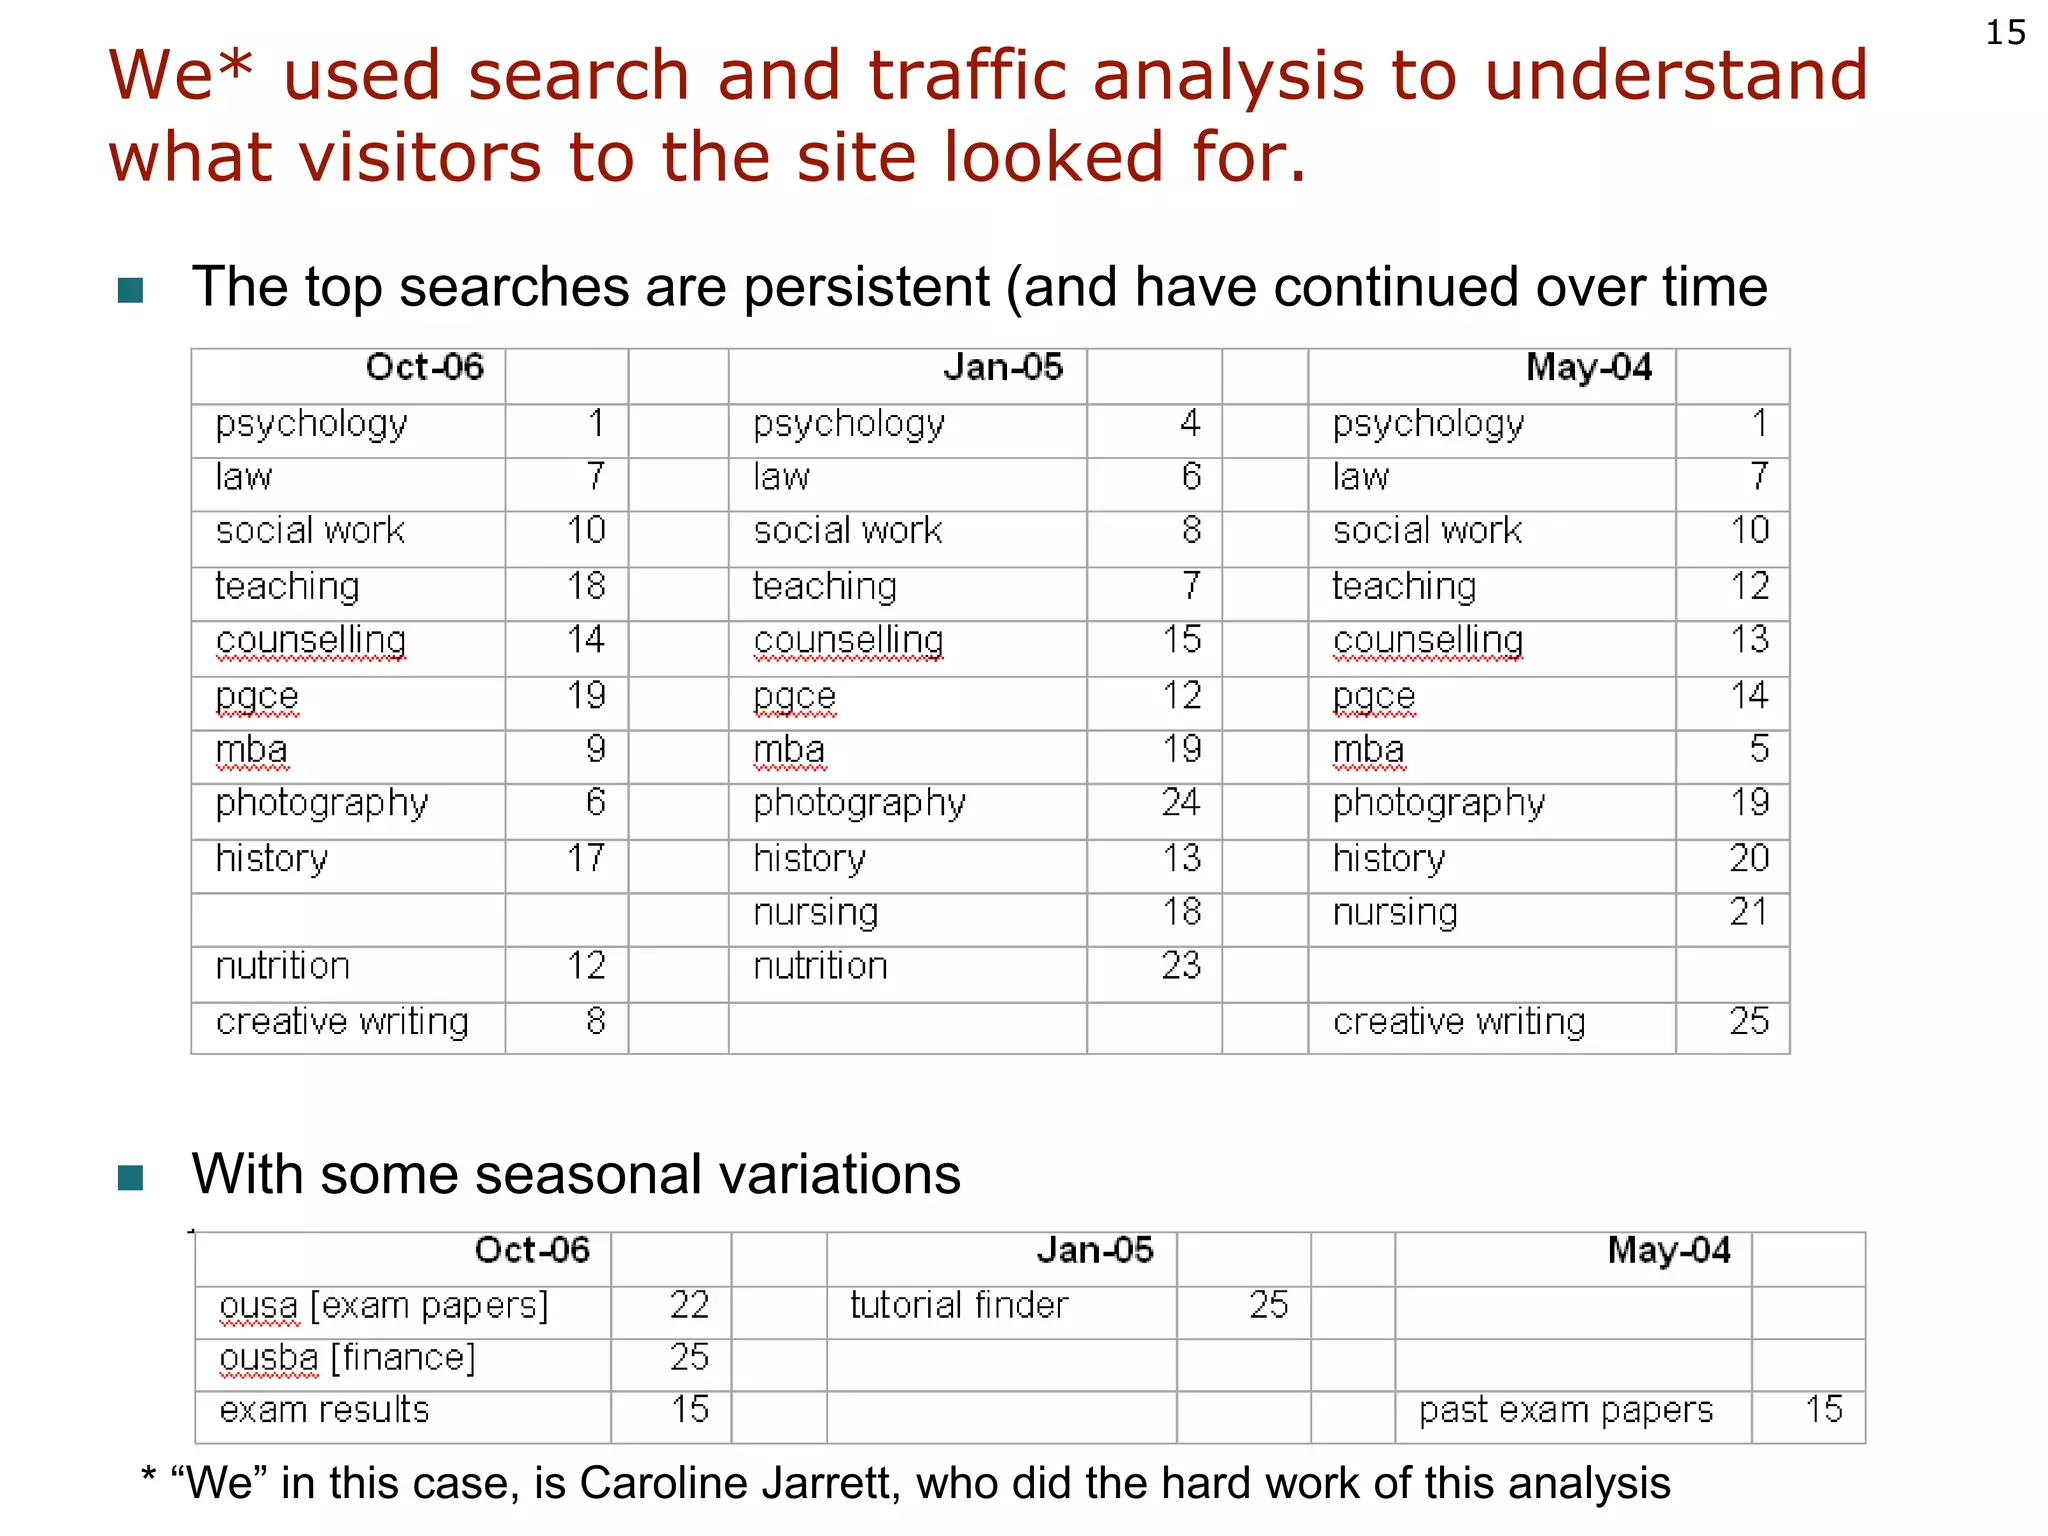
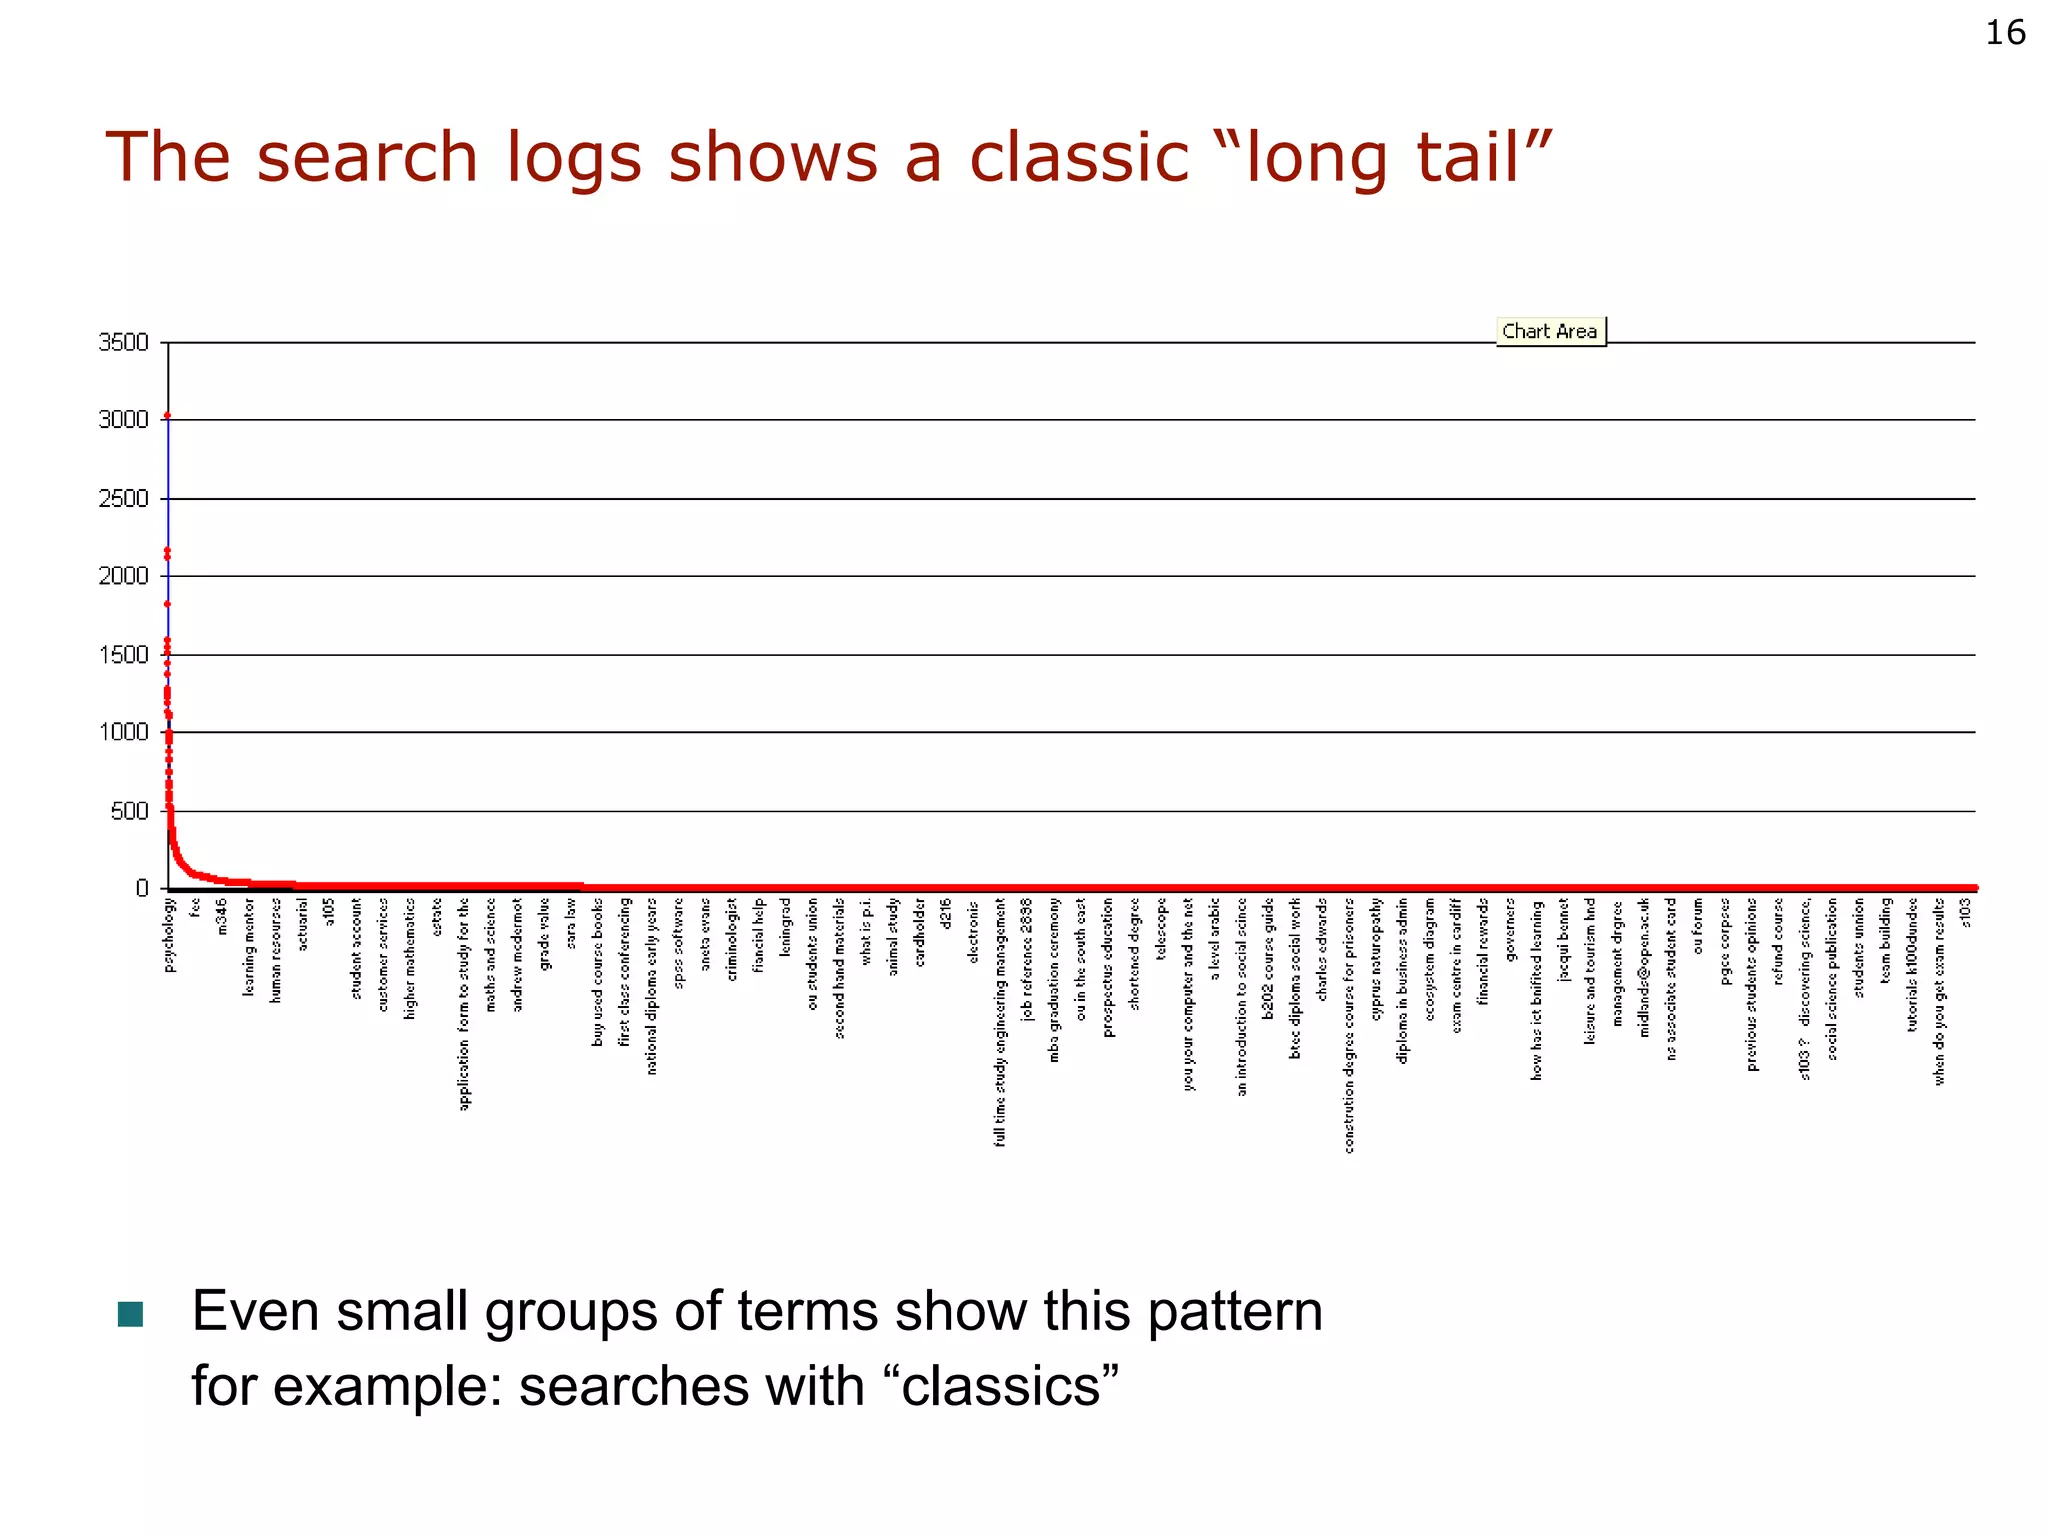
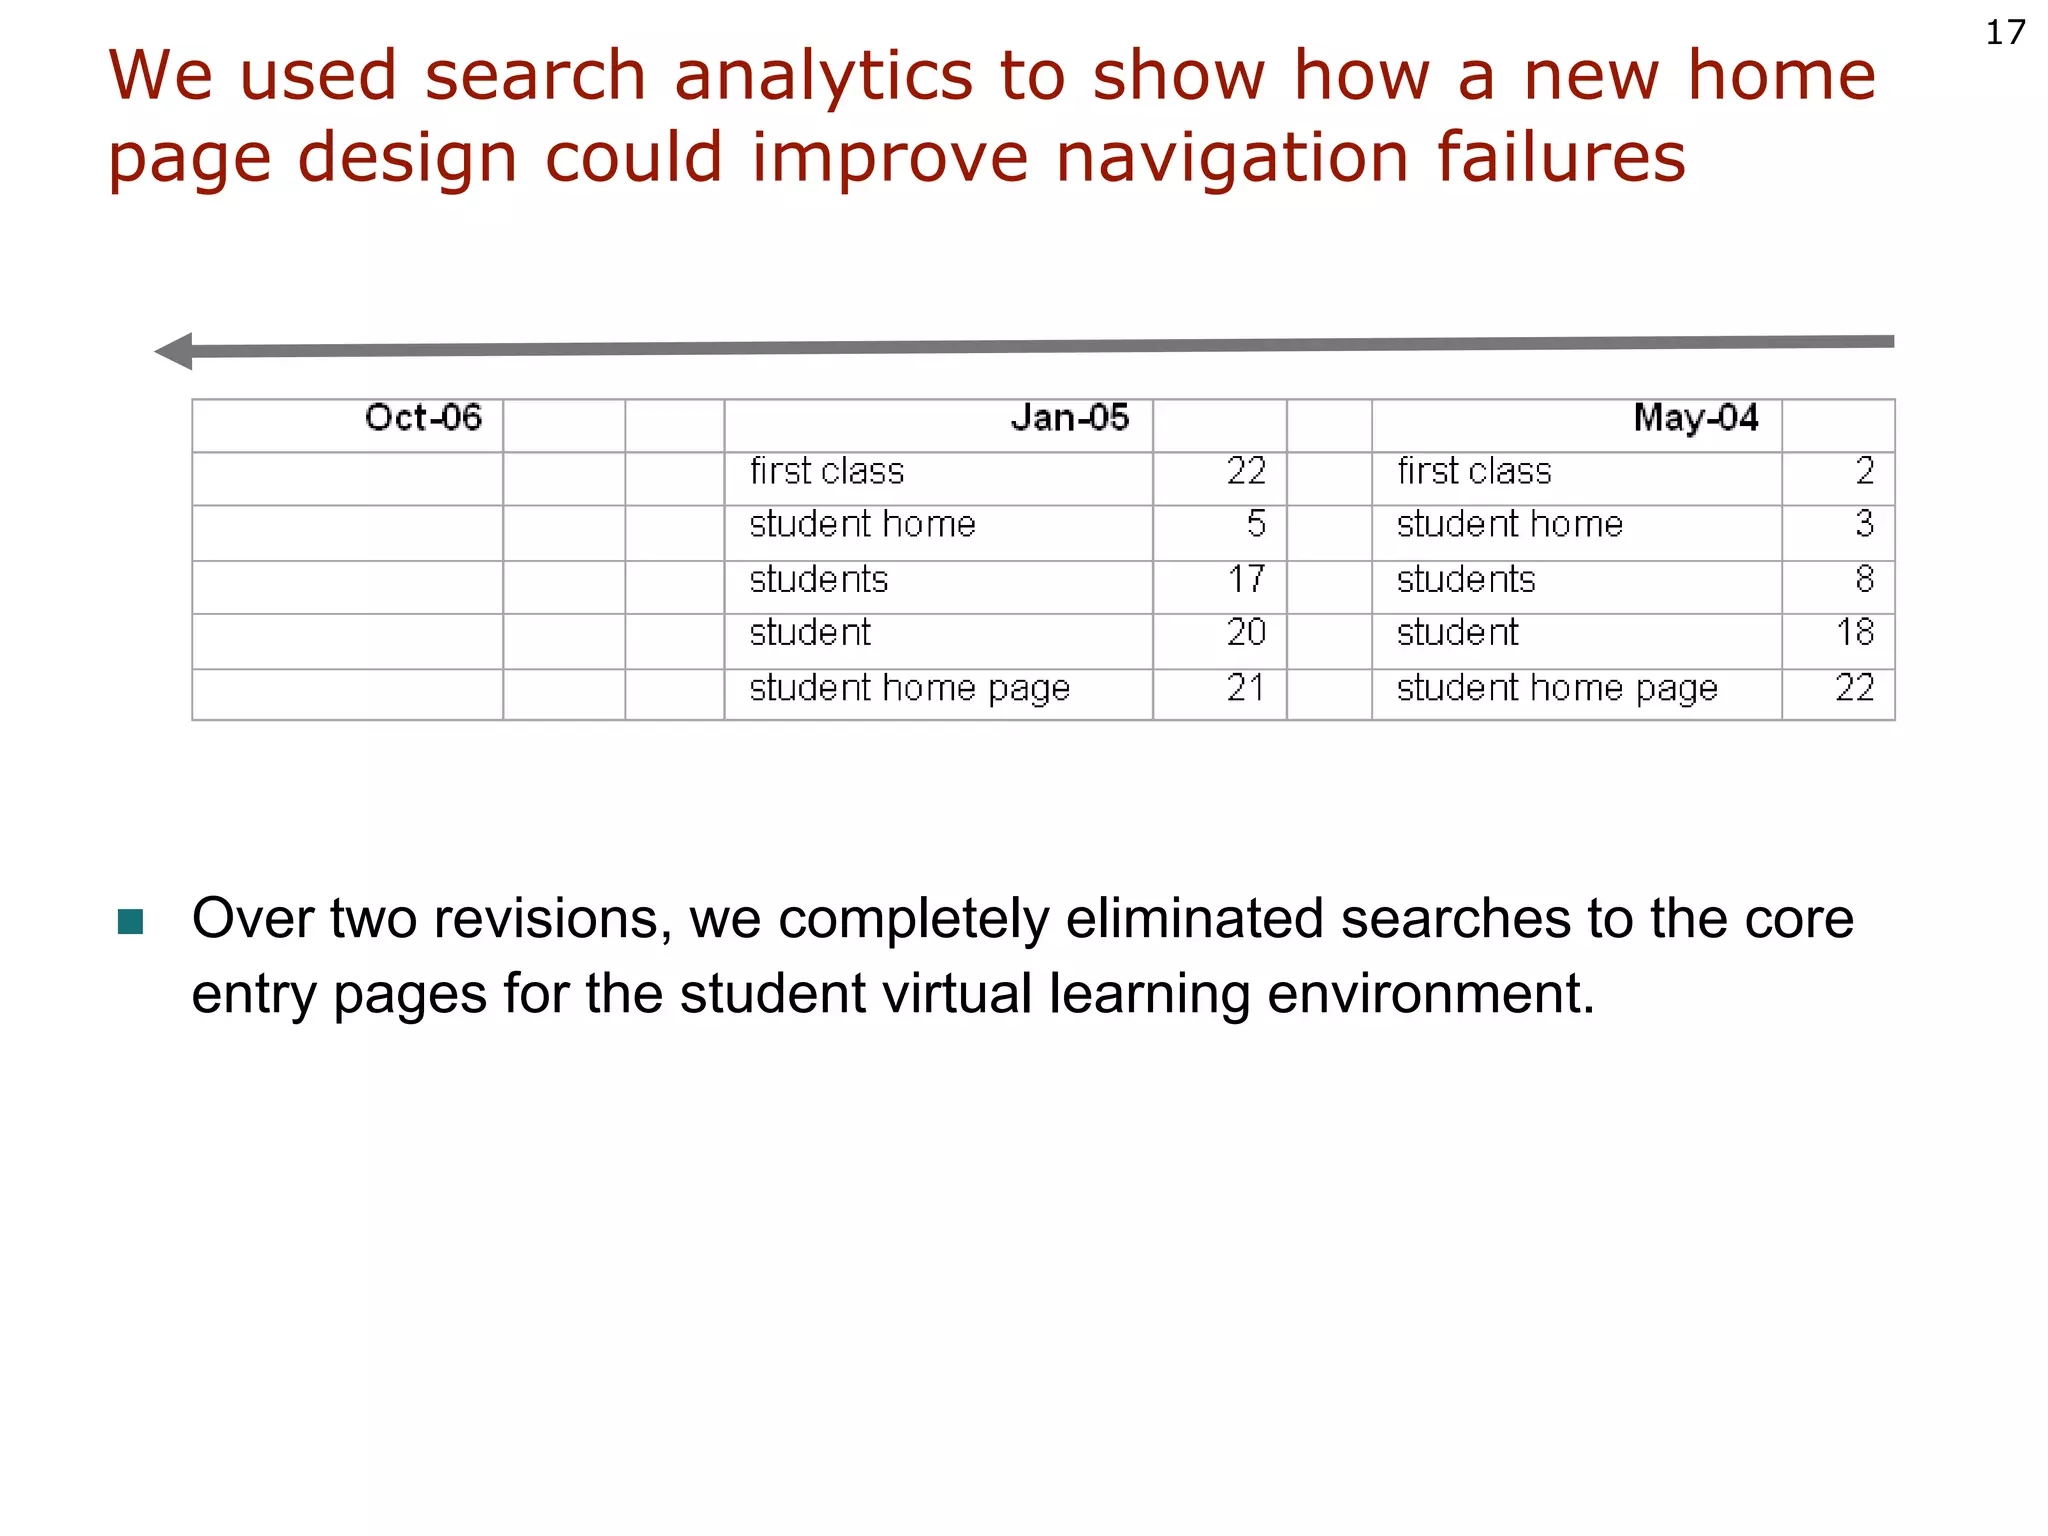
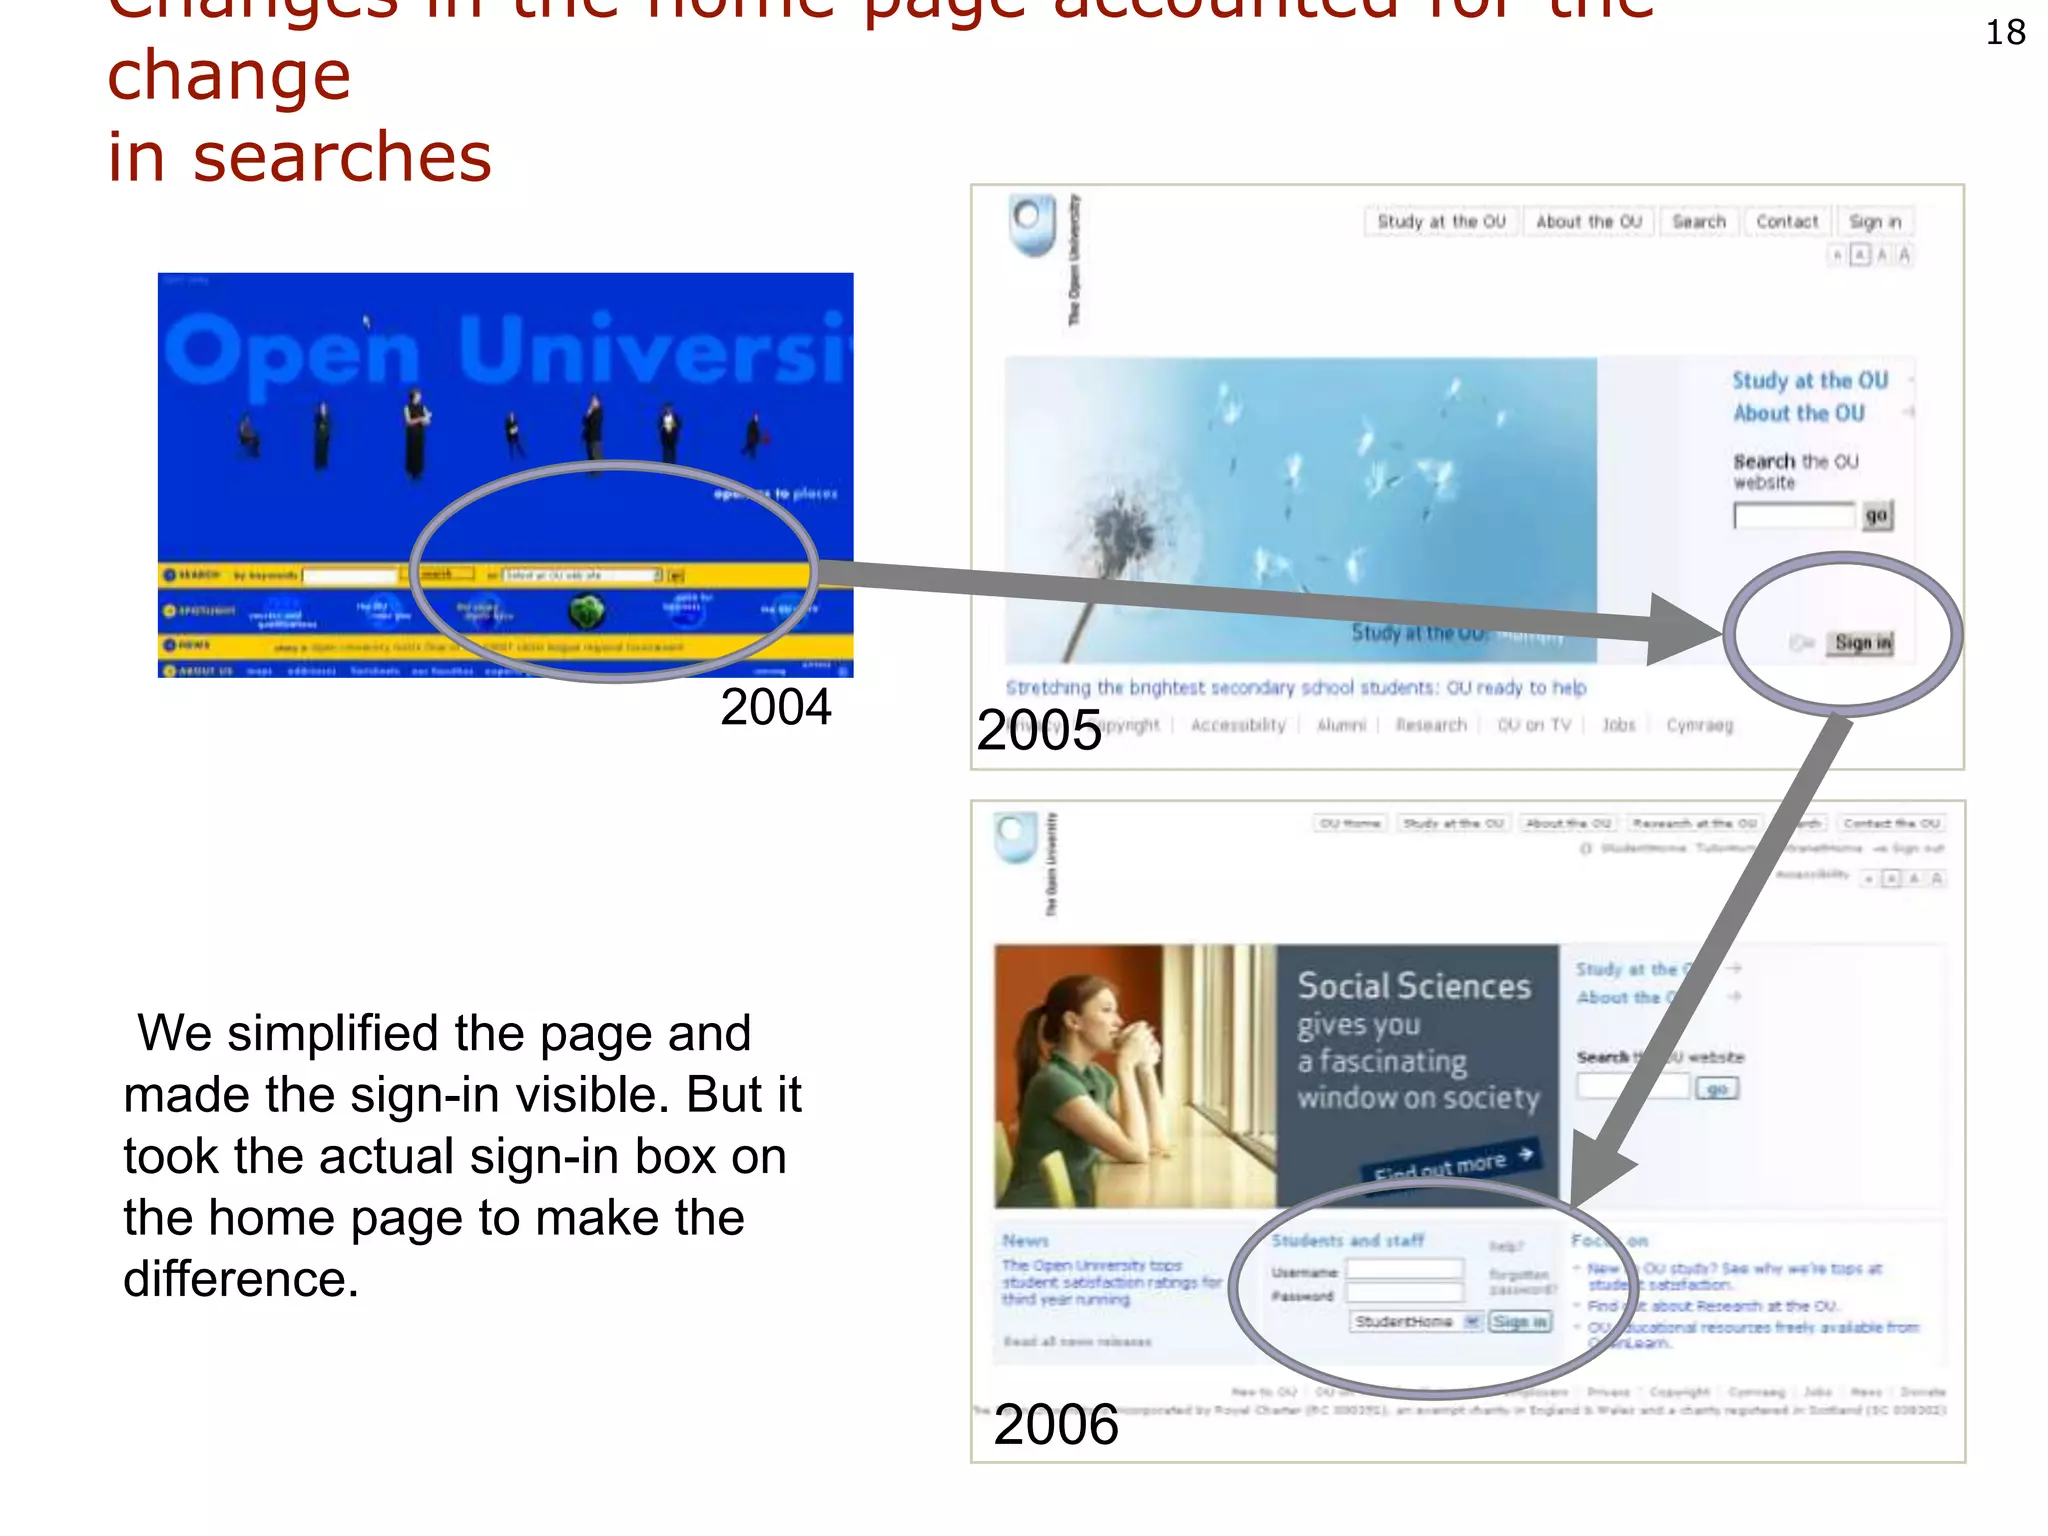
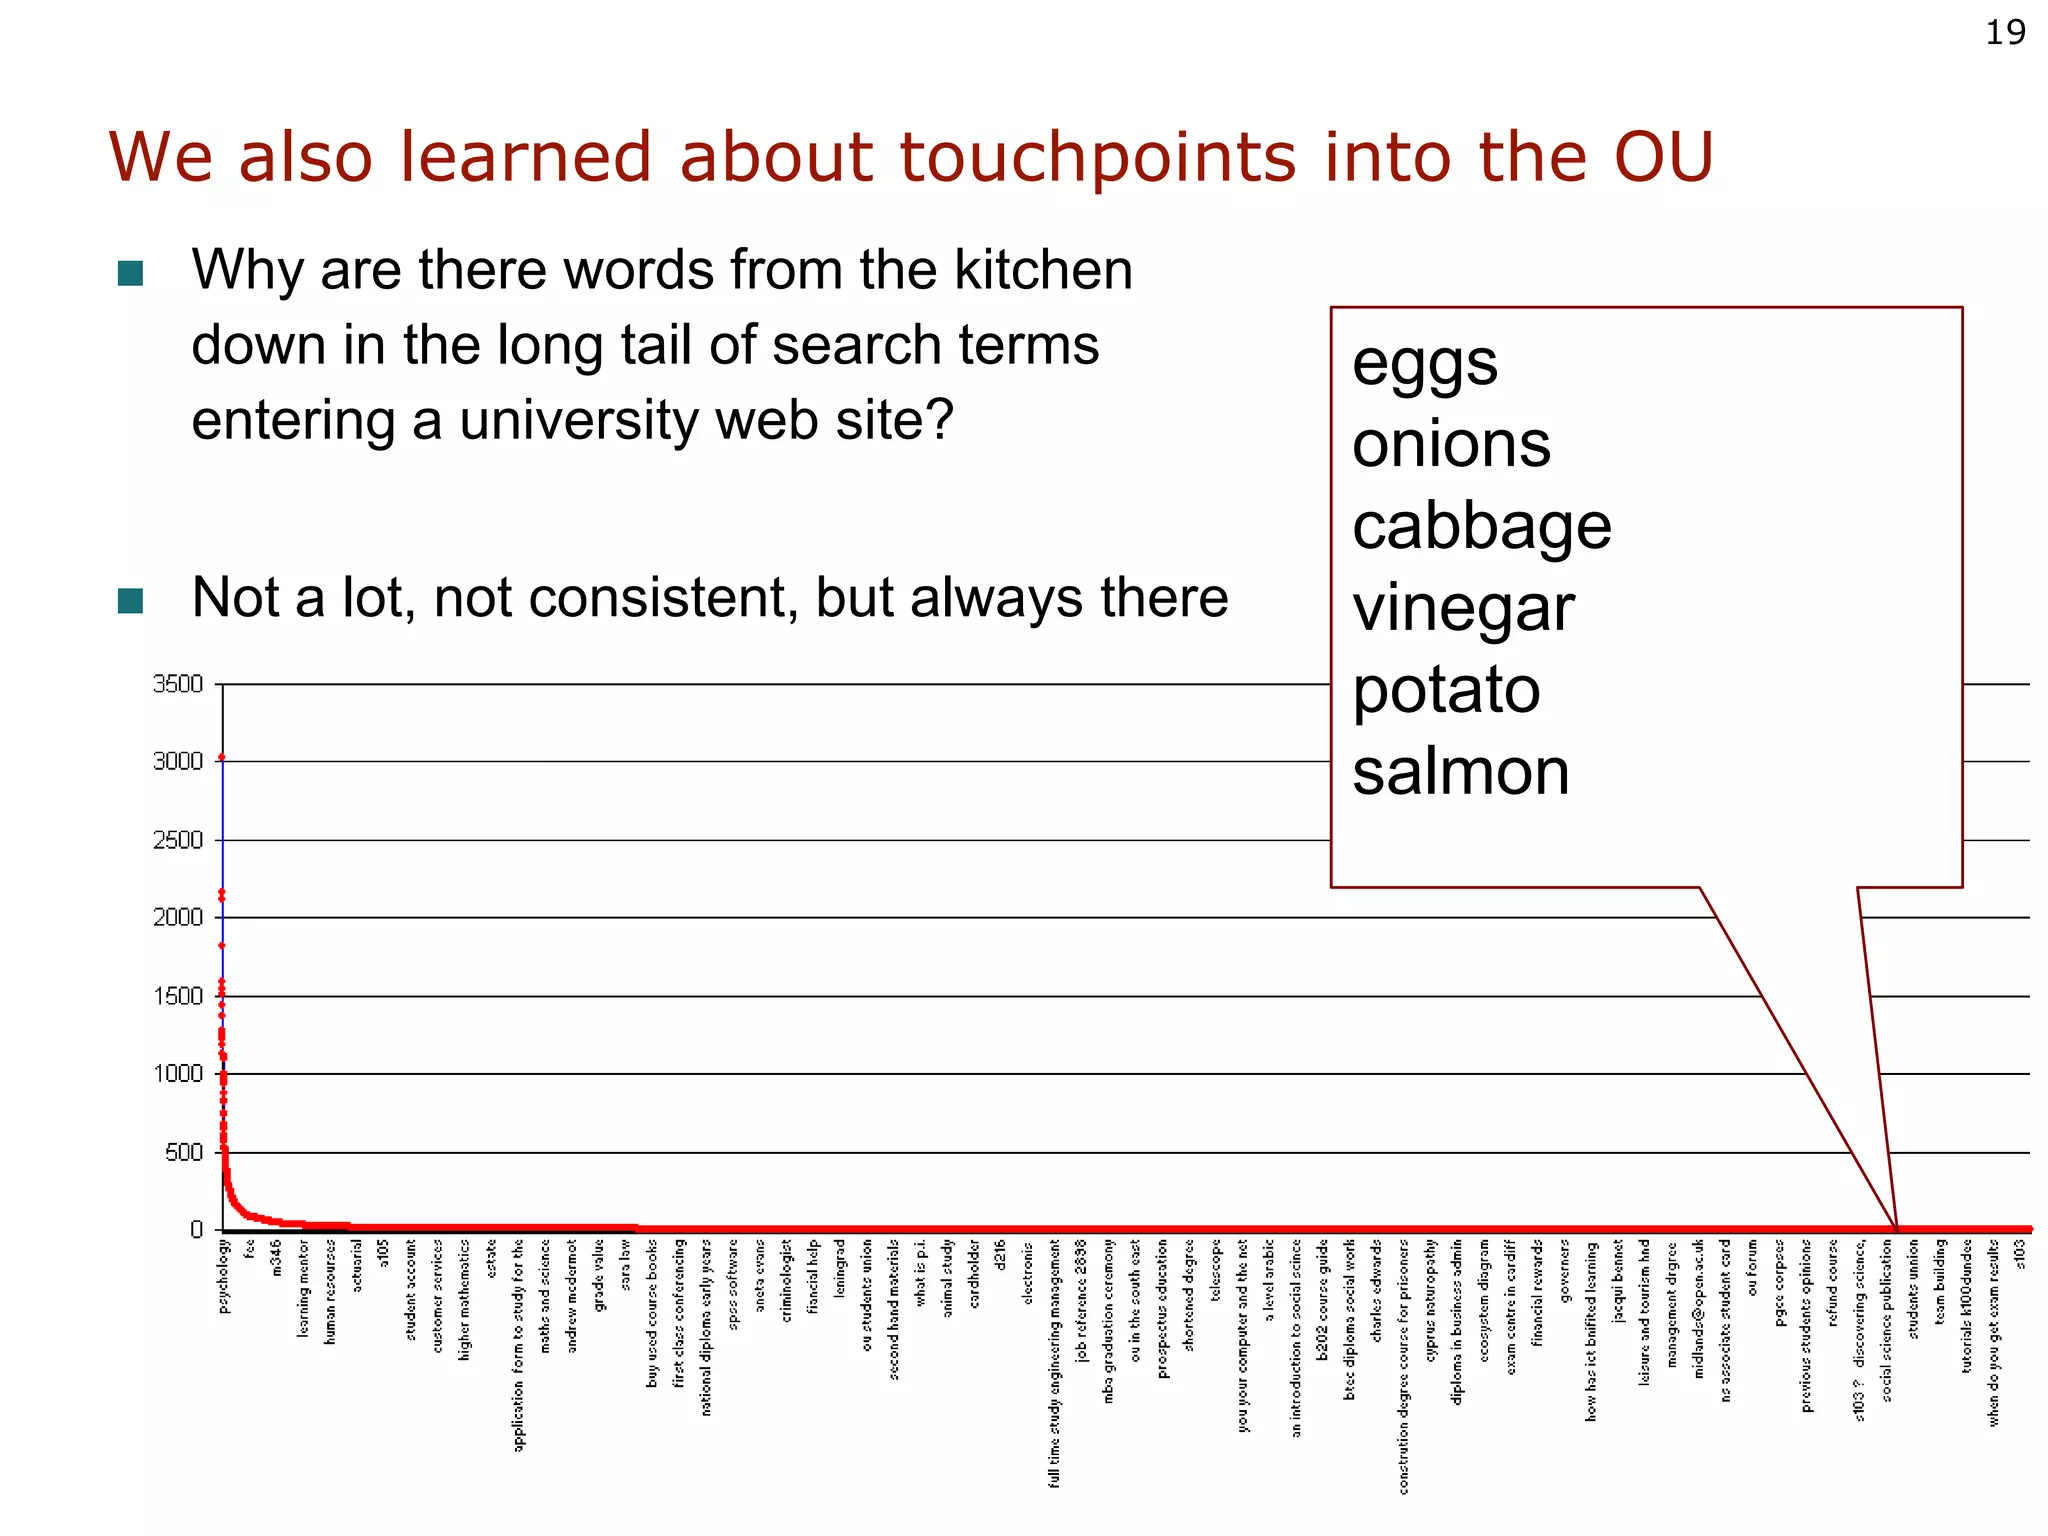
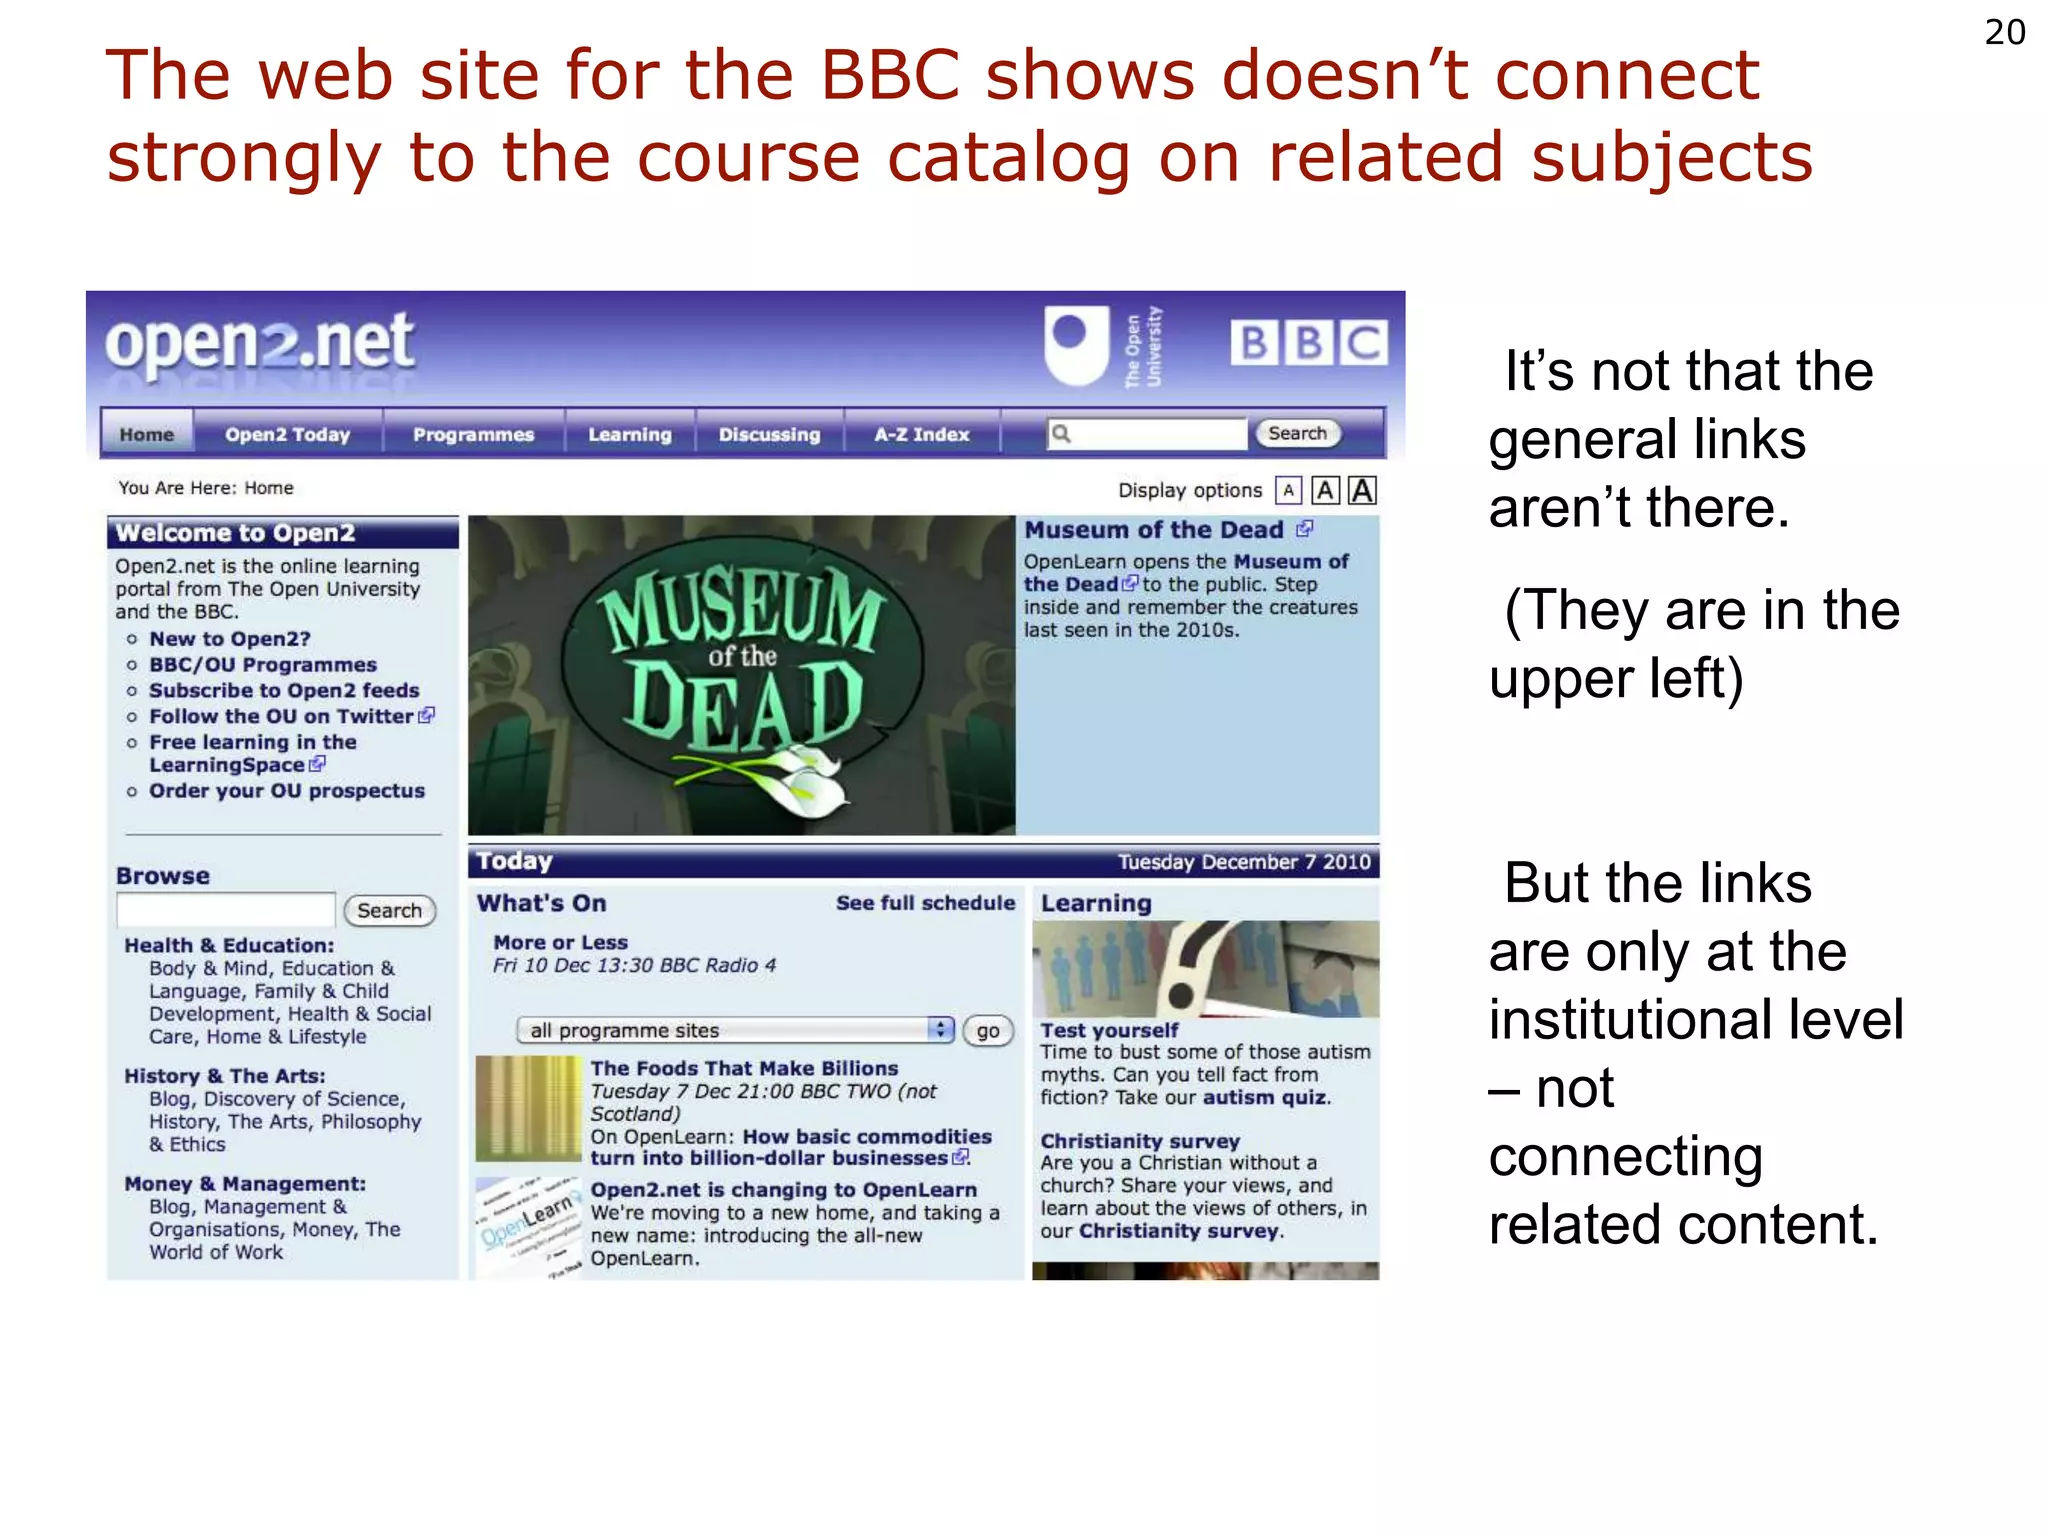
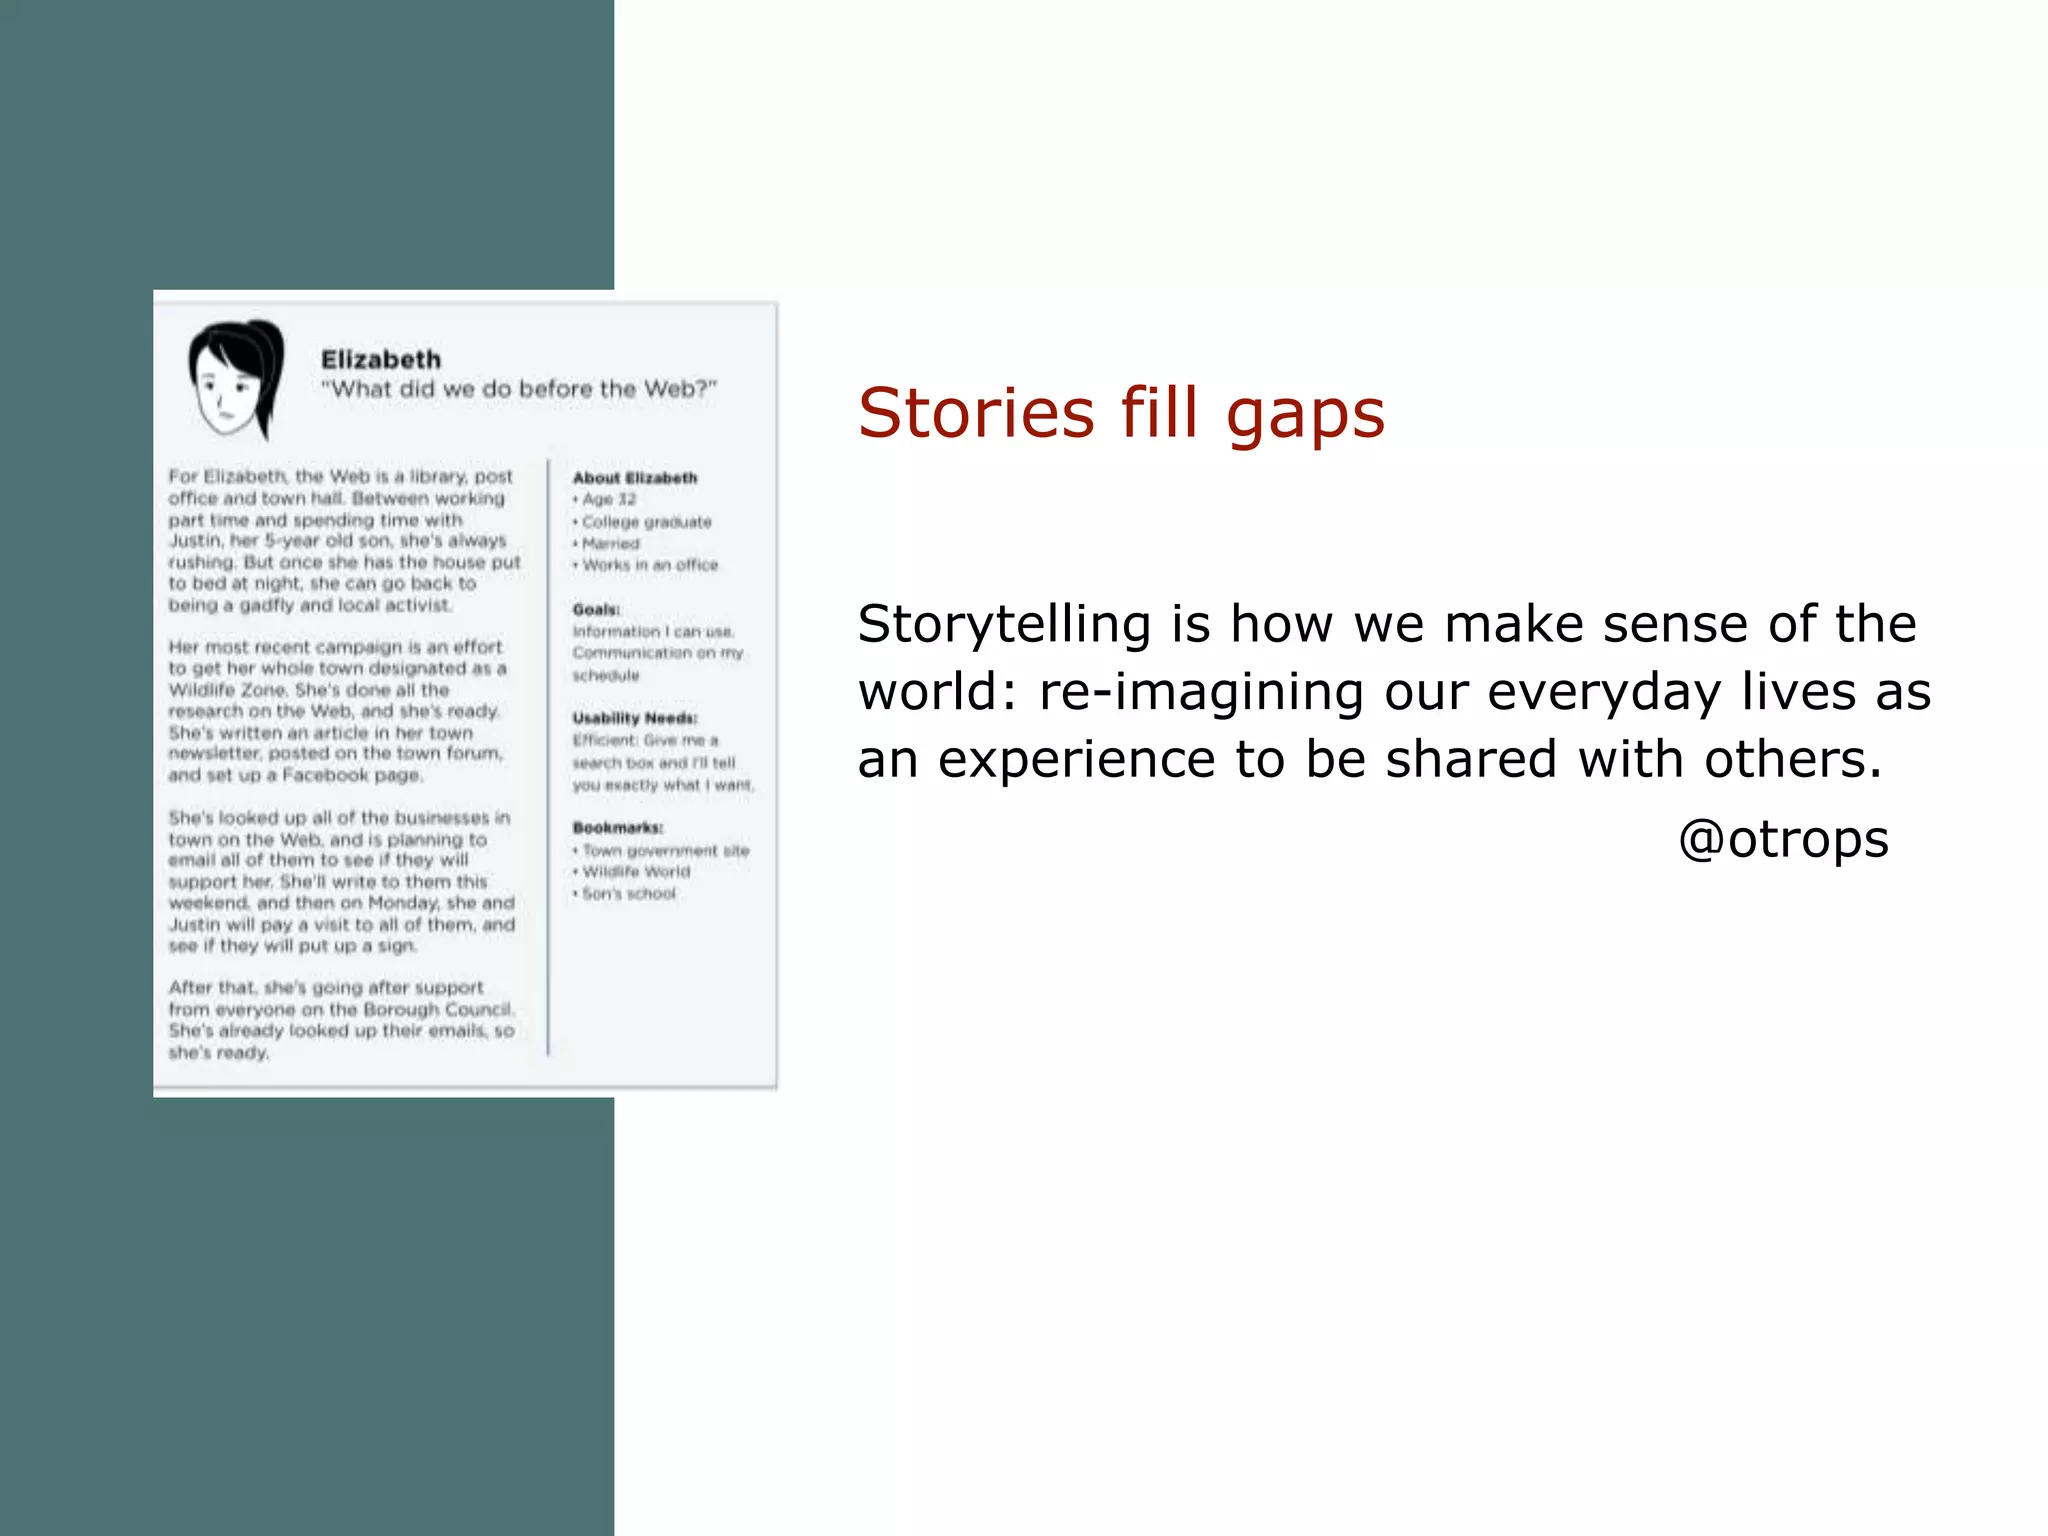
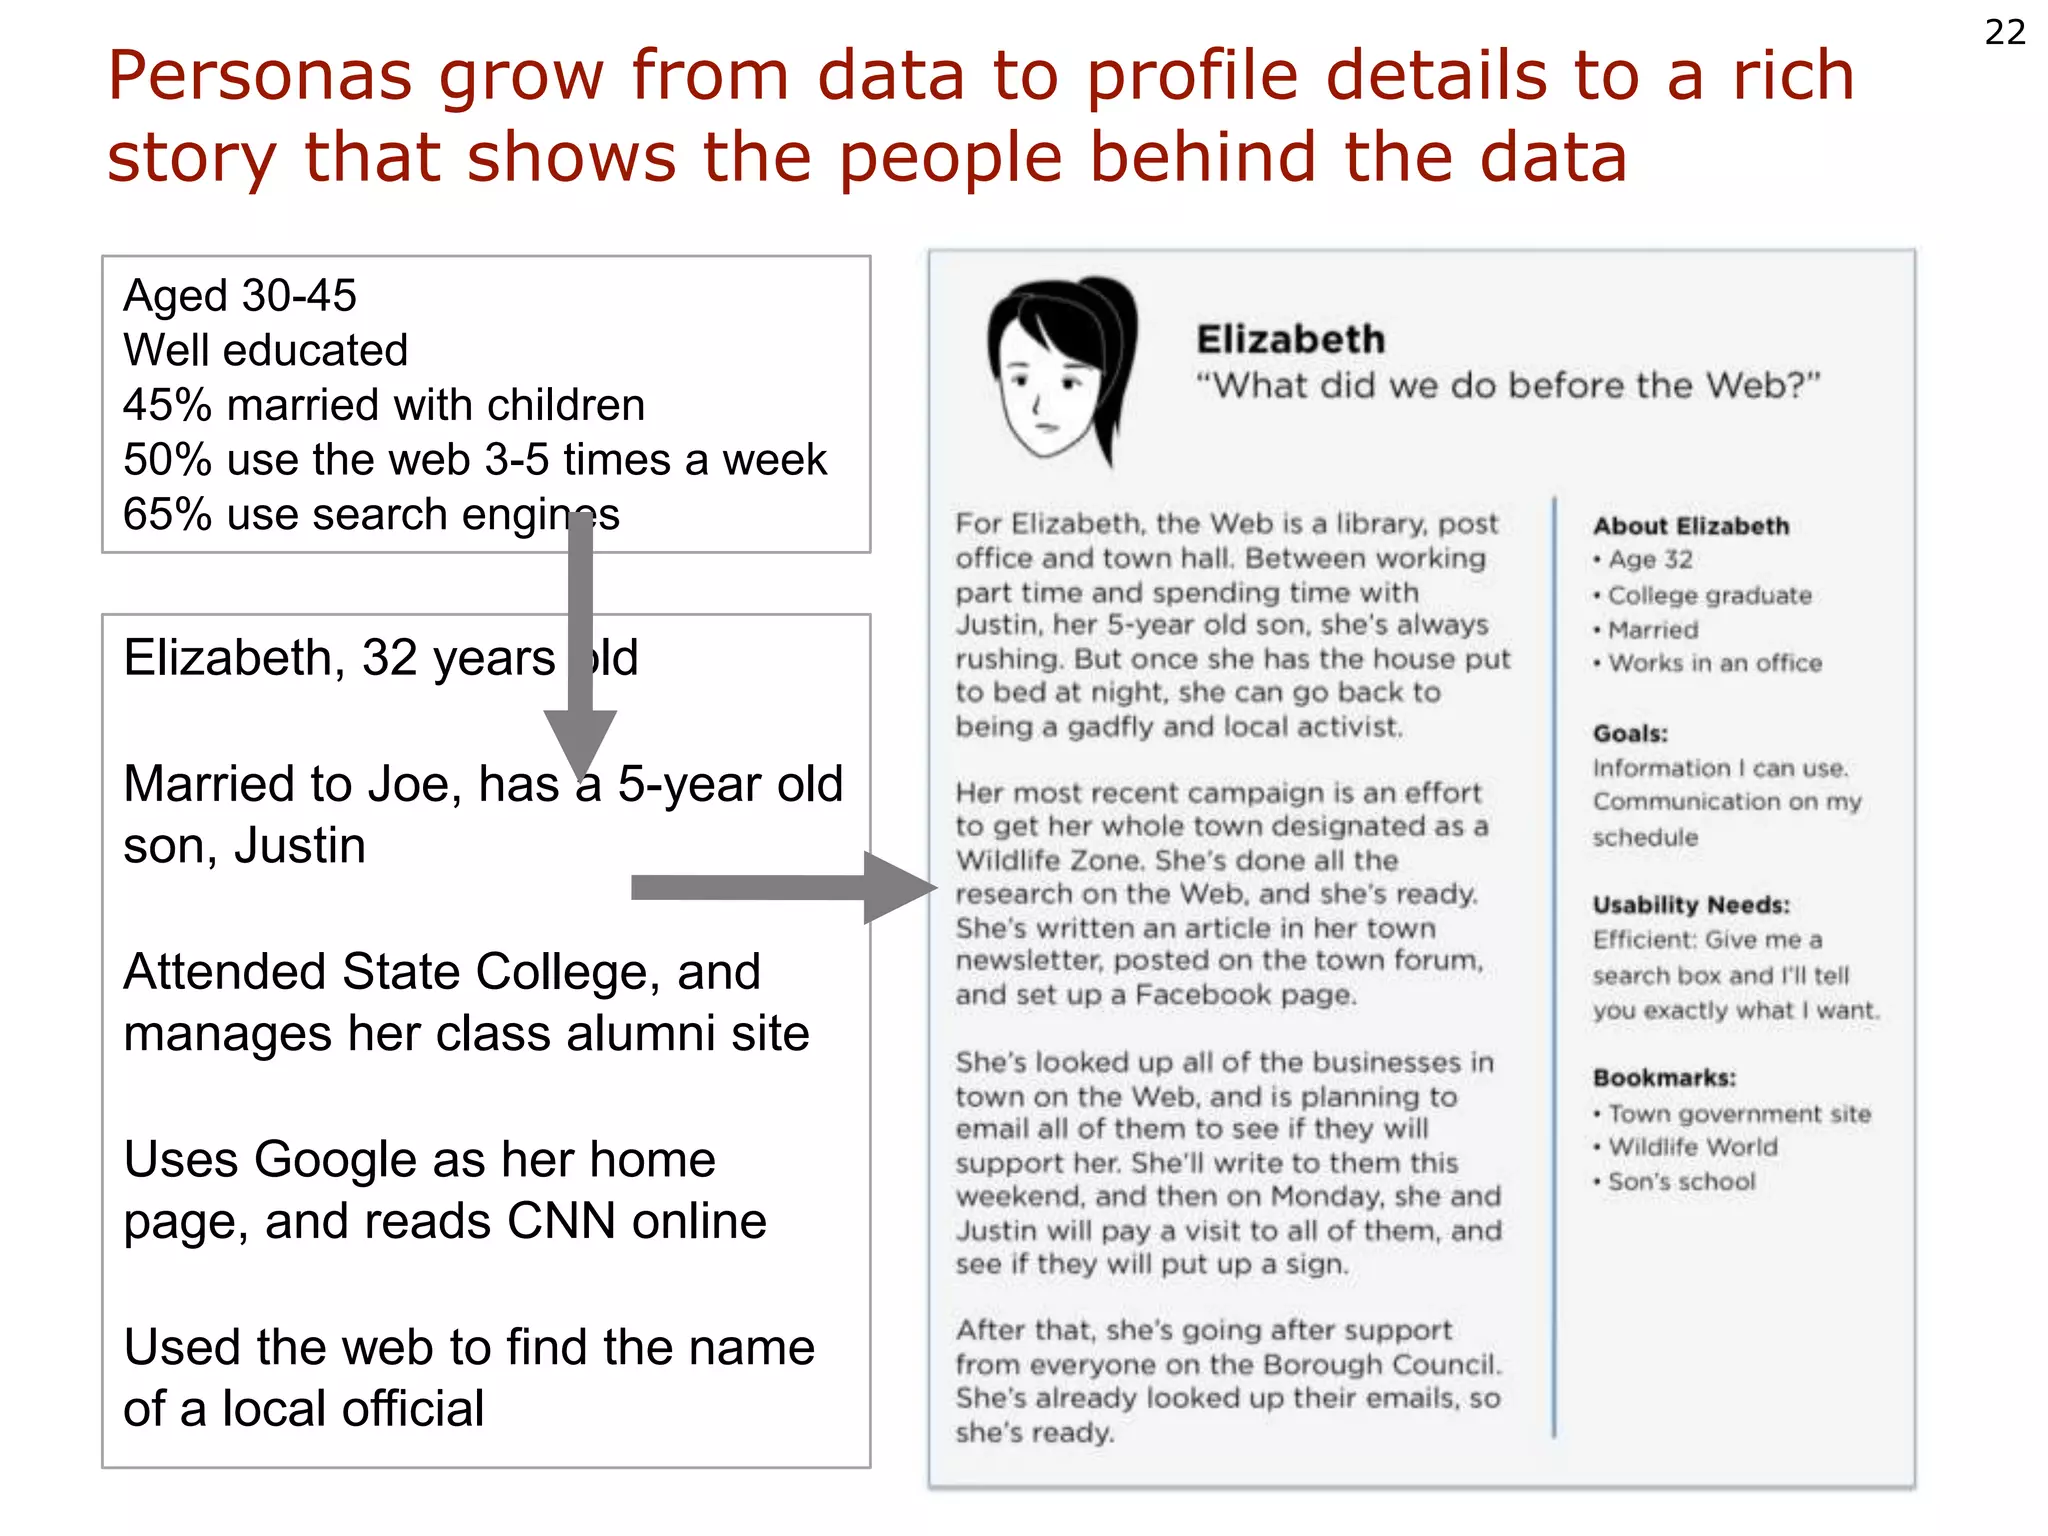
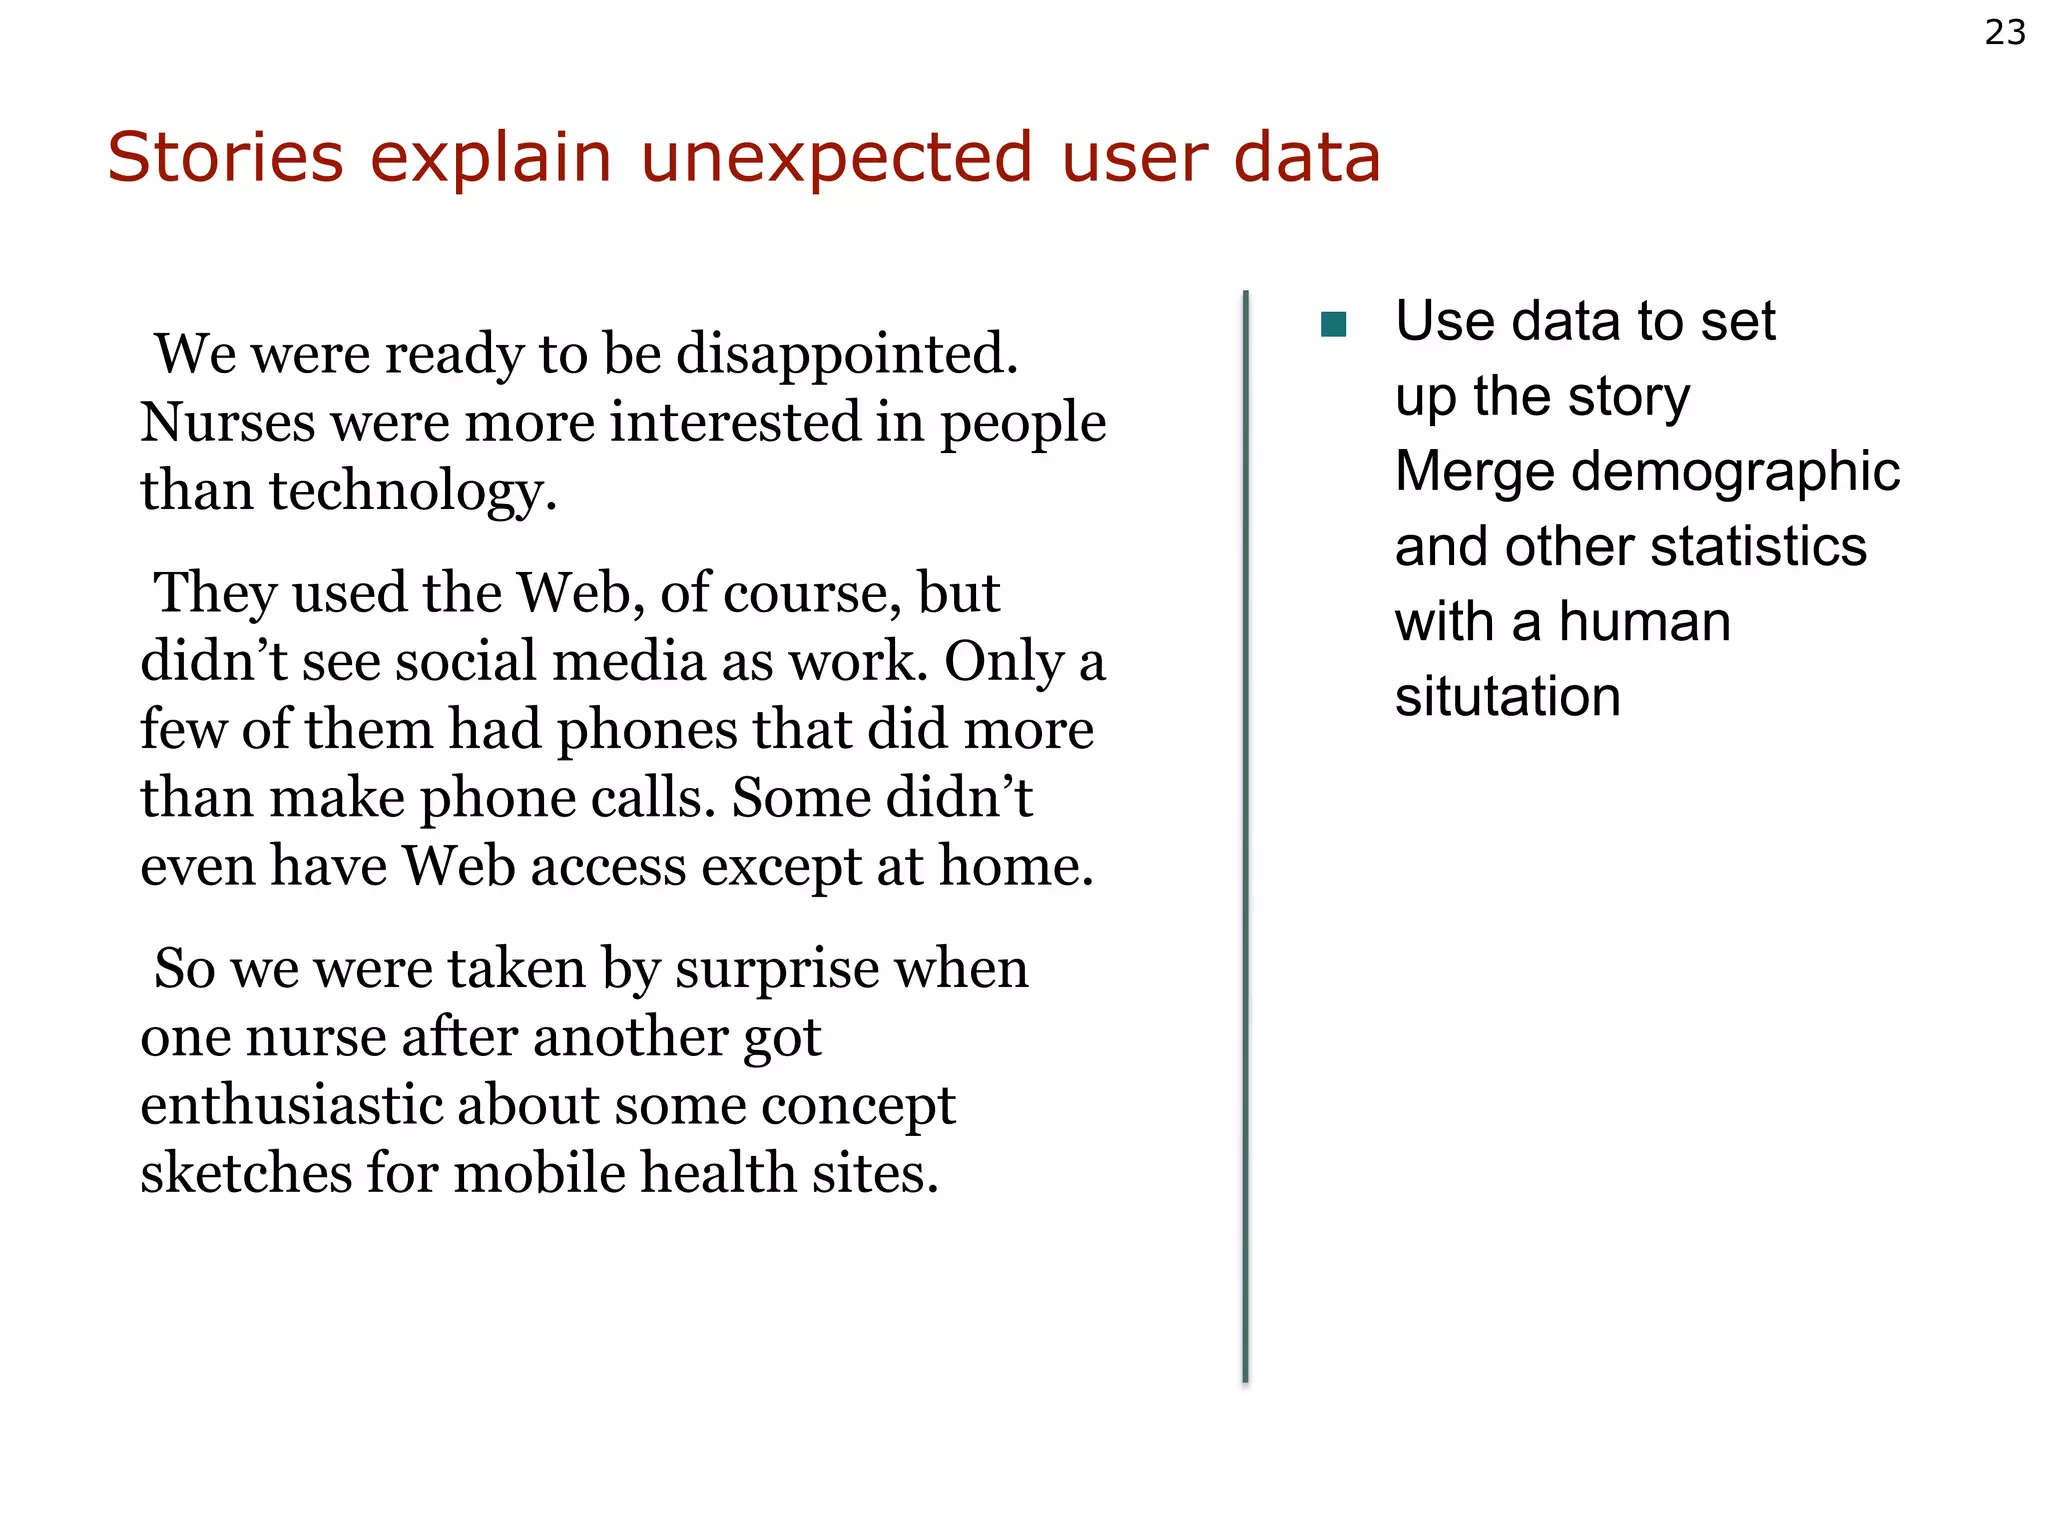
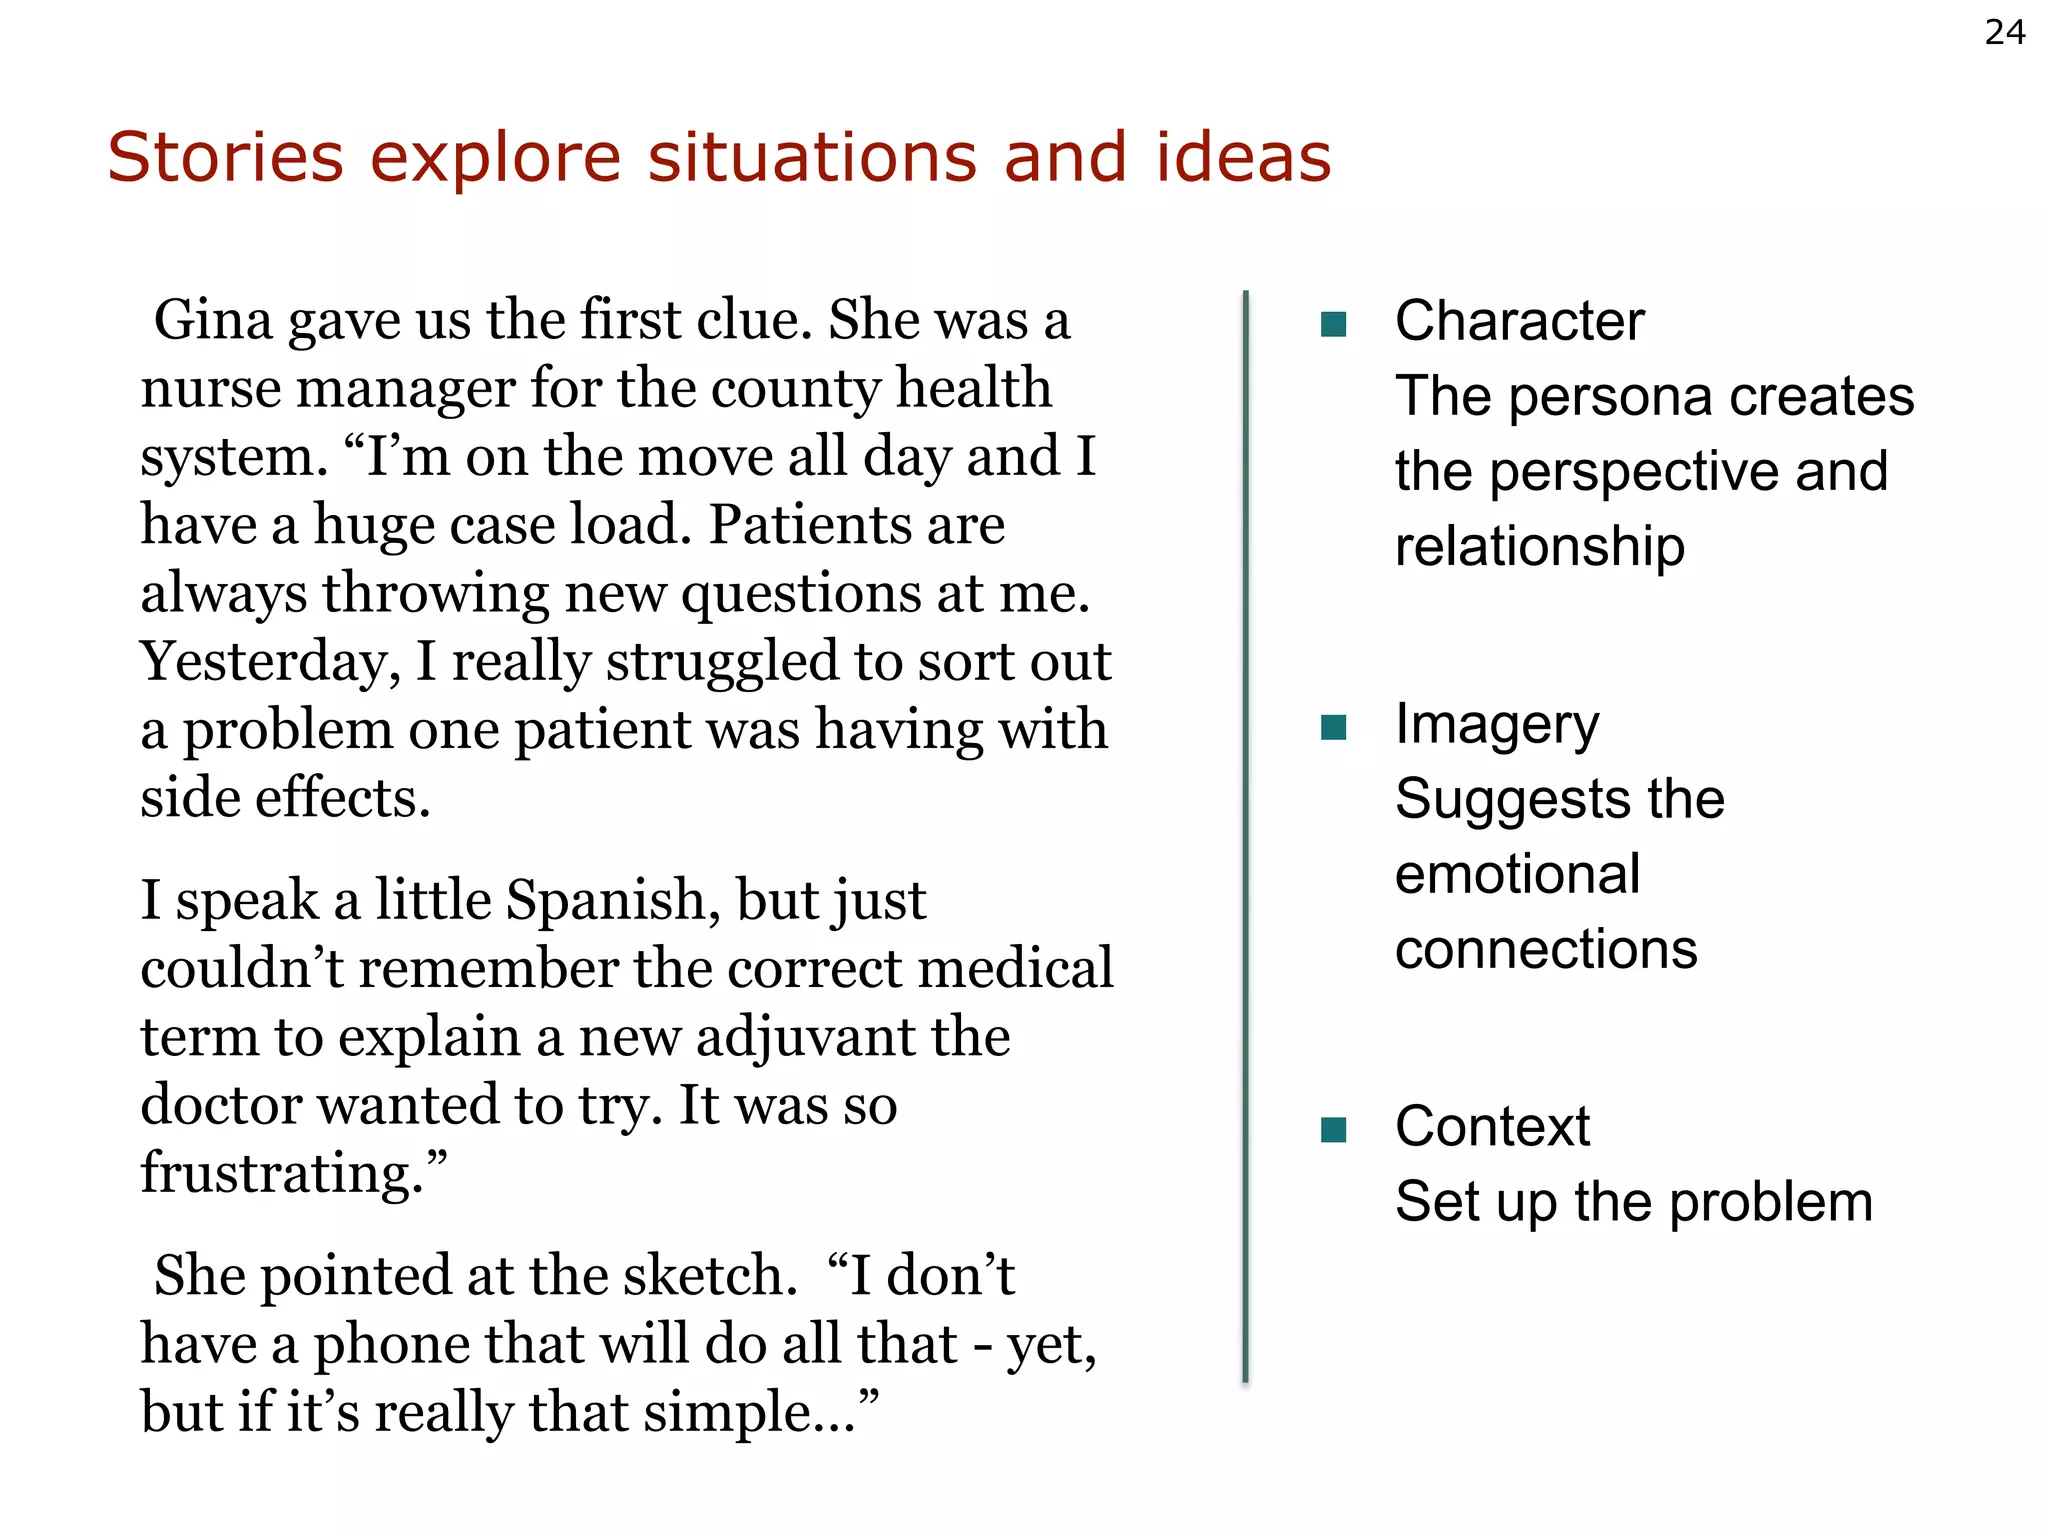
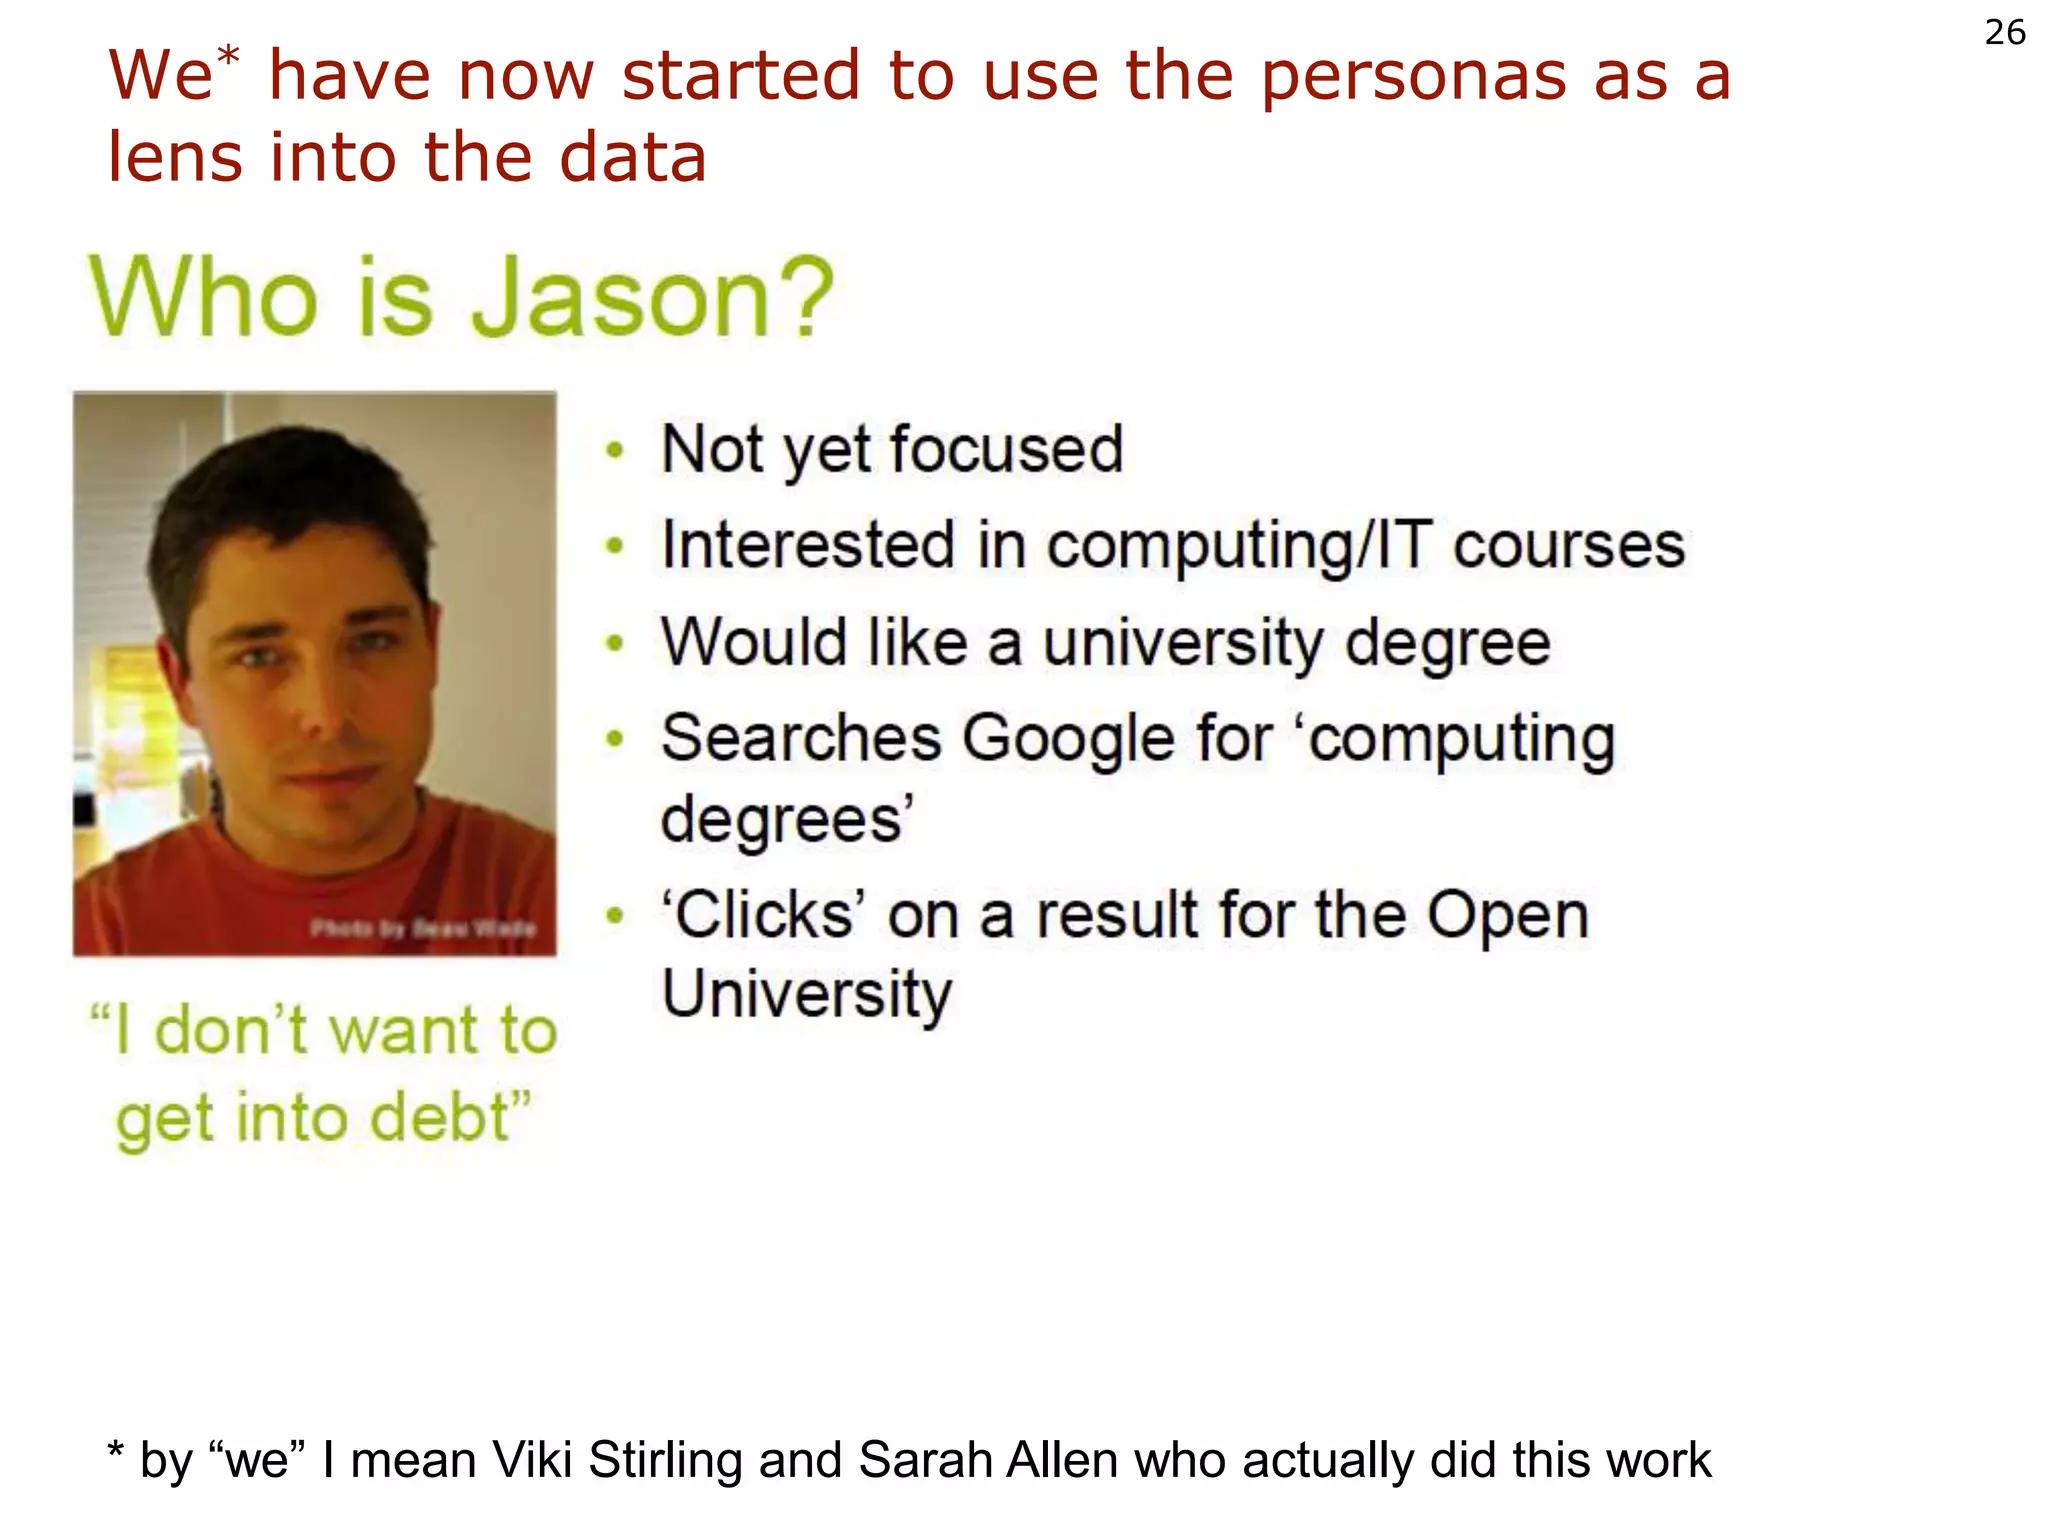
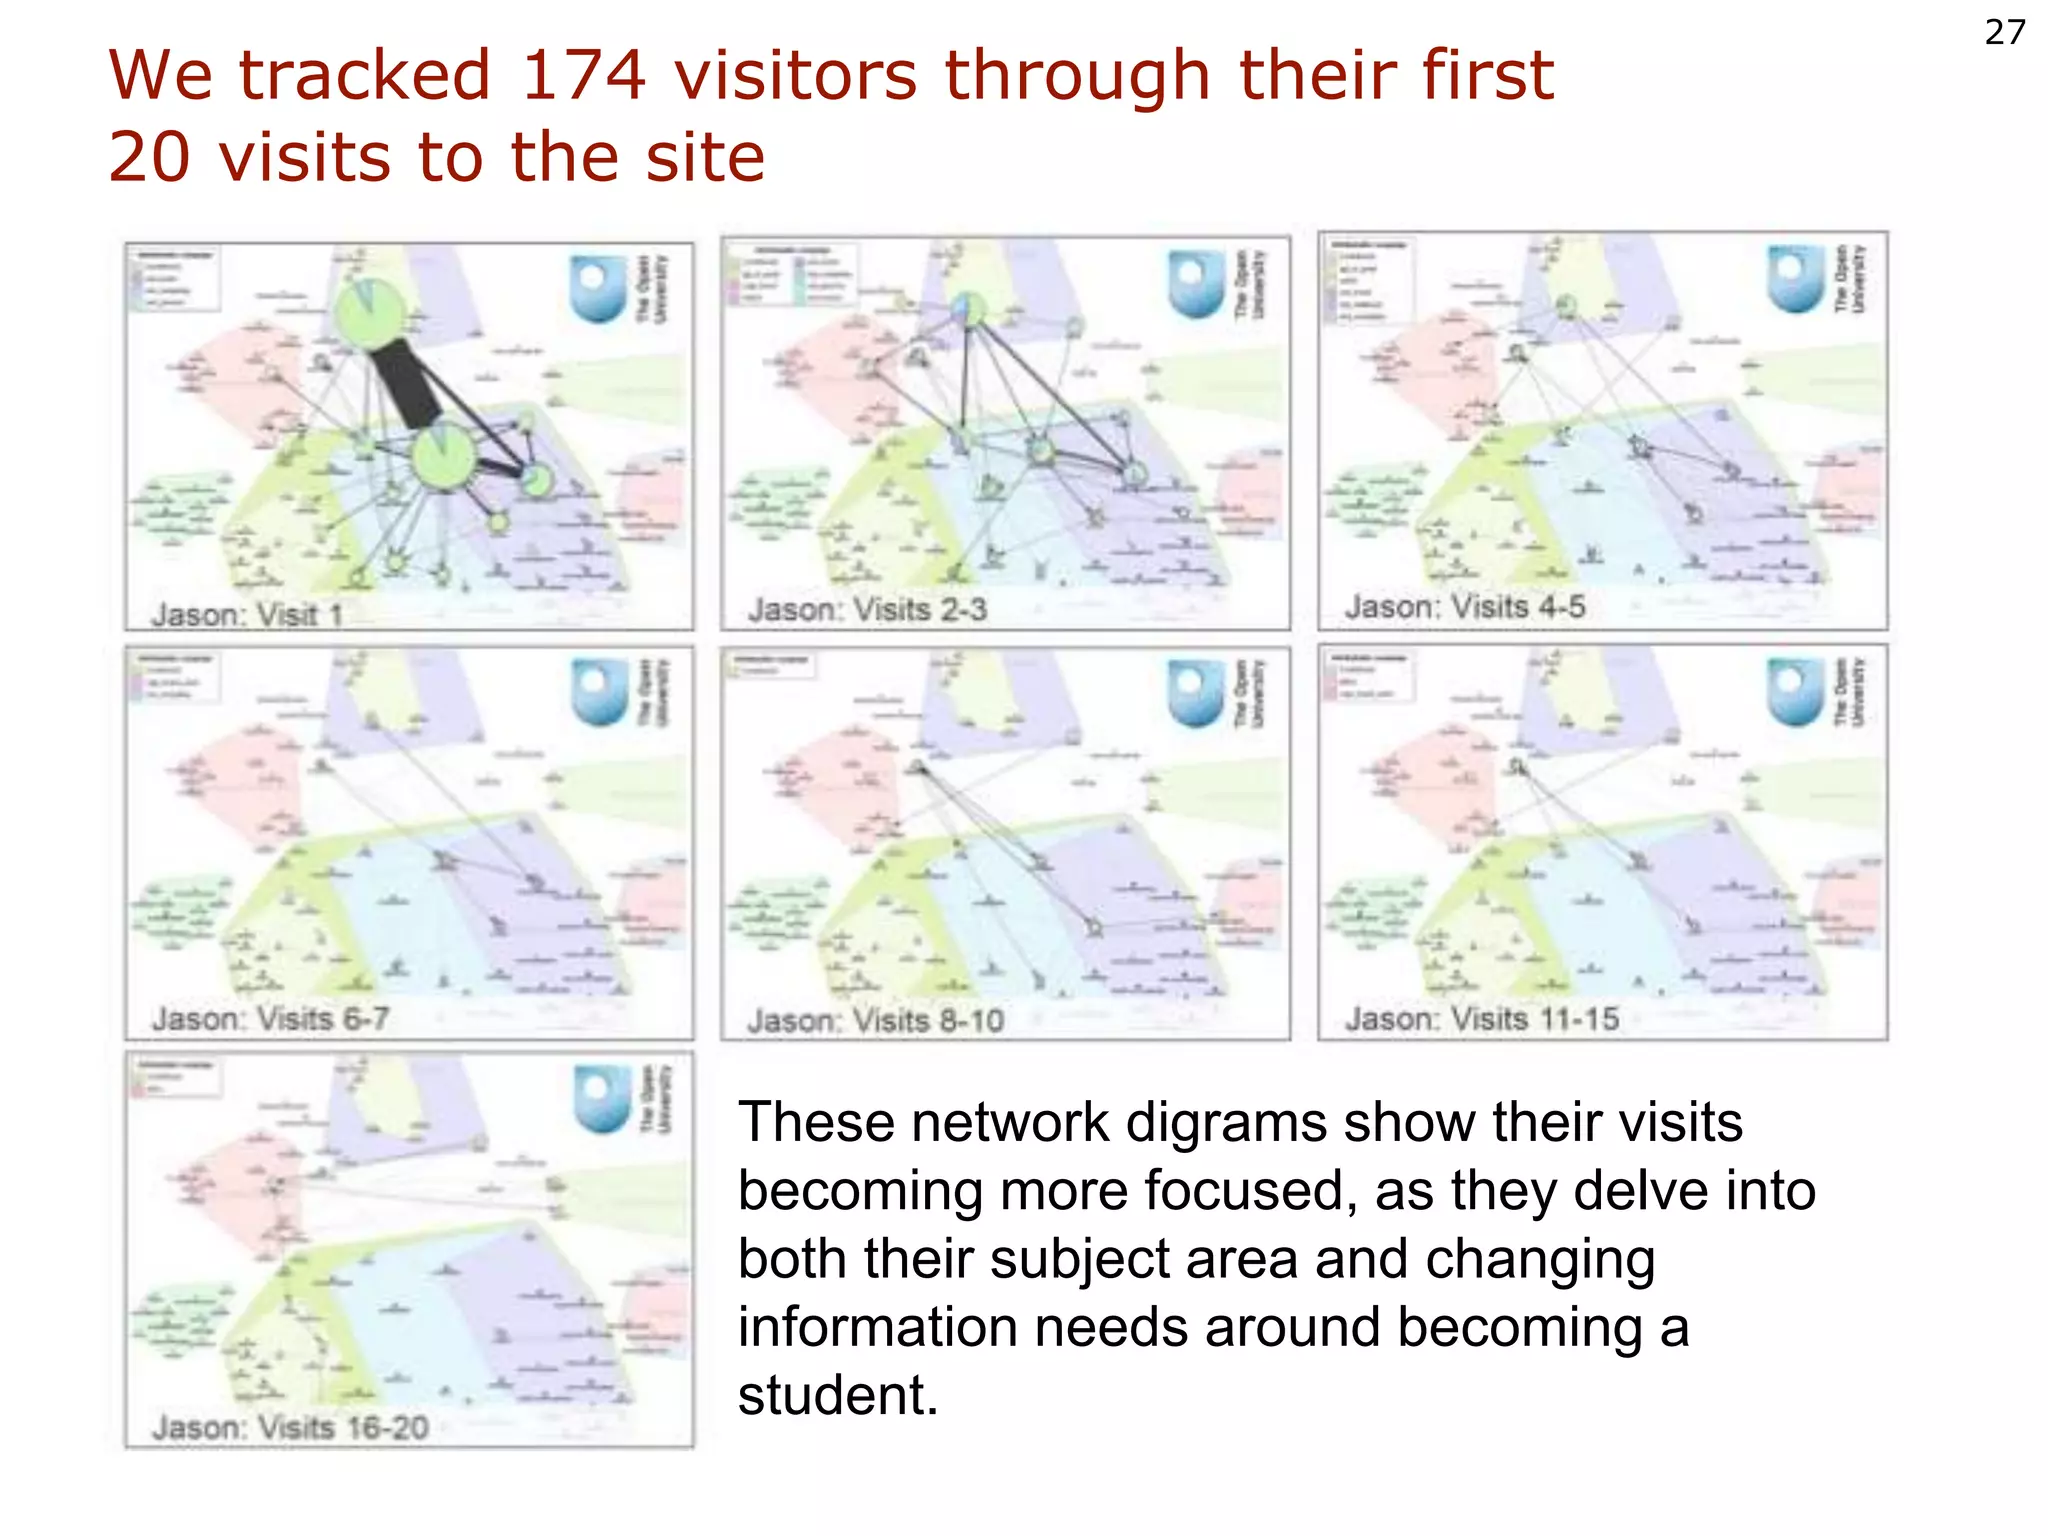
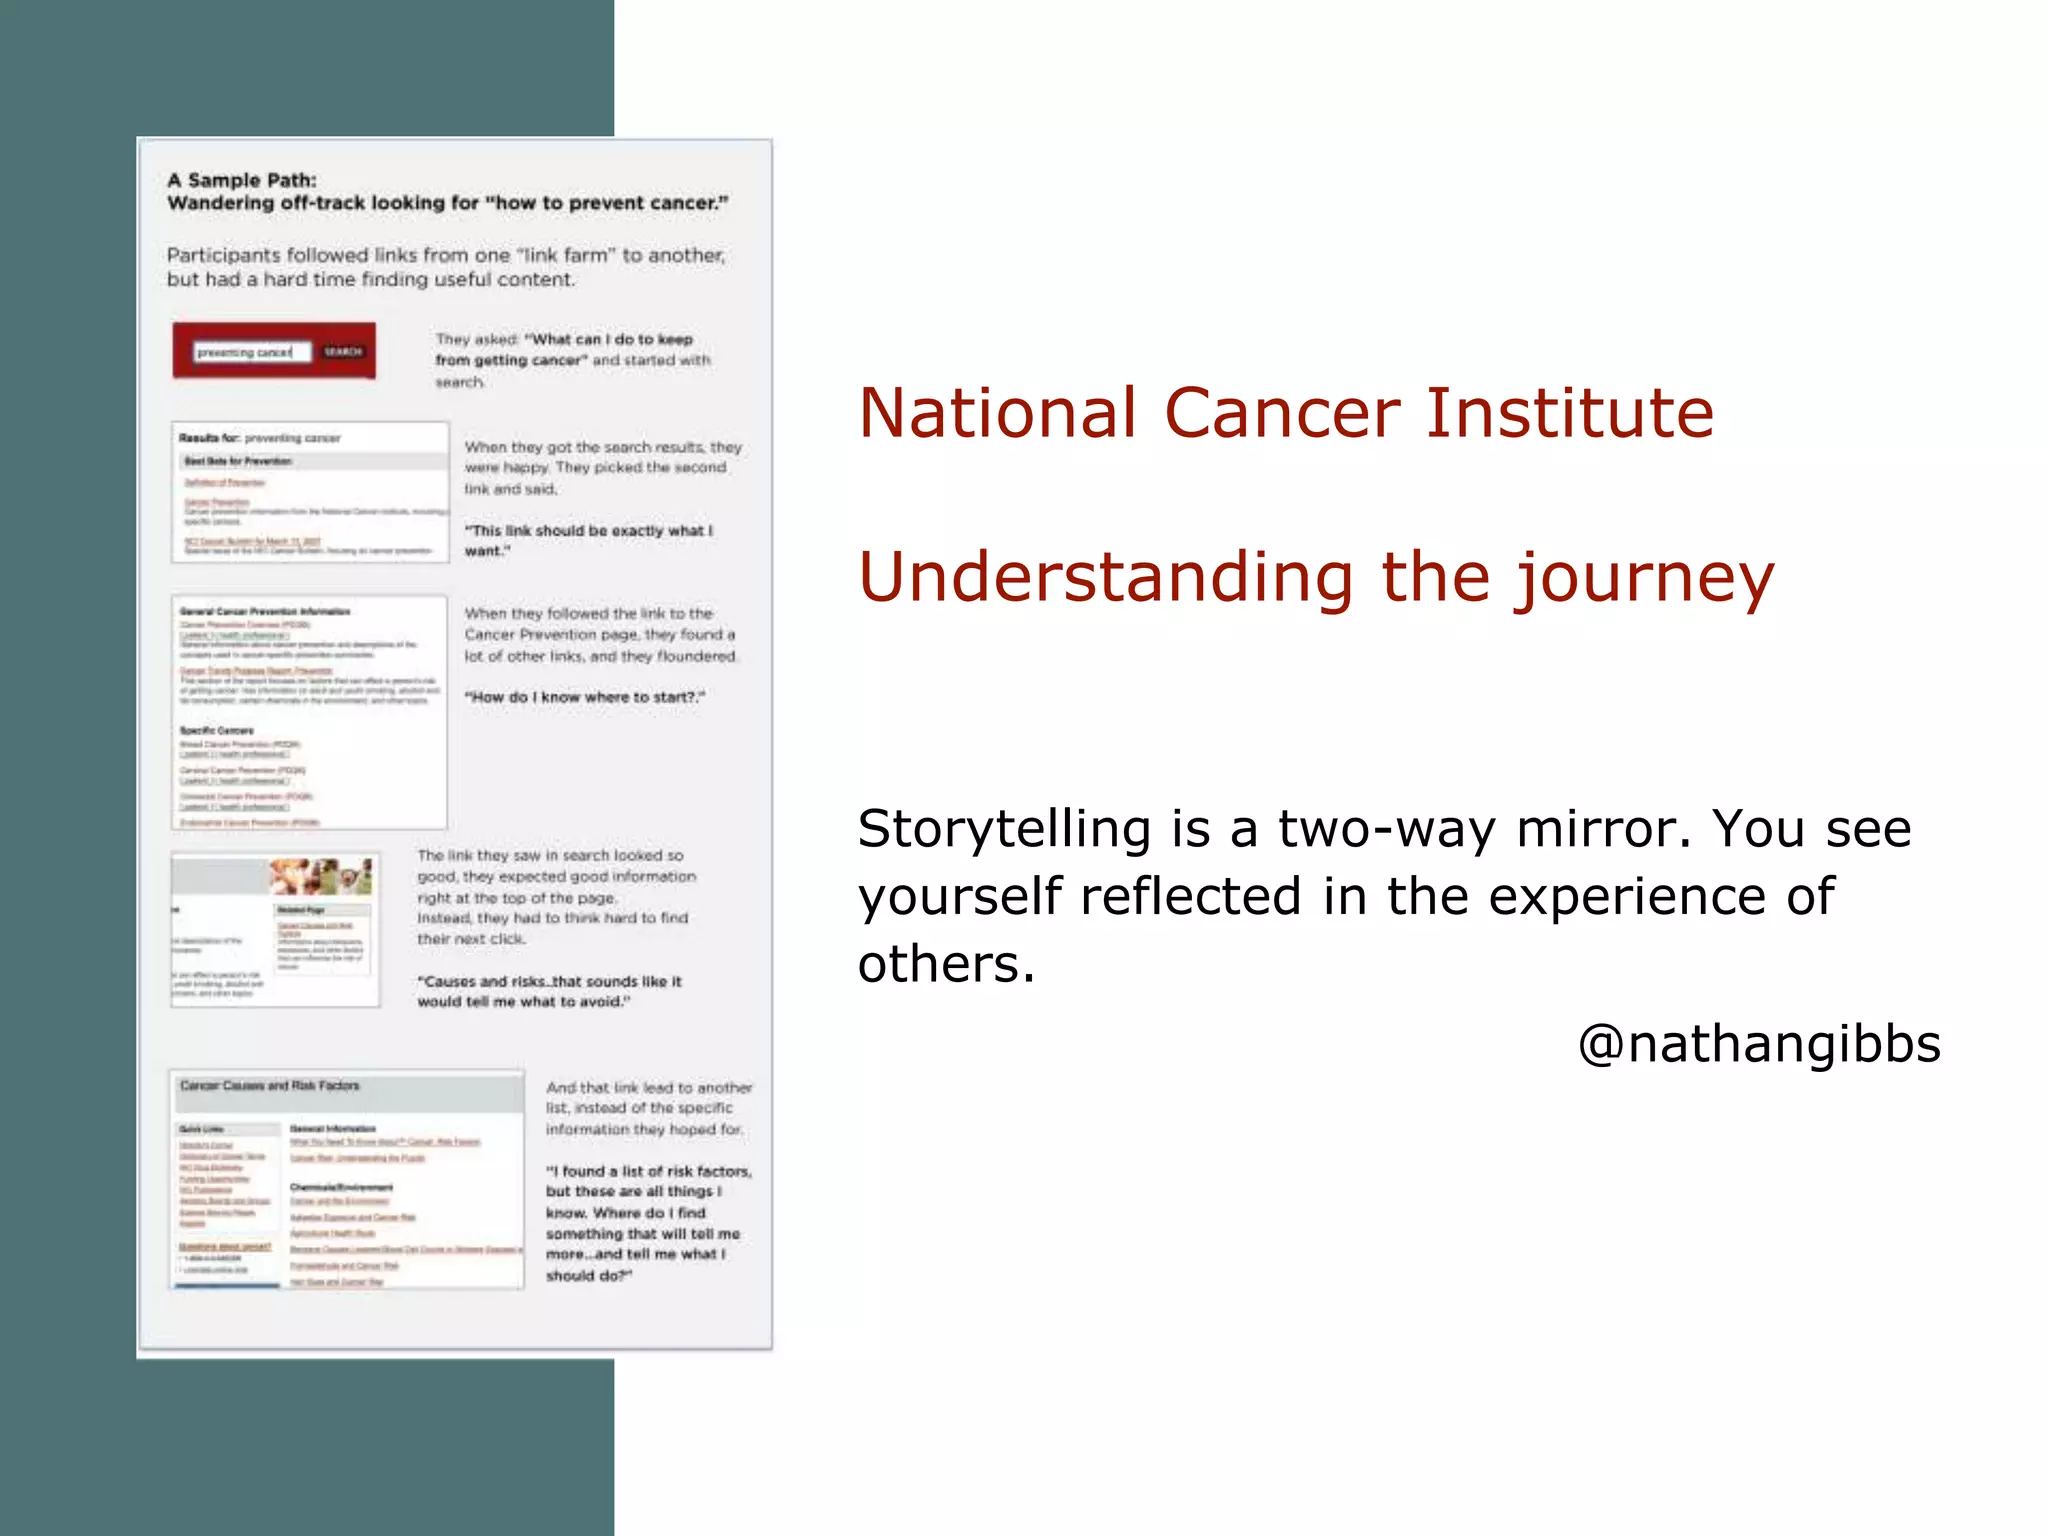
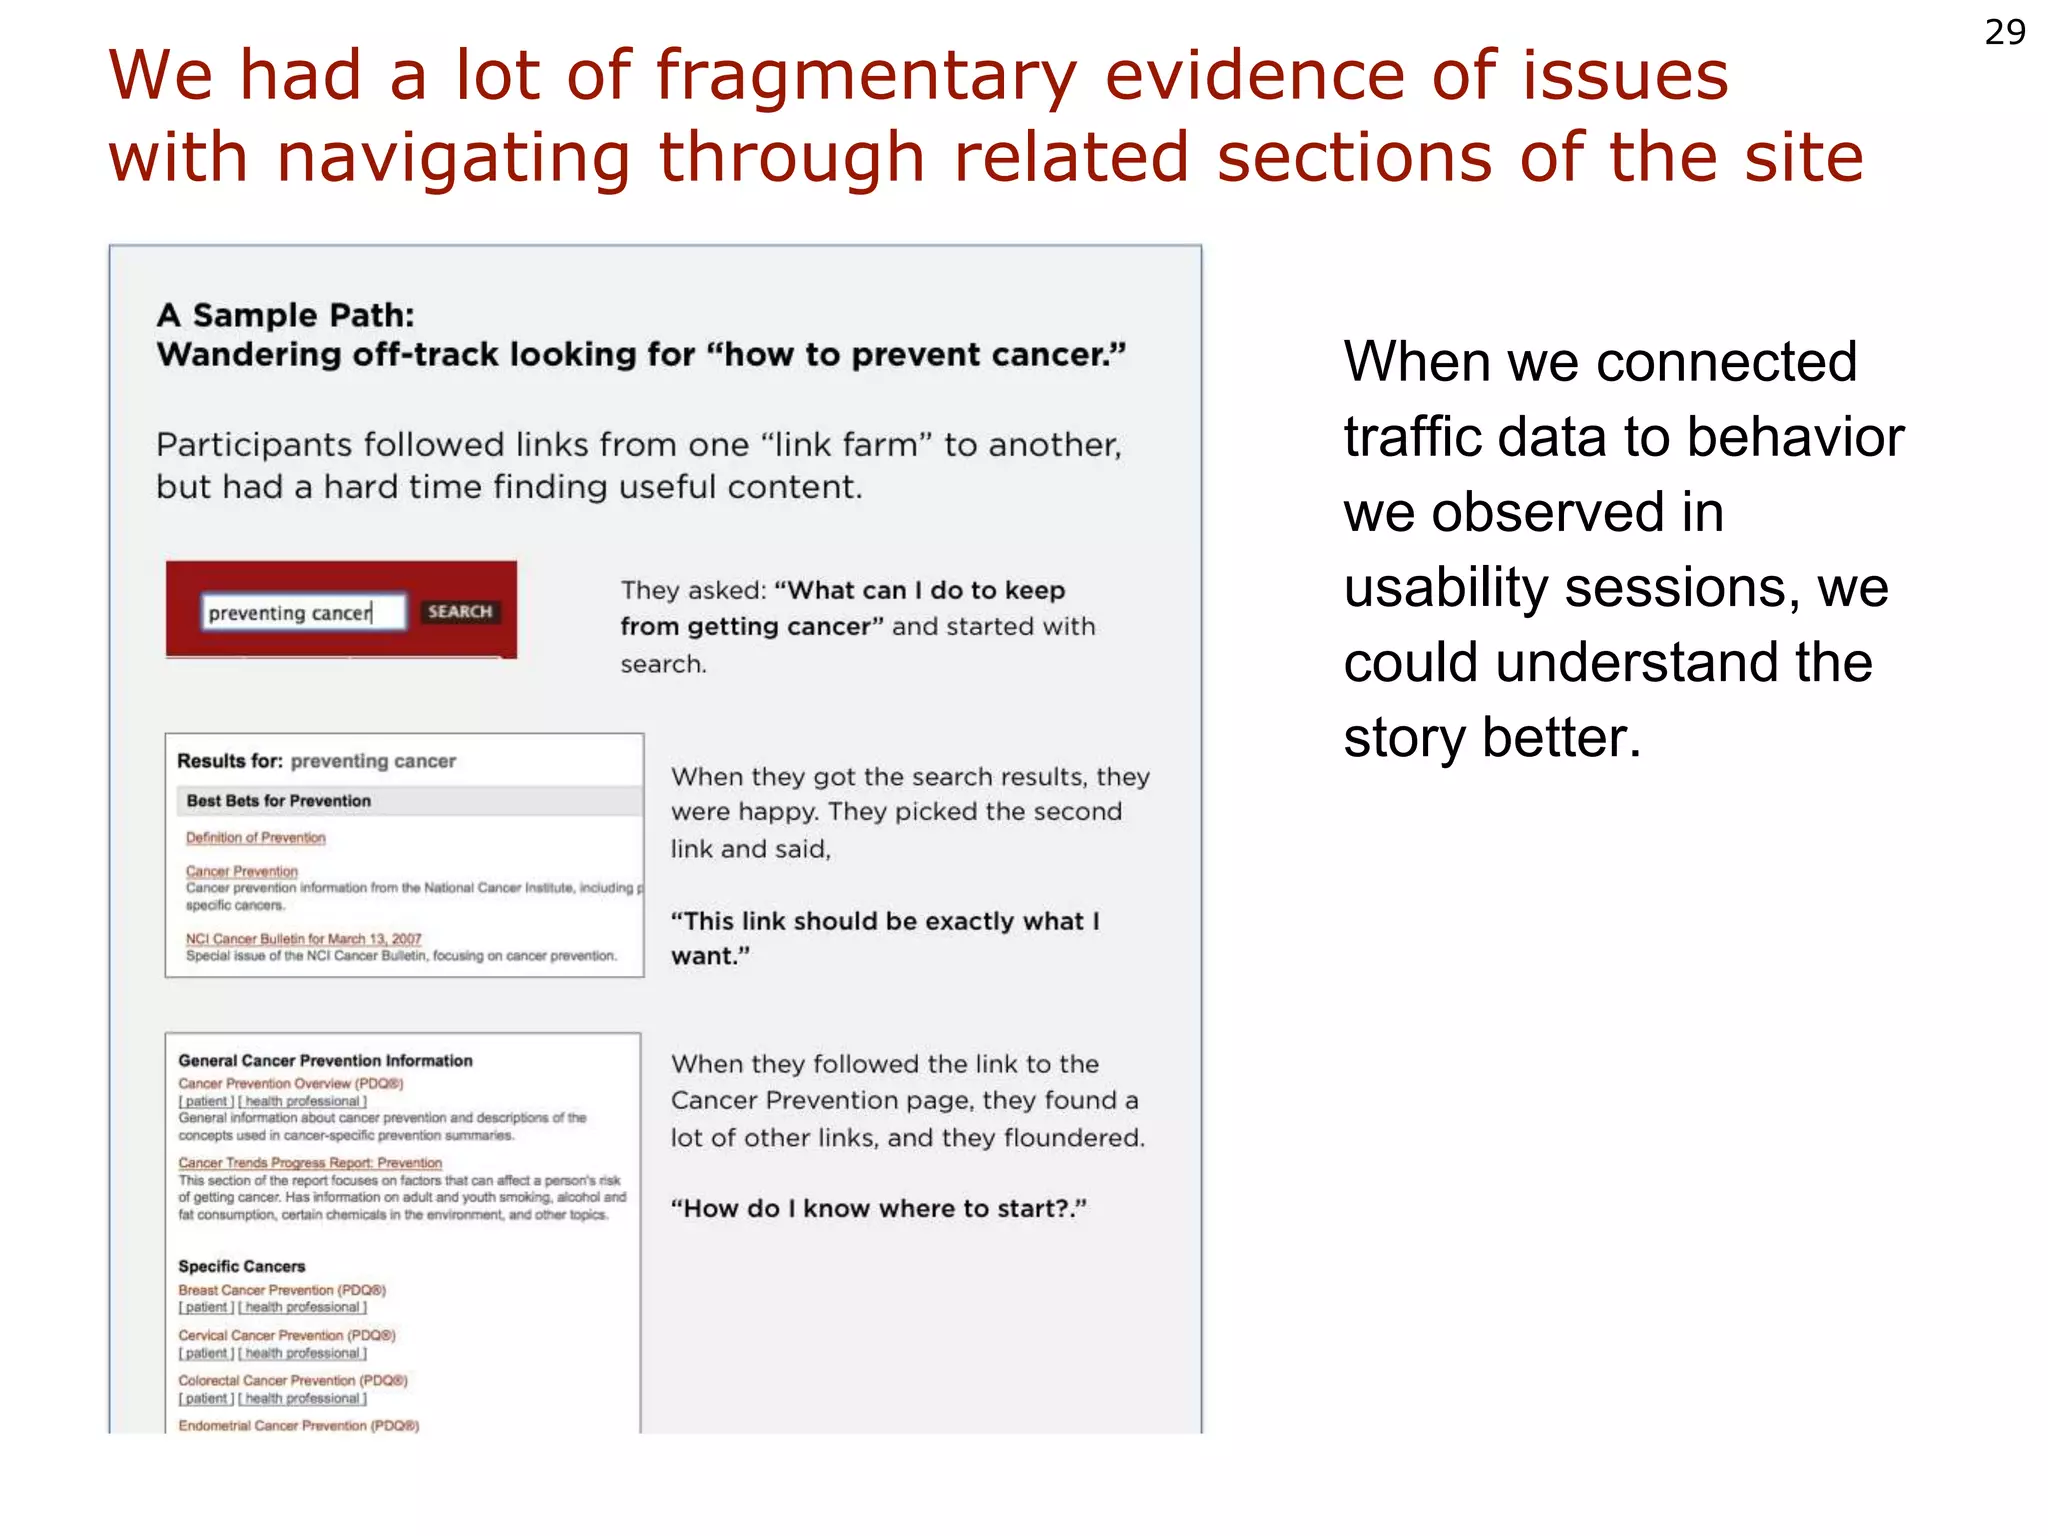
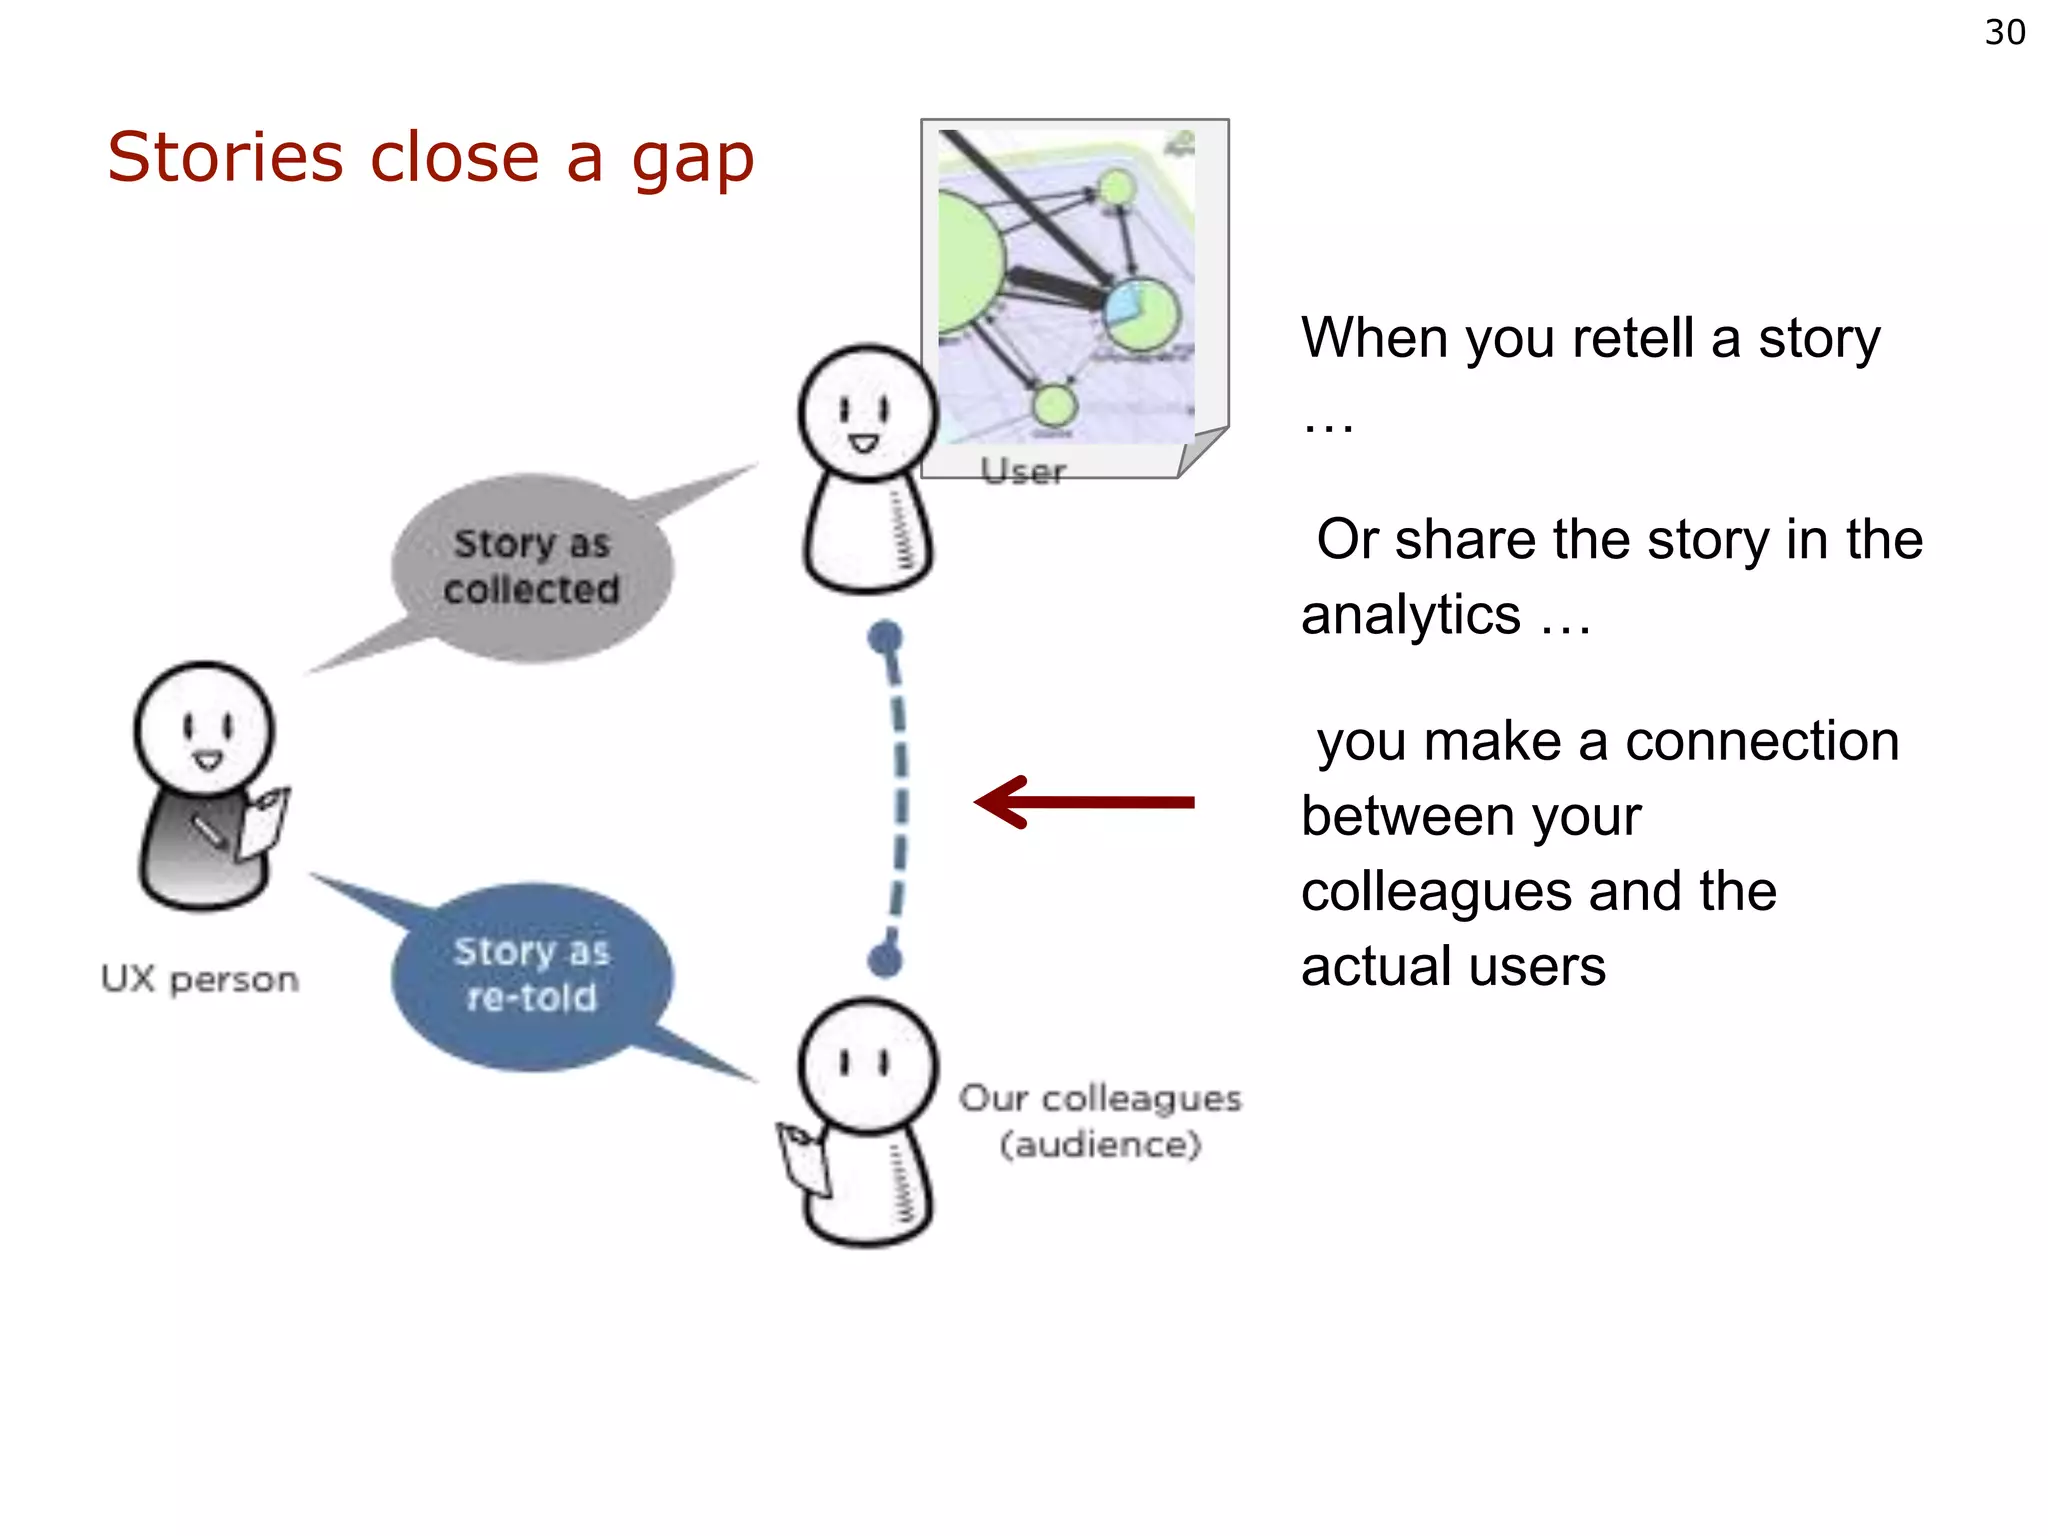
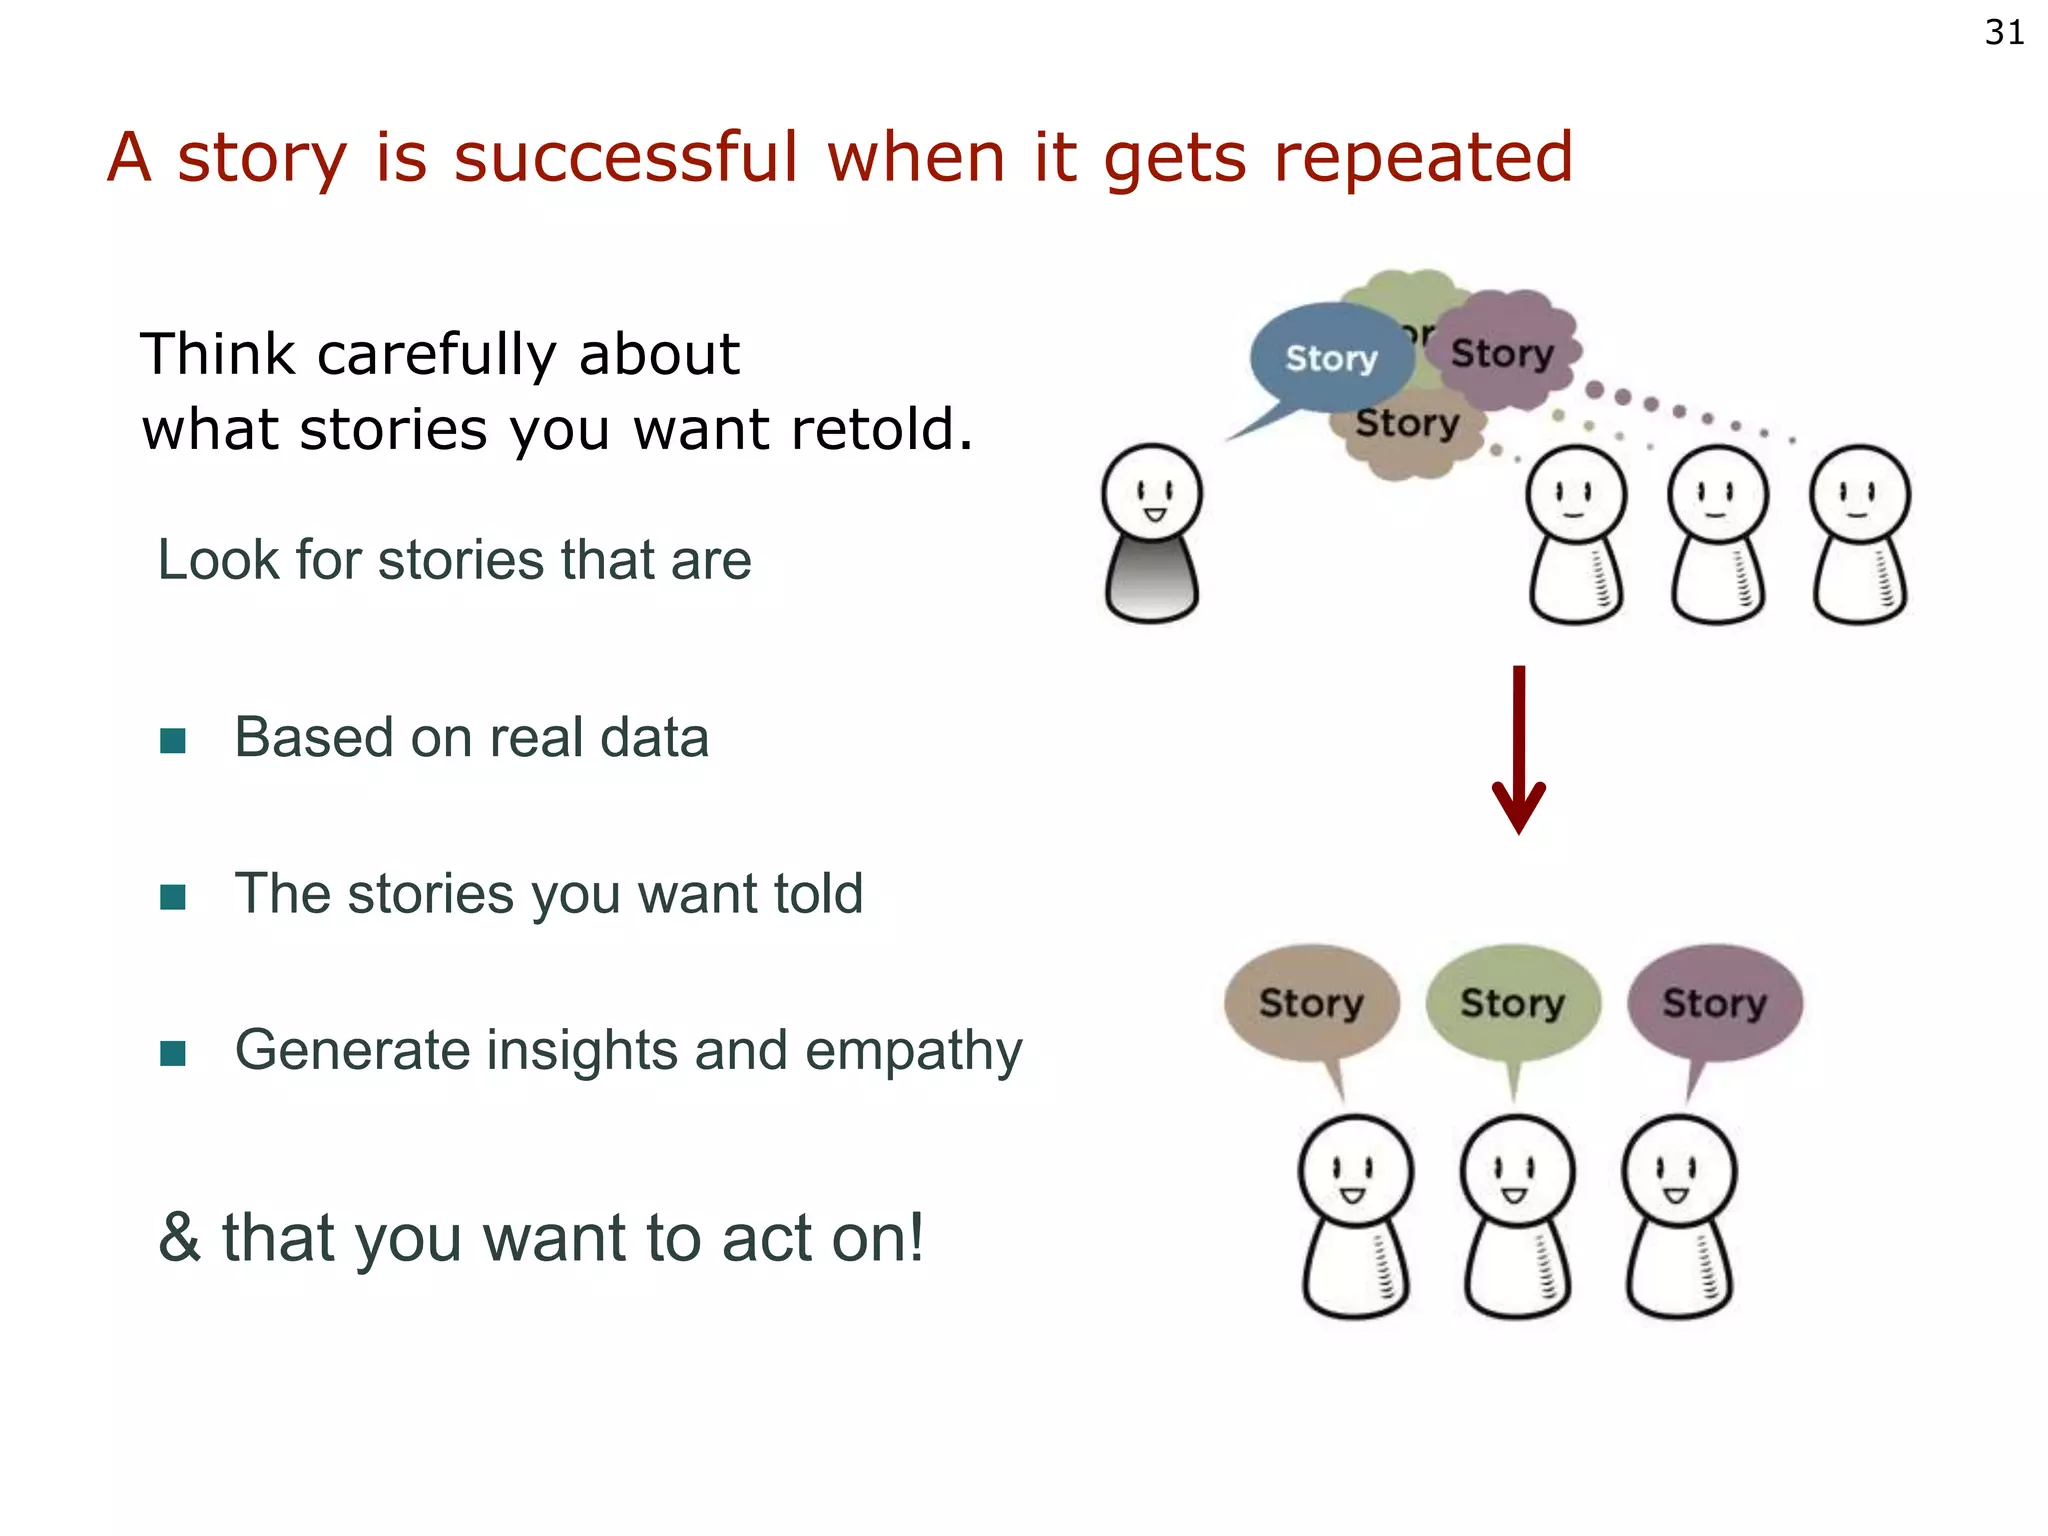
Breaking the Kubernetes Kill Chain: Host Path Mount
Finding the Story in the Data
1. Finding the story in the data NYC Web Analytics Meet-up December 8, 2010 at HUGE Whitney QuesenberyWQusability.com
2. Why are we talking about stories? Stories make UX personal. They remind us that everything we make is made for a real person. @ianeverdell
3. Even with good presentation, analytics reports areusually focused on data
4. Good visualization helps, but the real power is thestory behind the numbers What makes this video exciting is how the presenter tells the story. It’s not just numbers, but trends in history and human development, seen through the data visualization. http://www.youtube.com/watch?v=jbkSRLYSojo
5. Stories are embedded in the UX cycle in obvious and not-so-obvious ways User research: hearing what other people have to say Understand Analysis: finding patterns in shared stories Success? Specify Evaluate Evaluation:testing designs to see if they tell the story well Design: creating ideas that embody key stories Design
6. Stories are important for UX becausestandard “biz talk” doesn’t work Most of the time we try to construct a logical argument, as though just putting the facts in front of someone is the way to convince them. From Stephen Denning’s work on storytelling and leadership: www.stevedenning.com
7. Claude Shannon was wrong* Stories do not work like a broadcast transmission. They work because they create a vision that everyone can share At least about stories.
8. A story is shared by everyone who hears it First the storyteller shapes the story As they listen, the audience members form an image of the story in their own minds.
9. A story is shared by everyone who hears it The storyteller and the audience each affects the other and shapes the story they create. The most important relationship is between the audience and the story. The audience is a part of the story each time it is told.
11. A story is shared by everyone who hears it…but heard by each person in their own way The storyteller and the audience all shape the story In the end, each person in the audience has their own version of the story Part of the storyteller’s job is to help everyone hear the same story
12. The Open UniversitySeeing the story behind the search data Stories help us empathize and experience another person’s condition. Stories appeal to our emotions and drive us to action. @balchenn
13. We* wanted to understand the impact of search onthe student and enquirer experience About the OU First distance university 200,000+ students 10,000+ academic staff A large web presence 50 million pages viewed per month 2000+ websites Three intranets Staff intranet TutorHome StudentHome * “We” is the Online Services group at the OU, led by Ian Roddis
14. We are able to draw on rich user profiles – personas – based on both qualitative and quantitative dat George Margaret Martin Jason Rachel Abila
15. We* used search and traffic analysis to understandwhat visitors to the site looked for. The top searches are persistent (and have continued over time With some seasonal variations * “We” in this case, is Caroline Jarrett, who did the hard work of this analysis
16. The search logs shows a classic “long tail” Even small groups of terms show this pattern for example: searches with “classics”
17. We used search analytics to show how a new home page design could improve navigation failures Over two revisions, we completely eliminated searches to the core entry pages for the student virtual learning environment.
18. Changes in the home page accounted for the change in searches 2004 2005 We simplified the page and made the sign-in visible. But it took the actual sign-in box on the home page to make the difference. 2006
19. We also learned about touchpoints into the OU Why are there words from the kitchen down in the long tail of search terms entering a university web site? Not a lot, not consistent, but always there eggsonionscabbagevinegarpotatosalmon
20. The web site for the BBC shows doesn’t connect strongly to the course catalog on related subjects It’s not that the general links aren’t there. (They are in the upper left) But the links are only at the institutional level – not connecting related content.
21. Stories fill gaps Storytelling is how we make sense of the world: re-imagining our everyday lives as an experience to be shared with others. @otrops
22. Personas grow from data to profile details to a richstory that shows the people behind the data Aged 30-45Well educated45% married with children50% use the web 3-5 times a week65% use search engines Elizabeth, 32 years old Married to Joe, has a 5-year old son, Justin Attended State College, and manages her class alumni site Uses Google as her home page, and reads CNN online Used the web to find the name of a local official
23. Stories explain unexpected user data Use data to setup the storyMerge demographicand other statisticswith a humansitutation We were ready to be disappointed. Nurses were more interested in people than technology. They used the Web, of course, but didn’t see social media as work. Only a few of them had phones that did more than make phone calls. Some didn’t even have Web access except at home. So we were taken by surprise when one nurse after another got enthusiastic about some concept sketches for mobile health sites.
24. Stories explore situations and ideas Character The persona creates the perspective andrelationship Imagery Suggests theemotionalconnections Context Set up the problem Gina gave us the first clue. She was a nurse manager for the county health system. “I’m on the move all day and I have a huge case load. Patients are always throwing new questions at me. Yesterday, I really struggled to sort out a problem one patient was having with side effects. I speak a little Spanish, but just couldn’t remember the correct medical term to explain a new adjuvant the doctor wanted to try. It was so frustrating.” She pointed at the sketch. “I don’t have a phone that will do all that - yet, but if it’s really that simple…”
25. The Open UniversitySeeing Jason’s story in the data Every interaction is a story, with the user as the "star." This appeals to our human need to be at the center of every experience. @dgelman
26. We* have now started to use the personas as alens into the data * by “we” I mean Viki Stirling and Sarah Allen who actually did this work
27. We tracked 174 visitors through their first 20 visits to the site These network digrams show their visits becoming more focused, as they delve into both their subject area and changing information needs around becoming a student.
28. National Cancer InstituteUnderstanding the journey Storytelling is a two-way mirror. You see yourself reflected in the experience of others. @nathangibbs
29. We had a lot of fragmentary evidence of issues with navigating through related sections of the site When we connected traffic data to behavior we observed in usability sessions, we could understand the story better.
30. Stories close a gap When you retell a story … Or share the story in the analytics … you make a connection between your colleagues and the actual users
31. A story is successful when it gets repeated Think carefully about what stories you want retold. Look for stories that are Based on real data The stories you want told Generate insights and empathy & that you want to act on!
32. Want more details? About search research at the OUwww.wqusability.com/publications.html#search About creating healthcare personaswww.wqusability.com/publications.html#healthcare Presentations about storytelling and UCXwww.slideshare.net/StorytellingUX Book site:www.rosenfeldmedia.com/books/storytelling/
33. Storytelling for User Experience:Crafting stories for better design Whitney Quesenbery & Kevin Brookswhitneyq@wqusability.combrooks@media.mit.edu Blog and book sitewww.rosenfeldmedia.com/books/storytelling/ Ilustrations by Calvin C. Chan available at www.flickr.com/photos/rosenfeldmedia/
34. Whitney Quesenbery www.WQusability.comwhitneyq@WQusability.comTwitter @whitneyq Whitney is user researcher, user experience and usability expert with a passion for clear communication. She enjoys learning about people around the world and using those insights to design products where people matter. She works with the National Cancer Institute, IEEE, The Open University and other companies to improve the user experience on their websites. Whitney is past-president of Usability Professionals’ Association (UPA) and is a Fellow of the Society for Technical Communication (STC). She has served on two Federal Advisory committees: TEITAC, recommending updates to Section 508, and as chair for Human Factors and Privacy for voting system guidelines.
Editor's Notes
There are plenty of techniques in each of these parts of the cycle that may not seem like “story” but they really are:obvious: user research = collecting stoiresobvious: design scenarios, wireframes, storyboardsnot so obvious: analysis (isn’t that about data)not so obvious: usability testing (isn’t that about metrics)not so obvious: log analysis and analytics (isn’t that the diametric opposite of story)
This was a technical story, but it was also understanding behavior. The data: searches for easy to navigate pages, even when there is a sign-in button right on the home pageIT thought: students have all their sites bookmarked and go to them directlyWe learned: their lives are more complicated, and they want a single point of entry. That they are looking for the words “StudentHome”We also used this in our personas
The story here is abou the connection between the OU and the BBCIt’s about the way people get engaged in educationAnd it also turned to be about the fact that there was virtually no connection between the interests of people watching the BBC and the courses the OU teaches.For example: SK183 – Understanding Human NutritionOr a very popular show called Coast that connects directly to some of the OU science courses.We could make this point directly, but we could also begin to look backwards from our user research to see how many people had their first contact with actually studying at the OU from the BBC
This is the beginning of a story…Sets up the situation by placing it in the demographicsAlso explains why we’re going to say something unexpected.
Research report on mobile applications.Picks up from the last story. Show the research context as well: I’m about to say something new .. this was an example.Then, we could talk about how many other people said similar things, what we think it means,which they liked best, etc. The last paragraph is the point: If we can keep it simple enough, they might use it.We had another story from the same research – another nurse was trying to decide what phone to buy, wanted to make sure it ran a specific application she’d found – one she found valuable. Turned the tables on us to ask our advice “because we must know about this stuff”Not contradiction: still not early adopters or comfortable, but knows a good tools when they see one
We used Jason characteristics as a filter:First visit between 01/01/10 and 31/03/10• First visit Attributable Type is Search• Referring search term contains ‘computing degree’• Exclude records with Staff ID, Tutor IDSample size 174 unique individualsMost likely to ‘click’ natural search result - 92%BSc (Hons) Computing (B29) is most likely to be the firstpage viewed – 60%If Computing and ICT or Computing subject pages are viewed then a qualification description is also likely to be viewed - 75%
It was just too easy to discount any one channel of information. It was triangulating between these that helped.
Or… between data and a story
A story is a way of circulating a meme.Your goal is to have it repeated, and retold around the company.So, you have to be careful about the stories you repeatYou have to be able to back them upYou have to know what stories you want to have toldStory about eyetracking hopping over the tile.