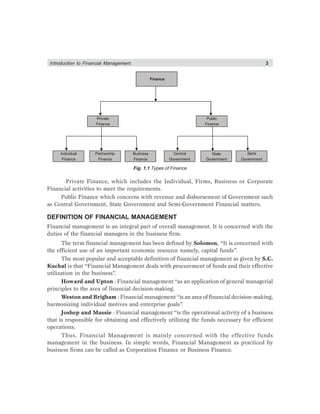
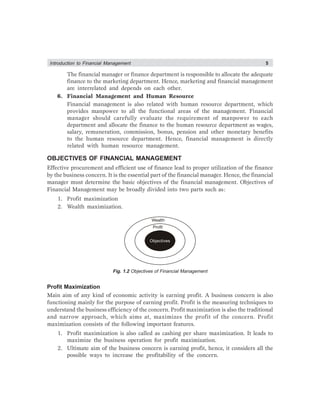
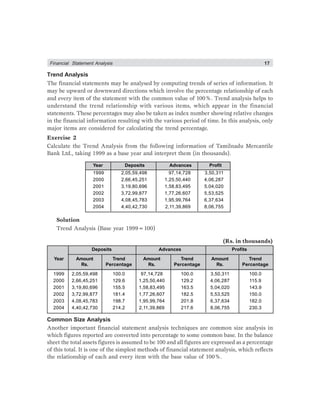
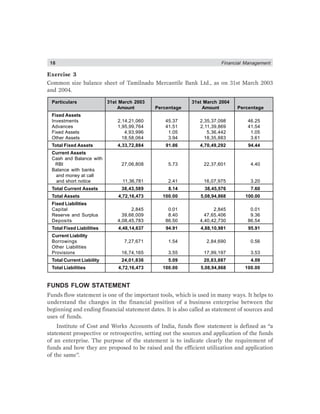
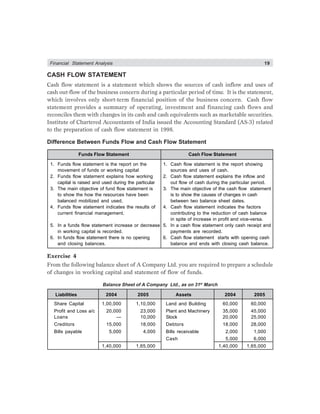
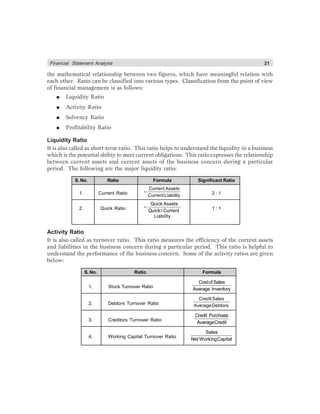
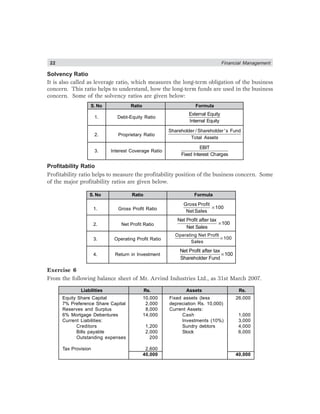
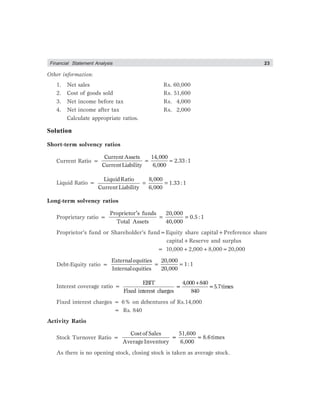
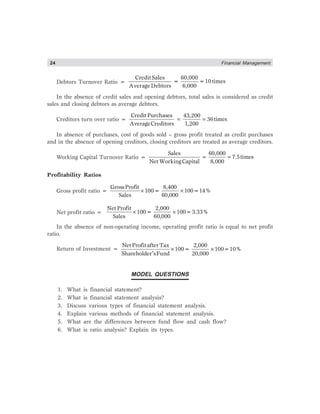
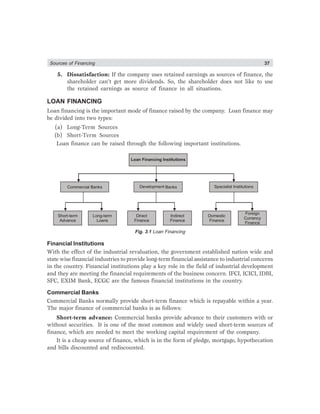
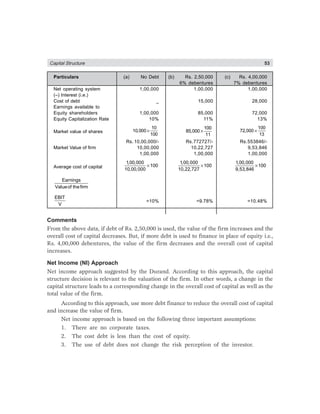
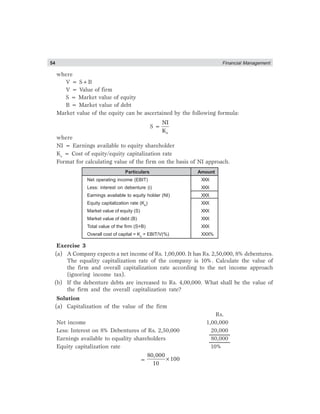
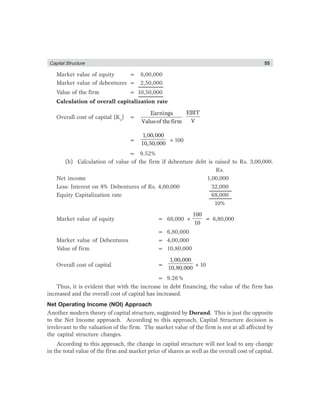
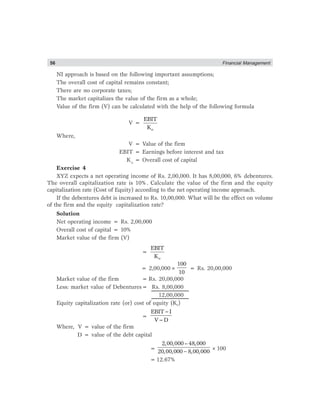
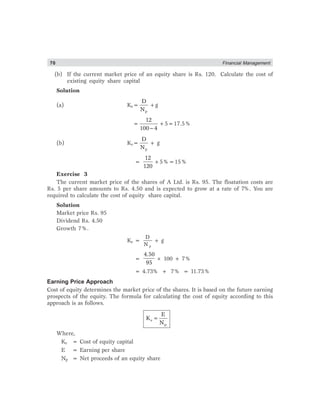
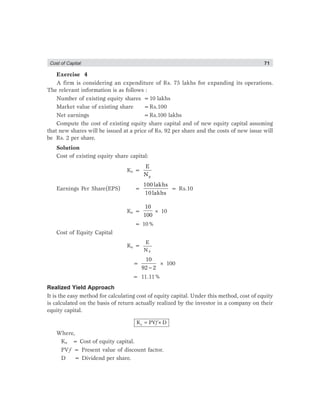
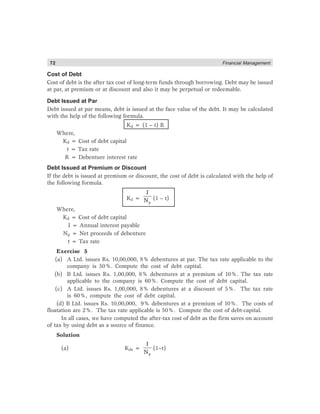
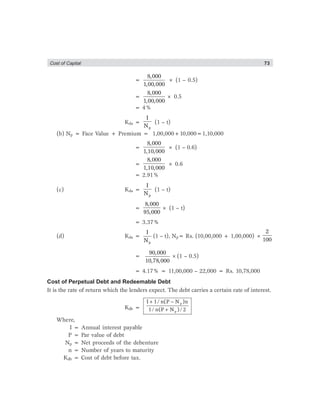
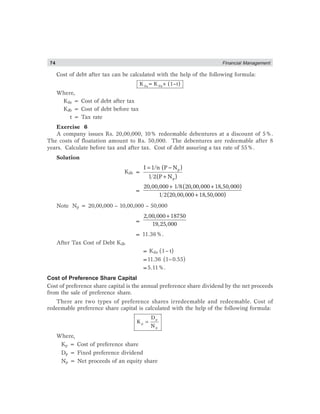
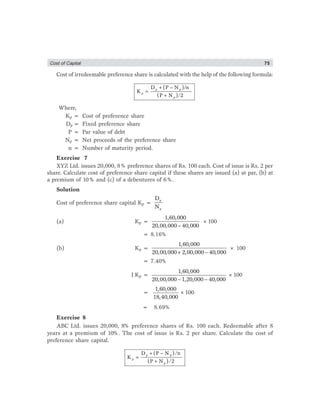
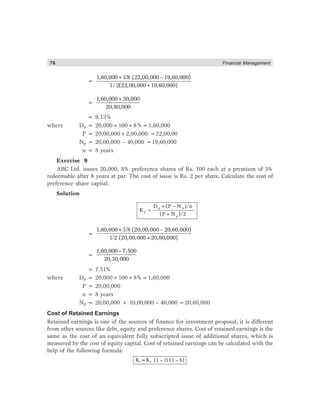
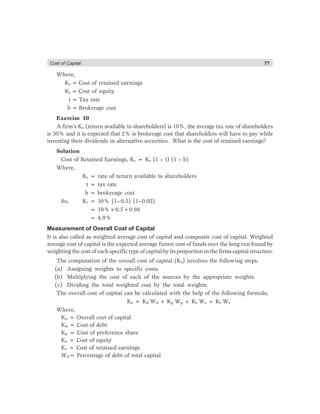
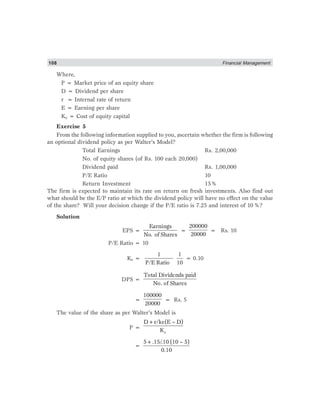
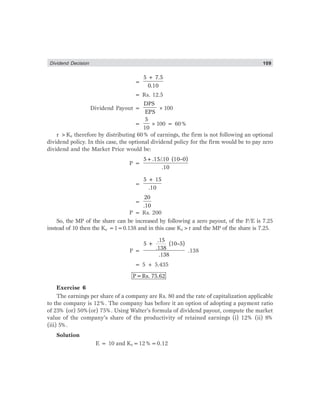
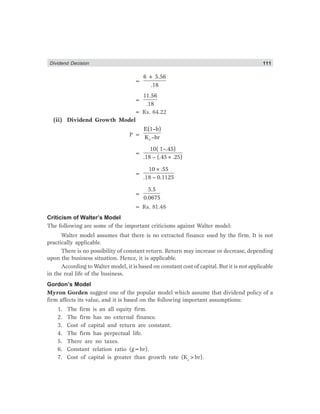
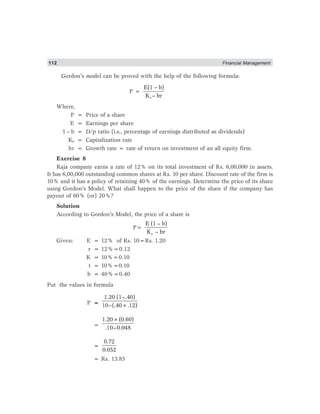
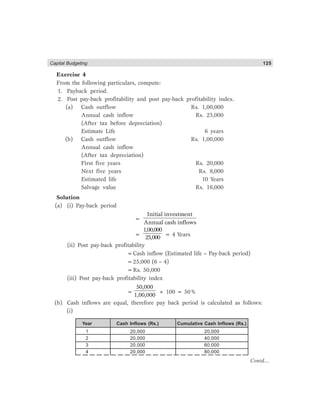
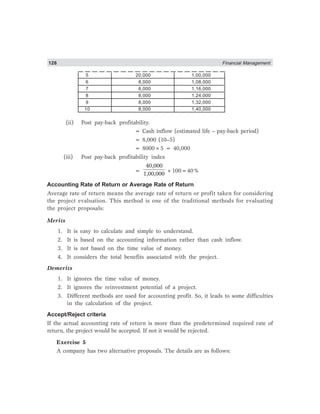
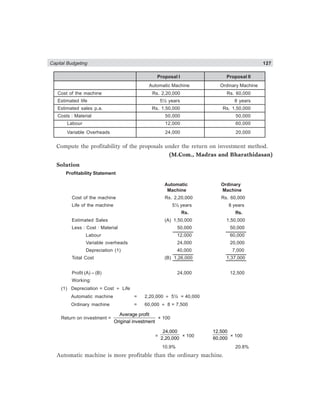
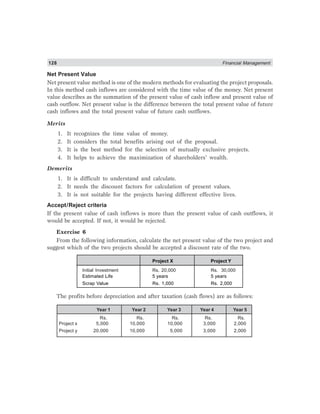
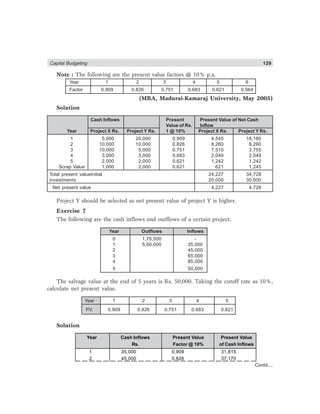
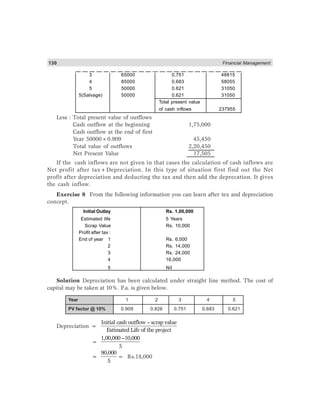
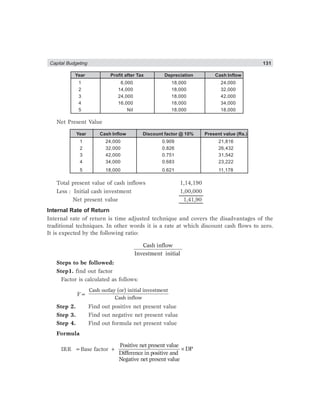
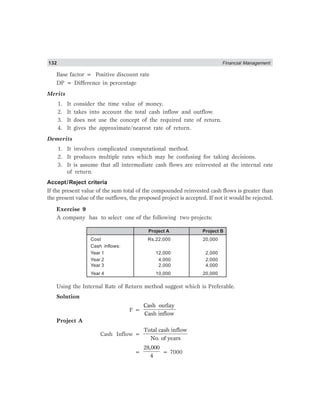
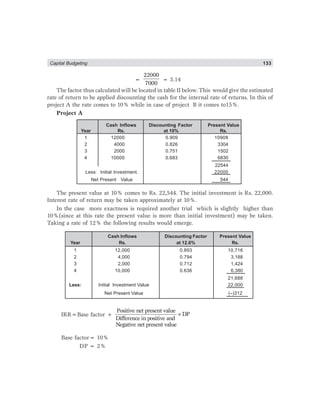
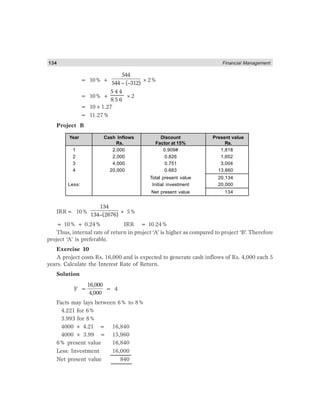
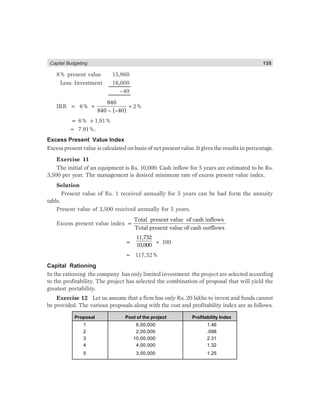
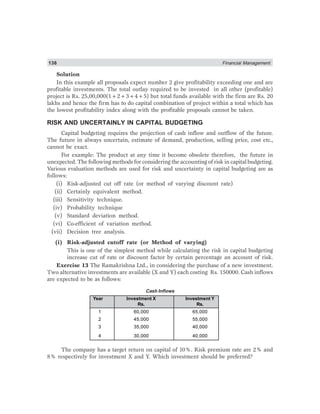
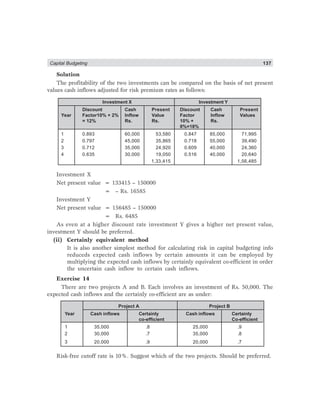
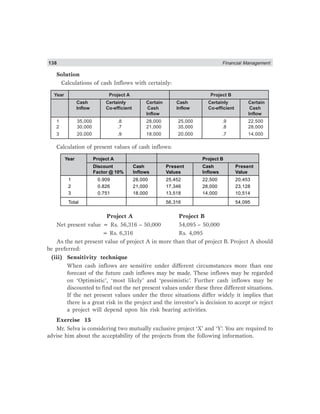
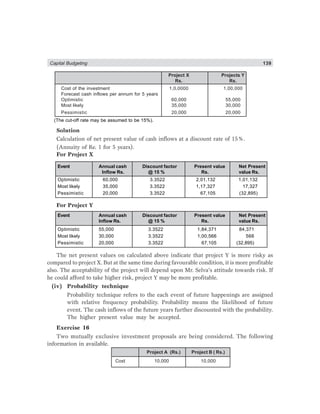
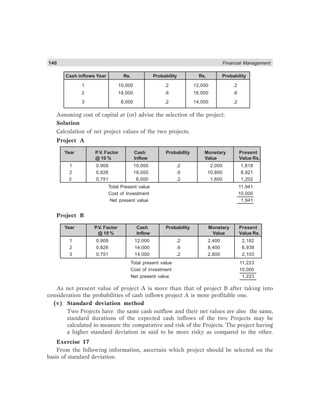
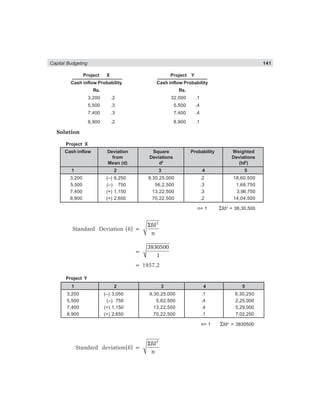
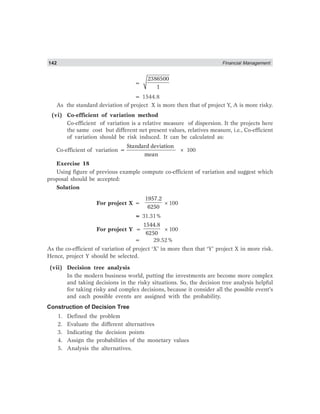
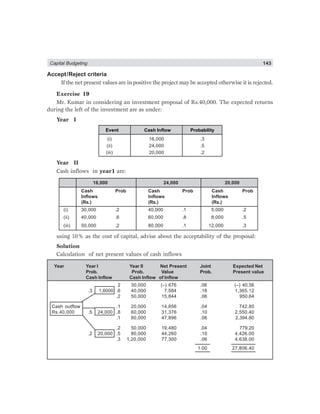
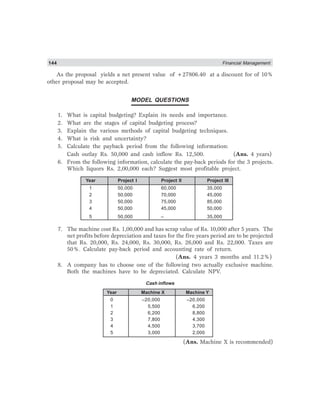
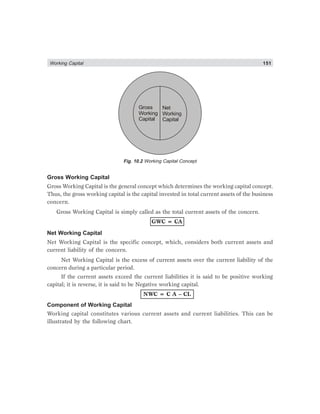
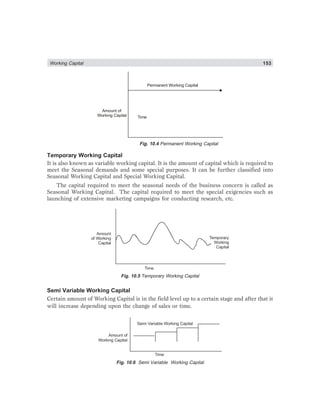
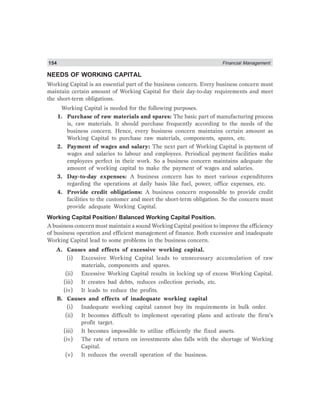
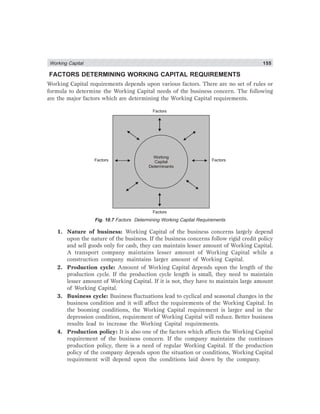
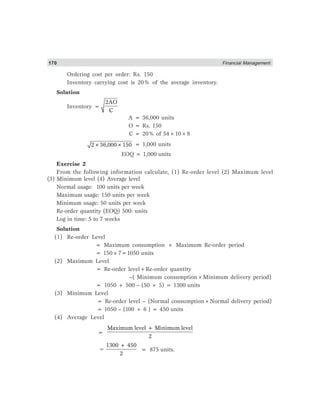
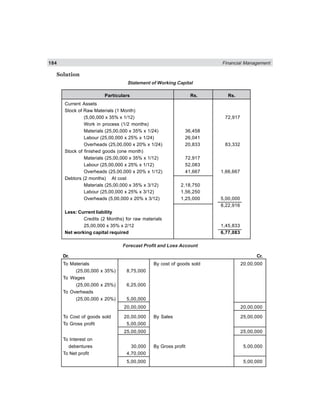
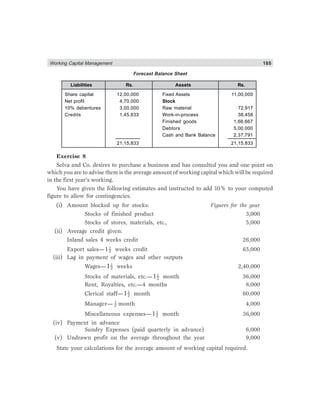
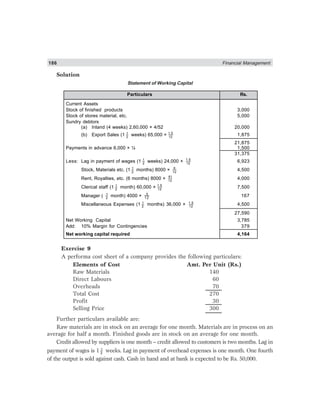
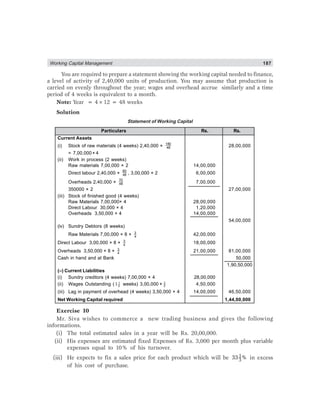
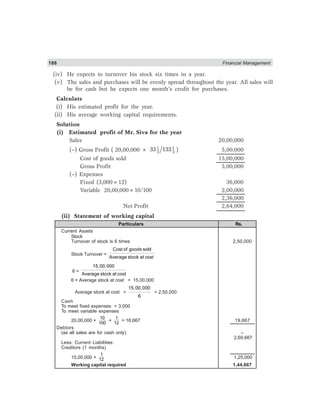
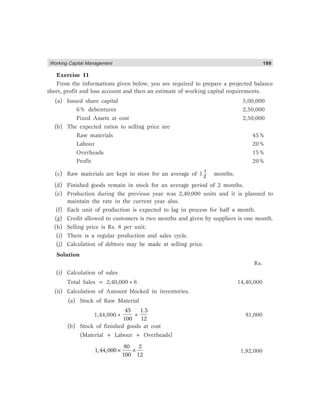
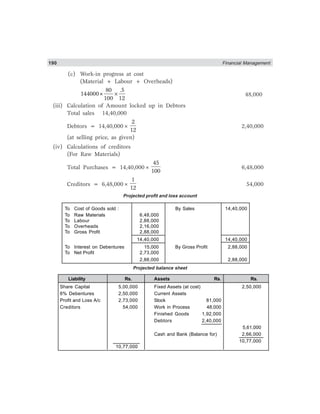
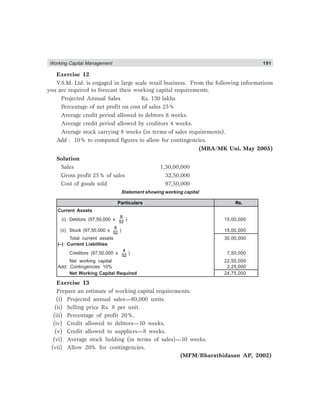
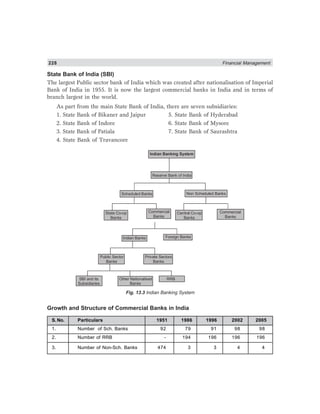
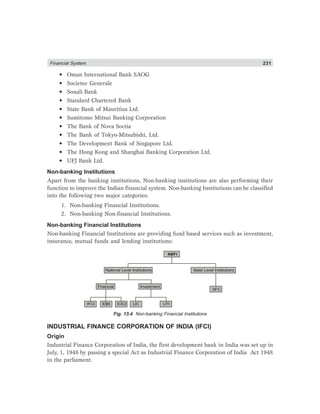
Financial Management is an essential part of the economic and non economic activities
which leads to decide the efficient procurement and utilization of finance with profitable
manner. In the olden days the subject Financial Management was a part of accountancy
with the traditional approaches. Now a days it has been enlarged with innovative and
multi dimensional functions in the field of business with the effect of industrialization,
Financial Management has become a vital part of the business concern and they are
concentrating more in the field of Financial Management. Financial Management also
developed as corporate finance, business finance, financial economics, financial mathematics
and financial engineering. Understanding the basic concept about the financial management
becomes an essential part for the students of economics, commerce and management.
This book provides detailed information about the finance and finance related area
with simple language and the concepts are explained with easy examples. This book is also
prepared based on the B.Com., B.B.A., B.B.M., M.Com., and M.B.A. syllabus of various
universities for the benefits of the students.
AUTHORS
Preface
Preface (v)
CHAPTER - 1 INTRODUCTION TO FINANCIAL MANAGEMENT 1–10
Introduction 1
Meaning of Finance 1
Definition of Finance 1
Definition of Business Finance 2
Types of Finance 2
Definition of Financial Management 3
Scope of Financial Management 4
Objectives of Financial Management 5
• Profit maximization 5
• Favourable arguments for profit maximization 6
• Unfavorable arguments for profit maximization 6
• Drawbacks of profit maximization 6
• Wealth maximization 6
• Favourable arguments for wealth maximization 7
• Unfavourable arguments for wealth maximization 7
Approaches to Financial Management 7
• Traditional approach 8
Functions of Finance Manager 8
Importance of Financial Management 9
• Financial planning 9
• Acquisition of funds 9
• Proper use of funds 10
• Financial decision 10
• Improve profitability 10
Contents
Contents
• Increase the value of the firm 10
• Promoting savings 10
Model Questions 10
CHAPTER - 2 FINANCIAL STATEMENT ANALYSIS 11–24
Introduction 11
Meaning and Definition 11
• Income statement 12
• Position statement 12
• Statement of changes in owners equity 12
• Statement of changes in financial position 12
Types of Financial Statement Analysis 13
Techniques of Financial StatementAnalysis 14
• Comparative statement analysis 15
• Comparative balance-sheet analysis 15
• Comparative profit and loss account analysis 16
• Trend analysis 17
• Common size analysis 17
Funds Flow Statement 18
Cash Flow Statement 19
• Difference between funds flow and cash flow statement 19
Ratio Analysis 20
• Liquidity ratio 21
• Activity ratio 21
• Solvency ratio 22
• Profitability ratio 22
Model Questions 24
CHAPTER - 3 SOURCES OF FINANCING 25–39
Introduction 25
• Long-term financial requirements or Fixed capital requirement 25
• Short-term financial requirements or Working capital requirement 25
Sources of Finance 26
Security Finance 28
• Characters of security finance 28
• Types of security finance 28
• Ownership securities 28
Equity Shares 28
• Features of equity shares 28
• Advantages of equity shares 29
• Disadvantages of equity shares 30
Preference Shares 30
• Irredeemable preference shares 31
Contents
• Participating preference shares 31
• Non-participating preference shares 31
• Convertible preference shares 31
• Non-convertible preference shares 31
• Features of preference shares 31
• Advantages of preference shares 31
• Disadvantages of preference shares 32
Deferred Shares 32
No Par Shares 32
Creditorship securities 33
• Debentures 33
• Types of debentures 33
• Features of debentures 34
• Advantages of debenture 34
• Disadvantages of debenture 34
Internal Finance 35
• Depreciation funds 35
• Retained earnings 35
• Advantages of retained earnings 36
• Disadvantages of retained earnings 36
Loan Financing 37
• Financial institutions 37
• Commercial banks 37
• Short-term loans 38
• Development banks 38
Model Questions 38
CHAPTER - 4 CAPITALIZATION 41–45
Introduction 41
Meaning of Capital 41
• Fixed capital 41
• Definition of fixed capital 41
• Character of fixed capital 42
• Working capital 42
Capitalization 42
• Meaning of capitalization 42
• Definition of capitalization 43
Types of Capitalization 43
• Over capitalization 43
• Causes of over capitalization 43
• Effects of over capitalization 44
• Remedies for over capitalization 44
• Under capitalization 44
• Causes of under capitalization 44
Contents
• Effects of under capitalization 45
• Remedies of under capitalization 45
• Watered capitalization 45
• Causes of watered capital 45
CHAPTER - 5 CAPITAL STRUCTURE 47–64
Introduction 47
• Meaning of capital structure 47
• Definition of capital structure 47
Financial Structure 48
Optimum Capital Structure 49
• Objectives of capital structure 49
• Forms of capital structure 49
Factors Determining Capital Structure 50
• Leverage 50
• Cost of capital 50
Capital Structure Theories 50
• Traditional approach 51
• Assumptions 51
• Comments 53
• Net Income (NI) approach 53
• Net Operating Income (NOI) approach 55
• Modigliani and Miller approach 58
Model Questions 64
CHAPTER - 6 COST OF CAPITAL 65–82
Introduction 65
• Meaning of cost of capital 65
• Definitions 65
• Assumption of cost of capital 66
Classification of Cost of Capital 66
• Explicit and implicit cost 66
• Average and marginal cost 67
• Historical and future cost 67
• Specific and combine cost 67
Importance of Cost of Capital 67
• Importance to capital budgeting decision 67
• Importance to structure decision 67
• Importance to evolution of financial performance 68
• Importance to other financial decisions 68
Computation of Cost of Capital 68
• Measurement of cost of capital 68
• Cost of equity 68
Contents
• Dividend price approach 68
• Dividend price plus growth approach 69
• Earning price approach 70
• Realized yield approach 71
• Cost of debt 72
• Debt issued at par 72
• Debt issued at premium or discount 72
• Cost of perpetual debt and redeemable debt 73
• Cost of preference share capital 74
• Cost of retained earnings 76
• Measurement of overall cost of capital 77
Model Questions 80
CHAPTER - 7 LEVERAGE 83–98
Introduction 83
• Meaning of leverage 83
• Definition of leverage 83
• Types of leverage 83
Operating Leverage 84
• Degree of operating leverage 84
• Uses of operating leverage 85
Financial Leverage 86
• Degree of financial leverage 86
• Alternative definition of financial leverage 87
• Uses of financial leverage 87
Distinguish Between Operating Leverage and Financial Leverage 89
EBIT - EPS Break Even Chart for Three Different FinancingAlternatives 89
CombinedLeverage 90
• Degree of combined leverage 90
Working Capital Leverage 93
Model Questions 96
CHAPTER - 8 DIVIDEND DECISION 99–117
Introduction 99
• Meaning of dividend 99
Types of Dividend/Form of Dividend 99
• Cash dividend 100
• Stock dividend 100
• Bond dividend 100
• Property dividend 100
Dividend Decision 100
Irrelevance of Dividend 101
Contents
Modigliani and Miller’sApproach 101
Relevance of Dividend 107
• Walter’s model 107
• Gordon’s model 111
Factors Determining Dividend Policy 115
• Profitable position of the firm 115
• Uncertainty of future income 115
• Legal constrains 115
• Liquidity position 115
• Sources of finance 115
• Growth rate of the firm 115
• Tax policy 115
• Capital market conditions 115
Types of Dividend Policy 116
• Regular dividend policy 116
• Stable dividend policy 116
• Irregular dividend policy 116
• No dividend policy 116
Model Questions 116
CHAPTER - 9 CAPITAL BUDGETING 119–147
Introduction 119
• Definitions 119
• Need and importance of capital budgeting 120
Capital Budgeting Process 120
Kinds of Capital Budgeting Decisions 122
Methods of Capital Budgeting of Evaluation 122
• Pay-back period 122
• Un even cash inflows 124
• Post pay-back profitability method 124
• Accounting rate of return orAverage rate of return 126
• Net present value 128
• Internal rate of return 131
• Excess present value index 135
• Capital rationing 135
Risk and Uncertainly in Capital Budgeting 136
• Risk adjusted cut off rate 136
• Certainly equivalent method 137
• Sensitivity technique 138
• Probability technique 139
• Standard deviation method 140
• Co-efficient of variation method 142
• Decision tree analysis 142
Contents
• Construction of decision tree 142
Model Questions 144
CHAPTER - 10 WORKING CAPITAL 149–163
Introduction 149
Meaning of Working Capital 149
• Definitions 150
Concept of Working Capital 150
• Gross working capital 151
• Net working capital 151
• Component of working capital 151
Types of Working Capital 152
• Permanent working capital 152
• Temporary working capital 153
• Semi variable working capital 153
Needs of Working Capital 154
• Working capital position/Balanced working capital position 154
Factors Determining Working Capital Requirements 155
Computation (or Estimation) of Working Capital 156
Working Capital Management Policy 159
Sources of Working Capital 160
• Determining the finance mix 161
— Hedging approach 161
— Conservative approach 162
—Aggressive approach 162
Working Capital and Banking Committee 163
Model Questions 163
CHAPTER - 11 WORKING CAPITAL MANAGEMENT 165–197
Introduction 165
• Meaning 165
• Definition 165
Inventory Management 165
Introduction 166
• Meaning 166
• Kinds of inventories 166
• Objectives of inventory management 166
• Techniques of inventory management 167
• Stock level 167
• Minimum level 168
• Re-order level 168
• Maximum level 168
• Danger level 168
Contents
• Average stock level 168
• Lead time 168
• Safety stock 169
• Economic order quantity (EOQ) 169
Techniques Based on the Classification of Inventories 171
• A-B-C analysis 171
• Aging schedule of inventories 171
• VED analysis 172
• HML analysis 172
Techniques on the Basis of Records 172
• Valuation of inventories 172
Cash Management 173
• Motives for holding cash 173
• Cash management techniques 176
• Speedy cash collections 176
— Prompt payment by customers 176
— Early conversion of payments into cash 176
— Concentration banking 176
— Lock box system 176
• Slowing disbursement 177
• Cash management models 177
Receivable Management 179
• Collection cost 179
• Capital cost 179
• Administrative cost 179
• Default cost 179
• Factors considering the receivable size 179
Model Questions 194
CHAPTER - 12 SPECIAL FINANCING 199–224
Lease Financing 199
• Definition of leasing 199
• Elements of leasing 200
• Term of lease 200
• Lease rental 200
• Type of leasing 200
• Advantages of leasing 202
• Leasing finance institutions in India 203
• Leasing by development institutions 203
• Leasing by specialized institutions 203
• Private sector leasing company 204
• Private sector financial company 204
Venture Capital 204
Contents
• Introduction 204
• Meaning of venture capital 204
• Definition of venture capital 204
• Features of venture capital 205
• Venture capital in India 205
Factoring 206
• Myths on factoring 206
• History of the early factoring in Roman 207
• Factoring in United States 207
• Factoring in India 207
• Modus of operations 208
• Why factoring? 208
• Mechanics of factoring 209
• Types of factoring 210
Foreign Direct Investment 210
• FDI in India 211
• Through private placements or preferential allotments 211
• A comparative study between India and China 212
• Foreign Institutional Investors (FIIS) 212
• SEBI and FIIs 212
Merchant Banking 214
• Introduction 214
• Meaning 214
• Merchant banking in India 214
• Classification of merchant banking 214
• Functions of merchant banking 215
• Merchant banking organizations 215
Credit Rating 216
• Introduction 216
• Meaning of credit rating 216
• Objectives of credit rating 216
• Credit rating in India 216
• Operational performance of credit rating business in India 217
• Basis for credit rating 217
• Credit Rating Information Service of India Limited (CRISIL) 217
• Credit rating symbols of credit rating information service of India limited 217
• Operational result of credit rating information service of India limited 218
• Investment Information and Credit RatingAgency of India limited (ICRA) 218
• Credit rating symbols of investment information and credit rating agency of
India limited 218
• Operational result of ICRA 219
• CreditAnalysis and Research Limited (CARE) 219
• Credit rating symbols of credit analysis and research limited 219
Contents
• Operational result of credit analysis and research limited 219
Mutual Funds 220
• Introduction 220
• Origin of mutual funds 220
• Structure of mutual fund in India 220
• Meaning of mutual fund 221
• Advantages of mutual funds 221
• Public sector mutual fund 222
• Private sector mutual fund 222
• Open ended mutual fund 222
• Closed ended mutual fund 223
• Growth generated mutual fund 223
• Income generated mutual fund 223
• Balanced mutual fund 223
• Domestic mutual fund 223
• Global mutual fund 223
• Regional mutual fund 223
• Sector mutual fund 223
• Top ten mutual fund 223
Model Questions 224
CHAPTER - 13 FINANCIAL SYSTEM 225–264
Introduction 225
Financial System in India 225
• Financial institutions 226
• Banking institutions 226
• Commercial banks 226
• Scheduled commercial banks 226
• Nationalised banks 227
• State Bank of India(SBI) 228
• Growth and structure of commercial banks in India 228
• Private sectors banks 229
• New banks in private sectors 229
• Foreign banks in India 230
• Non-banking institutions 231
• Non-banking financial institutions 231
Industrial Finance Corporation of India (IFCI) 231
• Origin 231
• Capital 232
• Objectives 232
• Functions 232
• Management 232
• Subsidies of industrial finance corporation of India 232
• Working result 233
Contents
Industrial Credit and Investment Corporation of India (ICICI) 233
• Origin 233
• Capital 233
• Objective 233
• Functions 233
• Management 233
Subsidies of industrial credit and investment corporation of India 234
• Working result 234
Industrial Development Bank of India (IDBI) 234
• Origin 234
• Capital 234
• Objectives 234
• Functions 234
• Management 235
• Working result 235
Industrial Reconstruction Bank of India (IRBI) 235
• Origin 235
• Capital 235
• Objectives 236
• Functions 236
• Management 236
• Working result 236
State Finance Corporation (SFC) 236
• Origin 236
• Capital 237
• Objectives 237
• Functions 237
• Management 237
State Finance Corporation in Tamil Nadu 237
Export Import Bank (Exim Bank) 237
• Origin 237
• Capital 237
• Objectives 237
• Functions 238
• Management 238
• Working result 238
National Bank forAgricultural and Rural Development 238
• Origin 238
• Capital 238
• Objectives 238
• Functions 239
• Management 239
• Working result 239
Specialized Financial Institutions 239
Contents
Insurance Sector in India 240
• Some of the private sector life insurance corporation 241
Life Insurance Corporation of India 241
• Role of LIC 241
General Insurance Companies 242
Unit Trust of India 243
• Origin 243
• Capital 243
• Objectives 243
• Functions 243
• Management 244
• Subsidiaries of Unit Trust of India 244
• Schemes of Unit Trust of India 244
• Working result of Unit Trust of India 244
Non-banking Non-financial Institutions 245
Financial Markets 245
• Capital market 246
• MIBOR and MIBID 248
• Share market 248
• Primary market 248
• Secondary market 249
• Methods of raising capital 250
• Public issue 251
• Right Issue 251
• Private placement 251
• GroupA and group B shares 252
Securities and Exchange Board of India (SEBI) 252
• Functions 252
• Trading procedure at stock exchanges 253
• Recent trends in capital market 253
Share Market Terminology 255
• Main share price index in famous share market of the world 257
• Name of share price indices changed 257
• Money market 257
• Discount and Finance House of India Ltd. (DFHI) 260
• Commercial Paper (CP) 260
• Money Market Mutual Funds (MMMFs) 261
• Venture Capital Funds (VCFs) 262
• Financial services 262
• Fund based financial services 262
• Fee based financial services 262
• Non-banking Finance Companies (NBFC) 263
Model Questions 264
INTRODUCTION
Business concern needs finance to meet their requirements in the economic world. Any
kind of business activity depends on the finance. Hence, it is called as lifeblood of business
organization. Whether the business concerns are big or small, they need finance to fulfil
their business activities.
In the modern world, all the activities are concerned with the economic activities and
very particular to earning profit through any venture or activities. The entire business
activities are directly related with making profit. (According to the economics concept of
factors of production, rent given to landlord, wage given to labour, interest given to capital
and profit given to shareholders or proprietors), a business concern needs finance to meet
all the requirements. Hence finance may be called as capital, investment, fund etc., but
each term is having different meanings and unique characters. Increasing the profit is the
main aim of any kind of economic activity.
MEANING OF FINANCE
Finance may be defined as the art and science of managing money. It includes financial
service and financial instruments. Finance also is referred as the provision of money at the
time when it is needed. Finance function is the procurement of funds and their effective
utilization in business concerns.
The concept of finance includes capital, funds, money, and amount. But each word is
having unique meaning. Studying and understanding the concept of finance become an
important part of the business concern.
DEFINITION OF FINANCE
According to Khan and Jain, “Finance is the art and science of managing money”.
2 Financial Management
According to Oxford dictionary, the word ‘finance’ connotes ‘management of money’.
Webster’s Ninth New Collegiate Dictionary defines finance as “the Science on study
of the management of funds’ and the management of fund as the system that includes the
circulation of money, the granting of credit, the making of investments, and the provision
of banking facilities.
DEFINITION OF BUSINESS FINANCE
According to the Wheeler, “Business finance is that business activity which concerns
with the acquisition and conversation of capital funds in meeting financial needs and overall
objectives of a business enterprise”.
According to the Guthumann and Dougall, “Business finance can broadly be defined
as the activity concerned with planning, raising, controlling, administering of the funds
used in the business”.
In the words of Parhter and Wert, “Business finance deals primarily with raising,
administering and disbursing funds by privately owned business units operating in non-
financial fields of industry”.
Corporate finance is concerned with budgeting, financial forecasting, cash
management, credit administration, investment analysis and fund procurement of the
business concern and the business concern needs to adopt modern technology and
application suitable to the global environment.
According to the Encyclopedia of Social Sciences, “Corporation finance deals with
the financial problems of corporate enterprises. These problems include the financial aspects
of the promotion of new enterprises and their administration during early development,
the accounting problems connected with the distinction between capital and income, the
administrative questions created by growth and expansion, and finally, the financial
adjustments required for the bolstering up or rehabilitation of a corporation which has
come into financial difficulties”.
TYPES OF FINANCE
Finance is one of the important and integral part of business concerns, hence, it plays a
major role in every part of the business activities. It is used in all the area of the activities
under the different names.
Finance can be classified into two major parts:
Introduction to Financial Management 3
Finance
Private
Finance
Public
Finance
Individual
Finance
Partnership
Finance
Business
Finance
Central
Government
State
Government
Semi
Government
Fig. 1.1 Types of Finance
Private Finance, which includes the Individual, Firms, Business or Corporate
Financial activities to meet the requirements.
Public Finance which concerns with revenue and disbursement of Government such
as Central Government, State Government and Semi-Government Financial matters.
DEFINITION OF FINANCIAL MANAGEMENT
Financial management is an integral part of overall management. It is concerned with the
duties of the financial managers in the business firm.
The term financial management has been defined by Solomon, “It is concerned with
the efficient use of an important economic resource namely, capital funds”.
The most popular and acceptable definition of financial management as given by S.C.
Kuchal is that “Financial Management deals with procurement of funds and their effective
utilization in the business”.
Howard and Upton : Financial management “as an application of general managerial
principles to the area of financial decision-making.
Weston and Brigham : Financial management “is an area of financial decision-making,
harmonizing individual motives and enterprise goals”.
Joshep and Massie : Financial management “is the operational activity of a business
that is responsible for obtaining and effectively utilizing the funds necessary for efficient
operations.
Thus, Financial Management is mainly concerned with the effective funds
management in the business. In simple words, Financial Management as practiced by
business firms can be called as Corporation Finance or Business Finance.
4 Financial Management
SCOPE OF FINANCIAL MANAGEMENT
Financial management is one of the important parts of overall management, which is directly
related with various functional departments like personnel, marketing and production.
Financial management covers wide area with multidimensional approaches. The following
are the important scope of financial management.
1. Financial Management and Economics
Economic concepts like micro and macroeconomics are directly applied with the
financial management approaches. Investment decisions, micro and macro
environmental factors are closely associated with the functions of financial manager.
Financial management also uses the economic equations like money value discount
factor, economic order quantity etc. Financial economics is one of the emerging
area, which provides immense opportunities to finance, and economical areas.
2. Financial Management and Accounting
Accounting records includes the financial information of the business concern.
Hence, we can easily understand the relationship between the financial management
and accounting. In the olden periods, both financial management and accounting
are treated as a same discipline and then it has been merged as Management
Accounting because this part is very much helpful to finance manager to take
decisions. But nowaday’s financial management and accounting discipline are
separate and interrelated.
3. Financial Management or Mathematics
Modern approaches of the financial management applied large number of
mathematical and statistical tools and techniques. They are also called as
econometrics. Economic order quantity, discount factor, time value of money,
present value of money, cost of capital, capital structure theories, dividend theories,
ratio analysis and working capital analysis are used as mathematical and statistical
tools and techniques in the field of financial management.
4. Financial Management and Production Management
Production management is the operational part of the business concern, which
helps to multiple the money into profit. Profit of the concern depends upon the
production performance. Production performance needs finance, because
production department requires raw material, machinery, wages, operating expenses
etc. These expenditures are decided and estimated by the financial department
and the finance manager allocates the appropriate finance to production department.
The financial manager must be aware of the operational process and finance
required for each process of production activities.
5. Financial Management and Marketing
Produced goods are sold in the market with innovative and modern approaches.
For this, the marketing department needs finance to meet their requirements.
Introduction to Financial Management 5
The financial manager or finance department is responsible to allocate the adequate
finance to the marketing department. Hence, marketing and financial management
are interrelated and depends on each other.
6. Financial Management and Human Resource
Financial management is also related with human resource department, which
provides manpower to all the functional areas of the management. Financial
manager should carefully evaluate the requirement of manpower to each
department and allocate the finance to the human resource department as wages,
salary, remuneration, commission, bonus, pension and other monetary benefits
to the human resource department. Hence, financial management is directly
related with human resource management.
OBJECTIVES OF FINANCIAL MANAGEMENT
Effective procurement and efficient use of finance lead to proper utilization of the finance
by the business concern. It is the essential part of the financial manager. Hence, the financial
manager must determine the basic objectives of the financial management. Objectives of
Financial Management may be broadly divided into two parts such as:
1. Profit maximization
2. Wealth maximization.
Wealth
Profit
Fig. 1.2 Objectives of Financial Management
Profit Maximization
Main aim of any kind of economic activity is earning profit. A business concern is also
functioning mainly for the purpose of earning profit. Profit is the measuring techniques to
understand the business efficiency of the concern. Profit maximization is also the traditional
and narrow approach, which aims at, maximizes the profit of the concern. Profit
maximization consists of the following important features.
1. Profit maximization is also called as cashing per share maximization. It leads to
maximize the business operation for profit maximization.
2. Ultimate aim of the business concern is earning profit, hence, it considers all the
possible ways to increase the profitability of the concern.
Objectives
6 Financial Management
3. Profit is the parameter of measuring the efficiency of the business concern.
So it shows the entire position of the business concern.
4. Profit maximization objectives help to reduce the risk of the business.
Favourable Arguments for Profit Maximization
The following important points are in support of the profit maximization objectives of the
business concern:
(i) Main aim is earning profit.
(ii) Profit is the parameter of the business operation.
(iii) Profit reduces risk of the business concern.
(iv) Profit is the main source of finance.
(v) Profitability meets the social needs also.
Unfavourable Arguments for Profit Maximization
The following important points are against the objectives of profit maximization:
(i) Profit maximization leads to exploiting workers and consumers.
(ii) Profit maximization creates immoral practices such as corrupt practice, unfair
trade practice, etc.
(iii) Profit maximization objectives leads to inequalities among the sake holders such
as customers, suppliers, public shareholders, etc.
Drawbacks of Profit Maximization
Profit maximization objective consists of certain drawback also:
(i) It is vague: In this objective, profit is not defined precisely or correctly. It creates
some unnecessary opinion regarding earning habits of the business concern.
(ii) It ignores the time value of money: Profit maximization does not consider the
time value of money or the net present value of the cash inflow. It leads certain
differences between the actual cash inflow and net present cash flow during a
particular period.
(iii) It ignores risk: Profit maximization does not consider risk of the business
concern. Risks may be internal or external which will affect the overall operation
of the business concern.
Wealth Maximization
Wealth maximization is one of the modern approaches, which involves latest innovations
and improvements in the field of the business concern. The term wealth means shareholder
wealth or the wealth of the persons those who are involved in the business concern.
Wealth maximization is also known as value maximization or net present worth
maximization. This objective is an universally accepted concept in the field of business.
Introduction to Financial Management 7
Favourable Arguments for Wealth Maximization
(i) Wealth maximization is superior to the profit maximization because the main aim
of the business concern under this concept is to improve the value or wealth of
the shareholders.
(ii) Wealth maximization considers the comparison of the value to cost associated with
the business concern. Total value detected from the total cost incurred for the
business operation. It provides extract value of the business concern.
(iii) Wealth maximization considers both time and risk of the business concern.
(iv) Wealth maximization provides efficient allocation of resources.
(v) It ensures the economic interest of the society.
Unfavourable Arguments for Wealth Maximization
(i) Wealth maximization leads to prescriptive idea of the business concern but it may
not be suitable to present day business activities.
(ii) Wealth maximization is nothing, it is also profit maximization, it is the indirect
name of the profit maximization.
(iii) Wealth maximization creates ownership-management controversy.
(iv) Management alone enjoy certain benefits.
(v) The ultimate aim of the wealth maximization objectives is to maximize the profit.
(vi) Wealth maximization can be activated only with the help of the profitable position
of the business concern.
APPROACHES TO FINANCIAL MANAGEMENT
Financial management approach measures the scope of the financial management in
various fields, which include the essential part of the finance. Financial management is
not a revolutionary concept but an evolutionary. The definition and scope of financial
management has been changed from one period to another period and applied various
innovations. Theoretical points of view, financial management approach may be broadly
divided into two major parts.
Approach
Traditional Approach Modern Approach
Fig. 1.3 Approaches to Finance Management
8 Financial Management
Traditional Approach
Traditional approach is the initial stage of financial management, which was followed, in
the early part of during the year 1920 to 1950. This approach is based on the past experience
and the traditionally accepted methods. Main part of the traditional approach is rising of
funds for the business concern. Traditional approach consists of the following important
area.
Arrangement of funds from lending body.
Arrangement of funds through various financial instruments.
Finding out the various sources of funds.
FUNCTIONS OF FINANCE MANAGER
Finance function is one of the major parts of business organization, which involves the
permanent, and continuous process of the business concern. Finance is one of the interrelated
functions which deal with personal function, marketing function, production function and
research and development activities of the business concern. At present, every business
concern concentrates more on the field of finance because, it is a very emerging part which
reflects the entire operational and profit ability position of the concern. Deciding the proper
financial function is the essential and ultimate goal of the business organization.
Finance manager is one of the important role players in the field of finance function.
He must have entire knowledge in the area of accounting, finance, economics and
management. His position is highly critical and analytical to solve various problems related
to finance. A person who deals finance related activities may be called finance manager.
Finance manager performs the following major functions:
1. Forecasting Financial Requirements
It is the primary function of the Finance Manager. He is responsible to estimate
the financial requirement of the business concern. He should estimate, how much
finances required to acquire fixed assets and forecast the amount needed to meet
the working capital requirements in future.
2. Acquiring Necessary Capital
After deciding the financial requirement, the finance manager should concentrate
how the finance is mobilized and where it will be available. It is also highly critical
in nature.
3. Investment Decision
The finance manager must carefully select best investment alternatives and consider
the reasonable and stable return from the investment. He must be well versed
in the field of capital budgeting techniques to determine the effective utilization
of investment. The finance manager must concentrate to principles of safety,
liquidity and profitability while investing capital.
Introduction to Financial Management 9
4. Cash Management
Present days cash management plays a major role in the area of finance because
proper cash management is not only essential for effective utilization of cash but
it also helps to meet the short-term liquidity position of the concern.
5. Interrelation with Other Departments
Finance manager deals with various functional departments such as marketing,
production, personel, system, research, development, etc. Finance manager should
have sound knowledge not only in finance related area but also well versed in
other areas. He must maintain a good relationship with all the functional
departments of the business organization.
Department-I
Department-II
Department-III
Departme
nt-IV
Forecasting Funds
Managing
Funds
Investing Funds
Finance
Manager
Accquring
Funds
Fig 1.4 Functions of Financial Manager
IMPORTANCE OF FINANCIAL MANAGEMENT
Finance is the lifeblood of business organization. It needs to meet the requirement of the
business concern. Each and every business concern must maintain adequate amount of
finance for their smooth running of the business concern and also maintain the business
carefully to achieve the goal of the business concern. The business goal can be achieved
only with the help of effective management of finance. We can’t neglect the importance of
finance at any time at and at any situation. Some of the importance of the financial
management is as follows:
Financial Planning
Financial management helps to determine the financial requirement of the business concern
and leads to take financial planning of the concern. Financial planning is an important part
of the business concern, which helps to promotion of an enterprise.
Acquisition of Funds
Financial management involves the acquisition of required finance to the business concern.
Acquiring needed funds play a major part of the financial management, which involve
possible source of finance at minimum cost.
10 Financial Management
Proper Use of Funds
Proper use and allocation of funds leads to improve the operational efficiency of the business
concern. When the finance manager uses the funds properly, they can reduce the cost of
capital and increase the value of the firm.
Financial Decision
Financial management helps to take sound financial decision in the business concern.
Financial decision will affect the entire business operation of the concern. Because there is
a direct relationship with various department functions such as marketing, production
personnel, etc.
Improve Profitability
Profitability of the concern purely depends on the effectiveness and proper utilization of
funds by the business concern. Financial management helps to improve the profitability
position of the concern with the help of strong financial control devices such as budgetary
control, ratio analysis and cost volume profit analysis.
Increase the Value of the Firm
Financial management is very important in the field of increasing the wealth of the investors
and the business concern. Ultimate aim of any business concern will achieve the maximum
profit and higher profitability leads to maximize the wealth of the investors as well as the
nation.
Promoting Savings
Savings are possible only when the business concern earns higher profitability and
maximizing wealth. Effective financial management helps to promoting and mobilizing
individual and corporate savings.
Nowadays financial management is also popularly known as business finance or
corporate finances. The business concern or corporate sectors cannot function without
the importance of the financial management.
MODEL QUESTIONS
1. What is finance? Define business finance.
2. Explain the types of finance.
3. Discuss the objectives of financial management.
4. Critically evaluate various approaches to the financial management.
5. Explain the scope of financial management.
6. Discuss the role of financial manager.
7. Explain the importance of financial management.
INTRODUCTION
A financial statement is an official document of the firm, which explores the entire financial
information of the firm. The main aim of the financial statement is to provide information
and understand the financial aspects of the firm. Hence, preparation of the financial
statement is important as much as the financial decisions.
MEANING AND DEFINITION
According to Hamptors John, the financial statement is an organized collection of data
according to logical and consistent accounting procedures. Its purpose is to convey an
understanding of financial aspects of a business firm. It may show a position at a moment
of time as in the case of a balance-sheet or may reveal a service of activities over a given
period of time, as in the case of an income statement.
Financial statements are the summary of the accounting process, which, provides
useful information to both internal and external parties. John N. Nyer also defines it
“Financial statements provide a summary of the accounting of a business enterprise, the
balance-sheet reflecting the assets, liabilities and capital as on a certain data and the income
statement showing the results of operations during a certain period”.
Financial statements generally consist of two important statements:
(i) The income statement or profit and loss account.
(ii) Balance sheet or the position statement.
A part from that, the business concern also prepares some of the other parts of
statements, which are very useful to the internal purpose such as:
(i) Statement of changes in owner’s equity.
(ii) Statement of changes in financial position.
12 Financial Management
Financial Statement
Income Statement Position Statement
Statement of changes
in Owner's Equity
Statement of changes
in Financial Position
Fig. 2.1 Financial Statement
Income Statement
Income statement is also called as profit and loss account, which reflects the operational
position of the firm during a particular period. Normally it consists of one accounting year.
It determines the entire operational performance of the concern like total revenue generated
and expenses incurred for earning that revenue.
Income statement helps to ascertain the gross profit and net profit of the concern.
Gross profit is determined by preparation of trading or manufacturing a/c and net profit is
determined by preparation of profit and loss account.
Position Statement
Position statement is also called as balance sheet, which reflects the financial position of
the firm at the end of the financial year.
Position statement helps to ascertain and understand the total assets, liabilities and
capital of the firm. One can understand the strength and weakness of the concern with
the help of the position statement.
Statement of Changes in Owner’s Equity
It is also called as statement of retained earnings. This statement provides information
about the changes or position of owner’s equity in the company. How the retained earnings
are employed in the business concern. Nowadays, preparation of this statement is not
popular and nobody is going to prepare the separate statement of changes in owner’s equity.
Statement of Changes in Financial Position
Income statement and position statement shows only about the position of the finance,
hence it can’t measure the actual position of the financial statement. Statement of changes
in financial position helps to understand the changes in financial position from one period
to another period.
Financial Statement Analysis 13
Statement of changes in financial position involves two important areas such as fund
flow statement which involves the changes in working capital position and cash flow
statement which involves the changes in cash position.
TYPES OF FINANCIAL STATEMENT ANALYSIS
Analysis of Financial Statement is also necessary to understand the financial positions during
a particular period. According to Myres, “Financial statement analysis is largely a study of
the relationship among the various financial factors in a business as disclosed by a single set
of statements and a study of the trend of these factors as shown in a series of statements”.
Analysis of financial statement may be broadly classified into two important types on
the basis of material used and methods of operations.
Types of Financial
Analysis
On the basis of
Materials Used
On the basis of
Methods of Operations
External
Analysis
Internal
Analysis
Horizontal
Analysis
Vertical
Analysis
Fig. 2.2 Types of Financial Statement Analysis
1. Based on Material Used
Based on the material used, financial statement analysis may be classified into two
major types such as External analysis and internal analysis.
A. External Analysis
Outsiders of the business concern do normally external analyses but they
are indirectly involved in the business concern such as investors, creditors,
government organizations and other credit agencies. External analysis is
very much useful to understand the financial and operational position of
the business concern. External analysis mainly depends on the published
financial statement of the concern. This analysis provides only limited
information about the business concern.
B. Internal Analysis
The company itself does disclose some of the valuable informations to the
business concern in this type of analysis. This analysis is used to understand
14 Financial Management
the operational performances of each and every department and unit of the
business concern. Internal analysis helps to take decisions regarding achieving
the goals of the business concern.
2. Based on Method of Operation
Based on the methods of operation, financial statement analysis may be classified
into two major types such as horizontal analysis and vertical analysis.
A. Horizontal Analysis
Under the horizontal analysis, financial statements are compared with several
years and based on that, a firm may take decisions. Normally, the current
year’s figures are compared with the base year (base year is consider as 100)
and how the financial information are changed from one year to another.
This analysis is also called as dynamic analysis.
B. Vertical Analysis
Under the vertical analysis, financial statements measure the quantities
relationship of the various items in the financial statement on a particular period.
It is also called as static analysis, because, this analysis helps to determine the
relationship with various items appeared in the financial statement. For example,
a sale is assumed as 100 and other items are converted into sales figures.
TECHNIQUES OF FINANCIAL STATEMENT ANALYSIS
Financial statement analysis is interpreted mainly to determine the financial and operational
performance of the business concern. A number of methods or techniques are used to
analyse the financial statement of the business concern. The following are the common
methods or techniques, which are widely used by the business concern.
Techniques
Ratio
Analysis
Comparative
Statement
Trend
Analysis
Cash Flow
Statement
Funds Flow
Statement
Common
Size
Analysis
Fig. 2.3 Techniques of Financial Statement Analysis
1. Comparative Statement Analysis
A. Comparative Income Statement Analysis
B. Comparative Position Statement Analysis
Financial Statement Analysis 15
2. Trend Analysis
3. Common Size Analysis
4. Fund Flow Statement
5. Cash Flow Statement
6. Ratio Analysis
Comparative Statement Analysis
Comparative statement analysis is an analysis of financial statement at different period of
time. This statement helps to understand the comparative position of financial and
operational performance at different period of time.
Comparative financial statements again classified into two major parts such as
comparative balance sheet analysis and comparative profit and loss account analysis.
Comparative Balance Sheet Analysis
Comparative balance sheet analysis concentrates only the balance sheet of the concern at
different period of time. Under this analysis the balance sheets are compared with previous
year’s figures or one-year balance sheet figures are compared with other years. Comparative
balance sheet analysis may be horizontal or vertical basis. This type of analysis helps to
understand the real financial position of the concern as well as how the assets, liabilities
and capitals are placed during a particular period.
Exercise 1
The following are the balance sheets of Tamil Nadu Mercantile Bank Ltd., for the years
2003 and 2004 as on 31st March. Prepare a comparative balance sheet and discuss the
operational performance of the business concern.
Balance Sheet of Tamil Nadu Mercantile Bank Limited
As on 31st March (Rs. in thousands)
Liabilities 2003 2004 Assets 2003 2004
Rs. Rs. Rs. Rs.
Capital 2,845 2,845 Cash and Balance
Reserve and with RBI 27,06,808 22,37,601
Surplus 39,66,009 47,65,406 Balance with Banks
Deposits 4,08,45,783 4,40,42,730 and Money at call &
Borrowings and short notice 11,36,781 16,07,975
Other Liabilities 7,27,671 2,84,690 Investments 2,14,21,060 2,35,37,098
Provisions 16,74,165 17,99,197 Advances 1,95,99,764 2,11,29,869
Fixed Assets 4,93,996 5,36,442
Other Assets 18,58,064 18,35,883
4,72,16,473 5,08,94,868 4,72,16,473 5,08,94,868
16 Financial Management
Solution
Comparative Balance Sheet Analysis
Increased/ Increased/
Particulars Year ending 31st March Decreased Decreased
(Amount) (Percentage)
2003 2004
Rs. Rs. Rs. Rs.
Assets
Current Assets
Cash and Balance with
RBI 27,06,808 22,37,601 (+) 4,69,207 (+) 17.33
Balance with Banks and
money at call and short notice 11,36,781 16,07,975 (–) 4,71,194 (–) 41.45
Total Current Assets 38,43,589 38,45,576 1987 0.052
Fixed Assets
Investments 2,14,21,060 2,35,37,098 (-) 21,16,038 (-) 9.88
Advances 1,95,99,764 2,11,39,869 (-) 15,40,105 (-) 7.86
Fixed Assets 4,93,996 5,36,442 (-) 42,446 (-) 8.59
Other Assets 18,58,064 18,35,883 (+) 22,181 (+) 1.19
Total Fixed Assets 4,33,72,884 4,70,49,292 (+) 36,76,408 8.48
Total Assets 4,72,16,473 5,08,94,868 36,78,395 7.79
Current Liabilities
Borrowings 7,27,671 2,84,690 (+) 4,42,981 60.88
Other Liability and
Provisions 16,74,165 17,99,197 (–) 1,25,032 7.47
Total Current Liability 24,01,836 20,83,887 3,17,949 13.24
Fixed Liability Capital 2,845 2,845 — —
Reserves surplus 39,66,009 47,65,406 (+) 7,99,397 20.16
Deposit 4,08,45,783 4,40,42,730 (+) 31,96,947 7.83
Total Fixed Liability 4,48,14,637 4,88,10,981 (+) 39,96,344 8.92
Total Liability 4,72,16,473 5,08,94,868 36,78,395 7.79
Comparative Profit and Loss Account Analysis
Another comparative financial statement analysis is comparative profit and loss account
analysis. Under this analysis, only profit and loss account is taken to compare with previous
year’s figure or compare within the statement. This analysis helps to understand the
operational performance of the business concern in a given period. It may be analyzed on
horizontal basis or vertical basis.
Financial Statement Analysis 17
Trend Analysis
The financial statements may be analysed by computing trends of series of information. It
may be upward or downward directions which involve the percentage relationship of each
and every item of the statement with the common value of 100%. Trend analysis helps to
understand the trend relationship with various items, which appear in the financial
statements. These percentages may also be taken as index number showing relative changes
in the financial information resulting with the various period of time. In this analysis, only
major items are considered for calculating the trend percentage.
Exercise 2
Calculate the Trend Analysis from the following information of Tamilnadu Mercantile
Bank Ltd., taking 1999 as a base year and interpret them (in thousands).
Year Deposits Advances Profit
1999 2,05,59,498 97,14,728 3,50,311
2000 2,66,45,251 1,25,50,440 4,06,287
2001 3,19,80,696 1,58,83,495 5,04,020
2002 3,72,99,877 1,77,26,607 5,53,525
2003 4,08,45,783 1,95,99,764 6,37,634
2004 4,40,42,730 2,11,39,869 8,06,755
Solution
Trend Analysis (Base year 1999=100)
(Rs. in thousands)
Deposits Advances Profits
Year Amount Trend Amount Trend Amount Trend
Rs. Percentage Rs. Percentage Rs. Percentage
1999 2,05,59,498 100.0 97,14,728 100.0 3,50,311 100.0
2000 2,66,45,251 129.6 1,25,50,440 129.2 4,06,287 115.9
2001 3,19,80,696 155.5 1,58,83,495 163.5 5,04,020 143.9
2002 3,72,99,877 181.4 1,77,26,607 182.5 5,53,525 150.0
2003 4,08,45,783 198.7 1,95,99,764 201.8 6,37,634 182.0
2004 4,40,42,730 214.2 2,11,39,869 217.6 8,06,755 230.3
Common Size Analysis
Another important financial statement analysis techniques are common size analysis in
which figures reported are converted into percentage to some common base. In the balance
sheet the total assets figures is assumed to be 100 and all figures are expressed as a percentage
of this total. It is one of the simplest methods of financial statement analysis, which reflects
the relationship of each and every item with the base value of 100%.
18 Financial Management
Exercise 3
Common size balance sheet of Tamilnadu Mercantile Bank Ltd., as on 31st March 2003
and 2004.
Particulars 31st March 2003 31st March 2004
Amount Percentage Amount Percentage
Fixed Assets
Investments 2,14,21,060 45.37 2,35,37,098 46.25
Advances 1,95,99,764 41.51 2,11,39,869 41.54
Fixed Assets 4,93,996 1.05 5,36,442 1.05
Other Assets 18,58,064 3.94 18,35,883 3.61
Total Fixed Assets 4,33,72,884 91.86 4,70,49,292 94.44
Current Assets
Cash and Balance with
RBI 27,06,808 5.73 22,37,601 4.40
Balance with banks
and money at call
and short notice 11,36,781 2.41 16,07,975 3.20
Total Current Assets 38,43,589 8.14 38,45,576 7.60
Total Assets 4,72,16,473 100.00 5,08,94,868 100.00
Fixed Liabilities
Capital 2,845 0.01 2,845 0.01
Reserve and Surplus 39,66,009 8.40 47,65,406 9.36
Deposits 4,08,45,783 86.50 4,40,42,730 86.54
Total Fixed Liabilities 4,48,14,637 94.91 4,88,10,981 95.91
Current Liability
Borrowings 7,27,671 1.54 2,84,690 0.56
Other Liabilities
Provisions 16,74,165 3.55 17,99,197 3.53
Total Current Liability 24,01,836 5.09 20,83,887 4.09
Total Liabilities 4,72,16,473 100.00 5,08,94,868 100.00
FUNDS FLOW STATEMENT
Funds flow statement is one of the important tools, which is used in many ways. It helps to
understand the changes in the financial position of a business enterprise between the
beginning and ending financial statement dates. It is also called as statement of sources and
uses of funds.
Institute of Cost and Works Accounts of India, funds flow statement is defined as “a
statement prospective or retrospective, setting out the sources and application of the funds
of an enterprise. The purpose of the statement is to indicate clearly the requirement of
funds and how they are proposed to be raised and the efficient utilization and application
of the same”.
Financial Statement Analysis 19
CASH FLOW STATEMENT
Cash flow statement is a statement which shows the sources of cash inflow and uses of
cash out-flow of the business concern during a particular period of time. It is the statement,
which involves only short-term financial position of the business concern. Cash flow
statement provides a summary of operating, investment and financing cash flows and
reconciles them with changes in its cash and cash equivalents such as marketable securities.
Institute of Chartered Accountants of India issued the Accounting Standard (AS-3) related
to the preparation of cash flow statement in 1998.
Difference Between Funds Flow and Cash Flow Statement
Funds Flow Statement Cash Flow Statement
1. Funds flow statement is the report on the 1. Cash flow statement is the report showing
movement of funds or working capital sources and uses of cash.
2. Funds flow statement explains how working 2. Cash flow statement explains the inflow and
capital is raised and used during the particular out flow of cash during the particular period.
3. The main objective of fund flow statement is 3. The main objective of the cash flow statement
to show the how the resources have been is to show the causes of changes in cash
balanced mobilized and used. between two balance sheet dates.
4. Funds flow statement indicates the results of 4. Cash flow statement indicates the factors
current financial management. contributing to the reduction of cash balance
in spite of increase in profit and vice-versa.
5. In a funds flow statement increase or decrease 5. In a cash flow statement only cash receipt and
in working capital is recorded. payments are recorded.
6. In funds flow statement there is no opening 6. Cash flow statement starts with opening cash
and closing balances. balance and ends with closing cash balance.
Exercise 4
From the following balance sheet of A Company Ltd. you are required to prepare a schedule
of changes in working capital and statement of flow of funds.
Balance Sheet of A Company Ltd., as on 31st
March
Liabilities 2004 2005 Assets 2004 2005
Share Capital 1,00,000 1,10,000 Land and Building 60,000 60,000
Profit and Loss a/c 20,000 23,000 Plant and Machinery 35,000 45,000
Loans — 10,000 Stock 20,000 25,000
Creditors 15,000 18,000 Debtors 18,000 28,000
Bills payable 5,000 4,000 Bills receivable 2,000 1,000
Cash 5,000 6,000
1,40,000 1,65,000 1,40,000 1,65,000
20 Financial Management
Solution
Schedule of Changes in Working Capital
Particulars 2004 2005 Incharge Decharge
Rs. Rs. Rs. Rs.
Current Assets
Stock 20,000 25,000 5,000 —
Debtors 18,000 28,000 10,000 —
Bills Receivable 2,000 1,000 — 1,000
Cash 5,000 6,000 1,000
A 45,000 60,000
Less Current Liabilities
Creditors 15,000 18,000 3,000
Bills Payable 5,000 4,000 1,000
B 20,000 22,000 17,000 4,000
A-B 25,000 38,000 — 13,000
Increase in W.C. 38,000 38,000 17,000 17,000
Fund Flow Statement
Sources Rs. Application Rs.
Issued Share Capital 10,000 Purchase of Plant and Machinery 10,000
Loan 10,000 Increase in Working Capital 13,000
Funds From Operations 3,000
23,000 23,000
Exercise 5
From the above example 4 prepare a Cash Flow Statement.
Solution
Cash Flow Statement
Inflow Rs. Outflow Rs.
Balance b/d 5,000 Purchase of plant 10,000
Issued Share Capital 10,000 Increase Current Assets
Loan 10,000 Stock
Cash Opening Profit 3,000 Decrease in Bills Payable 5,000
Decrease in Bills 1,000 Balance c/d 10,000
Receivable 3,000 1,000
Increase in Creditors 6,000
32,000 32,000
RATIO ANALYSIS
Ratio analysis is a commonly used tool of financial statement analysis. Ratio is a mathematical
relationship between one number to another number. Ratio is used as an index for
evaluating the financial performance of the business concern. An accounting ratio shows
Financial Statement Analysis 21
the mathematical relationship between two figures, which have meaningful relation with
each other. Ratio can be classified into various types. Classification from the point of view
of financial management is as follows:
● Liquidity Ratio
● Activity Ratio
● Solvency Ratio
● Profitability Ratio
Liquidity Ratio
It is also called as short-term ratio. This ratio helps to understand the liquidity in a business
which is the potential ability to meet current obligations. This ratio expresses the relationship
between current assets and current assets of the business concern during a particular
period. The following are the major liquidity ratio:
S. No. Ratio Formula Significant Ratio
1. Current Ratio =
Current Assets
CurrentLiability 2 : 1
2. Quick Ratio =
Quick Assets
Quick / Current 1 : 1
Liability
Activity Ratio
It is also called as turnover ratio. This ratio measures the efficiency of the current assets
and liabilities in the business concern during a particular period. This ratio is helpful to
understand the performance of the business concern. Some of the activity ratios are given
below:
S. No. Ratio Formula
1. Stock Turnover Ratio
Costof Sales
Average Inventory
2. Debtors Turnover Ratio
Credit Sales
AverageDebtors
3. Creditors Turnover Ratio
Credit Purchase
AverageCredit
4. Working Capital Turnover Ratio
Sales
Net WorkingCapital
22 Financial Management
Solvency Ratio
It is also called as leverage ratio, which measures the long-term obligation of the business
concern. This ratio helps to understand, how the long-term funds are used in the business
concern. Some of the solvency ratios are given below:
S. No Ratio Formula
1. Debt-Equity Ratio
External Equity
Internal Equity
2. Proprietary Ratio
Shareholder / Shareholder 's Fund
Total Assets
3. Interest Coverage Ratio
EBIT
Fixed Interest Charges
Profitability Ratio
Profitability ratio helps to measure the profitability position of the business concern. Some
of the major profitability ratios are given below.
S. No Ratio Formula
1. Gross Profit Ratio ×
Gross Profit
100
Net Sales
2. Net Profit Ratio ×
Net Profit after tax
100
Net Sales
3. Operating Profit Ratio ×
Operating Net Profit
100
Sales
4. Return in Investment ×
Net Profit after tax
100
Shareholder Fund
Exercise 6
From the following balance sheet of Mr. Arvind Industries Ltd., as 31st March 2007.
Liabilities Rs. Assets Rs.
Equity Share Capital 10,000 Fixed assets (less 26,000
7% Preference Share Capital 2,000 depreciation Rs. 10,000)
Reserves and Surplus 8,000 Current Assets:
6% Mortgage Debentures 14,000 Cash 1,000
Current Liabilities: Investments (10%) 3,000
Creditors 1,200 Sundry debtors 4,000
Bills payable 2,000 Stock 6,000
Outstanding expenses 200
Tax Provision 2,600
40,000 40,000
Financial Statement Analysis 23
Other information:
1. Net sales Rs. 60,000
2. Cost of goods sold Rs. 51,600
3. Net income before tax Rs. 4,000
4. Net income after tax Rs. 2,000
Calculate appropriate ratios.
Solution
Short-term solvency ratios
Current Ratio = = =
CurrentAssets 14,000
2.33:1
CurrentLiability 6,000
Liquid Ratio = = =
LiquidRatio 8,000
1.33 :1
CurrentLiability 6,000
Long-term solvency ratios
Proprietary ratio =
′
= =
Proprietor s funds 20,000
0.5 :1
Total Assets 40,000
Proprietor’s fund or Shareholder’s fund=Equity share capital+Preference share
capital+Reserve and surplus
= 10,000+2,000+8,000=20,000
Debt-Equity ratio = = =
Externalequities 20,000
1:1
Internalequities 20,000
Interest coverage ratio =
EBIT 4,000+840
= =5.7times
Fixed interest charges 840
Fixed interest charges = 6% on debentures of Rs.14,000
= Rs. 840
Activity Ratio
Stock Turnover Ratio =
Costof Sales 51,600
= =8.6times
AverageInventory 6,000
As there is no opening stock, closing stock is taken as average stock.
24 Financial Management
Debtors Turnover Ratio =
CreditSales 60,000
= =10times
AverageDebtors 6,000
In the absence of credit sales and opening debtors, total sales is considered as credit
sales and closing debtors as average debtors.
Creditors turn over ratio = = =
Credit Purchases 43,200
36times
AverageCreditors 1,200
In absence of purchases, cost of goods sold – gross profit treated as credit purchases
and in the absence of opening creditors, closing creditors are treated as average creditors.
Working Capital Turnover Ratio = = =
Sales 60,000
7.5times
Net WorkingCapital 8,000
Profitability Ratios
Gross profit ratio = × ×
GrossProfit 8,400
100= 100=14%
Sales 60,000
Net profit ratio = × ×
Net Profit 2,000
100= 100=3.33%
Sales 60,000
In the absence of non-operating income, operating profit ratio is equal to net profit
ratio.
Return of Investment = × ×
′
NetProfitafterTax 2,000
100= 100=10%
Shareholder sFund 20,000
MODEL QUESTIONS
1. What is financial statement?
2. What is financial statement analysis?
3. Discuss various types of financial statement analysis.
4. Explain various methods of financial statement analysis.
5. What are the differences between fund flow and cash flow?
6. What is ratio analysis? Explain its types.
INTRODUCTION
Finance is the lifeblood of business concern, because it is interlinked with all activities
performed by the business concern. In a human body, if blood circulation is not proper,
body function will stop. Similarly, if the finance not being properly arranged, the business
system will stop. Arrangement of the required finance to each department of business
concern is highly a complex one and it needs careful decision. Quantum of finance may be
depending upon the nature and situation of the business concern. But, the requirement of
the finance may be broadly classified into two parts:
Long-term Financial Requirements or Fixed Capital Requirement
Financial requirement of the business differs from firm to firm and the nature of the
requirements on the basis of terms or period of financial requirement, it may be long term
and short-term financial requirements.
Long-term financial requirement means the finance needed to acquire land and building
for business concern, purchase of plant and machinery and other fixed expenditure. Long-
term financial requirement is also called as fixed capital requirements. Fixed capital is the
capital, which is used to purchase the fixed assets of the firms such as land and building,
furniture and fittings, plant and machinery, etc. Hence, it is also called a capital expenditure.
Short-term Financial Requirements or Working Capital Requirement
Apart from the capital expenditure of the firms, the firms should need certain expenditure
like procurement of raw materials, payment of wages, day-to-day expenditures, etc. This
kind of expenditure is to meet with the help of short-term financial requirements which
will meet the operational expenditure of the firms. Short-term financial requirements are
popularly known as working capital.
26 Financial Management
SOURCES OF FINANCE
Sources of finance mean the ways for mobilizing various terms of finance to the industrial
concern. Sources of finance state that, how the companies are mobilizing finance for their
requirements. The companies belong to the existing or the new which need sum amount
of finance to meet the long-term and short-term requirements such as purchasing of fixed
assets, construction of office building, purchase of raw materials and day-to-day expenses.
Sources of finance may be classified under various categories according to the
following important heads:
1. Based on the Period
Sources of Finance may be classified under various categories based on the period.
Long-term sources: Finance may be mobilized by long-term or short-term. When
the finance mobilized with large amount and the repayable over the period will
be more than five years, it may be considered as long-term sources. Share capital,
issue of debenture, long-term loans from financial institutions and commercial
banks come under this kind of source of finance. Long-term source of finance
needs to meet the capital expenditure of the firms such as purchase of fixed assets,
land and buildings, etc.
Long-term sources of finance include:
● Equity Shares
● Preference Shares
● Debenture
● Long-term Loans
● Fixed Deposits
Short-term sources: Apart from the long-term source of finance, firms can
generate finance with the help of short-term sources like loans and advances from
commercial banks, moneylenders, etc. Short-term source of finance needs to meet
the operational expenditure of the business concern.
Short-term source of finance include:
● Bank Credit
● Customer Advances
● Trade Credit
● Factoring
● Public Deposits
● Money Market Instruments
2. Based on Ownership
Sources of Finance may be classified under various categories based on the period:
Sources of Financing 27
An ownership source of finance include
● Shares capital, earnings
● Retained earnings
● Surplus and Profits
Borrowed capital include
● Debenture
● Bonds
● Public deposits
● Loans from Bank and Financial Institutions.
3. Based on Sources of Generation
Sources of Finance may be classified into various categories based on the period.
Internal source of finance includes
● Retained earnings
● Depreciation funds
● Surplus
External sources of finance may be include
● Share capital
● Debenture
● Public deposits
● Loans from Banks and Financial institutions
4. Based in Mode of Finance
Security finance may be include
● Shares capital
● Debenture
Retained earnings may include
● Retained earnings
● Depreciation funds
Loan finance may include
● Long-term loans from Financial Institutions
● Short-term loans from Commercial banks.
The above classifications are based on the nature and how the finance is mobilized
from various sources. But the above sources of finance can be divided into three major
classifications:
● Security Finance
● Internal Finance
● Loans Finance
28 Financial Management
SECURITY FINANCE
If the finance is mobilized through issue of securities such as shares and debenture, it is
called as security finance. It is also called as corporate securities. This type of finance
plays a major role in the field of deciding the capital structure of the company.
Characters of Security Finance
Security finance consists of the following important characters:
1. Long-term sources of finance.
2. It is also called as corporate securities.
3. Security finance includes both shares and debentures.
4. It plays a major role in deciding the capital structure of the company.
5. Repayment of finance is very limited.
6. It is a major part of the company’s total capitalization.
Types of Security Finance
Security finance may be divided into two major types:
1. Ownership securities or capital stock.
2. Creditorship securities or debt capital.
Ownership Securities
The ownership securities also called as capital stock, is commonly called as shares. Shares
are the most Universal method of raising finance for the business concern. Ownership
capital consists of the following types of securities.
● Equity Shares
● Preference Shares
● No par stock
● Deferred Shares
EQUITY SHARES
Equity Shares also known as ordinary shares, which means, other than preference shares.
Equity shareholders are the real owners of the company. They have a control over the
management of the company. Equity shareholders are eligible to get dividend if the company
earns profit. Equity share capital cannot be redeemed during the lifetime of the company.
The liability of the equity shareholders is the value of unpaid value of shares.
Features of Equity Shares
Equity shares consist of the following important features:
1. Maturity of the shares: Equity shares have permanent nature of capital, which
has no maturity period. It cannot be redeemed during the lifetime of the company.
Sources of Financing 29
2. Residual claim on income: Equity shareholders have the right to get income
left after paying fixed rate of dividend to preference shareholder. The earnings
or the income available to the shareholders is equal to the profit after tax minus
preference dividend.
3. Residual claims on assets: If the company wound up, the ordinary or equity
shareholders have the right to get the claims on assets. These rights are only
available to the equity shareholders.
4. Right to control: Equity shareholders are the real owners of the company.
Hence, they have power to control the management of the company and they
have power to take any decision regarding the business operation.
5. Voting rights: Equity shareholders have voting rights in the meeting of the
company with the help of voting right power; they can change or remove any
decision of the business concern. Equity shareholders only have voting rights
in the company meeting and also they can nominate proxy to participate and vote
in the meeting instead of the shareholder.
6. Pre-emptive right: Equity shareholder pre-emptive rights. The pre-emptive right
is the legal right of the existing shareholders. It is attested by the company in the
first opportunity to purchase additional equity shares in proportion to their
current holding capacity.
7. Limited liability: Equity shareholders are having only limited liability to the
value of shares they have purchased. If the shareholders are having fully paid
up shares, they have no liability. For example: If the shareholder purchased 100
shares with the face value of Rs. 10 each. He paid only Rs. 900. His liability is
only Rs. 100.
Total number of shares 100
Face value of shares Rs. 10
Total value of shares 100 × 10 = 1,000
Paid up value of shares 900
Unpaid value/liability 100
Liability of the shareholders is only unpaid value of the share (that is Rs. 100).
Advantages of Equity Shares
Equity shares are the most common and universally used shares to mobilize finance for
the company. It consists of the following advantages.
1. Permanent sources of finance: Equity share capital is belonging to long-term
permanent nature of sources of finance, hence, it can be used for long-term or
fixed capital requirement of the business concern.
2. Voting rights: Equity shareholders are the real owners of the company who have
voting rights. This type of advantage is available only to the equity shareholders.
3. No fixed dividend: Equity shares do not create any obligation to pay a fixed
rate of dividend. If the company earns profit, equity shareholders are eligible for
30 Financial Management
profit, they are eligible to get dividend otherwise, and they cannot claim any
dividend from the company.
4. Less cost of capital: Cost of capital is the major factor, which affects the value
of the company. If the company wants to increase the value of the company,
they have to use more share capital because, it consists of less cost of capital (Ke
)
while compared to other sources of finance.
5. Retained earnings: When the company have more share capital, it will be
suitable for retained earnings which is the less cost sources of finance while
compared to other sources of finance.
Disadvantages of Equity Shares
1. Irredeemable: Equity shares cannot be redeemed during the lifetime of the
business concern. It is the most dangerous thing of over capitalization.
2. Obstacles in management: Equity shareholder can put obstacles in management
by manipulation and organizing themselves. Because, they have power to contrast
any decision which are against the wealth of the shareholders.
3. Leads to speculation: Equity shares dealings in share market lead to secularism
during prosperous periods.
4. Limited income to investor: The Investors who desire to invest in safe securities
with a fixed income have no attraction for equity shares.
5. No trading on equity:When the company raises capital only with the help of
equity, the company cannot take the advantage of trading on equity.
PREFERENCE SHARES
The parts of corporate securities are called as preference shares. It is the shares, which
have preferential right to get dividend and get back the initial investment at the time of
winding up of the company. Preference shareholders are eligible to get fixed rate of dividend
and they do not have voting rights.
Preference shares may be classified into the following major types:
1. Cumulative preference shares: Cumulative preference shares have right to claim
dividends for those years which have no profits. If the company is unable to earn
profit in any one or more years, C.P. Shares are unable to get any dividend but
they have right to get the comparative dividend for the previous years if the
company earned profit.
2. Non-cumulative preference shares: Non-cumulative preference shares have no
right to enjoy the above benefits. They are eligible to get only dividend if the
company earns profit during the years. Otherwise, they cannot claim any dividend.
Sources of Financing 31
3. Redeemable preference shares: When, the preference shares have a fixed
maturity period it becomes redeemable preference shares. It can be redeemable
during the lifetime of the company. The Company Act has provided certain restrictions
on the return of the redeemable preference shares.
Irredeemable Preference Shares
Irredeemable preference shares can be redeemed only when the company goes for liquidator.
There is no fixed maturity period for such kind of preference shares.
Participating Preference Shares
Participating preference sharesholders have right to participate extra profits after distributing
the equity shareholders.
Non-Participating Preference Shares
Non-participating preference sharesholders are not having any right to participate extra
profits after distributing to the equity shareholders. Fixed rate of dividend is payable to
the type of shareholders.
Convertible Preference Shares
Convertible preference sharesholders have right to convert their holding into equity shares
after a specific period. The articles of association must authorize the right of conversion.
Non-convertible Preference Shares
There shares, cannot be converted into equity shares from preference shares.
Features of Preference Shares
The following are the important features of the preference shares:
1. Maturity period: Normally preference shares have no fixed maturity period
except in the case of redeemable preference shares. Preference shares can be
redeemable only at the time of the company liquidation.
2. Residual claims on income: Preferential sharesholders have a residual claim on
income. Fixed rate of dividend is payable to the preference shareholders.
3. Residual claims on assets: The first preference is given to the preference
shareholders at the time of liquidation. If any extra Assets are available that
should be distributed to equity shareholder.
4. Control of Management: Preference shareholder does not have any voting
rights. Hence, they cannot have control over the management of the company.
Advantages of Preference Shares
Preference shares have the following important advantages.
1. Fixed dividend: The dividend rate is fixed in the case of preference shares.
It is called as fixed income security because it provides a constant rate of income
to the investors.
32 Financial Management
2. Cumulative dividends: Preference shares have another advantage which is
called cumulative dividends. If the company does not earn any profit in any
previous years, it can be cumulative with future period dividend.
3. Redemption: Preference Shares can be redeemable after a specific period except
in the case of irredeemable preference shares. There is a fixed maturity period
for repayment of the initial investment.
4. Participation: Participative preference sharesholders can participate in the surplus
profit after distribution to the equity shareholders.
5. Convertibility: Convertibility preference shares can be converted into equity
shares when the articles of association provide such conversion.
Disadvantages of Preference Shares
1. Expensive sources of finance: Preference shares have high expensive source
of finance while compared to equity shares.
2. No voting right: Generally preference sharesholders do not have any voting
rights. Hence they cannot have the control over the management of the company.
3. Fixed dividend only: Preference shares can get only fixed rate of dividend. They
may not enjoy more profits of the company.
4. Permanent burden: Cumulative preference shares become a permanent burden
so far as the payment of dividend is concerned. Because the company must pay
the dividend for the unprofitable periods also.
5. Taxation: In the taxation point of view, preference shares dividend is not a
deductible expense while calculating tax. But, interest is a deductible expense.
Hence, it has disadvantage on the tax deduction point of view.
DEFERRED SHARES
Deferred shares also called as founder shares because these shares were normally issued to
founders. The shareholders have a preferential right to get dividend before the preference
shares and equity shares. According to Companies Act 1956 no public limited company or
which is a subsidiary of a public company can issue deferred shares.
These shares were issued to the founder at small denomination to control over the
management by the virtue of their voting rights.
NO PAR SHARES
When the shares are having no face value, it is said to be no par shares. The company
issues this kind of shares which is divided into a number of specific shares without any
specific denomination. The value of shares can be measured by dividing the real net worth
of the company with the total number of shares.
Value of no. per share =
Therealnet worth
Total no.of shares
Sources of Financing 33
CREDITORSHIP SECURITIES
Creditorship Securities also known as debt finance which means the finance is mobilized
from the creditors. Debenture and Bonds are the two major parts of the Creditorship
Securities.
Debentures
A Debenture is a document issued by the company. It is a certificate issued by the company
under its seal acknowledging a debt.
According to the Companies Act 1956, “debenture includes debenture stock, bonds
and any other securities of a company whether constituting a charge of the assets of the
company or not.”
Types of Debentures
Debentures may be divided into the following major types:
1. Unsecured debentures: Unsecured debentures are not given any security on
assets of the company. It is also called simple or naked debentures. This type
of debentures are treaded as unsecured creditors at the time of winding up of the
company.
2. Secured debentures: Secured debentures are given security on assets of the
company. It is also called as mortgaged debentures because these debentures are
given against any mortgage of the assets of the company.
3. Redeemable debentures: These debentures are to be redeemed on the expiry
of a certain period. The interest is paid periodically and the initial investment is
returned after the fixed maturity period.
4. Irredeemable debentures: These kind of debentures cannot be redeemable
during the life time of the business concern.
5. Convertible debentures: Convertible debentures are the debentures whose holders
have the option to get them converted wholly or partly into shares. These
debentures are usually converted into equity shares. Conversion of the debentures
may be:
Non-convertible debentures
Fully convertible debentures
Partly convertible debentures
6. Other types: Debentures can also be classified into the following types. Some
of the common types of the debentures are as follows:
1. Collateral Debenture
2. Guaranteed Debenture
3. First Debenture
4. Zero Coupon Bond
5. Zero Interest Bond/Debenture
34 Financial Management
Features of Debentures
1. Maturity period: Debentures consist of long-term fixed maturity period. Normally,
debentures consist of 10–20 years maturity period and are repayable with the
principle investment at the end of the maturity period.
2. Residual claims in income: Debenture holders are eligible to get fixed rate of
interest at every end of the accounting period. Debenture holders have priority
of claim in income of the company over equity and preference shareholders.
3. Residual claims on asset: Debenture holders have priority of claims on Assets
of the company over equity and preference shareholders. The Debenture holders
may have either specific change on the Assets or floating change of the assets
of the company. Specific change of Debenture holders are treated as secured
creditors and floating change of Debenture holders are treated as unsecured
creditors.
4. No voting rights: Debenture holders are considered as creditors of the company.
Hence they have no voting rights. Debenture holders cannot have the control
over the performance of the business concern.
5. Fixed rate of interest: Debentures yield fixed rate of interest till the maturity
period. Hence the business will not affect the yield of the debenture.
Advantages of Debenture
Debenture is one of the major parts of the long-term sources of finance which of consists
the following important advantages:
1. Long-term sources: Debenture is one of the long-term sources of finance to the
company. Normally the maturity period is longer than the other sources of finance.
2. Fixed rate of interest: Fixed rate of interest is payable to debenture holders,
hence it is most suitable of the companies earn higher profit. Generally, the rate
of interest is lower than the other sources of long-term finance.
3. Trade on equity: A company can trade on equity by mixing debentures in its
capital structure and thereby increase its earning per share. When the company
apply the trade on equity concept, cost of capital will reduce and value of the
company will increase.
4. Income tax deduction: Interest payable to debentures can be deducted from the
total profit of the company. So it helps to reduce the tax burden of the company.
5. Protection: Various provisions of the debenture trust deed and the guidelines
issued by the SEB1 protect the interest of debenture holders.
Disadvantages of Debenture
Debenture finance consists of the following major disadvantages:
1. Fixed rate of interest: Debenture consists of fixed rate of interest payable to
securities. Even though the company is unable to earn profit, they have to pay
the fixed rate of interest to debenture holders, hence, it is not suitable to those
company earnings which fluctuate considerably.
Sources of Financing 35
2. No voting rights: Debenture holders do not have any voting rights. Hence, they
cannot have the control over the management of the company.
3. Creditors of the company: Debenture holders are merely creditors and not the
owners of the company. They do not have any claim in the surplus profits of
the company.
4. High risk: Every additional issue of debentures becomes more risky and costly
on account of higher expectation of debenture holders. This enhanced financial
risk increases the cost of equity capital and the cost of raising finance through
debentures which is also high because of high stamp duty.
5. Restrictions of further issues: The company cannot raise further finance
through debentures as the debentures are under the part of security of the assets
already mortgaged to debenture holders.
INTERNAL FINANCE
A company can mobilize finance through external and internal sources. A new company
may not raise internal sources of finance and they can raise finance only external sources
such as shares, debentures and loans but an existing company can raise both internal and
external sources of finance for their financial requirements. Internal finance is also one of
the important sources of finance and it consists of cost of capital while compared to other
sources of finance.
Internal source of finance may be broadly classified into two categories:
A. Depreciation Funds
B. Retained earnings
Depreciation Funds
Depreciation funds are the major part of internal sources of finance, which is used to meet
the working capital requirements of the business concern. Depreciation means decrease in
the value of asset due to wear and tear, lapse of time, obsolescence, exhaustion and accident.
Generally depreciation is changed against fixed assets of the company at fixed rate for
every year. The purpose of depreciation is replacement of the assets after the expired
period. It is one kind of provision of fund, which is needed to reduce the tax burden and
overall profitability of the company.
Retained Earnings
Retained earnings are another method of internal sources of finance. Actually is not a
method of raising finance, but it is called as accumulation of profits by a company for its
expansion and diversification activities.
Retained earnings are called under different names such as; self finance, inter finance,
and plugging back of profits. According to the Companies Act 1956 certain percentage, as
prescribed by the central government (not exceeding 10%) of the net profits after tax of a
36 Financial Management
financial year have to be compulsorily transferred to reserve by a company before declaring
dividends for the year.
Under the retained earnings sources of finance, a part of the total profits is transferred
to various reserves such as general reserve, replacement fund, reserve for repairs and
renewals, reserve funds and secrete reserves, etc.
Advantages of Retained Earnings
Retained earnings consist of the following important advantages:
1. Useful for expansion and diversification: Retained earnings are most useful
to expansion and diversification of the business activities.
2. Economical sources of finance: Retained earnings are one of the least costly
sources of finance since it does not involve any floatation cost as in the case of
raising of funds by issuing different types of securities.
3. No fixed obligation: If the companies use equity finance they have to pay
dividend and if the companies use debt finance, they have to pay interest. But
if the company uses retained earnings as sources of finance, they need not pay
any fixed obligation regarding the payment of dividend or interest.
4. Flexible sources: Retained earnings allow the financial structure to remain
completely flexible. The company need not raise loans for further requirements,
if it has retained earnings.
5. Increase the share value: When the company uses the retained earnings as the
sources of finance for their financial requirements, the cost of capital is very cheaper
than the other sources of finance; Hence the value of the share will increase.
6. Avoid excessive tax: Retained earnings provide opportunities for evasion of
excessive tax in a company when it has small number of shareholders.
7. Increase earning capacity: Retained earnings consist of least cost of capital and
also it is most suitable to those companies which go for diversification and expansion.
Disadvantages of Retained Earnings
Retained earnings also have certain disadvantages:
1. Misuses: The management by manipulating the value of the shares in the stock
market can misuse the retained earnings.
2. Leads to monopolies: Excessive use of retained earnings leads to monopolistic
attitude of the company.
3. Over capitalization: Retained earnings lead to over capitalization, because if the
company uses more and more retained earnings, it leads to insufficient source
of finance.
4. Tax evasion: Retained earnings lead to tax evasion. Since, the company reduces
tax burden through the retained earnings.
Sources of Financing 37
5. Dissatisfaction: If the company uses retained earnings as sources of finance, the
shareholder can’t get more dividends. So, the shareholder does not like to use
the retained earnings as source of finance in all situations.
LOAN FINANCING
Loan financing is the important mode of finance raised by the company. Loan finance may
be divided into two types:
(a) Long-Term Sources
(b) Short-Term Sources
Loan finance can be raised through the following important institutions.
Loan Financing Institutions
Commercial Banks Development Banks Specialist Institutions
Direct
Finance
Indirect
Finance
Domestic
Finance
Foreign
Currency
Finance
Short-term
Advance
Long-term
Loans
Fig. 3.1 Loan Financing
Financial Institutions
With the effect of the industrial revaluation, the government established nation wide and
state wise financial industries to provide long-term financial assistance to industrial concerns
in the country. Financial institutions play a key role in the field of industrial development
and they are meeting the financial requirements of the business concern. IFCI, ICICI, IDBI,
SFC, EXIM Bank, ECGC are the famous financial institutions in the country.
Commercial Banks
Commercial Banks normally provide short-term finance which is repayable within a year.
The major finance of commercial banks is as follows:
Short-term advance: Commercial banks provide advance to their customers with or
without securities. It is one of the most common and widely used short-term sources of
finance, which are needed to meet the working capital requirement of the company.
It is a cheap source of finance, which is in the form of pledge, mortgage, hypothecation
and bills discounted and rediscounted.
38 Financial Management
Short-term Loans
Commercial banks also provide loans to the business concern to meet the short-term
financial requirements. When a bank makes an advance in lump sum against some security
it is termed as loan. Loan may be in the following form:
(a) Cash credit: A cash credit is an arrangement by which a bank allows his customer
to borrow money up to certain limit against the security of the commodity.
(b) Overdraft: Overdraft is an arrangement with a bank by which a current account
holder is allowed to withdraw more than the balance to his credit up to a certain
limit without any securities.
Development Banks
Development banks were established mainly for the purpose of promotion and development
the industrial sector in the country. Presently, large number of development banks are
functioning with multidimensional activities. Development banks are also called as financial
institutions or statutory financial institutions or statutory non-banking institutions.
Development banks provide two important types of finance:
(a) Direct Finance
(b) Indirect Finance/Refinance
Some of the important development banks are discussed in Chapter 11.
Presently the commercial banks are providing all kinds of financial services including
development-banking services. And also nowadays development banks and specialisted
financial institutions are providing all kinds of financial services including commercial
banking services. Diversified and global financial services are unavoidable to the present
day economics. Hence, we can classify the financial institutions only by the structure and
set up and not by the services provided by them.
MODEL QUESTIONS
1. Explain the various sources of financing.
2. What is meant by security financing?
3. What is debt financing?
4. Critically examine the advantages and disadvantages of equity shares.
5. Discuss the features of equity shares.
6. What are the merits of the deferred shares?
7. Explain the merits and demerits of preference shares?
8. List out the types of debentures.
Sources of Financing 39
9. Evaluate the overall view of debentures.
10. How internal sources of finance is used in the industrial concern?
11. What is retained earnings?
12. Evaluate the advantages and disadvantages of retained earnings.
13. How does depreciation funds help the industrial concern as sources of finance?
14. Evaluate the overall structure of the loan financing?
15. Explain the Commercial Bank financing?
16. Enumerate the major development banks.
17. Explain the role of UTI and LIC in industrial financing?
18. What is cash credit?
19. Mention the functions of IFCI.
This page
intentionally left
blank
INTRODUCTION
Financial planning and decision play a major role in the field of financial management
which consists of the major area of financial management such as, capitalization, financial
structure, capital structure, leverage and financial forecasting.
Financial planning includes the following important parts:
● Estimating the amount of capital to be raised.
● Determining the form and proportionate amount of securities.
● Formulating policies to manage the financial plan.
MEANING OF CAPITAL
The term capital refers to the total investment of the company in terms of money, and
assets. It is also called as total wealth of the company. When the company is going to invest
large amount of finance into the business, it is called as capital. Capital is the initial and
integral part of new and existing business concern.
The capital requirements of the business concern may be classified into two categories:
(a) Fixed capital
(b) Working capital.
Fixed Capital
Fixed capital is the capital, which is needed for meeting the permanent or long-term purpose
of the business concern. Fixed capital is required mainly for the purpose of meeting capital
expenditure of the business concern and it is used over a long period. It is the amount
invested in various fixed or permanent assets, which are necessary for a business concern.
Definition of Fixed Capital
According to the definition of Hoagland, “Fixed capital is comparatively easily defined to
include land, building, machinery and other assets having a relatively permanent existence”.
42 Financial Management
Character of Fixed Capital
● Fixed capital is used to acquire the fixed assets of the business concern.
● Fixed capital meets the capital expenditure of the business concern.
● Fixed capital normally consists of long period.
● Fixed capital expenditure is of nonrecurring nature.
● Fixed capital can be raised only with the help of long-term sources of finance.
Working Capital
Working capital is the capital which is needed to meet the day-to-day transaction of the
business concern. It may cross working capital and net working capital. Normally working
capital consists of various compositions of current assets such as inventories, bills, receivable,
debtors, cash, and bank balance and prepaid expenses.
According to the definition of Bonneville, “any acquisition of funds which increases
the current assets increase the Working Capital also for they are one and the same”.
Working capital is needed to meet the following purpose:
● Purchase of raw material
● Payment of wages to workers
● Payment of day-to-day expenses
● Maintenance expenditure etc.
Working Capital
Capital Fixed Capital
Fig. 4.1 Position of Capital
CAPITALIZATION
Capitalization is one of the most important parts of financial decision, which is related to the
total amount of capital employed in the business concern.
Understanding the concept of capitalization leads to solve many problems in the field
of financial management. Because there is a confusion among the capital, capitalization
and capital structure.
Meaning of Capitalization
Capitalization refers to the process of determining the quantum of funds that a firm needs
to run its business. Capitalization is only the par value of share capital and debenture and
it does not include reserve and surplus.
Capitalization 43
Definition of Capitalization
Capitalization can be defined by the various financial management experts. Some of the
definitions are mentioned below:
According to Guthman and Dougall, “capitalization is the sum of the par value of
stocks and bonds outstanding”.
“Capitalization is the balance sheet value of stocks and bonds outstands”.
— Bonneville and Dewey
According to Arhur. S. Dewing, “capitalization is the sum total of the par value of all
shares”.
TYPES OF CAPITALIZATION
Capitalization may be classified into the following three important types based on its nature:
• Over Capitalization
• Under Capitalization
• Water Capitalization
Over Capitalization
Over capitalization refers to the company which possesses an excess of capital in relation
to its activity level and requirements. In simple means, over capitalization is more capital
than actually required and the funds are not properly used.
According to Bonneville, Dewey and Kelly, over capitalization means, “when a
business is unable to earn fair rate on its outstanding securities”.
Example
A company is earning a sum of Rs. 50,000 and the rate of return expected is 10%. This
company will be said to be properly capitalized. Suppose the capital investment of the
company is Rs. 60,000, it will be over capitalization to the extent of Rs. 1,00,000. The new
rate of earning would be:
50,000/60,000×100=8.33%
When the company has over capitalization, the rate of earnings will be reduced from
10% to 8.33%.
Causes of Over Capitalization
Over capitalization arise due to the following important causes:
• Over issue of capital by the company.
• Borrowing large amount of capital at a higher rate of interest.
• Providing inadequate depreciation to the fixed assets.
44 Financial Management
• Excessive payment for acquisition of goodwill.
• High rate of taxation.
• Under estimation of capitalization rate.
Effects of Over Capitalization
Over capitalization leads to the following important effects:
• Reduce the rate of earning capacity of the shares.
• Difficulties in obtaining necessary capital to the business concern.
• It leads to fall in the market price of the shares.
• It creates problems on re-organization.
• It leads under or misutilisation of available resources.
Remedies for Over Capitalization
Over capitalization can be reduced with the help of effective management and systematic
design of the capital structure. The following are the major steps to reduce over capitalization.
• Efficient management can reduce over capitalization.
• Redemption of preference share capital which consists of high rate of dividend.
• Reorganization of equity share capital.
• Reduction of debt capital.
Under Capitalization
Under capitalization is the opposite concept of over capitalization and it will occur when
the company’s actual capitalization is lower than the capitalization as warranted by its
earning capacity. Under capitalization is not the so called inadequate capital.
Under capitalization can be defined by Gerstenberg, “a corporation may be under
capitalized when the rate of profit is exceptionally high in the same industry”.
Hoagland defined under capitalization as “an excess of true assets value over the
aggregate of stocks and bonds outstanding”.
Causes of Under Capitalization
Under capitalization arises due to the following important causes:
• Under estimation of capital requirements.
• Under estimation of initial and future earnings.
• Maintaining high standards of efficiency.
• Conservative dividend policy.
• Desire of control and trading on equity.
Effects of Under Capitalization
Under Capitalization leads certain effects in the company and its shareholders.
• It leads to manipulate the market value of shares.
• It increases the marketability of the shares.
Capitalization 45
• It may lead to more government control and higher taxation.
• Consumers feel that they are exploited by the company.
• It leads to high competition.
Remedies of Under Capitalization
Under Capitalization may be corrected by taking the following remedial measures:
1. Under capitalization can be compensated with the help of fresh issue of shares.
2. Increasing the par value of share may help to reduce under capitalization.
3. Under capitalization may be corrected by the issue of bonus shares to the existing
shareholders.
4. Reducing the dividend per share by way of splitting up of shares.
Watered Capitalization
If the stock or capital of the company is not mentioned by assets of equivalent value, it is
called as watered stock. In simple words, watered capital means that the realizable value of
assets of the company is less than its book value.
According to Hoagland’s definition, “A stock is said to be watered when its true value
is less than its book value.”
Causes of Watered Capital
Generally watered capital arises at the time of incorporation of a company but it also arises
during the life time of the business. The following are the main causes of watered capital:
1. Acquiring the assets of the company at high price.
2. Adopting ineffective depreciation policy.
3. Worthless intangible assets are purchased at higher price.
MODEL QUESTIONS
1. What is capital and define the capital?
2. Explain the types of capital.
3. What is capitalization?
4. What are the kinds of capitalization?
5. Explain the effects of under capitalization.
6. Discuss the causes of over capitalization.
This page
intentionally left
blank
INTRODUCTION
Capital is the major part of all kinds of business activities, which are decided by the size,
and nature of the business concern. Capital may be raised with the help of various sources.
If the company maintains proper and adequate level of capital, it will earn high profit and
they can provide more dividends to its shareholders.
Meaning of Capital Structure
Capital structure refers to the kinds of securities and the proportionate amounts that make
up capitalization. It is the mix of different sources of long-term sources such as equity
shares, preference shares, debentures, long-term loans and retained earnings.
The term capital structure refers to the relationship between the various long-term
source financing such as equity capital, preference share capital and debt capital. Deciding
the suitable capital structure is the important decision of the financial management because
it is closely related to the value of the firm.
Capital structure is the permanent financing of the company represented primarily by
long-term debt and equity.
Definition of Capital Structure
The following definitions clearly initiate, the meaning and objective of the capital structures.
According to the definition of Gerestenbeg, “Capital Structure of a company refers
to the composition or make up of its capitalization and it includes all long-term capital
resources”.
According to the definition of James C. Van Horne, “The mix of a firm’s permanent
long-term financing represented by debt, preferred stock, and common stock equity”.
According to the definition of Presana Chandra, “The composition of a firm’s
financing consists of equity, preference, and debt”.
48 Financial Management
According to the definition of R.H. Wessel, “The long term sources of fund employed
in a business enterprise”.
FINANCIAL STRUCTURE
The term financial structure is different from the capital structure. Financial structure
shows the pattern total financing. It measures the extent to which total funds are available
to finance the total assets of the business.
Financial Structure = Total liabilities
Or
Financial Structure = Capital Structure + Current liabilities.
The following points indicate the difference between the financial structure and capital
structure.
Financial Structures Capital Structures
1. It includes both long-term and short-term sources of funds 1. It includes only the long-term sources
of funds.
2. It means the entire liabilities side of the balance sheet. 2. It means only the long-term liabilities
of the company.
3. Financial structures consist of all sources of capital. 3. It consist of equity, preference and
retained earning capital.
4. It will not be more important while determining the 4. It is one of the major determinations of
value of the firm. the value of the firm.
Example
From the following information, calculate the capitalization, capital structure and financial
structures.
Balance Sheet
Liabilities Assets
Equity share capital 50,000 Fixed assets 25,000
Preference share capital 5,000 Good will 10,000
Debentures 6,000 Stock 15,000
Retained earnings 4,000 Bills receivable 5,000
Bills payable 2,000 Debtors 5,000
Creditors 3,000 Cash and bank 10,000
70,000 70,000
(i) Calculation of Capitalization
S. No. Sources Amount
1. Equity share capital 50,000
2. Preference share capital 5,000
3. Debentures 6,000
Capitalization 61,000
Capital Structure 49
(ii) Calculation of Capital Structures
S. No. Sources Amount Proportion
1. Equity share capital 50,000 76.92
2. Preference share capital 5,000 7.69
3. Debentures 6,000 9.23
4. Retained earnings 4,000 6.16
65,000 100%
(iii) Calculation of Financial Structure
S. No. Sources Amount Proportion
1. Equity share capital 50,000 71.42
2. Preference share capital 5,000 7.14
3. Debentures 6,000 8.58
4 . Retained earnings 4,000 5.72
5. Bills payable 2,000 2.85
6. Creditors 3,000 4.29
70,000 100%
OPTIMUM CAPITAL STRUCTURE
Optimum capital structure is the capital structure at which the weighted average cost of
capital is minimum and thereby the value of the firm is maximum.
Optimum capital structure may be defined as the capital structure or combination of
debt and equity, that leads to the maximum value of the firm.
Objectives of Capital Structure
Decision of capital structure aims at the following two important objectives:
1. Maximize the value of the firm.
2. Minimize the overall cost of capital.
Forms of Capital Structure
Capital structure pattern varies from company to company and the availability of finance.
Normally the following forms of capital structure are popular in practice.
• Equity shares only.
• Equity and preference shares only.
• Equity and Debentures only.
• Equity shares, preference shares and debentures.
50 Financial Management
FACTORS DETERMINING CAPITAL STRUCTURE
The following factors are considered while deciding the capital structure of the firm.
Leverage
It is the basic and important factor, which affect the capital structure. It uses the fixed cost
financing such as debt, equity and preference share capital. It is closely related to the
overall cost of capital.
Cost of Capital
Cost of capital constitutes the major part for deciding the capital structure of a firm.
Normally long- term finance such as equity and debt consist of fixed cost while mobilization.
When the cost of capital increases, value of the firm will also decrease. Hence the firm
must take careful steps to reduce the cost of capital.
(a) Nature of the business: Use of fixed interest/dividend bearing finance depends
upon the nature of the business. If the business consists of long period of
operation, it will apply for equity than debt, and it will reduce the cost of capital.
(b) Size of the company: It also affects the capital structure of a firm. If the firm
belongs to large scale, it can manage the financial requirements with the help of
internal sources. But if it is small size, they will go for external finance. It consists
of high cost of capital.
(c) Legal requirements: Legal requirements are also one of the considerations while
dividing the capital structure of a firm. For example, banking companies are
restricted to raise funds from some sources.
(d) Requirement of investors: In order to collect funds from different type of
investors, it will be appropriate for the companies to issue different sources of
securities.
Government policy
Promoter contribution is fixed by the company Act. It restricts to mobilize large, long-
term funds from external sources. Hence the company must consider government policy
regarding the capital structure.
CAPITAL STRUCTURE THEORIES
Capital structure is the major part of the firm’s financial decision which affects the value of
the firm and it leads to change EBIT and market value of the shares. There is a relationship
among the capital structure, cost of capital and value of the firm. The aim of effective capital
structure is to maximize the value of the firm and to reduce the cost of capital.
There are two major theories explaining the relationship between capital structure,
cost of capital and value of the firm.
Capital Structure 51
Capital Structure Theories
M odern Approach Traditional Approach
Net Income
Approach
Net Operating Income
Approach
M odigliani-M iller
Approach
Fig. 5.1 Capital Structure Theories
Traditional Approach
It is the mix of Net Income approach and Net Operating Income approach. Hence, it is also
called as intermediate approach. According to the traditional approach, mix of debt and
equity capital can increase the value of the firm by reducing overall cost of capital up to
certain level of debt. Traditional approach states that the Ko
decreases only within the
responsible limit of financial leverage and when reaching the minimum level, it starts
increasing with financial leverage.
Assumptions
Capital structure theories are based on certain assumption to analysis in a single and
convenient manner:
• There are only two sources of funds used by a firm; debt and shares.
• The firm pays 100% of its earning as dividend.
• The total assets are given and do not change.
• The total finance remains constant.
• The operating profits (EBIT) are not expected to grow.
• The business risk remains constant.
• The firm has a perpetual life.
• The investors behave rationally.
Exercise 1
ABC Ltd., needs Rs. 30,00,000 for the installation of a new factory. The new factory
expects to yield annual earnings before interest and tax (EBIT) of Rs.5,00,000. In choosing
a financial plan, ABC Ltd., has an objective of maximizing earnings per share (EPS). The
company proposes to issuing ordinary shares and raising debit of Rs. 3,00,000 and Rs.
10,00,000 of Rs. 15,00,000. The current market price per share is Rs. 250 and is expected
to drop to Rs. 200 if the funds are borrowed in excess of Rs. 12,00,000. Funds can be
raised at the following rates.
52 Financial Management
–up to Rs. 3,00,000 at 8%
–over Rs. 3,00,000 to Rs. 15,000,00 at 10%
–over Rs. 15,00,000 at 15%
Assuming a tax rate of 50% advise the company.
Solution
Earnings Before Interest and Tax (BIT) less Interest Earnings Before Tax less: Tax@50%.
Alternatives
I II III
(Rs. 3,00,000 debt) Rs. 10,00,000 debt) (Rs. 15,00,000 debt)
5,00,000 5,00,000 5,00,000
24,000 1,00,000 2,25,000
4,76,000 4,00,000 2,75,000
2,38,000 2,00,000 1,37,500
2,38,000 2,00,000 1,37,500
27,00,000 20,00,000 15,00,000
250 250 200
10800 8,000 7,500
2,38,000 2,00,000 1,37,500
No. of shares 10,800 8,000 7,500
Earnings per share 22.03 25 18.33
The secure alternative which gives the highest earnings per share is the best. Therefore
the company is advised to revise Rs. 10,00,000 through debt amount Rs. 20,00,000 through
ordinary shares.
Exercise 2
Compute the market value of the firm, value of shares and the average cost of capital from
the following information.
Net operating income Rs. 1,00,000
Total investment Rs. 5,00,000
Equity capitalization Rate:
(a) If the firm uses no debt 10%
(b) If the firm uses Rs. 25,000 debentures 11%
(c) If the firm uses Rs. 4,00,000 debentures 13%
Assume that Rs. 5,00,000 debentures can be raised at 6% rate of interest whereas
Rs. 4,00,000 debentures can be raised at 7% rate of interest.
Solution
Computation of market value of firm value of shares and the average cost of capital.
Capital Structure 53
Particulars (a) No Debt (b) Rs. 2,50,000 (c) Rs. 4,00,000
6% debentures 7% debentures
Net operating system 1,00,000 1,00,000 1,00,000
(–) Interest (i.e.)
Cost of debt _ 15,000 28,000
Earnings available to
Equity shareholders 1,00,000 85,000 72,000
Equity Capitalization Rate 10% 11% 13%
Market value of shares ×
10
10,000
100
×
100
85,000
11
×
100
72,000
13
Rs. 10,00,000/- Rs.772727/- Rs.553846/-
Market Value of firm 10,00,000 10,22,727 9,53,846
1,00,000 1,00,000 1,00,000
Average cost of capital ×
1,00,000
100
10,00,000
×
1 00 000
100
10 22 727
, ,
, ,
×
1 00 000
100
9 53 846
, ,
, ,
Earnings
Valueof thefirm
EBIT
V
=10% =9.78% =10.48%
Comments
From the above data, if debt of Rs. 2,50,000 is used, the value of the firm increases and the
overall cost of capital decreases. But, if more debt is used to finance in place of equity i.e.,
Rs. 4,00,000 debentures, the value of the firm decreases and the overall cost of capital
increases.
Net Income (NI) Approach
Net income approach suggested by the Durand. According to this approach, the capital
structure decision is relevant to the valuation of the firm. In other words, a change in the
capital structure leads to a corresponding change in the overall cost of capital as well as the
total value of the firm.
According to this approach, use more debt finance to reduce the overall cost of capital
and increase the value of firm.
Net income approach is based on the following three important assumptions:
1. There are no corporate taxes.
2. The cost debt is less than the cost of equity.
3. The use of debt does not change the risk perception of the investor.
54 Financial Management
where
V = S+B
V = Value of firm
S = Market value of equity
B = Market value of debt
Market value of the equity can be ascertained by the following formula:
S =
e
NI
K
where
NI = Earnings available to equity shareholder
Ke
= Cost of equity/equity capitalization rate
Format for calculating value of the firm on the basis of NI approach.
Particulars Amount
Net operating income (EBIT) XXX
Less: interest on debenture (i) XXX
Earnings available to equity holder (NI) XXX
Equity capitalization rate (Ke
) XXX
Market value of equity (S) XXX
Market value of debt (B) XXX
Total value of the firm (S+B) XXX
Overall cost of capital = Ko
= EBIT/V(%) XXX%
Exercise 3
(a) A Company expects a net income of Rs. 1,00,000. It has Rs. 2,50,000, 8% debentures.
The equality capitalization rate of the company is 10%. Calculate the value of
the firm and overall capitalization rate according to the net income approach
(ignoring income tax).
(b) If the debenture debts are increased to Rs. 4,00,000. What shall be the value of
the firm and the overall capitalization rate?
Solution
(a) Capitalization of the value of the firm
Rs.
Net income 1,00,000
Less: Interest on 8% Debentures of Rs. 2,50,000 20,000
Earnings available to equality shareholders 80,000
Equity capitalization rate 10%
= ×
80,000
100
10
Capital Structure 55
Market value of equity = 8,00,000
Market value of debentures = 2,50,000
Value of the firm = 10,50,000
Calculation of overall capitalization rate
Overall cost of capital (Ko
) =
Earnings
Valueof thefirm
EBIT
V
=
1,00,000
10,50,000
×100
= 9.52%
(b) Calculation of value of the firm if debenture debt is raised to Rs. 3,00,000.
Rs.
Net income 1,00,000
Less: Interest on 8% Debentures of Rs. 4,00,000 32,000
Equity Capitalization rate 68,000
10%
Market value of equity = 68,000 ×
100
10
= 6,80,000
= 6,80,000
Market value of Debentures = 4,00,000
Value of firm = 10,80,000
Overall cost of capital =
1,00,000
10,80,000
×10
= 9.26%
Thus, it is evident that with the increase in debt financing, the value of the firm has
increased and the overall cost of capital has increased.
Net Operating Income (NOI) Approach
Another modern theory of capital structure, suggested by Durand. This is just the opposite
to the Net Income approach. According to this approach, Capital Structure decision is
irrelevant to the valuation of the firm. The market value of the firm is not at all affected by
the capital structure changes.
According to this approach, the change in capital structure will not lead to any change
in the total value of the firm and market price of shares as well as the overall cost of capital.
56 Financial Management
NI approach is based on the following important assumptions;
The overall cost of capital remains constant;
There are no corporate taxes;
The market capitalizes the value of the firm as a whole;
Value of the firm (V) can be calculated with the help of the following formula
V =
o
EBIT
K
Where,
V = Value of the firm
EBIT = Earnings before interest and tax
Ko
= Overall cost of capital
Exercise 4
XYZ expects a net operating income of Rs. 2,00,000. It has 8,00,000, 6% debentures.
The overall capitalization rate is 10%. Calculate the value of the firm and the equity
capitalization rate (Cost of Equity) according to the net operating income approach.
If the debentures debt is increased to Rs. 10,00,000. What will be the effect on volume
of the firm and the equity capitalization rate?
Solution
Net operating income = Rs. 2,00,000
Overall cost of capital = 10%
Market value of the firm (V)
=
o
EBIT
K
= 2,00,000×
100
10
= Rs. 20,00,000
Market value of the firm = Rs. 20,00,000
Less: market value of Debentures= Rs. 8,00,000
12,00,000
Equity capitalization rate (or) cost of equity (Ke)
=
−
−
EBIT I
V D
Where, V = value of the firm
D = value of the debt capital
=
−
2,00,000– 48,000
20,00,000 8,00,000
×100
=12.67%
Capital Structure 57
If the debentures debt is increased to Rs. 10,00,000, the value of the firm shall remain
changed to Rs. 20,00,000. The equity capitalization rate will increase as follows:
=
−
−
EBIT I
V D
=
−
2,00,000–60,000
20,00,000 10,00,000
×100
=
1,40,000
10,00,000
×100
= 14%.
Exercise 5
Abinaya company Ltd. expresses a net operating income of Rs. 2,00,000. It has
Rs. 8,00,000 to 7% debentures. The overall capitalization rate is 10%.
(a) Calculate the value of the firm and the equity captialization rate (or) cost of equity
according to the net operating income approach.
(b) If the debenture debt is increasesd to Rs. 12,00,000. What will be the effect on
the value of the firm, the equity capitalization rate?
Solution
(a) Net operating income = Rs. 2,00,000
Over all cost of capital = 10%
Market value of the firm (V)
NOI(EBIT)
Overallcostof capital(OK)
= 2,00,000×100/10
= Rs. 20,00,000
Market value of firm = Rs. 20,00,000
Less Market value of debentures = Rs. 8,00,000
Total marketing value of equity = Rs. 12,00,000
Equity capitalization rate (or) cost of equity (Ke)
=
−
−
EBIT I
V D
=
2,00,000 56,000
20,00,000 8,00,000
−
−
×100
=
1,44,000
12,00,000
×100
= 12%
58 Financial Management
where I = Interest of debt
V = Value of the firm
D = Value of debt capital
I = 8,00,000×7%=56,000
V = 20,00,000
D = 8,00,000
(b) If the debenture debt is increased at Rs. 12,00,000, the value of the firm shall
changed to Rs. 20,00,000.
Equity Capitalization Rate (Ke)
=
−
−
EBIT I
V D
=
2,00,000 84,000
20,00,000 12,00,000
−
−
= 14.5%
where I= 12,00,000 at 7% = 84,000
Modigliani and Miller Approach
Modigliani and Miller approach states that the financing decision of a firm does not affect
the market value of a firm in a perfect capital market. In other words MM approach maintains
that the average cost of capital does not change with change in the debt weighted equity mix
or capital structures of the firm.
Modigliani and Miller approach is based on the following important assumptions:
• There is a perfect capital market.
• There are no retained earnings.
• There are no corporate taxes.
• The investors act rationally.
• The dividend payout ratio is 100%.
• The business consists of the same level of business risk.
Value of the firm can be calculated with the help of the following formula:
−
o
EBIT
(l t)
K
Where
EBIT = Earnings before interest and tax
Ko
= Overall cost of capital
t = Tax rate
Capital Structure 59
Ke
Ko
k
D/E
Risk Due Debt
Risk Bearing Debt
R
ate
o
f
R
etu
rn
Fig. 5.2 Modigliani and Miller Approach
Exercise 6
There are two firms ‘A’ and ‘B’ which are exactly identical except that A does not use
any debt in its financing, while B has Rs. 2,50,000 , 6% Debentures in its financing. Both
the firms have earnings before interest and tax of Rs. 75,000 and the equity capitalization
rate is 10%. Assuming the corporation tax is 50%, calculate the value of the firm.
Solution
The market value of firm A which does not use any debt.
Vu=
o
EBIT
K
=
75,000
10/100
=75,000×100/10
= Rs. 7,50,000
The market value of firm B which uses debt financing of Rs. 2,50,000
Vt = Vu + t
Vu = 7,50,000, t = 50% of Rs. 2,50,000
= 7,50,000 + 1,25,000
= Rs. 8,75,000
Exercise 7
The following data regarding the two companies ‘X’ and ‘Y’ belonging to the same
equivalent class:
60 Financial Management
Company ‘X’ Company ‘Y’
Number of ordinary shares 75,000 1,25,000
5% debentures 40,000 –
Market price per shares Rs. 1.25 Rs. 1.00
Profit before interest Rs. 25,000 Rs. 25,000
All profits after paying debenture interest are distributed as dividends.
You are required to explain how under Modigliani and Miller approach, an investor holding
10% of shares in company ‘X’ will be better off in switching his holding to company ‘Y’.
Solution
As per the opinion of Modigliani and Miller, two similar firms in all respects except
their capital structure cannot have different market values because of arbitrage process.
In case two similar firms except for their capital structure have different market values,
arbitrage will take place and the investors will engage in ‘personal leverage’ as against the
corporate leverage. In the given problem, the arbitrage will work out as below.
1. The investor will sell in the market 10% of shares in company ‘X’ for
75,000×10/100×1.25=Rs. 9375
2. He will raise a loan of Rs. 40,000×10/100=Rs. 4000
To take advantage of personal leverage as against the corporate leverage the company
‘Y’ does not use debt content in its capital structure. He will put 13375 shares in company
‘Y’ with the total amount realized from 1 and 2 i.e., Rs. 9375 plus Rs. 4000. Thus he will
have 10.7% of shares in company ‘Y’.
The investor will gain by switching his holding as below:
Present income of the investor in company ‘X’ Rs.
Profit before Interest of the Company 25,000
Less: Interest on Debentures 5% 2,000
Profit after Interest 23,000
Share of the investor = 10% of Rs. 23,000 i.e., Rs. 2300
Income of the investor after switching holding to company
Profit before Interest of the company Rs. 25,000
Less Interest ——
Profit after Interest 25,000
Share of the investor : 25,000×
13,375
1,25,000 = Rs. 2,675
Interest paid on loan taken 4000×5/100 200
Net Income of the Investor 2,475
Capital Structure 61
As the net income of the investor in company ‘Y’ is higher than the cost of income
from company ‘X’ due to switching the holding, the investor will gain in switching his
holdings to company ‘Y’.
Exercise 8
Paramount Products Ltd. wants to raise Rs. 100 lakh for diversification project. Current
estimates of EBIT from the new project is Rs. 22 lakh p.a.
Cost of debt will be 15% for amounts up to and including Rs. 40 lakh, 16% for additional
amounts up to and including Rs. 50 lakh and 18% for additional amounts above Rs. 50 lakh.
The equity shares (face value of Rs. 10) of the company have a current market value of
Rs. 40. This is expected to fall to Rs. 32 if debts exceeding Rs. 50 lakh are raised. The
following options are under consideration of the company.
Option Debt Equity
I 50% 50%
II 40% 60%
III 60% 40%
Determine EPS for each option and state which option should the Company adopt.
Tax rate is 50%. (ICWA Inter Dec. 1997)
Solution
I II III
Equity 50,00,000 60,00,000 40,00,000
Debt 50,00,000 40,00,000 60,00,000
Amount to be raised 1,00,00,000 1,00,00,000 1,00,00,000
EBIT 22,00,000 22,00,000 22,00,000
Less: Interest of Debt 7,60,000 6,00,000 9,40,000
PBT 14,40,000 16,00,000 12,60,000
Less : Tax @ 50% 7,20,000 8,00,000 6,30,000
PAT 7,20,000 8,00,000 6,30,000
No. of equity shares 1,25,000 1,50,000 1,25,000
Rs. 5.76 Rs. 5.33 Rs. 5.04
Working Notes
Calculation of Interest on Debt
Total Debt I II III
Interest on: 50,00,000 40,00,000 60,00,000
Ist Rs. 40,00,000 @ 15% 6,00,000 6,00,000 6,00,000
Next Rs.10,00,000 @ 16% 1,60,000 – 1,60,000
Balance Rs. 10,00,000 @ 18% – – 1,80,000
7,60,000 6,00,000 9,40,000
62 Financial Management
Exercise 9
The following is the data regarding two Company’s. X and Y belonging to the same
risk class.
X Y
No. of ordinary shares 90,000 1,50,000
Market price/share (Rs.) 1.2 1.0
6% debentures 60,000 –
Profit before interest 18,000 18,000
All profits after interest are distributed as dividend.
Explain how under Modigliani & Miller Approach an investor holding 10% of shares
in Company X will be better off in switching his holding to Company Y.
(CA Final Nov. 1993)
Solution
Both the firms have EBIT of Rs. 18,000. Company X has to pay interest of Rs. 3600
(i.e., 6% on Rs. 60,000) and the remaining profit of Rs. 14,400 is being distributed among
the shareholders. The Company Y on the other hand has no interest liability and therefore
is distributing Rs.18,000 among the shareholders.
The investor will be well off under MM Model by selling the shares of X and shifting to
shares of Y company through the arbitrage process as follows. If he sells shares of X
Company He gets Rs. 10,800 (9,000 shares @ Rs.1.2 per share). He now takes a 6% loan
of Rs.6,000
(i.e. 105 of Rs. 60,000) and out of the total cash of Rs. 16,800 he purchases 10% of
shares of Company Y for Rs. 15,000; his position with regard to Company Y would be as
follows:
X Y
Dividends (10% of Profits) 1,440 1,800
Less:Interest (6% on Rs. 6,000) – 360
Net Income 1,440 1,440
Thus by shifting from Company Y the investor is able to get the same income of Rs.
1,440 and still having funds of Rs. 1,800 (i.e., Rs. 16,800 – 15,000) at his disposal. He is
better off not in terms of income but in terms of having capital of Rs. 1,800 with him
which he can invest elsewhere.
Exercise 10
Gentry Motors Ltd., a producer of turbine generators, is in this situation; EBIT = Rs. 40
lac. rate =35%, dept. outstanding = D = Rs. 20 lac., rate of Interest =10%, Ke = 15%,
shares of stock outstanding = No. = Rs. 6,00,000 and book value per share = Rs. 10.
Since Gentry’s product market is stable and the Company expects no growth, all earnings are
paid out as dividends. The debt consists of perpetual bonds. What are the Gentry’s EBS and
its price per share, Po
? (CS Final Dec. 1998)
Capital Structure 63
Solution
(a) EBIT 40,00,000
interest @ 10%
2,00,000
38,00,000
Tax @ 35%
13,30,000
24,70,000
No. of shares 6,00,000
EPS (or Dividend) Rs. 4.12
Ke (given) 15%
Po (i.e., D/Ke) 4.12/.15
⇒ Rs. 27.47
In the same question if the Company increases its debt by Rs. 80 lakh to a total of Rs.
1 crore using the new debt to buy and retire of its shares at current price, its interest rate
on debt will be 12% and its cost of equity will rise from 15% to 17%. EBIT will remain
constant, should this Company change its capital structure.
If Company decides to increase its debt by Rs. 80 lacs, the Company may buy back
80,00,000 ÷ 27.47 = 2,91,226 shares. Thereafter the remaining no. of shares would be
3,08,774 (i.e., 6,00,000 – 2,91,226).
The market price of the share may be ascertained as follows:
EBIT 40,00,000
Interest @ 12% on Rs. 1 crore 12,00,000
28,00,000
Tax @ 35% 9,80,000
18,20,000
No. of equity shares 3,08,774
EPS Rs. 5.89
Ke 17%
Po (i.e., D/Ke) 5.89
.17
= Rs. 34.64
As the price is expected to rise from 27.47 to Rs 34.64, the Company may change its
capital structure by raising debt and retaining some number of shares.
64 Financial Management
MODEL QUESTIONS
1. Define capital structure.
2. Differentiate the capital structure and financial structure.
3. What is optimum capital structure?
4. Discuss the various factors affecting the capital structure.
5. Explain the capital structure theories.
6. XYZ Ltd., expects a net income of Rs. 1,50,000. The company has 10% of
5,00,000 Debentures. The equity capitalization rate of the company is 10%.
(a) Calculate the value of the firm and overall capitalization rate according to
the net income approach (ignoring income tax).
(b) If the debenture debt is increased to Rs. 7,50,000 and interest of debt is change
to 9%. What is the value of the firm and overall capitalization rate?
(Ans. (a) Rs. 15,00,000, 10% (b) Rs. 15,75,000 and 9.52%)
7. A Company Ltd., projected net operating income of Rs. 75,000. It has Rs. 3,00,000,
8% debentures.
(a) Calculate the value of the firm according to 10 net opening income and overall
capitalization rate is 10%.
(b) If debenture debt is increased to Rs. 5,00,000. What is the value of the firm
and the equity capitalization rate? (Ans. (a) Rs. 7,50,000, (b) 11.33%, 14%)
8. According to Traditional approach, compute the market value of the firm, value
of shares and the average cost of capital from the following information:
Net Operating Income 1,00,000
Total Investment 7,00,000
Equity capitalization Rate:
(a) if the firms uses no debt 7%.
(b) if the firm uses Rs. 2,00,000 debentures 8%
(c) if the firm uses Rs. 4,00,000 debentures 9%
Assume that Rs 2,00,000 debentures at 6% rate of interest whereas Rs. 4,00,000
debentures at 6% rate of interest whereas Rs. 4,00,000 debentures at 7% rate of
interest. (Ans. 7%, 7.69%, 8.33)
INTRODUCTION
Cost of capital is an integral part of investment decision as it is used to measure the worth
of investment proposal provided by the business concern. It is used as a discount rate in
determining the present value of future cash flows associated with capital projects. Cost of
capital is also called as cut-off rate, target rate, hurdle rate and required rate of return.
When the firms are using different sources of finance, the finance manager must take
careful decision with regard to the cost of capital; because it is closely associated with the
value of the firm and the earning capacity of the firm.
Meaning of Cost of Capital
Cost of capital is the rate of return that a firm must earn on its project investments to
maintain its market value and attract funds.
Cost of capital is the required rate of return on its investments which belongs to equity,
debt and retained earnings. If a firm fails to earn return at the expected rate, the market
value of the shares will fall and it will result in the reduction of overall wealth of the
shareholders.
Definitions
The following important definitions are commonly used to understand the meaning and
concept of the cost of capital.
According to the definition of John J. Hampton “ Cost of capital is the rate of return
the firm required from investment in order to increase the value of the firm in the market
place”.
According to the definition of Solomon Ezra, “Cost of capital is the minimum required
rate of earnings or the cut-off rate of capital expenditure”.
66 Financial Management
According to the definition of James C. Van Horne, Cost of capital is “A cut-off rate for
the allocation of capital to investment of projects. It is the rate of return on a project that
will leave unchanged the market price of the stock”.
According to the definition of William and Donaldson, “Cost of capital may be defined
as the rate that must be earned on the net proceeds to provide the cost elements of the
burden at the time they are due”.
Assumption of Cost of Capital
Cost of capital is based on certain assumptions which are closely associated while calculating
and measuring the cost of capital. It is to be considered that there are three basic concepts:
1. It is not a cost as such. It is merely a hurdle rate.
2. It is the minimum rate of return.
3. It consis of three important risks such as zero risk level, business risk and financial risk.
Cost of capital can be measured with the help of the following equation.
K = rj + b + f.
Where,
K = Cost of capital.
rj = The riskless cost of the particular type of finance.
b = The business risk premium.
f = The financial risk premium.
CLASSIFICATION OF COST OF CAPITAL
Cost of capital may be classified into the following types on the basis of nature and usage:
• Explicit and Implicit Cost.
• Average and Marginal Cost.
• Historical and Future Cost.
• Specific and Combined Cost.
Explicit and Implicit Cost
The cost of capital may be explicit or implicit cost on the basis of the computation of cost
of capital.
Explicit cost is the rate that the firm pays to procure financing. This may be calculated
with the help of the following equation;
CIo =
= +
∑
n
t
t
t 1
CO
(t C)
Where,
CIo = initial cash inflow
C = outflow in the period concerned
Cost of Captial 67
N = duration for which the funds are provided
T = tax rate
Implicit cost is the rate of return associated with the best investment opportunity for
the firm and its shareholders that will be forgone if the projects presently under
consideration by the firm were accepted.
Average and Marginal Cost
Average cost of capital is the weighted average cost of each component of capital employed
by the company. It considers weighted average cost of all kinds of financing such as equity,
debt, retained earnings etc.
Marginal cost is the weighted average cost of new finance raised by the company. It is
the additional cost of capital when the company goes for further raising of finance.
Historical and Future Cost
Historical cost is the cost which as already been incurred for financing a particular project.
It is based on the actual cost incurred in the previous project.
Future cost is the expected cost of financing in the proposed project. Expected cost is
calculated on the basis of previous experience.
Specific and Combine Cost
The cost of each sources of capital such as equity, debt, retained earnings and loans is
called as specific cost of capital. It is very useful to determine the each and every specific
source of capital.
The composite or combined cost of capital is the combination of all sources of capital.
It is also called as overall cost of capital. It is used to understand the total cost associated
with the total finance of the firm.
IMPORTANCE OF COST OF CAPITAL
Computation of cost of capital is a very important part of the financial management to
decide the capital structure of the business concern.
Importance to Capital Budgeting Decision
Capital budget decision largely depends on the cost of capital of each source. According to
net present value method, present value of cash inflow must be more than the present
value of cash outflow. Hence, cost of capital is used to capital budgeting decision.
Importance to Structure Decision
Capital structure is the mix or proportion of the different kinds of long term securities.
A firm uses particular type of sources if the cost of capital is suitable. Hence, cost of capital
helps to take decision regarding structure.
68 Financial Management
Importance to Evolution of Financial Performance
Cost of capital is one of the important determine which affects the capital budgeting, capital
structure and value of the firm. Hence, it helps to evaluate the financial performance of the firm.
Importance to Other Financial Decisions
Apart from the above points, cost of capital is also used in some other areas such as, market
value of share, earning capacity of securities etc. hence, it plays a major part in the financial
management.
COMPUTATION OF COST OF CAPITAL
Computation of cost of capital consists of two important parts:
1. Measurement of specific costs
2. Measurement of overall cost of capital
Measurement of Cost of Capital
It refers to the cost of each specific sources of finance like:
• Cost of equity
• Cost of debt
• Cost of preference share
• Cost of retained earnings
Cost of Equity
Cost of equity capital is the rate at which investors discount the expected dividends of the
firm to determine its share value.
Conceptually the cost of equity capital (Ke) defined as the “Minimum rate of return
that a firm must earn on the equity financed portion of an investment project in order to
leave unchanged the market price of the shares”.
Cost of equity can be calculated from the following approach:
• Dividend price (D/P) approach
• Dividend price plus growth (D/P + g) approach
• Earning price (E/P) approach
• Realized yield approach.
Dividend Price Approach
The cost of equity capital will be that rate of expected dividend which will maintain the
present market price of equity shares.
Dividend price approach can be measured with the help of the following formula:
e
p
D
K =
N
Cost of Captial 69
Where,
Ke = Cost of equity capital
D = Dividend per equity share
Np = Net proceeds of an equity share
Exercise 1
A company issues 10,000 equity shares of Rs. 100 each at a premium of 10%. The
company has been paying 25% dividend to equity shareholders for the past five years and
expects to maintain the same in the future also. Compute the cost of equity capital. Will it
make any difference if the market price of equity share is Rs. 175?
Solution
Ke =
p
D
N
=
25
100
× 100
= 22.72%
If the market price of a equity share is Rs. 175.
=
e
p
D
K
N
=
25
175
× 100
= 14.28%
Dividend Price Plus Growth Approach
The cost of equity is calculated on the basis of the expected dividend rate per share plus
growth in dividend. It can be measured with the help of the following formula:
= +
e
p
D
K g
N
Where,
Ke = Cost of equity capital
D = Dividend per equity share
g = Growth in expected dividend
Np = Net proceeds of an equity share
Exercise 2
(a) A company plans to issue 10000 new shares of Rs. 100 each at a par. The
floatation costs are expected to be 4% of the share price. The company pays a
dividend of Rs. 12 per share initially and growth in dividends is expected to be 5%.
Compute the cost of new issue of equity shares.
70 Financial Management
(b) If the current market price of an equity share is Rs. 120. Calculate the cost of
existing equity share capital
Solution
(a) Ke=
p
D
N
+g
=
−
12
100 4
+5=17.5%
(b) Ke=
p
D
N
+ g
=
12
120
+5%=15%
Exercise 3
The current market price of the shares of A Ltd. is Rs. 95. The floatation costs are
Rs. 5 per share amounts to Rs. 4.50 and is expected to grow at a rate of 7%. You are
required to calculate the cost of equity share capital.
Solution
Market price Rs. 95
Dividend Rs. 4.50
Growth 7%.
Ke =
p
D
N
+ g
=
4.50
95
× 100 + 7%
= 4.73% + 7% = 11.73%
Earning Price Approach
Cost of equity determines the market price of the shares. It is based on the future earning
prospects of the equity. The formula for calculating the cost of equity according to this
approach is as follows.
=
e
p
E
K
N
Where,
Ke = Cost of equity capital
E = Earning per share
Np = Net proceeds of an equity share
Cost of Captial 71
Exercise 4
A firm is considering an expenditure of Rs. 75 lakhs for expanding its operations.
The relevant information is as follows :
Number of existing equity shares =10 lakhs
Market value of existing share =Rs.100
Net earnings =Rs.100 lakhs
Compute the cost of existing equity share capital and of new equity capital assuming
that new shares will be issued at a price of Rs. 92 per share and the costs of new issue will
be Rs. 2 per share.
Solution
Cost of existing equity share capital:
Ke =
p
E
N
Earnings Per Share(EPS) =
100lakhs
10lakhs
= Rs.10
Ke =
10
100
× 10
= 10%
Cost of Equity Capital
Ke =
P
E
N
=
−
10
92 2
× 100
= 11.11%
Realized Yield Approach
It is the easy method for calculating cost of equity capital. Under this method, cost of equity
is calculated on the basis of return actually realized by the investor in a company on their
equity capital.
=
e
K PV ×D
f
Where,
Ke = Cost of equity capital.
PVƒ = Present value of discount factor.
D = Dividend per share.
72 Financial Management
Cost of Debt
Cost of debt is the after tax cost of long-term funds through borrowing. Debt may be issued
at par, at premium or at discount and also it may be perpetual or redeemable.
Debt Issued at Par
Debt issued at par means, debt is issued at the face value of the debt. It may be calculated
with the help of the following formula.
Kd = (1 – t) R
Where,
Kd = Cost of debt capital
t = Tax rate
R = Debenture interest rate
Debt Issued at Premium or Discount
If the debt is issued at premium or discount, the cost of debt is calculated with the help of
the following formula.
Kd =
p
I
N (1 – t)
Where,
Kd = Cost of debt capital
I = Annual interest payable
Np = Net proceeds of debenture
t = Tax rate
Exercise 5
(a) A Ltd. issues Rs. 10,00,000, 8% debentures at par. The tax rate applicable to the
company is 50%. Compute the cost of debt capital.
(b) B Ltd. issues Rs. 1,00,000, 8% debentures at a premium of 10%. The tax rate
applicable to the company is 60%. Compute the cost of debt capital.
(c) A Ltd. issues Rs. 1,00,000, 8% debentures at a discount of 5%. The tax rate
is 60%, compute the cost of debt capital.
(d) B Ltd. issues Rs. 10,00,000, 9% debentures at a premium of 10%. The costs of
floatation are 2%. The tax rate applicable is 50%. Compute the cost of debt-capital.
In all cases, we have computed the after-tax cost of debt as the firm saves on account
of tax by using debt as a source of finance.
Solution
(a) Kda =
p
I
N
(1–t)
Cost of Captial 73
=
8,000
1,00,000
× (1 – 0.5)
=
8,000
1,00,000
× 0.5
= 4%
Kda =
p
I
N
(1 – t)
(b) Np = Face Value + Premium = 1,00,000+10,000=1,10,000
=
8,000
1,10,000
× (1 – 0.6)
=
8,000
1,10,000
× 0.6
= 2.91%
(c) Kda =
p
I
N
(1 – t)
=
8,000
95,000
× (1 – t)
= 3.37%
(d) Kda =
p
I
N
(1 – t), Np= Rs. (10,00,000 + 1,00,000) ×
2
100
=
90,000
10,78,000
×(1 – 0.5)
= 4.17% = 11,00,000 – 22,000 = Rs. 10,78,000
Cost of Perpetual Debt and Redeemable Debt
It is the rate of return which the lenders expect. The debt carries a certain rate of interest.
Kdb =
p
p
I 1/ n(P N )n
1/ n(P N )/ 2
+ −
+
Where,
I = Annual interest payable
P = Par value of debt
Np = Net proceeds of the debenture
n = Number of years to maturity
Kdb = Cost of debt before tax.
74 Financial Management
Cost of debt after tax can be calculated with the help of the following formula:
d d
a b
K =K ×(1–t)
Where,
Kda = Cost of debt after tax
Kdb = Cost of debt before tax
t = Tax rate
Exercise 6
A company issues Rs. 20,00,000, 10% redeemable debentures at a discount of 5%.
The costs of floatation amount to Rs. 50,000. The debentures are redeemable after 8
years. Calculate before tax and after tax. Cost of debt assuring a tax rate of 55%.
Solution
Kdb =
= −
+
p
p
I 1/n (P N )
1 2(P N )
=
+ +
+
20,00,000 1/8(20,00,000 18,50,000)
1 2(20,00,000 18,50,000)
Note Np = 20,00,000 – 10,00,000 – 50,000
=
+
2,00,000 18750
19,25,000
= 11.36%.
After Tax Cost of Debt Kdb
= Kda (1– t)
=11.36 (1–0.55)
=5.11%.
Cost of Preference Share Capital
Cost of preference share capital is the annual preference share dividend by the net proceeds
from the sale of preference share.
There are two types of preference shares irredeemable and redeemable. Cost of
redeemable preference share capital is calculated with the help of the following formula:
p
p
p
D
K
N
=
Where,
Kp = Cost of preference share
Dp = Fixed preference dividend
Np = Net proceeds of an equity share
Cost of Captial 75
Cost of irredeemable preference share is calculated with the help of the following formula:
p p
p
p
D (P N )/n
K
(P N )/2
+ −
=
+
Where,
Kp = Cost of preference share
Dp = Fixed preference share
P = Par value of debt
Np = Net proceeds of the preference share
n = Number of maturity period.
Exercise 7
XYZ Ltd. issues 20,000, 8% preference shares of Rs. 100 each. Cost of issue is Rs. 2 per
share. Calculate cost of preference share capital if these shares are issued (a) at par, (b) at
a premium of 10% and (c) of a debentures of 6%.
Solution
Cost of preference share capital Kp =
p
p
D
N
(a) Kp =
−
1,60,000
20,00,000 40,000
×100
= 8.16%
(b) Kp =
1,60,000
20,00,000 2,00,000 40,000
+ −
× 100
= 7.40%
I Kp =
1,60,000
20,00,000 1,20,000 40,000
− −
×100
=
1,60,000
18,40,000
×100
= 8.69%
Exercise 8
ABC Ltd. issues 20,000, 8% preference shares of Rs. 100 each. Redeemable after 8
years at a premium of 10%. The cost of issue is Rs. 2 per share. Calculate the cost of
preference share capital.
p p
p
p
D (P N )/n
K
(P N )/2
+ −
=
+
76 Financial Management
=
+ −
+
1,60,000 1/8 (22,00,000 19,60,000)
1/2(22,00,000 19,60,000)
=
+
1,60,000 30,000
20,80,000
= 9.13%
where Dp = 20,000×100×8%=1,60,000
P = 20,00,000+2,00,000 =22,00,00
Np = 20,00,000 – 40,000 =19,60,000
n = 8 years
Exercise 9
ABC Ltd. issues 20,000, 8% preference shares of Rs. 100 each at a premium of 5%
redeemable after 8 years at par. The cost of issue is Rs. 2 per share. Calculate the cost of
preference share capital.
Solution
p p
p
p
D (P N )/n
K
(P N )/2
+ −
=
+
=
1,60,000 1/8 (20,00,000 20,60,000)
1/2 (20,00,000 20,60,000)
+ −
+
=
1,60,000–7,500
20,30,000
= 7.51%
where Dp = 20,000×100×8%=1,60,000
P = 20,00,000
n = 8 years
Np = 20,00,000 + 10,00,000 – 40,000 =20,60,000
Cost of Retained Earnings
Retained earnings is one of the sources of finance for investment proposal; it is different
from other sources like debt, equity and preference shares. Cost of retained earnings is the
same as the cost of an equivalent fully subscripted issue of additional shares, which is
measured by the cost of equity capital. Cost of retained earnings can be calculated with the
help of the following formula:
r e
K =K (1 – t) (1 – b)
Cost of Captial 77
Where,
Kr = Cost of retained earnings
Ke = Cost of equity
t = Tax rate
b = Brokerage cost
Exercise 10
A firm’s Ke (return available to shareholders) is 10%, the average tax rate of shareholders
is 30% and it is expected that 2% is brokerage cost that shareholders will have to pay while
investing their dividends in alternative securities. What is the cost of retained earnings?
Solution
Cost of Retained Earnings, Kr = Ke (1 – t) (1 – b)
Where,
Ke = rate of return available to shareholders
t = tax rate
b = brokerage cost
So, Kr = 10% (1–0.5) (1–0.02)
= 10%×0.5×0.98
= 4.9%
Measurement of Overall Cost of Capital
It is also called as weighted average cost of capital and composite cost of capital. Weighted
average cost of capital is the expected average future cost of funds over the long run found by
weighting the cost of each specific type of capital by its proportion in the firms capital structure.
The computation of the overall cost of capital (Ko) involves the following steps.
(a) Assigning weights to specific costs.
(b) Multiplying the cost of each of the sources by the appropriate weights.
(c) Dividing the total weighted cost by the total weights.
The overall cost of capital can be calculated with the help of the following formula;
Ko = Kd Wd + Kp Wp + Ke We + Kr Wr
Where,
Ko = Overall cost of capital
Kd = Cost of debt
Kp = Cost of preference share
Ke = Cost of equity
Kr = Cost of retained earnings
Wd= Percentage of debt of total capital
78 Financial Management
Wp = Percentage of preference share to total capital
We = Percentage of equity to total capital
Wr = Percentage of retained earnings
Weighted average cost of capital is calculated in the following formula also:
w
XW
K
W
Σ
Σ
Where,
Kw = Weighted average cost of capital
X = Cost of specific sources of finance
W = Weight, proportion of specific sources of finance.
Exercise 11
A firm has the following capital structure and after-tax costs for the different sources
of funds used :
Source of Funds Amount Proportion After-tax cost
Rs. % %
Debt 12,000 20 4
Preference Shares 15,000 25 8
Equity Shares 18,000 30 12
Retained Earnings 15,000 25 11
Total 60,000 100
You are required to compute the weighted average cost of capital.
Exercise 12
A company has on its books the following amounts and specific costs of each type of
capital.
Type of Capital Book Value Market Value Specific Costs (%)
Rs. Rs.
Debt 4,00,000 3,80,000 5
Preference 1,00,000 1,10,000 8
Equity 6,00,000 9,00,000 15
Retained Earnings 2,00,000 3,00,000 13
————— —————
13,00,000 16,90,000
————— —————
Cost of Captial 79
Determine the weighted average cost of capital using:
(a) Book value weights, and
(b) Market value weights.
How are they different? Can you think of a situation where the weighted average cost
of capital would be the same using either of the weights? (MBA – P.U. Nov. 2005)
Solution
Computation of Weighted Average Cost of Capital
A. Book Value
Source of Funds Amount Cost % (X) Weighted Cost
Proportion X Cost (XW)
Debt 4,00,000 5 20,000
Preference Shares 1,00,000 8 8,000
Equity Shares 6,00,000 15 90,000
Retained Earnings 2,00,000 13 26,000
ΣW = 13,00,000 ΣXW = 1,44,000
Kw =
Σ
Σ
XW
W
Kw =
1,44,000
13,00,000
× 100 = 11.1%
Computation Weighted Average Cost of Capital
B. Market Value
Source of Funds Amount Cost % (X) Weighted Cost
Proportion X Cost (XW)
Debt 3,80,000 5 19,000
Preference Shares 1,10,000 8 8,800
Equity Shares 9,00,000 15 13,500
Retained Earnings 3,00,000 13 39,000
ΣW = 16,90,000 ΣXW = 2,01,800
Σ
=
Σ
w
XW
K
W
Kw =
2,01,800
16,90,000
× 100 = 11.9%
80 Financial Management
Exercise 13
ABC Ltd. has the following capital structure.
Rs.
Equity (expected dividend 12%) 10,00,000
10% preference 5,00,000
8% loan 15,00,000
You are required to calculate the weighted average cost of capital, assuming 50% as the
rate of income-tax, before and after tax.
Solution
Solution showing weighted average cost of capital:
Particulars Rs. After Weights Cost
Equity 10,00,000 12% 33.33% 3.99
Preference 5,00,000 10% 16.67 1.67
8% Loan 15,00,000 4% 50.00 2.00
7.66%
Weight average cost of capital = 7.66%
MODEL QUESTIONS
1. What is cost of capital?
2. Define cost of capital.
3. Cost of capital computation based on certain assumptions. Discuss.
4. Explain the classification of cost.
5. Mention the importance of cost of capital.
6. Explain the computation of specific sources of cost of capital.
7. How over all cost of capital is calculated?
8. Explain various approaches for calculation of cost of equity.
9. Rama company issues 120000 10% debentures of Rs. 10 each at a premium of
10%. The costs of floatation are 4%. The rate of tax applicable to the company
is 55%. Complete the cost of debt capital. (Ans. 4.26%)
10. Siva Ltd., issues 8000 8% debentures for Rs. 100 each at a discount of 5%. The
commission payable to underwriters and brokers is Rs. 40000. The debentures
are redeemable after 5 years. Compute the after tax cost of debt assuming a tax
rate of 60%. (Ans. 3.69%)
11. Bharathi Ltd., issues 4000 12% preference shares of Rs. 100 each at a discount
of 5%. Costs of raising capital are Rs. 8000. Compute the cost of preference
capital. (Ans. 12.90%)
Cost of Captial 81
12. Firm pays tax at 60%. Compute the after tax cost of capital of a preferred share
sold at Rs. 100 with a 8%. Dividend and a redemption price of Rs.110, if the
company redeems in five years. (Ans. 9.52%)
13. Your company share is quoted in the market at Rs. 40 currently. The company
pays a dividend of Rs. 5 per share and the investors market expects a growth rate
of 7.5% per year:
(i) Compute the company’s equity cost of capital.
(ii) If the anticipated growth rate is 10% p.a. Calculate the indicated market
price per share.
(iii) If the company’s cost of capital is 15% and the anticipated growth rate is
10% p.a. Calculate the indicated market price if the dividend of Rs. 5 per
share is to be maintained. (Ans. (i) 20%, (ii) 1/10%, (iii) 1/5%)
14. Mr. Subramanian is a shareholder in Alpha Company Ltd. Although earnings for
the Alpha company have varied considerably, Subramanian has determined that
long turn average dividends for the firm have been Rs. 5 per share. He expects
a similar pattern to prevail in the future. Given the volatility of the Alpha’s
minimum rate of 40%, should it be earned on a share, what price would
Subramanian be willing to pay for the Alpha is shares? (Ans. Rs. 12.50%)
15. A Beta Ltd., iron steel reserves are being depleted and its costs of recovering a
declining quantity of iron steel are rising each year. As a equal to it the company
earnings and dividends are declining at a rate of 12% p.a. If the previous year’s
dividend (DO) was Rs. 40 and the required rate of return is 15%. What would
be the current price of the equity share of the company? (Ans. Rs. 95.14)
16. The following items have been extracted from the liabilities side of the balance
sheet of Vivekananda company as on 31st December 2004.
Paid up capital Rs.
2500 Equity shares of Rs. 100 each 250000
Reserve and Surplus 350000
Loans:
10% Debentures 100000
12% Institutional Loans 300000
Other information about the company as relevant is given below:
Year ended Dividend Earnings Average
Market Price Per share Per share Per share
31st Dec. (Rs.) (Rs.) (Rs.)
2004 7.00 11.00 80.00
2003 6.00 10.00 60.00
2002 7.00 8.00 50.00
82 Financial Management
You are required to calculate the weighted average cost of capital, using book
values as weights and earnings/price (E/P) ratio as the basis of cost of equity.
Assume 50% tax rate.
(Ans. Weighted average cost of capital=10.55%)
17. The following is an extract from the financial statements of Ramakrishna Ltd.
(Rs. Lakhs)
Operating Profit 90
Less: Interest on Debentures 24
66
Less: Income Tax (50%) 33
Net Profit 33
Equity share capital (share of Rs. 10) 150
Reserve and Surplus 75
10% Debentures 150
375
The market price per equity share is 11 and per debenture Rs. 95.
(i) What is the earning per share?
(ii) What is the percentage cost of capital to the company for the equity and
debentures funds? (Ans. (i) Rs. 2.20, (ii) 20%)
(iii) Cost of debenture funds
Book Value = 5%
Market Price = 5.26%
18. Raj Ltd. is currently earning Rs. 2,00,000 and its share is selling at a market price
of Rs. 160. The firm has 20,000 shares outstanding and has no debt. The earnings
of the firm are expected to remain stable, and it has a payout ratio of 100%. What
is the cost of equity? If the firms earns 15% rate of return on its investment
opportunities then what would be the firm’s cost of equity if the payout ratio
is 60%?
(Ans. (i) When the payout ratio is 100%, 12.5%
(ii) When the payout ratio is 60%, 13.5%)
19. Kumar Industries Ltd. has assets of Rs. 80000 which have been financed with
Rs. 26,000 of debt and Rs. 45,000 of equity and a general reserve of Rs. 9,000
The firm’s total profit after interest and taxes for the year ended 31st March 2,000
were Rs. 6,750. It pays 10% interest on borrowed funds and is in the 60% tax
bracket. It has 450 equity shares of Rs. 100 each selling at a market price of Rs.
120 per share. What is the weighted average cost of capital?
(i) EPS Rs. 15
(ii) Cost of equity 12.5%
(iii) Average cost of capital 9.74.
INTRODUCTION
Financial decision is one of the integral and important parts of financial management in
any kind of business concern. A sound financial decision must consider the board coverage
of the financial mix (Capital Structure), total amount of capital (capitalization) and cost of
capital (Ko
). Capital structure is one of the significant things for the management, since it
influences the debt equity mix of the business concern, which affects the shareholder’s
return and risk. Hence, deciding the debt-equity mix plays a major role in the part of the
value of the company and market value of the shares. The debt equity mix of the company
can be examined with the help of leverage.
The concept of leverage is discussed in this part. Types and effects of leverage is discussed
in the part of EBIT and EPS.
Meaning of Leverage
The term leverage refers to an increased means of accomplishing some purpose. Leverage
is used to lifting heavy objects, which may not be otherwise possible. In the financial point
of view, leverage refers to furnish the ability to use fixed cost assets or funds to increase
the return to its shareholders.
Definition of Leverage
James Horne has defined leverage as, “the employment of an asset or fund for which the
firm pays a fixed cost or fixed return.
Types of Leverage
Leverage can be classified into three major headings according to the nature of the finance
mix of the company.
84 Financial Management
Leverage
Finacial
Leverage
Operating
Leverage
Composite
Leverage
Fig. 7.1 Types of Leverage
The company may use finance or leverage or operating leverage, to increase the EBIT
and EPS.
OPERATING LEVERAGE
The leverage associated with investment activities is called as operating leverage. It is caused
due to fixed operating expenses in the company. Operating leverage may be defined as the
company’s ability to use fixed operating costs to magnify the effects of changes in sales on
its earnings before interest and taxes. Operating leverage consists of two important costs
viz., fixed cost and variable cost. When the company is said to have a high degree of
operating leverage if it employs a great amount of fixed cost and smaller amount of variable
cost. Thus, the degree of operating leverage depends upon the amount of various cost
structure. Operating leverage can be determined with the help of a break even analysis.
Operating leverage can be calculated with the help of the following formula:
OL =
C
OP
Where,
OL = Operating Leverage
C = Contribution
OP = Operating Profits
Degree of Operating Leverage
The degree of operating leverage may be defined as percentage change in the profits resulting
from a percentage change in the sales. It can be calculated with the help of the following
formula:
DOL =
Percentagechangeinprofits
Percentagechangeinsales
Leverage 85
Exercise 1
From the following selected operating data, determine the degree of operating leverage.
Which company has the greater amount of business risk? Why?
Company A Company B
Rs. Rs.
Sales 25,00,000 30,00,000
Fixed costs 7,50,000 15,00,000
Variable expenses as a percentage of sales are 50% for company A and 25% for
company B.
Solution
Statement of Profit
Company A Company B
Rs. Rs.
Sales 25,00,000 30,00,000
Variable cost 12,50,000 7,50,000
Contribution 12,50,000 22,50,000
Fixed cost 7,50,000 15,00,000
Operating Profit 5,00,000 7,50,000
Operating Leverage =
Contribution
Operating Profit
“A” Company Leverage =
12,50,000
5,00,000 = 2.5
“B” Company Leverage =
2,25,000
7,50,000
= 3
Comments
Operating leverage for B Company is higher than that of A Company; B Company has a
higher degree of operating risk. The tendency of operating profit may vary portionately
with sales, is higher for B Company as compared to A Company.
Uses of Operating Leverage
Operating leverage is one of the techniques to measure the impact of changes in sales
which lead for change in the profits of the company.
If any change in the sales, it will lead to corresponding changes in profit.
Operating leverage helps to identify the position of fixed cost and variable cost.
86 Financial Management
Operating leverage measures the relationship between the sales and revenue of the
company during a particular period.
Operating leverage helps to understand the level of fixed cost which is invested in the
operating expenses of business activities.
Operating leverage describes the over all position of the fixed operating cost.
FINANCIAL LEVERAGE
Leverage activities with financing activities is called financial leverage. Financial leverage
represents the relationship between the company’s earnings before interest and taxes (EBIT)
or operating profit and the earning available to equity shareholders.
Financial leverage is defined as “the ability of a firm to use fixed financial charges to
magnify the effects of changes in EBIT on the earnings per share”. It involves the use of
funds obtained at a fixed cost in the hope of increasing the return to the shareholders.
“The use of long-term fixed interest bearing debt and preference share capital along with
share capital is called financial leverage or trading on equity”.
Financial leverage may be favourable or unfavourable depends upon the use of fixed
cost funds.
Favourable financial leverage occurs when the company earns more on the assets
purchased with the funds, then the fixed cost of their use. Hence, it is also called as positive
financial leverage.
Unfavourable financial leverage occurs when the company does not earn as much as
the funds cost. Hence, it is also called as negative financial leverage.
Financial leverage can be calculated with the help of the following formula:
FL =
OP
PBT
Where,
FL = Financial leverage
OP = Operating profit (EBIT)
PBT = Profit before tax.
Degree of Financial Leverage
Degree of financial leverage may be defined as the percentage change in taxable profit as a
result of percentage change in earning before interest and tax (EBIT). This can be calculated
by the following formula
Percentage change in taxable Income
DFL=
Precentage change in EBIT
Leverage 87
Alternative Definition of Financial Leverage
According to Gitmar, “financial leverage is the ability of a firm to use fixed financial changes
to magnify the effects of change in EBIT and EPS”.
FL =
EBIT
EPS
Where,
FL = Financial Leverage
EBIT = Earning Before Interest and Tax
EPS = Earning Per share.
Exercise 2
A Company has the following capital structure.
Rs.
Equity share capital 1,00,000
10% Prof. share capital 1,00,000
8% Debentures 1,25,000
The present EBIT is Rs. 50,000. Calculate the financial leverage assuring that the
company is in 50% tax bracket.
Solution
Statement of Profit Rs.
Earning Before Interest and Tax (EBIT) 50,000
(or) Operating Profit
. Interest on Debenture
1,25,000 × 8 × 100
Earning before Tax (EBT) 10,000
40,000
Income Tax 20,000
20,000
Financial leverage =
Operating Profit(OP)
Profit BeforeTax(PBT)
=
50,000
40,000
=1.25
Uses of Financial Leverage
Financial leverage helps to examine the relationship between EBIT and EPS.
Profit
88 Financial Management
Financial leverage measures the percentage of change in taxable income to the percentage
change in EBIT.
Financial leverage locates the correct profitable financial decision regarding capital
structure of the company.
Financial leverage is one of the important devices which is used to measure the fixed
cost proportion with the total capital of the company.
If the firm acquires fixed cost funds at a higher cost, then the earnings from those
assets, the earning per share and return on equity capital will decrease.
The impact of financial leverage can be understood with the help of the following
exercise.
Exercise 3
XYZ Ltd. decides to use two financial plans and they need Rs. 50,000 for total investment.
Particulars Plan A Plan B
Debenture (interest at 10%) 40,000 10,000
Equity share (Rs. 10 each) 10,000 40,000
Total investment needed 50,000 50,000
Number of equity shares 4,000 1,000
The earnings before interest and tax are assumed at Rs. 5,000, and 12,500. The tax
rate is 50%. Calculate the EPS.
Solution
When EBIT is Rs. 5,000
Particulars Plan A Plan B
Earnings before interest and tax (EBIT) 5,000 5,000
Less : Interest on debt (10%) 4,000 1,000
Earnings before tax (EBT) 1,000 4,000
Less : Tax at 50% 500 2,000
Earnings available to equity shareholders. Rs.500 Rs.2,000
No. of equity shares 1,000 4,000
Earnings per share (EPS) Rs. 0.50 Rs. 0.50
Earnings/No. of equity shares
When EBIT is Rs. 12,500
Particulars Plan A Plan B
Earnings before interest and tax (EBIT). 12,500 12,500
Less: Interest on debt (10%) 4,000 1,000
(Contd....)
Leverage 89
Earning before tax (EBT) 8,500 11,500
Less : Tax at 50% 4,250 5,750
Earnings available to equity shareholders 4,250 5,750
No. of equity shares 1,000 4,000
Earning per share 4.25 1.44
DISTINGUISH BETWEEN OPERATING LEVERAGE AND FINANCIAL LEVERAGE
Operating Leverage/Financial Leverage
Operating Leverage Financial Leverage
1. Operating leverage is associated with 1. Financial leverage is associated with financing
investment activities of the company. activities of the company.
2. Operating leverage consists of fixed 2. Financial leverage consists of operating profit
operating expenses of the company. of the company.
3. It represents the ability to use fixed 3. It represents the relationship between EBIT
operating cost. and EPS.
4. Operating leverage can be calculated by 4. Financial leverage can be calculated by
OL =
C
OP
. FL =
OP
PBT
.
5. A percentage change in the profits resulting 5. A percentage change in taxable profit is the
from a percentage change in the sales is result of percentage change in EBIT.
called as degree of operating leverage.
6. Trading on equity is not possible while the 6. Trading on equity is possible only when the
company is operating leverage. company uses financial leverage.
7. Operating leverage depends upon fixed 7. Financial leverage depends upon the
cost and variable cost. operating profits.
8. Tax rate and interest rate will not affect the 8. Financial leverage will change due to tax rate
operating leverage. and interest rate.
EBIT - EPS Break even chart for three different financing alternatives
EPS
DR = 70%
X1 X2
X3
EBIT
C1 C2 C3
DR = 0%
DR = 30%
Fig. 7.2 EBIT - EPS Break Even Chart
90 Financial Management
Where,
DR= Debt Ratio
C1
, C2
, C3
= Indifference Point
X1
, X2
, X3
= Financial BEP
Financial BEP
It is the level of EBIT which covers all fixed financing costs of the company. It is the level
of EBIT at which EPS is zero.
Indifference Point
It is the point at which different sets of debt ratios (percentage of debt to total capital employed
in the company) gives the same EPS.
COMBINED LEVERAGE
When the company uses both financial and operating leverage to magnification of any
change in sales into a larger relative changes in earning per share. Combined leverage is
also called as composite leverage or total leverage.
Combined leverage express the relationship between the revenue in the account of
sales and the taxable income.
Combined leverage can be calculated with the help of the following formulas:
CL = OL × FL
CL =
C
OP
×
OP
PBT
=
C
PBT
Where,
CL = Combined Leverage
OL = Operating Leverage
FL = Financial Leverage
C = Contribution
OP = Operating Profit (EBIT)
PBT = Profit Before Tax
Degree of Combined Leverage
The percentage change in a firm’s earning per share (EPS) results from one percent change
in sales. This is also equal to the firm’s degree of operating leverage (DOL) times its degree
of financial leverage (DFL) at a particular level of sales.
Degree of contributed coverage =
Percentage change in EPS
Percentage change in sales
Leverage 91
Exercise 4
Kumar company has sales of Rs. 25,00,000. Variable cost of Rs. 12,50,000 and fixed
cost of Rs. 50,000 and debt of Rs. 12,50,000 at 8% rate of interest. Calculate combined leverage.
Solution
Statement of Profit
Sales 25,00,000
Less: Variable cost 15,00,000
Contribution 10,00,000
Less: Fixed cost 5,00,000
Operating Profit 5,00,000
Combined leverage =Operating leverage×Financial leverage
Calculation of financial leverage
Contribution 10,00,000
2
Operating Profit 5,00,000
= =
Calculation of financial leverage
Earning before Interest and Tax (EBIT) 5,00,000
Less: Interest on Debenture ( 8% of 12,50,000) 1,00,000
Earnings before Tax 4,00,000
Operating leverage = =
Operating Profit 5,00,000
Earning Before Tax 4,00,000
=1.25
Combined leverage = 2 × 1.25 = 2.5
Exercise 5
Calculate the operating, financial and combined leverage under situations 1 and 2 and
the financial plans for X and Y respectively from the following information relating to the
operating and capital structure of a company, and also find out which gives the highest and
the least value ? Installed capacity is 5000 units. Annual Production and sales at 60% of
installed capacity.
Selling price per unit Rs. 25
Variable cost per unit Rs. 15
Fixed cost:
Situation 1 : Rs. 10,000
Situation 2 : Rs. 12,000
92 Financial Management
Capital structure:
Financial Plan
X (Rs.) Y (Rs.)
Equity 25,000 50,000
Debt (cost 10%) 50,000 25,000
75,000 75,000
Solution
Annual production and sales 60% of 5,000 = 3000 Unit
Contribution per Unit Rs.
Selling Price 25 Per Unit
Variable Price 15 Per Unit
10 Per Unit
Total contribution is 3000 Units×Rs. 10=Rs. 30,000
Computation of leverage.
Financial plan
PLAN-X PLAN-Y
Situation 1 Situation 2 Situation 1 Situation 2
Contribution 30000 30000 30000 30000
Fixed cost operating
profit (or) EBIT 10000 12000 10000 12000
20000 18000 20000 18000
Interest on Debts
10% of 50,000 5000 5000 2500 2500
10% of 25,000
Earnings before Tax 15000 13000 17500 15500
(i) Operating Leverage
Contribution 30000 30000 30000 30000
20000 18000 20000 18000
= 1.5 1.67 1.5 1.67
(ii) Financial Leverage
Operating Profit (op) 20000 18000 20000 18000
Profit Before Tax (PBI) 15000 13000 17500 15500
(iii) Combined leverage
OL × FL = 1.5 × 1.33 1.67 × 1.38 1.5 × 1.14 1.67 × 1.16
1.995 2.30 1.71 1.94
Highest and least value of combined leverage.
Highest Value = 2.30 under situation 2 plan X.
Least Value = 1.71 under situation 1 plan Y.
Leverage 93
Exercise 6
Calculate operating, financial and combined leverages under situations when fixed costs are:
(i) Rs. 5,000 and
(ii) Rs. 10,000 and financial plans 1 and 2 respectively from the following information
pertaining to the operating and capital structure of a textile company :
Rs.
Total Assets 30,000
Total Assets turnover 2
Variable cost as percentage of sales 60
Capital structure Financial Plan
1 2
Rs. Rs.
Equity 30,000 10,000
10% debentures 10,000 30,000
Solution
Computation of Leverage
Financial Plan
Plan 1 2
Situation i ii i ii
Sales 60,000 60,000 60,000 60,000
Less : Variable cost 36,000 36,000 36,000 36,000
Contribution 24,000 24,000 24,000 24,000
Less : Fixed cost 5,000 10,000 5,000 10,000
Operating profit (EBIT) 19,000 14,000 19,000 14,000
Less : Interest 1,000 1,000 3,000 3,000
Profit before tax (PBT) 18,000 13,000 16,000 11,000
Operating leverage 24,000 24,000 24,000 24,000
Contribution 19,000 14,000 19,000 14,000
EBIT 1.26 1.71 1.26 1.71
Financial leverage 19,000 14,000 19,000 14,000
EBIT 18,000 13,000 16,000 11,000
PBT 1.05 1.07 1.18 1.27
Combined leverage 1.32 1.83 1.49 2.17
WORKING CAPITAL LEVERAGE
One of the new models of leverage is working capital leverage which is used to locate the
investment in working capital or current assets in the company.
Working capital leverage measures the sensitivity of return in investment of charges in
the level of current assets.
94 Financial Management
WCL = Percentage Change in ROI
Percentage Change is WC
If the earnings are not affected by the changes in current assets, the working capital
leverage can be calculated with the help of the following formula.
WCL =
CA
TA DCA
±
Where,
CA = Current Assets
TA = Total Assets
DCA = Changes in the level of Current Assets
Exercise 7
The following information is available for two companies.
X Ltd. Y Ltd.
Fixed Assets Rs. 4,00,000 1,00,000
Current Assets Rs. 10,00,000 4,00,000
Total Assets Rs. 14,00,000 14,00,000
Earning before interest and taxes Rs. 1,50,000 1,50,000
You are required to compare the sensitivity earnings of the two companies for 30%
charge in the level of their current assets.
Solution
Working capital leverage =
Current Assets
Total Assets DCA
±
X Ltd. =
1,00,000
14,00,000 – 3,00,000
=
10,00,000
11,00,000
= 0 .90
Y Ltd. =
4,00,000
14,00,000 – 1,20,000
=
4,00,000
12,80,000
= 0.3125
Leverage 95
Looking at the working capital leverage of the two companies, we can say that the
sensitivity of earnings for charge on the level of current assets of X Ltd. is a greater than of
Y Ltd.
Exercise 8
Calculate operating leverage and financial leverage under situations A, B and C and
financial plans 1, 2 and 3 respectively from the following information relating to the operating
and financial leverage which give the highest value and the least value.
Installed capacity (units) 1,200
Actual production and sales (units) 800
Selling price per unit (Rs.) 15
Variable cost per unit (Rs.) 10
Fixed costs (Rs.) Situation A 1,000
Situation B 2,000
Situation C 3,000
Capital Structure Financial Plan
1 2 3
Equity Rs. 5,000 Rs. 7,500 Rs. 2,500
Debt Rs. 5,000 Rs. 2,500 Rs. 7,500
Cost of debt 12 per cent
(for all plans)
(MBA – P.U. Nov. 2005)
Solution
A B C
S – VC 4,000 4,000 4,000
EBIT 3,000 2,000 1,000
DOL =
−
S VC
EBIT
1.33 2 4
1 2 3
Situation A
EBIT 3,000 3,000 3,000
Less : Interest 600 300 900
EBT 2,400 2,700 2,100
Financial Leverage 1.25 1.11 1.43
Situation B
EBIT 2,000 2,000 2,000
Less : Interest 600 300 900
96 Financial Management
EBT 1,400 1,700 1,100
Financial Leverage 1.43 1.18 1.82
Situation C
EBIT 1,000 1,000 1,000
Less : Interest 600 300 900
EBT–I 400 700 100
Financial Leverage 2.5 1.43 10
Exercise 9
‘ XYZ’ company has a choice of the following three financial plans. You are required to
calculate the financial leverage in each case.
Plan I Plan II Plan III
Equity capital Rs. 2,000 Rs. 1,000 Rs. 3,000
Debt Rs. 2,000 Rs. 3,000 Rs. 1,000
EBIT Rs. 400 Rs. 400 Rs. 400
Interest @10% per annum on debts in all cases.
Solution
Plan I Plan II Plan III
Rs. Rs. Rs.
EBIT 400 400 400
Less Interest-(I) 200 300 100
EBIT–I 200 100 300
FL 2 4 1.33
MODEL QUESTIONS
1. Write a note on trading on equity.
2. What is meant by working capital leverage?
3. What is leverage? Mention different types of leverage?
4. Explain the operating leverage.
5. Discuss the concept of financial leverage.
6. How compared leverage is calculated?
7. Explain the working capital leverage.
Leverage 97
8. What is point of indifference?
9. Distinguish the operating leverage from financial leverage.
10. Explain the uses of operating leverage.
11. From the following information find out operating, financial and combined leverages.
Sales 1,00,000
Variable Cost 60,000
Fixed Cost 20,000
Interest 10,000
(Ans. OL 2, FL 1.33, LL 2.67)
12. Arvind Ltd. is having the following informations. Calculate financial leverage
opening leverage and combined leverage.
Sales 50,000 units Rs. 10 each
UC Rs. 6 Per Unit
FC Rs. 1,00,000
Interest 8 of 5,00,000
(Ans. FL 1.66, OL 2, CL 3.33)
13. X Ltd. is having the following capital structure. Calculate financial leverage,
operating leverage and combined leverage having two situations A and B and
financial plans I and II respectively.
Capacity 1,500 units
Production 1,200 units
Selling Price Rs. 25
Variable Cost Rs. 18
Fixed Cost Situation I Rs. 1,400
Situation II Rs. 2,400
Capital structure
Financial Plan
A B
Equity 80,000 60,000
Debt 20,000 40,000
(Ans. OL 1.2, 1.4, 1.2, 1.4
FL 1.16, 1.2, 1.4, 1.5
CL 1.39, 1.68, 1.68, 2.1)
98 Financial Management
14. The following details are available for the two companies.
X Ltd. Y Ltd.
Fixed Assets 4,00,000 6,00,000
Current Assets 6,00,000 4,00,000
Total Asset 10,00,000 10,00,000
Earnings Before Interest and Taxes 1,50,000 1,50,000
You are required to compare the sensibility of the two companies for a 30%
changes in the level of current assets with the help of using capital leverages.
(Ans. X .73, Y 4.5)
INTRODUCTION
The financial manager must take careful decisions on how the profit should be distributed
among shareholders. It is very important and crucial part of the business concern, because
these decisions are directly related with the value of the business concern and shareholder’s
wealth. Like financing decision and investment decision, dividend decision is also a major
part of the financial manager. When the business concerns decide dividend policy, they
have to consider certain factors such as retained earnings and the nature of shareholder of
the business concern.
Meaning of Dividend
Dividend refers to the business concerns net profits distributed among the shareholders. It
may also be termed as the part of the profit of a business concern, which is distributed
among its shareholders.
According to the Institute of Chartered Accountant of India, dividend is defined as
“a distribution to shareholders out of profits or reserves available for this purpose”.
TYPES OF DIVIDEND/FORM OF DIVIDEND
Dividend may be distributed among the shareholders in the form of cash or stock. Hence,
Dividends are classified into:
A. Cash dividend
B. Stock dividend
C. Bond dividend
D. Property dividend
100 Financial Management
Dividend
Cash Dividend Bond Dividend Stock Dividend Property Dividend
Fig. 8.1 Types of Dividend
Cash Dividend
If the dividend is paid in the form of cash to the shareholders, it is called cash dividend. It
is paid periodically out the business concerns EAIT (Earnings after interest and tax). Cash
dividends are common and popular types followed by majority of the business concerns.
Stock Dividend
Stock dividend is paid in the form of the company stock due to raising of more finance.
Under this type, cash is retained by the business concern. Stock dividend may be bonus
issue. This issue is given only to the existing shareholders of the business concern.
Bond Dividend
Bond dividend is also known as script dividend. If the company does not have sufficient
funds to pay cash dividend, the company promises to pay the shareholder at a future
specific date with the help of issue of bond or notes.
Property Dividend
Property dividends are paid in the form of some assets other than cash. It will distributed
under the exceptional circumstance. This type of dividend is not published in India.
DIVIDEND DECISION
Dividend decision of the business concern is one of the crucial parts of the financial manager,
because it determines the amount of profit to be distributed among shareholders and amount
of profit to be treated as retained earnings for financing its long term growth. Hence,
dividend decision plays very important part in the financial management.
Dividend decision consists of two important concepts which are based on the
relationship between dividend decision and value of the firm.
Dividend Decision 101
Dividend Theories
Irrelevance of Dividend Relevance of Dividend
Solomon Approach Gordon’s Model
MM Approach Walter’s Model
Fig. 8.2 Dividend Theories
Irrelevance of Dividend
According to professors Soloman, Modigliani and Miller, dividend policy has no effect
on the share price of the company. There is no relation between the dividend rate and
value of the firm. Dividend decision is irrelevant of the value of the firm. Modigliani and
Miller contributed a major approach to prove the irrelevance dividend concept.
Modigliani and Miller’s Approach
According to MM, under a perfect market condition, the dividend policy of the company is
irrelevant and it does not affect the value of the firm.
“Under conditions of perfect market, rational investors, absence of tax discrimination
between dividend income and capital appreciation, given the firm’s investment policy, its
dividend policy may have no influence on the market price of shares”.
Assumptions
MM approach is based on the following important assumptions:
1. Perfect capital market.
2. Investors are rational.
3. There are no tax.
4. The firm has fixed investment policy.
5. No risk or uncertainty.
Proof for MM approach
MM approach can be proved with the help of the following formula:
1 1
o
e
D + P
P
(1 + K )
=
Where,
Po = Prevailing market price of a share.
Ke = Cost of equity capital.
D1 = Dividend to be received at the end of period one.
P1 = Market price of the share at the end of period one.
102 Financial Management
P1 can be calculated with the help of the following formula.
P1 = Po (1+Ke) – D1
The number of new shares to be issued can be determined by the following formula:
M × P1 = I – (X – nD1)
Where,
M = Number of new share to be issued.
P1 = Price at which new issue is to be made.
I = Amount of investment required.
X = Total net profit of the firm during the period.
nD1= Total dividend paid during the period.
Exercise 1
X Company Ltd., has 100000 shares outstanding the current market price of the shares
Rs. 15 each. The company expects the net profit of Rs. 2,00,000 during the year and it
belongs to a rich class for which the appropriate capitalisation rate has been estimated to
be 20%. The company is considering dividend of Rs. 2.50 per share for the current year.
What will be the price of the share at the end of the year (i) if the dividend is paid and
(ii) if the dividend is not paid.
Solution
1 1
o
e
D + P
P
(1 + K )
=
(i) If the dividend is paid
Po = Rs.15
Ke = 20%
D1 = 2.50
P1 = ?
15 = 1
2.50 + P
1 + 20%
15 = 1
2.50 + P
1.2
2.50 + P1 = 15 × 1.2
P1 = 18 – 2.50
P1 = Rs. 15.50
(ii) If the dividend is not paid
Po = 15
Ke = 20%
D1 = 0
Dividend Decision 103
P1 = ?
1
0 P
15
1 20%
+
=
+
1
0 P
15
1.20
+
=
0 + P1 = 15×1.20
P1 = Rs. 18.
Exercise 2
Ram company belongs to a risk class for which the appropriate capitalization rate is
12%. It currently has outstanding 30000 shares selling at Rs. 100 each. The firm is
contemplating the declaration of dividend of Rs. 6 per share at the end of the current
financial year. The company expects to have a net income of Rs. 3,00,000 and a proposal
for making new investments of Rs. 6,00,000. Show that under the MM assumptions, the
payment of dividend does not affect the value of the firm. How many new shares issued
and what is the market value at the end of the year?
Solution Po = 1 1
e
D + P
1+ K
Po = 100
D1 = Rs. 6
P1 = ?
Ke = 12%
100 =
1
6 P
1 127
+
+
100 =
6 P
1.12
+
6 + P1 = 112
P1 = 112 – 6
P1 = Rs. 106
Dividend is not declared
Ke = 12%, Po = 100, D1 = 0, P1 = ?
100 =
1
0 + P
1 + 12%
100 =
1
0 + P
1.12
P1 = Rs. 112
104 Financial Management
Calculation of number of new shares to be issued
Dividends Paid Dividends not Paid
Net Income 300000 300000
Total Dividends 180000 –
Retained Earnings 120000 300000
Investment Budget 600000 600000
Amount to be raised as
new shares 480000 300000
(Investment – Retained Earnings)
Relevant – Market Price
per share Rs. 106 Rs. 112
No. of new shares to be issued 4528.3 2678.6
Total number of shares at the
end of the year 300000 30000
Existing shares 4528.3 2678.6
(+) new shares issued 34528.3 32678.6
Market price per share Rs. 106 112
Market value for shares Rs. 3660000 3660000
There is no change in the total market value of shares whether dividends are distributed
or not distributed.
Exercise 3
ABC Ltd. has a capital of Rs. 10,00,000 in equity shares of Rs. 100 each. The shares
are currently quoted at par. The company proposes to declare a dividend of Rs. 10 per
share at the end of the current financial year. The capitalization rate for the risk class to
which the company belongs is 12%.
What will be the MP of the share at the end of the year, if
(i) A dividend is not declared.
(ii) A dividend is declared.
(iii) Assuming that the company pays the dividend and has net profits of Rs. 5,00,000
and makes new investments of Rs. 10,00,000 during the period, how many new
shares must be issued? Use the MM Model. (C.A Final Nov. 1990)
Solution
As per MM Model, the current MP of the share is
Po = 1 1
e
D + P
1 + K
(i) If the dividend is not declared
100 = 1
0 + P
(1 + .12)
Dividend Decision 105
100 =
1
P
1.12
P1 = Rs. 112
(ii) If the dividend is declared
100 =
1
10 + P
1 + 0.12
100 =
1
10 + P
1.12
112 = 10 + P1
P1 = 112 – 10
P1 = Rs. 102
(iii) In case the firm which pays dividend of Rs. 10 per share, then the number of
new shares to be issued is M.
M×P1 = I – (X – nD1)
M×102 = 10,00,000 – (5,00,000 – 10,000×10)
102 m = 10,00,000 – 4,00,000
M =
6,00,000
102
= 5882.35 (or) 5883
The firm should issue 5883 new shares @ Rs. 102 per share to finance its investment
proposals.
Exercise 4
Z Ltd., has risk allying firm for which capitalization rate is 12%. It currently has
outstanding 8,000 shares selling at Rs. 100 each. The dividend for the current financial
year is Rs. 7 per share. The company expects to have a net income of Rs. 69,000 and has a
proposal formatting new investments of Rs. 1,60,000. Show that under the MM hypothesis
the payment of dividend does not affect the value of the firm.
(a) Value of the firm when dividends are paid. Price of the shares at the end of the
current financial year.
P1 = Po (1+Ke) – D1
= 100 (1 + .12) – 7
= 100×1.12 – 7
P1 = Rs. 105
106 Financial Management
(b) Number of shares to be issued.
S =
1
I – (TE – nD)
P
=
1,60,000 – (69000–(8000×7))
105
=
1,60,000 – (13000)
105
1,47,000
105
= 1400 shares
The MM hypothesis explained in another firm also assumes that investment required
by the firm on account of payment of dividends is finance out of the new issue of equity
shares.
S =
1
I – (TE – nD)
M
S = Value of the firm can be calculated as follows.
nPo = 1
e
(N + S) M – (1 – TE)
1 + K
nPo = Value of the firm
TE = Total Earnings
M1 = Market Price at the end of the period
Ke = Cost of capital
D = Dividend paid at the end of the year (or) period
N = Number of shares outstanding at the beginning of
the period.
nPo = 1
e
(N + S) M – (1 – TE)
1 + K
=
8000 + 1400 × 105 – (1,60,000 – 69,000)
1+12%
=
9400 × 105 – 91000
1.12
= 8,00,000
Criticism of MM approach
MM approach consists of certain criticisms also. The following are the major criticisms of
MM approach.
Dividend Decision 107
MM approach assumes that tax does not exist. It is not applicable in the practical life of
the firm.
MM approach assumes that, there is no risk and uncertain of the investment. It is also
not applicable in present day business life.
MM approach does not consider floatation cost and transaction cost. It leads to affect
the value of the firm.
MM approach considers only single decrement rate, it does not exist in real practice.
MM approach assumes that, investor behaves rationally. But we cannot give assurance
that all the investors will behave rationally.
RELEVANCE OF DIVIDEND
According to this concept, dividend policy is considered to affect the value of the firm.
Dividend relevance implies that shareholders prefer current dividend and there is no direct
relationship between dividend policy and value of the firm. Relevance of dividend concept
is supported by two eminent persons like Walter and Gordon.
Walter’s Model
Prof. James E. Walter argues that the dividend policy almost always affects the value of
the firm.
Walter model is based in the relationship between the following important factors:
• Rate of return I
• Cost of capital (k)
According to the Walter’s model, if r > k, the firm is able to earn more than what the
shareholders could by reinvesting, if the earnings are paid to them. The implication of
r > k is that the shareholders can earn a higher return by investing elsewhere.
If the firm has r = k, it is a matter of indifferent whether earnings are retained or
distributed.
Assumptions
Walters model is based on the following important assumptions:
1. The firm uses only internal finance.
2. The firm does not use debt or equity finance.
3. The firm has constant return and cost of capital.
4. The firm has 100 recent payout.
5. The firm has constant EPS and dividend.
6. The firm has a very long life.
Walter has evolved a mathematical formula for determining the value of market share.
e
e
r
D+ (E D)
K
P
K
−
=
108 Financial Management
Where,
P = Market price of an equity share
D = Dividend per share
r = Internal rate of return
E = Earning per share
Ke = Cost of equity capital
Exercise 5
From the following information supplied to you, ascertain whether the firm is following
an optional dividend policy as per Walter’s Model?
Total Earnings Rs. 2,00,000
No. of equity shares (of Rs. 100 each 20,000)
Dividend paid Rs. 1,00,000
P/E Ratio 10
Return Investment 15%
The firm is expected to maintain its rate on return on fresh investments. Also find out
what should be the E/P ratio at which the dividend policy will have no effect on the value
of the share? Will your decision change if the P/E ratio is 7.25 and interest of 10%?
Solution
EPS =
Earnings
No. of Shares
=
200000
20000
= Rs. 10
P/E Ratio = 10
Ke =
1
P/E Ratio
1
10
= 0.10
DPS =
Total Dividends paid
No. of Shares
=
100000
20000
= Rs. 5
The value of the share as per Walter’s Model is
P =
e
D+r/ke(E – D)
K
=
5+.15/.10 (10 – 5)
0.10
Dividend Decision 109
=
5 + 7.5
0.10
= Rs. 12.5
Dividend Payout =
DPS
EPS
×100
=
5
10
×100 = 60%
r >Ke therefore by distributing 60% of earnings, the firm is not following an optional
dividend policy. In this case, the optional dividend policy for the firm would be to pay zero
dividend and the Market Price would be:
P =
5+.15/.10 (10–0)
.10
=
5 + 15
.10
=
20
.10
P = Rs. 200
So, the MP of the share can be increased by following a zero payout, of the P/E is 7.25
instead of 10 then the Ke =1=0.138 and in this case Ke>r and the MP of the share is 7.25.
P =
.15
5 + (10–5)
.138
.138
.138
= 5 + 5.435
P=Rs. 75.62
Exercise 6
The earnings per share of a company are Rs. 80 and the rate of capitalization applicable
to the company is 12%. The company has before it an option of adopting a payment ratio
of 25
% (or) 50%(or) 75%. Using Walter’s formula of dividend payout, compute the market
value of the company’s share of the productivity of retained earnings (i) 12% (ii) 8%
(iii) 5%.
Solution
E = 10 and Ke=12%=0.12
110 Financial Management
As per Walter’s Model, the market price of a share is
P = e
e
r
D+ (E – D)
K
K
(A) If payout ratio is 25%
(i) r=12%=0.12, D=25%of 10=Rs. 2.50
P =
.12
2.5+ (10 – 2.50)
.12
.12
=
2.50 + 7.50
0.12
=
10
0.12
= Rs. 83.33
R = 8% = 0.08
R = 8% = 0.08, D = 25% of 10 = Rs. 2.50
0.08
2.50 (10 2.50)
0.12
0.12
+ −
=
=
2.50 + 5
0.12
=
7.50
0.12
= Rs. 62.5
Exercise 7
From the following data, calculate the MP of a share of ABC Ltd., under (i) Walter’s
formula; and (ii) Dividend growth model.
EPS = Rs. 10 DPS = Rs. 6
Ke = 18% r = 25%
retention ratio (b) = 45%
Solution:
(i) Walter’s Model
P =
e
D + r (EPS – DPS)
K
6+.25 (10-6)
.18
=
Dividend Decision 111
=
6 + 5.56
.18
=
11.56
.18
= Rs. 64.22
(ii) Dividend Growth Model
P =
e
E(1–b)
K –br
=
10( 1–.45)
.18 – (.45×.25)
=
10×.55
.18 – 0.1125
=
5.5
0.0675
= Rs. 81.48
Criticism of Walter’s Model
The following are some of the important criticisms against Walter model:
Walter model assumes that there is no extracted finance used by the firm. It is not
practically applicable.
There is no possibility of constant return. Return may increase or decrease, depending
upon the business situation. Hence, it is applicable.
According to Walter model, it is based on constant cost of capital. But it is not applicable
in the real life of the business.
Gordon’s Model
Myron Gorden suggest one of the popular model which assume that dividend policy of a
firm affects its value, and it is based on the following important assumptions:
1. The firm is an all equity firm.
2. The firm has no external finance.
3. Cost of capital and return are constant.
4. The firm has perpectual life.
5. There are no taxes.
6. Constant relation ratio (g=br).
7. Cost of capital is greater than growth rate (Ke
>br).
112 Financial Management
Gordon’s model can be proved with the help of the following formula:
P =
e
E(1 – b)
K – br
Where,
P = Price of a share
E = Earnings per share
1 – b = D/p ratio (i.e., percentage of earnings distributed as dividends)
Ke = Capitalization rate
br = Growth rate = rate of return on investment of an all equity firm.
Exercise 8
Raja company earns a rate of 12% on its total investment of Rs. 6,00,000 in assets.
It has 6,00,000 outstanding common shares at Rs. 10 per share. Discount rate of the firm is
10% and it has a policy of retaining 40% of the earnings. Determine the price of its share
using Gordon’s Model. What shall happen to the price of the share if the company has
payout of 60% (or) 20%?
Solution
According to Gordon’s Model, the price of a share is
P=
e
E (1 – b)
K – br
Given: E = 12% of Rs. 10=Rs. 1.20
r = 12%=0.12
K = 10%=0.10
t = 10%=0.10
b = 40%=0.40
Put the values in formula
P =
1.20 (1–.40)
10–(.40×.12)
=
1.20×(0.60)
.10–0.048
=
0.72
0.052
= Rs. 13.85
Dividend Decision 113
If the firm follows a policy of 60% payout then b=20% =0.20
The price is P =
1.20 (1×0.20)
.10 – (.2×.12)
= 0.05
r=4% =0.04, D =25% of 10=2.50
0.04
(10 – 2.50)
0.12
=2.50+
0.12
=
5
0.12
= Rs. 41.67
If payout ratio is 50%, D=50% of 10=Rs. 5
r=12%=0.12, D=50% of 10 = Rs. 5
=
0.12
(10 – 5)
0.12
5+
0.12
=
5+5
0.12
=
10
0.12
= Rs. 83.33
r = 8% = 0.08, D = 50% of 10 = 5
=
0.8
5 (10– 5)
0.12
0.12
+
=
5+3.33
0.12
=
8.33
0.12
= Rs. 69.42
r = 4% = 0.04, D = 50% of 10 = 5
=
0.04
5+ (10 – 5)
0.12
=
5+1.67
0.12
=
6.67
0.12
= Rs. 55.58
114 Financial Management
C. If payout ratio is 75%
D = 75% of 10 = 7.50
(i) r = 12% = 0.12, D = 75% of 10 = 7.50
P =
7.50+0.08
(10 7.50)
0.12
0.12
−
=
7.50 2.50
Rs. 83.33
0.12
+
=
(ii) r = 8% = 0.8, D = 75% of 10 = 7.50
P =
7.50+0.08
(10 7.50)
0.12
0.12
−
=
7.50 1.67
0.12
+
=
9.17
Rs. 76.42
0.12
=
(iii) r = 4% = 0.04, D = 75% of 10 = 7.50
P =
−
7.50+0.04
(10 7.50)
0.12
0.12
=
7.50 0.83
0.12
+
=
8.33
Rs.69.42
0.12
=
=
1.20 0.80
.10 0.024
×
−
=
0.96
Rs.12.63
0.076
=
If the payout is 20% the value of b=0.60 and the price of the share is
=
1.20 (1–0.60)
.10–(.80×.12)
=
1.20×0.40
.10–0.096
=
0.48
0.0004
= Rs. 120
Dividend Decision 115
Criticism of Gordon’s Model
Gordon’s model consists of the following important criticisms:
Gordon model assumes that there is no debt and equity finance used by the firm. It is
not applicable to present day business.
Ke and r cannot be constant in the real practice.
According to Gordon’s model, there are no tax paid by the firm. It is not practically applicable.
FACTORS DETERMINING DIVIDEND POLICY
Profitable Position of the Firm
Dividend decision depends on the profitable position of the business concern. When the
firm earns more profit, they can distribute more dividends to the shareholders.
Uncertainty of Future Income
Future income is a very important factor, which affects the dividend policy. When the
shareholder needs regular income, the firm should maintain regular dividend policy.
Legal Constrains
The Companies Act 1956 has put several restrictions regarding payments and declaration
of dividends. Similarly, Income Tax Act, 1961 also lays down certain restrictions on payment
of dividends.
Liquidity Position
Liquidity position of the firms leads to easy payments of dividend. If the firms have high
liquidity, the firms can provide cash dividend otherwise, they have to pay stock dividend.
Sources of Finance
If the firm has finance sources, it will be easy to mobilise large finance. The firm shall not
go for retained earnings.
Growth Rate of the Firm
High growth rate implies that the firm can distribute more dividend to its shareholders.
Tax Policy
Tax policy of the government also affects the dividend policy of the firm. When the
government gives tax incentives, the company pays more dividend.
Capital Market Conditions
Due to the capital market conditions, dividend policy may be affected. If the capital market
is prefect, it leads to improve the higher dividend.
116 Financial Management
TYPES OF DIVIDEND POLICY
Dividend policy depends upon the nature of the firm, type of shareholder and profitable
position. On the basis of the dividend declaration by the firm, the dividend policy may be
classified under the following types:
• Regular dividend policy
• Stable dividend policy
• Irregular dividend policy
• No dividend policy.
Regular Dividend Policy
Dividend payable at the usual rate is called as regular dividend policy. This type of policy is
suitable to the small investors, retired persons and others.
Stable Dividend Policy
Stable dividend policy means payment of certain minimum amount of dividend regularly.
This dividend policy consists of the following three important forms:
Constant dividend per share
Constant payout ratio
Stable rupee dividend plus extra dividend.
Irregular Dividend Policy
When the companies are facing constraints of earnings and unsuccessful business operation,
they may follow irregular dividend policy. It is one of the temporary arrangements to meet
the financial problems. These types are having adequate profit. For others no dividend is
distributed.
No Dividend Policy
Sometimes the company may follow no dividend policy because of its unfavourable working
capital position of the amount required for future growth of the concerns.
MODEL QUESTIONS
1. What is dividend? Explain the types of dividend.
2. Explain the approaches of dividend decision.
3. Explain the factors affecting the dividend policy.
4. Discuss the various types of dividend policy.
5. Explain the irrelevance and relevance dividend theories.
6. State the criticism of MM approach.
7. What are the assumptions of Walter’s model?
Dividend Decision 117
8. What are the assumptions and criticisms of Gordon’s model?
9. U Ltd. belongs to risk class of capitalization rate which is 14%. It has currently
3000 shares outstanding at Rs. 50 each; during the year Rs. 5 is declared as
dividend. The net income of the company is Rs. 83,000. For the new project
investment is required of Rs. 1,20,000. Calculate under MM hypothesis that the
payment of dividend does not affect the value of the firm.
(Ans. dividend paid Rs. 52 number of equity shares 1000 and value of the firm
Rs. 1,50,000. Dividend not paid Rs. 57. Number of equity shares 37000/57 shares
(approx. 650 shares) Value of the firm is Rs. 1,50,000)
10. X Ltd., had 25,000 equity shares of Rs. 100 each outstanding on 1st April, the
shares are issued at par in the market, the company removed restraint in the
dividend policy, the company ready to pay dividend of Rs. 15 per share for the
current calendar year. The capitalization rate is 15%. Using MM approach assuming
that no taxes, calculate the price of the shares at the end of the year:
(a) When dividend is not declared.
(b) When dividend is declared.
(c) Find out the number of new shares that the company issues to meet its
investment needs of Rs 15,00,000 assuming that net income of Rs. 7,50,000
and assuming that the dividend is paid.
(Ans. (a) Rs.105 (b) Rs.115 (c) 10,000 shares)
11. The following information is available in respect of a companys capitalization rate
is 15% earnings per share Rs. 75. Assured rate on investment is 14% , 12%, 10%.
The effect of dividend policy on market price of shares applying Walter’s model
the dividend payout ratio is (a) 0% (b) 40% (c) 60% (d) 100%)
12. The following data are available for R Ltd.
— Earnings per share Rs. 8
— Rate of return on investment 16%
— Rate of return to shareholders 12%
If Gordon’s basic valuation formula is applied what will be the price per share
when the dividend pay out ratio is 25%, 50%, 60% and 100%.
(Ans. Rs. 0, 100, 85.71, and 66.67)
This page
intentionally left
blank
INTRODUCTION
The word Capital refers to be the total investment of a company of firm in money, tangible
and intangible assets. Whereas budgeting defined by the “Rowland and William” it may
be said to be the art of building budgets. Budgets are a blue print of a plan and action
expressed in quantities and manners.
The examples of capital expenditure:
1. Purchase of fixed assets such as land and building, plant and machinery, good will, etc.
2. The expenditure relating to addition, expansion, improvement and alteration to
the fixed assets.
3. The replacement of fixed assets.
4. Research and development project.
Definitions
According to the definition of Charles T. Hrongreen, “capital budgeting is a long-term
planning for making and financing proposed capital out lays.
According to the definition of G.C. Philippatos, “capital budgeting is concerned with
the allocation of the firms source financial resources among the available opportunities.
The consideration of investment opportunities involves the comparison of the expected
future streams of earnings from a project with the immediate and subsequent streams of
earning from a project, with the immediate and subsequent streams of expenditure”.
According to the definition of Richard and Green law, “capital budgeting is acquiring
inputs with long-term return”.
According to the definition of Lyrich, “capital budgeting consists in planning
development of available capital for the purpose of maximizing the long-term profitability
of the concern”.
120 Financial Management
It is clearly explained in the above definitions that a firm’s scarce financial resources
are utilizing the available opportunities. The overall objectives of the company from is to
maximize the profits and minimize the expenditure of cost.
Need and Importance of Capital Budgeting
1. Huge investments: Capital budgeting requires huge investments of funds, but
the available funds are limited, therefore the firm before investing projects, plan
are control its capital expenditure.
2. Long-term: Capital expenditure is long-term in nature or permanent in nature.
Therefore financial risks involved in the investment decision are more. If higher
risks are involved, it needs careful planning of capital budgeting.
3. Irreversible: The capital investment decisions are irreversible, are not changed
back. Once the decision is taken for purchasing a permanent asset, it is very
difficult to dispose off those assets without involving huge losses.
4. Long-term effect: Capital budgeting not only reduces the cost but also increases
the revenue in long-term and will bring significant changes in the profit of the
company by avoiding over or more investment or under investment. Over
investments leads to be unable to utilize assets or over utilization of fixed assets.
Therefore before making the investment, it is required carefully planning and
analysis of the project thoroughly.
CAPITAL BUDGETING PROCESS
Capital budgeting is a difficult process to the investment of available funds. The benefit
will attained only in the near future but, the future is uncertain. However, the following
steps followed for capital budgeting, then the process may be easier are.
Identification of Various Investments
Evaluation of Proposals
Fixing Property
Final Approval
Implementation
Identification of Various
Investment Proposals
Feedback
Steps
Screening or Matching the Available Resources
Fig. 9.1 Capital Budgeting Process
Capital Budgeting 121
1. Identification of various investments proposals: The capital budgeting may
have various investment proposals. The proposal for the investment opportunities
may be defined from the top management or may be even from the lower rank.
The heads of various department analyse the various investment decisions, and
will select proposals submitted to the planning committee of competent authority.
2. Screening or matching the proposals: The planning committee will analyse the
various proposals and screenings. The selected proposals are considered with the
available resources of the concern. Here resources referred as the financial part
of the proposal. This reduces the gap between the resources and the investment
cost.
3. Evaluation: After screening, the proposals are evaluated with the help of various
methods, such as pay back period proposal, net discovered present value method,
accounting rate of return and risk analysis. Each method of evaluation used in
detail in the later part of this chapter. The proposals are evaluated by.
(a) Independent proposals
(b) Contingent of dependent proposals
(c) Partially exclusive proposals.
Independent proposals are not compared with another proposals and the same
may be accepted or rejected. Whereas higher proposals acceptance depends upon
the other one or more proposals. For example, the expansion of plant machinery
leads to constructing of new building, additional manpower etc. Mutually exclusive
projects are those which competed with other proposals and to implement the
proposals after considering the risk and return, market demand etc.
4. Fixing property: After the evolution, the planning committee will predict which
proposals will give more profit or economic consideration. If the projects or
proposals are not suitable for the concern’s financial condition, the projects are
rejected without considering other nature of the proposals.
5. Final approval: The planning committee approves the final proposals, with the
help of the following:
(a) Profitability
(b) Economic constituents
(c) Financial violability
(d) Market conditions.
The planning committee prepares the cost estimation and submits to the
management.
6. Implementing: The competent autherity spends the money and implements the
proposals. While implementing the proposals, assign responsibilities to the proposals,
assign responsibilities for completing it, within the time allotted and reduce the cost
for this purpose. The network techniques used such as PERT and CPM. It helps
the management for monitoring and containing the implementation of the proposals.
122 Financial Management
7. Performance review of feedback: The final stage of capital budgeting is actual
results compared with the standard results. The adverse or unfavourable results
identified and removing the various difficulties of the project. This is helpful for
the future of the proposals.
KINDS OF CAPITAL BUDGETING DECISIONS
The overall objective of capital budgeting is to maximize the profitability. If a firm
concentrates return on investment, this objective can be achieved either by increasing the
revenues or reducing the costs. The increasing revenues can be achieved by expansion or
the size of operations by adding a new product line. Reducing costs mean representing
obsolete return on assets.
METHODS OF CAPITAL BUDGETING OF EVALUATION
By matching the available resources and projects it can be invested. The funds available
are always living funds. There are many considerations taken for investment decision
process such as environment and economic conditions.
The methods of evaluations are classified as follows:
(A) Traditional methods (or Non-discount methods)
(i) Pay-back Period Methods
(ii) Post Pay-back Methods
(iii) Accounts Rate of Return
(B) Modern methods (or Discount methods)
(i) Net Present Value Method
(ii) Internal Rate of Return Method
(iii) Profitability Index Method
Methods of Capital Budgeting
Traditional
Method
Post pay-back
Method
Accounting
Rate of Return
Net present
Value
Method
Internal Rate
of Return
Method
Profitability
Index
Method
Modern
Methods
Pay-back
Method
Fig. 9.2 Capital Budgeting Methods
Pay-back Period
Pay-back period is the time required to recover the initial investment in a project.
Capital Budgeting 123
(It is one of the non-discounted cash flow methods of capital budgeting).
Pay-back period =
Initial investment
Annual cash inflows
Merits of Pay-back method
The following are the important merits of the pay-back method:
1. It is easy to calculate and simple to understand.
2. Pay-back method provides further improvement over the accounting rate return.
3. Pay-back method reduces the possibility of loss on account of obsolescence.
Demerits
1. It ignores the time value of money.
2. It ignores all cash inflows after the pay-back period.
3. It is one of the misleading evaluations of capital budgeting.
Accept/Reject criteria
If the actual pay-back period is less than the predetermined pay-back period, the project
would be accepted. If not, it would be rejected.
Exercise 1
Project cost is Rs. 30,000 and the cash inflows are Rs. 10,000, the life of the project is
5 years. Calculate the pay-back period.
Solution =
Rs. 30,000
Rs. 10,000
= 3 Years
The annual cash inflow is calculated by considering the amount of net income on the
amount of depreciation project (Asset) before taxation but after taxation. The income
precision earned is expressed as a percentage of initial investment, is called unadjusted rate
of return. The above problem will be calculated as below:
Unadjusted rate of return =
Annual Return
Investment
× 100
=
Rs. 10,000
× 100
Rs. 30,000
= 33.33%
Exercise 2
A project costs Rs. 20,00,000 and yields annually a profit of Rs. 3,00,000 after
depreciation @ 12½% but before tax at 50%. Calculate the pay-back period.
124 Financial Management
Profit after depreciation 3,00,000
Tax 50%
1,50,000
1,50,000
Add depreciation
20,00,000 1
2
12 % 2,50,000
Cash in flow 4,00,000
Solution
Pay-back period =
Investment
Cash flow
=
20,00,000
4,00,000
= 5 years.
Uneven Cash Inflows
Normally the projects are not having uniform cash inflows. In those cases the pay-back
period is calculated, cumulative cash inflows will be calculated and then interpreted.
Exercise 3
Certain projects require an initial cash outflow of Rs. 25,000. The cash inflows for 6
years are Rs. 5,000, Rs. 8,000, Rs. 10,000, Rs. 12,000, Rs. 7,000 and Rs. 3,000.
Solution
Year Cash Inflows (Rs.) Cumulative Cash Inflows (Rs.)
1 5,000 5,000
2 8,000 13,000
3 10,000 23,000
4 12,000 35,000
5 7,000 42,000
6 3,000 45,000
The above calculation shows that in 3 years Rs. 23,000 has been recovered Rs. 2,000, is
balance out of cash outflow. In the 4th year the cash inflow is Rs. 12,000. It means the
pay-back period is three to four years, calculated as follows
Pay-back period = 3 years+2000/12000×12 months
= 3 years 2 months.
Post Pay-back Profitability Method
One of the major limitations of pay-back period method is that it does not consider the cash
inflows earned after pay-back period and if the real profitability of the project cannot be
assessed. To improve over this method, it can be made by considering the receivable after
the pay-back period. These returns are called post pay-back profits.
Capital Budgeting 125
Exercise 4
From the following particulars, compute:
1. Payback period.
2. Post pay-back profitability and post pay-back profitability index.
(a) Cash outflow Rs. 1,00,000
Annual cash inflow Rs. 25,000
(After tax before depreciation)
Estimate Life 6 years
(b) Cash outflow Rs. 1,00,000
Annual cash inflow
(After tax depreciation)
First five years Rs. 20,000
Next five years Rs. 8,000
Estimated life 10 Years
Salvage value Rs. 16,000
Solution
(a) (i) Pay-back period
=
Initial investment
Annual cash inflows
=
1,00,000
25,000 = 4 Years
(ii) Post pay-back profitability
=Cash inflow (Estimated life – Pay-back period)
=25,000 (6 – 4)
=Rs. 50,000
(iii) Post pay-back profitability index
=
50,000
1,00,000
× 100 = 50%
(b) Cash inflows are equal, therefore pay back period is calculated as follows:
(i)
Year Cash Inflows (Rs.) Cumulative Cash Inflows (Rs.)
1 20,000 20,000
2 20,000 40,000
3 20,000 60,000
4 20,000 80,000
Contd....
126 Financial Management
5 20,000 1,00,000
6 8,000 1,08,000
7 8,000 1,16,000
8 8,000 1,24,000
9 8,000 1,32,000
10 8,000 1,40,000
(ii) Post pay-back profitability.
= Cash inflow (estimated life – pay-back period)
= 8,000 (10–5)
= 8000×5 = 40,000
(iii) Post pay-back profitability index
=
40,000
1,00,000
×100=40%
Accounting Rate of Return or Average Rate of Return
Average rate of return means the average rate of return or profit taken for considering
the project evaluation. This method is one of the traditional methods for evaluating
the project proposals:
Merits
1. It is easy to calculate and simple to understand.
2. It is based on the accounting information rather than cash inflow.
3. It is not based on the time value of money.
4. It considers the total benefits associated with the project.
Demerits
1. It ignores the time value of money.
2. It ignores the reinvestment potential of a project.
3. Different methods are used for accounting profit. So, it leads to some difficulties
in the calculation of the project.
Accept/Reject criteria
If the actual accounting rate of return is more than the predetermined required rate of
return, the project would be accepted. If not it would be rejected.
Exercise 5
A company has two alternative proposals. The details are as follows:
Capital Budgeting 127
Proposal I Proposal II
Automatic Machine Ordinary Machine
Cost of the machine Rs. 2,20,000 Rs. 60,000
Estimated life 5½ years 8 years
Estimated sales p.a. Rs. 1,50,000 Rs. 1,50,000
Costs : Material 50,000 50,000
Labour 12,000 60,000
Variable Overheads 24,000 20,000
Compute the profitability of the proposals under the return on investment method.
(M.Com., Madras and Bharathidasan)
Solution
Profitability Statement
Automatic Ordinary
Machine Machine
Cost of the machine Rs. 2,20,000 Rs. 60,000
Life of the machine 5½ years 8 years
Rs. Rs.
Estimated Sales (A) 1,50,000 1,50,000
Less : Cost : Material 50,000 50,000
Labour 12,000 60,000
Variable overheads 24,000 20,000
Depreciation (1) 40,000 7,000
Total Cost (B) 1,26,000 1,37,000
Profit (A) – (B) 24,000 12,500
Working:
(1) Depreciation = Cost ÷ Life
Automatic machine = 2,20,000 ÷ 5½ = 40,000
Ordinary machine = 60,000 ÷ 8 = 7,500
Return on investment =
Average profit
Original investment
× 100
=
24,000
2,20,000
× 100
12,500
60,000
× 100
10.9% 20.8%
Automatic machine is more profitable than the ordinary machine.
128 Financial Management
Net Present Value
Net present value method is one of the modern methods for evaluating the project proposals.
In this method cash inflows are considered with the time value of the money. Net present
value describes as the summation of the present value of cash inflow and present value of
cash outflow. Net present value is the difference between the total present value of future
cash inflows and the total present value of future cash outflows.
Merits
1. It recognizes the time value of money.
2. It considers the total benefits arising out of the proposal.
3. It is the best method for the selection of mutually exclusive projects.
4. It helps to achieve the maximization of shareholders’ wealth.
Demerits
1. It is difficult to understand and calculate.
2. It needs the discount factors for calculation of present values.
3. It is not suitable for the projects having different effective lives.
Accept/Reject criteria
If the present value of cash inflows is more than the present value of cash outflows, it
would be accepted. If not, it would be rejected.
Exercise 6
From the following information, calculate the net present value of the two project and
suggest which of the two projects should be accepted a discount rate of the two.
Project X Project Y
Initial Investment Rs. 20,000 Rs. 30,000
Estimated Life 5 years 5 years
Scrap Value Rs. 1,000 Rs. 2,000
The profits before depreciation and after taxation (cash flows) are as follows:
Year 1 Year 2 Year 3 Year 4 Year 5
Rs. Rs. Rs. Rs. Rs.
Project x 5,000 10,000 10,000 3,000 2,000
Project y 20,000 10,000 5,000 3,000 2,000
Capital Budgeting 129
Note : The following are the present value factors @ 10% p.a.
Year 1 2 3 4 5 6
Factor 0.909 0.826 0.751 0.683 0.621 0.564
(MBA, Madurai-Kamaraj University, May 2005)
Solution
Cash Inflows Present Present Value of Net Cash
Value of Rs. Inflow
Year Project X Rs. Project Y Rs. 1 @ 10% Project X Rs. Project Y Rs.
1 5,000 20,000 0.909 4,545 18,180
2 10,000 10,000 0.826 8,260 8,260
3 10,000 5,000 0.751 7,510 3,755
4 3,000 3,000 0.683 2,049 2,049
5 2,000 2,000 0.621 1,242 1,242
Scrap Value 1,000 2,000 0.621 621 1,245
Total present valueInitial 24,227 34,728
investments 20,000 30,000
Net present value 4,227 4,728
Project Y should be selected as net present value of project Y is higher.
Exercise 7
The following are the cash inflows and outflows of a certain project.
Year Outflows Inflows
0 1,75,000 -
1 5,50,000 35,000
2 45,000
3 65,000
4 85,000
5 50,000
The salvage value at the end of 5 years is Rs. 50,000. Taking the cutoff rate as 10%,
calculate net present value.
Year 1 2 3 4 5
P.V. 0.909 0.826 0.751 0.683 0.621
Solution
Year Cash Inflows Present Value Present Value
Rs. Factor @ 10% of Cash Inflows
1 35,000 0.909 31,815
2 45,000 0.826 37,170
Contd....
130 Financial Management
3 65000 0.751 48815
4 85000 0.683 58055
5 50000 0.621 31050
5(Salvage) 50000 0.621 31050
Total present value
of cash inflows 237955
Less : Total present value of outflows
Cash outflow at the beginning 1,75,000
Cash outflow at the end of first
Year 50000×0.909 45,450
Total value of outflows 2,20,450
Net Present Value 17,505
If the cash inflows are not given in that cases the calculation of cash inflows are
Net profit after tax+Depreciation. In this type of situation first find out the Net
profit after depreciation and deducting the tax and then add the deprecation. It gives
the cash inflow.
Exercise 8 From the following information you can learn after tex and depreciation
concept.
Initial Outlay Rs. 1,00,000
Estimated life 5 Years
Scrap Value Rs. 10,000
Profit after tax :
End of year 1 Rs. 6,000
2 Rs. 14,000
3 Rs. 24,000
4 16,000
5 Nil
Solution Depreciation has been calculated under straight line method. The cost of
capital may be taken at 10%. P.a. is given below.
Year 1 2 3 4 5
PV factor @ 10% 0.909 0.826 0.751 0.683 0.621
Depreciation =
Initial cash outflow – scrap value
Estimated Life of the project
=
1,00,000 –10,000
5
=
90,000
5
= Rs.18,000
Capital Budgeting 131
Year Profit after Tax Depreciation Cash Inflow
1 6,000 18,000 24,000
2 14,000 18,000 32,000
3 24,000 18,000 42,000
4 16,000 18,000 34,000
5 Nil 18,000 18,000
Net Present Value
Year Cash Inflow Discount factor @ 10% Present value (Rs.)
1 24,000 0.909 21,816
2 32,000 0.826 26,432
3 42,000 0.751 31,542
4 34,000 0.683 23,222
5 18,000 0.621 11,178
Total present value of cash inflows 1,14,190
Less : Initial cash investment 1,00,000
Net present value 1,41,90
Internal Rate of Return
Internal rate of return is time adjusted technique and covers the disadvantages of the
traditional techniques. In other words it is a rate at which discount cash flows to zero.
It is expected by the following ratio:
Cash inflow
Investment initial
Steps to be followed:
Step1. find out factor
Factor is calculated as follows:
F=
Cash outlay (or) initial investment
Cash inflow
Step 2. Find out positive net present value
Step 3. Find out negative net present value
Step 4. Find out formula net present value
Formula
IRR =Base factor +
Positive net present value
DP
Difference in positive and
Negative net present value
×
132 Financial Management
Base factor = Positive discount rate
DP = Difference in percentage
Merits
1. It consider the time value of money.
2. It takes into account the total cash inflow and outflow.
3. It does not use the concept of the required rate of return.
4. It gives the approximate/nearest rate of return.
Demerits
1. It involves complicated computational method.
2. It produces multiple rates which may be confusing for taking decisions.
3. It is assume that all intermediate cash flows are reinvested at the internal rate
of return.
Accept/Reject criteria
If the present value of the sum total of the compounded reinvested cash flows is greater than
the present value of the outflows, the proposed project is accepted. If not it would be rejected.
Exercise 9
A company has to select one of the following two projects:
Project A Project B
Cost Rs.22,000 20,000
Cash inflows:
Year 1 12,000 2,000
Year 2 4,000 2,000
Year 3 2,000 4,000
Year 4 10,000 20,000
Using the Internal Rate of Return method suggest which is Preferable.
Solution
F =
Cash outlay
Cash inflow
Project A
Cash Inflow =
Total cash inflow
No. of years
=
28,000
4
= 7000
Capital Budgeting 133
=
22000
7000
= 3.14
The factor thus calculated will be located in table II below. This would give the estimated
rate of return to be applied discounting the cash for the internal rate of returns. In this of
project A the rate comes to 10% while in case of project B it comes to15%.
Project A
Cash Inflows Discounting Factor Present Value
Year Rs. at 10% Rs.
1 12000 0.909 10908
2 4000 0.826 3304
3 2000 0.751 1502
4 10000 0.683 6830
22544
Less: Initial Investment. 22000
Net Present Value 544
The present value at 10% comes to Rs. 22,544. The initial investment is Rs. 22,000.
Interest rate of return may be taken approximately at 10%.
In the case more exactness is required another trial which is slightly higher than
10%(since at this rate the present value is more than initial investment) may be taken.
Taking a rate of 12% the following results would emerge.
Cash Inflows Discounting Factor Present Value
Year Rs. at 12.6% Rs.
1 12,000 0.893 10,716
2 4,000 0.794 3,188
3 2,000 0.712 1,424
4 10,000 0.636 6,380
21,688
Less: Initial Investment Value 22,000
Net Present Value (–)312
IRR=Base factor +
Positive net present value
DP
Difference in positive and
Negative net present value
×
Base factor= 10%
DP = 2%
134 Financial Management
= 10% +
544
544 – (–312)
×2%
= 10% +
5 4 4
8 5 6
×2
= 10+1.27
= 11.27%
Project B
Year Cash Inflows Discount Present value
Rs. Factor at 15% Rs.
1 2,000 0.909# 1,818
2 2,000 0.826 1,652
3 4,000 0.751 3,004
4 20,000 0.683 13,660
Total present value 20,134
Less: Initial investment 20,000
Net present value 134
IRR= 10%
134
134–(2676)
× 5%
= 10% + 0.24% IRR = 10.24%
Thus, internal rate of return in project ‘A’ is higher as compared to project ‘B’. Therefore
project ‘A’ is preferable.
Exercise 10
A project costs Rs. 16,000 and is expected to generate cash inflows of Rs. 4,000 each 5
years. Calculate the Interest Rate of Return.
Solution
F =
16,000
4,000
= 4
Facts may lays between 6% to 8%
4.221 for 6%
3.993 for 8%
4000 × 4.21 = 16,840
4000 × 3.99 = 15,960
6% present value 16,840
Less: Investment 16,000
Net present value 840
Capital Budgeting 135
8% present value 15,960
Less: Investment 16,000
–40
IRR = 6% +
840
840 – (–40)
×2%
= 6% +1.91%
= 7.91%.
Excess Present Value Index
Excess present value is calculated on basis of net present value. It gives the results in percentage.
Exercise 11
The initial of an equipment is Rs. 10,000. Cash inflow for 5 years are estimated to be Rs.
3,500 per year. The management is desired minimum rate of excess present value index.
Solution
Present value of Rs. 1 received annually for 5 years can be had form the annuity
table.
Present value of 3,500 received annually for 5 years.
Excess present value index =
Total present value of cash inflows
Total present value of cash outflows
=
11,732
10,000 × 100
= 117,32%
Capital Rationing
In the rationing the company has only limited investment the project are selected according
to the profitability. The project has selected the combination of proposal that will yield the
greatest portability.
Exercise 12 Let us assume that a firm has only Rs. 20 lakhs to invest and funds cannot
be provided. The various proposals along with the cost and profitability index are as follows.
Proposal Pool of the project Profitability Index
1 6,00,000 1.46
2 2,00,000 .098
3 10,00,000 2.31
4 4,00,000 1.32
5 3,00,000 1.25
136 Financial Management
Solution
In this example all proposals expect number 2 give profitability exceeding one and are
profitable investments. The total outlay required to be invested in all other (profitable)
project is Rs. 25,00,000(1+2+3+4+5) but total funds available with the firm are Rs. 20
lakhs and hence the firm has to do capital combination of project within a total which has
the lowest profitability index along with the profitable proposals cannot be taken.
RISK AND UNCERTAINLY IN CAPITAL BUDGETING
Capital budgeting requires the projection of cash inflow and outflow of the future.
The future in always uncertain, estimate of demand, production, selling price, cost etc.,
cannot be exact.
For example: The product at any time it become obsolete therefore, the future in
unexpected. The following methods for considering the accounting of risk in capital budgeting.
Various evaluation methods are used for risk and uncertainty in capital budgeting are as
follows:
(i) Risk-adjusted cut off rate (or method of varying discount rate)
(ii) Certainly equivalent method.
(iii) Sensitivity technique.
(iv) Probability technique
(v) Standard deviation method.
(vi) Co-efficient of variation method.
(vii) Decision tree analysis.
(i) Risk-adjusted cutoff rate (or Method of varying)
This is one of the simplest method while calculating the risk in capital budgeting
increase cut of rate or discount factor by certain percentage an account of risk.
Exercise 13 The Ramakrishna Ltd., in considering the purchase of a new investment.
Two alternative investments are available (X and Y) each costing Rs. 150000. Cash inflows
are expected to be as follows:
Cash Inflows
Year Investment X Investment Y
Rs. Rs.
1 60,000 65,000
2 45,000 55,000
3 35,000 40,000
4 30,000 40,000
The company has a target return on capital of 10%. Risk premium rate are 2% and
8% respectively for investment X and Y. Which investment should be preferred?
Capital Budgeting 137
Solution
The profitability of the two investments can be compared on the basis of net present
values cash inflows adjusted for risk premium rates as follows:
Investment X Investment Y
Discount Cash Present Discount Cash Present
Year Factor10% + 2% Inflow Value Factor Inflow Values
= 12% Rs. Rs. 10% + Rs.
8%=18%
1 0.893 60,000 53,580 0.847 85,000 71,995
2 0.797 45,000 35,865 0.718 55,000 39,490
3 0.712 35,000 24,920 0.609 40,000 24,360
4 0.635 30,000 19,050 0.516 40,000 20,640
1,33,415 1,56,485
Investment X
Net present value = 133415 – 150000
= – Rs. 16585
Investment Y
Net present value = 156485 – 150000
= Rs. 6485
As even at a higher discount rate investment Y gives a higher net present value,
investment Y should be preferred.
(ii) Certainly equivalent method
It is also another simplest method for calculating risk in capital budgeting info
reduceds expected cash inflows by certain amounts it can be employed by
multiplying the expected cash inflows by certainly equivalent co-efficient in order
the uncertain cash inflow to certain cash inflows.
Exercise 14
There are two projects A and B. Each involves an investment of Rs. 50,000. The
expected cash inflows and the certainly co-efficient are as under:
Project A Project B
Year Cash inflows Certainly Cash inflows Certainly
co-efficient Co-efficient
1 35,000 .8 25,000 .9
2 30,000 .7 35,000 .8
3 20,000 .9 20,000 .7
Risk-free cutoff rate is 10%. Suggest which of the two projects. Should be preferred.
138 Financial Management
Solution
Calculations of cash Inflows with certainly:
Year Project A Project B
Cash Certainly Certain Cash Certainly Certain
Inflow Co-efficient Cash Inflow Co-efficient Cash
Inflow Inflow
1 35,000 .8 28,000 25,000 .9 22,500
2 30,000 .7 21,000 35,000 .8 28,000
3 20,000 .9 18,000 20,000 .7 14,000
Calculation of present values of cash inflows:
Year Project A Project B
Discount Cash Present Cash Present
Factor @ 10% Inflows Values Inflows Value
1 0.909 28,000 25,452 22,500 20,453
2 0.826 21,000 17,346 28,000 23,128
3 0.751 18,000 13,518 14,000 10,514
Total 56,316 54,095
Project A Project B
Net present value = Rs. 56,316 – 50,000 54,095 – 50,000
= Rs. 6,316 Rs. 4,095
As the net present value of project A in more than that of project B. Project A should
be preferred:
(iii) Sensitivity technique
When cash inflows are sensitive under different circumstances more than one
forecast of the future cash inflows may be made. These inflows may be regarded
on ‘Optimistic’, ‘most likely’ and ‘pessimistic’. Further cash inflows may be
discounted to find out the net present values under these three different situations.
If the net present values under the three situations differ widely it implies that
there is a great risk in the project and the investor’s is decision to accept or reject
a project will depend upon his risk bearing activities.
Exercise 15
Mr. Selva is considering two mutually exclusive project ‘X’ and ‘Y’. You are required to
advise him about the acceptability of the projects from the following information.
Capital Budgeting 139
Project X Projects Y
Rs. Rs.
Cost of the investment 1,0,0000 1,00,000
Forecast cash inflows per annum for 5 years
Optimistic 60,000 55,000
Most likely 35,000 30,000
Pessimistic 20,000 20,000
(The cut-off rate may be assumed to be 15%).
Solution
Calculation of net present value of cash inflows at a discount rate of 15%.
(Annuity of Re. 1 for 5 years).
For Project X
Event Annual cash Discount factor Present value Net Present
Inflow Rs. @ 15 % Rs. value Rs.
Optimistic 60,000 3.3522 2,01,132 1,01,132
Most likely 35,000 3.3522 1,17,327 17,327
Pessimistic 20,000 3.3522 67,105 (32,895)
For Project Y
Event Annual cash Discount factor Present value Net Present
Inflow Rs. @ 15 % Rs. value Rs.
Optimistic 55,000 3.3522 1,84,371 84,371
Most likely 30,000 3.3522 1,00,566 566
Pessimistic 20,000 3.3522 67,105 (32,895)
The net present values on calculated above indicate that project Y is more risky as
compared to project X. But at the same time during favourable condition, it is more profitable
also. The acceptability of the project will depend upon Mr. Selva’s attitude towards risk. If
he could afford to take higher risk, project Y may be more profitable.
(iv) Probability technique
Probability technique refers to the each event of future happenings are assigned
with relative frequency probability. Probability means the likelihood of future
event. The cash inflows of the future years further discounted with the probability.
The higher present value may be accepted.
Exercise 16
Two mutually exclusive investment proposals are being considered. The following
information in available.
Project A (Rs.) Project B ( Rs.)
Cost 10,000 10,000
140 Financial Management
Cash inflows Year Rs. Probability Rs. Probability
1 10,000 .2 12,000 .2
2 18,000 .6 16,000 .6
3 8,000 .2 14,000 .2
Assuming cost of capital at (or) advise the selection of the project:
Solution
Calculation of net project values of the two projects.
Project A
Year P.V. Factor Cash Probability Monetary Present
@ 10 % Inflow Value Value Rs.
1 0.909 10,000 .2 2,000 1,818
2 0.826 18,000 .6 10,800 8,921
3 0.751 8,000 .2 1,600 1,202
Total Present value 11,941
Cost of Investment 10,000
Net present value 1,941
Project B
Year P.V. Factor Cash Probability Monetary Present
@ 10 % Inflow Value Value Rs.
1 0.909 12,000 .2 2,400 2,182
2 0.826 14,000 .6 8,400 6,938
3 0.751 14,000 .2 2,800 2,103
Total present value 11,223
Cost of investment 10,000
Net present value 1,223
As net present value of project A is more than that of project B after taking into
consideration the probabilities of cash inflows project A is more profitable one.
(v) Standard deviation method
Two Projects have the same cash outflow and their net values are also the same,
standard durations of the expected cash inflows of the two Projects may be
calculated to measure the comparative and risk of the Projects. The project having
a higher standard deviation in said to be more risky as compared to the other.
Exercise 17
From the following information, ascertain which project should be selected on the
basis of standard deviation.
Capital Budgeting 141
Project X Project Y
Cash inflow Probability Cash inflow Probability
Rs. Rs.
3,200 .2 32,000 .1
5,500 .3 5,500 .4
7,400 .3 7,400 .4
8,900 .2 8,900 .1
Solution
Project X
Cash inflow Deviation Square Probability Weighted
from Deviations Deviations
Mean (d) d2
(td2
)
1 2 3 4 5
3,200 (–) 6,250 9,30,25,000 .2 18,60,500
5,500 (–) 750 56,2,500 .3 1,68,750
7,400 (+) 1,150 13,22,500 .3 3,96,750
8,900 (+) 2,650 70,22,500 .2 14,04,500
n= 1 Σfd2
= 38,30,500
Standard Deviation (6) =
Σ 2
fd
n
=
3830500
1
= 1957.2
Project Y
1 2 3 4 5
3,200 (–) 3,050 9,30,25,000 .1 9,30,250
5,500 (–) 750 5,62,500 .4 2,25,000
7,400 (+) 1,150 13,22,500 .4 5,29,000
8,900 (+) 2,650 70,22,500 .1 7,02,250
n= 1 Σfd2
= 3830500
Standard deviation(6) =
Σ 2
fd
n
142 Financial Management
=
2386500
1
= 1544.8
As the standard deviation of project X is more then that of project Y, A is more risky.
(vi) Co-efficient of variation method
Co-efficient of variation is a relative measure of dispersion. It the projects here
the same cost but different net present values, relatives measure, i.e., Co-efficient
of variation should be risk induced. It can be calculated as:
Co-efficient of variation =
Standard deviation
mean
× 100
Exercise 18
Using figure of previous example compute co-efficient of variation and suggest which
proposal should be accepted:
Solution
For project X =
1957.2
6250
×100
= 31.31%
For project Y =
1544.8
6250
×100
= 29.52%
As the co-efficient of variation of project ‘X’ in more then that ‘Y’ project X in more risk.
Hence, project Y should be selected.
(vii) Decision tree analysis
In the modern business world, putting the investments are become more complex
and taking decisions in the risky situations. So, the decision tree analysis helpful
for taking risky and complex decisions, because it consider all the possible event’s
and each possible events are assigned with the probability.
Construction of Decision Tree
1. Defined the problem
2. Evaluate the different alternatives
3. Indicating the decision points
4. Assign the probabilities of the monetary values
5. Analysis the alternatives.
Capital Budgeting 143
Accept/Reject criteria
If the net present values are in positive the project may be accepted otherwise it is rejected.
Exercise 19
Mr. Kumar in considering an investment proposal of Rs.40,000. The expected returns
during the left of the investment are as under:
Year I
Event Cash Inflow Probability
(i) 16,000 .3
(ii) 24,000 .5
(iii) 20,000 .2
Year II
Cash inflows in year1 are:
16,000 24,000 20,000
Cash Prob Cash Prob Cash Prob
Inflows Inflows Inflows
(Rs.) (Rs.) (Rs.)
(i) 30,000 .2 40,000 .1 5,000 .2
(ii) 40,000 .6 60,000 .8 8,000 .5
(iii) 50,000 .2 80,000 .1 12,000 .3
using 10% as the cost of capital, advise about the acceptability of the proposal:
Solution
Calculation of net present values of cash inflows
Year Year I Year II Net Present Joint Expected Net
Prob. Prob. Value Prob. Present value
Cash Inflow Cash Inflow of Inflow
2 30,000 (–) 676 .06 (–) 40.56
.3 1,6000 .6 40,000 7,584 .18 1,365.12
.2 50,000 15,844 .06 950.64
Cash outflow .1 20,000 14,856 .04 742.80
Rs.40,000 .5 24,000 .8 60,000 31,376 .10 2,550.40
.1 80,000 47,896 .06 2,394.80
.2 50,000 19,480 .04 779.20
.2 20,000 .5 80,000 44,260 .10 4,426.00
.3 1,20,000 77,300 .06 4,638.00
1.00 27,806.40
144 Financial Management
As the proposal yields a net present value of +27806.40 at a discount for of 10%
other proposal may be accepted.
MODEL QUESTIONS
1. What is capital budgeting? Explain its needs and importance.
2. What are the stages of capital budgeting process?
3. Explain the various methods of capital budgeting techniques.
4. What is risk and uncertainty?
5. Calculate the payback period from the following information:
Cash outlay Rs. 50,000 and cash inflow Rs. 12,500. (Ans. 4 years)
6. From the following information, calculate the pay-back periods for the 3 projects.
Which liquors Rs. 2,00,000 each? Suggest most profitable project.
Year Project I Project II Project III
1 50,000 60,000 35,000
2 50,000 70,000 45,000
3 50,000 75,000 85,000
4 50,000 45,000 50,000
5 50,000 – 35,000
7. The machine cost Rs. 1,00,000 and has scrap value of Rs. 10,000 after 5 years. The
net profits before depreciation and taxes for the five years period are to be projected
that Rs. 20,000, Rs. 24,000, Rs. 30,000, Rs. 26,000 and Rs. 22,000. Taxes are
50%. Calculate pay-back period and accounting rate of return.
(Ans. 4 years 3 months and 11.2%)
8. A company has to choose one of the following two actually exclusive machine.
Both the machines have to be depreciated. Calculate NPV.
Cash inflows
Year Machine X Machine Y
0 –20,000 –20,000
1 5,500 6,200
2 6,200 8,800
3 7,800 4,300
4 4,500 3,700
5 3,000 2,000
(Ans. Machine X is recommended)
Capital Budgeting 145
9. A machine cost Rs. 1,25,000. The cost of capital is 15%. The net cash inflows
are as under:
Year Rs.
1 25,000
2 35,000
3 50,000
4 40,000
5 25,000
Calculate internal rate of return and suggest whether the project should be
accepted of cost. (Ans. Reject the machine)
10. Which project will be selected under NPU and IRR?
A B
Cash outflow 2,00,000 3,00,000
Cash inflows at the end of
1 Year 60,000 40,000
2 Year 50,000 50,000
3 Year 50,000 60,000
4 Year 40,000 90,000
5 Year 30,000 1,00,000
Cost of capital is 10%.
(Reject the two projects because less then the cost of capital).
11. SP Limited company is having two projects, requiring a capital outflow of
Rs. 3,00,000. The expected annual income after depreciation but before tax is
as follows:
Year Rs.
1 9,000
2 80,000
3 70,000
4 60,000
5 50,000
Depreciation may be taken as 20% of original cost and taxation at 50% of net
income:
You are required 10 calculated
(a) Pay-back period (b) Net present value
(c) According rate of return (d) Net present value index.
(e) Internal rate of return.
(Ans. 3.5 years, Rs. 25,745, 43.437%, 108.58%, 13.87%)
146 Financial Management
12. From the following information, select which project is better.
Cash Inflows (Year) I II
0 –20,000 –20,000
1 7,000 8,000
2 7,000 9,000
3 6,000 5,000
Risk less discount rate is 5%. Project I is less risks as compared to project II.
The management consider risk premium rates at 5% and 10% respectively
appropriate for discounting the cash inflows.
13. There are two mutually exclusive projects I and II. Each projects requires an
investment of Rs. 60,000. The following are the cash inflows and certainly
co-efficient are as follows.
Project I Project II
Year Cash inflow Certainty Cash Inflow Certainty
Co-efficient Co-efficient
1 30,000 .7 25,000 .9
2 25,000 .8 25,000 .8
3 25,000 .9 30,000 .7
Risk-free cutoff rate is 10%. Evaluate which project will be considered.
(Ans. Project II is considered)
14. Mr. X is considering two mutually exclusive investment I and II. From the
following details advice Mr. X.
Project I Project II
Cost of investment 75,000 75,000
Annual income for 5 years Optimistic 37,500 41,250
Most likely 26,250 22,500
Pesionistic 15,000 15,000
The cutoff rate is 12%.
(Ans. Project B is preferred)
Capital Budgeting 147
15. Two mutually exclusive projects are being considered. The following detail is
available.
Year Project A Project B
Rs. Profitability Rs. Profitability
1 12,000 - 12,000 -
2 10,000 .2 10,000 .2
3 15,000 .6 20,000 .6
4 25,000 .2 20,000 .2
(Ans. select Project B)
16. Mr. A is considering two mutually exclusive investment projects, from following
information select the Project on the basis of standard deviation and co-efficient
of variation method.
Cash Project I Project II
Rs. 15,000. Rs. 15,000
Cash inflow Rs. Probabilities Rs. Probabilities
Year
1 3,000 .3 4,000 .1
2 4,000 .2 6,000 .4
3 7,000 .3 7,000 .3
4 6,000 .2 3,000 .2
(Ans. I Rs. 1673 and 33.46%
II Rs. 1581 and 31.62%
Select Project II)
17. Mr. X is considering the project an investment of Rs. 26,000. The expensed
returns during the life if the project of are as follows:
Year I Event Cash inflow Probability
a 12,000 .2
b 14,000 .6
c 9,000 .2
Year II
Cash inflows is year I are.
Rs. 12,000 Rs. 14,000 Rs. 9,000
Cash inflow Probability Cash inflow Probability Cash inflow Probability
1 18,000 .3 22,000 .2 28,000 .4
2 20,000 .4 26,000 .7 32,000 .5
3 20,000 .3 30,000 .1 35,000 .1
Using 10% as the use of capital, advise about the acceptability of the proposal.
(Ans. Accept the project because+Rs. 6657 at 10%)
This page
intentionally left
blank
INTRODUCTION
Working capital management is also one of the important parts of the financial management.
It is concerned with short-term finance of the business concern which is a closely related
trade between profitability and liquidity. Efficient working capital management leads to
improve the operating performance of the business concern and it helps to meet the short-
term liquidity. Hence, study of working capital management is not only an important part
of financial management but also are overall management of the business concern.
Working capital is described as the capital which is not fixed but the more common
uses of the working capital is to consider it as the difference between the book value of
current assets and current liabilities.
This chapter deals with the following important aspects of the working capital
management.
• Meaning of Working Capital
• Concept of Working Capital
• Types of Working Capital
• Needs of Working Capital
• Factors determining Working Capital
• Computation of Working Capital
• Sources of Working Capital
• Working Capital Management Policy
• Working Capital and Banking Committee
MEANING OF WORKING CAPITAL
Capital of the concern may be divided into two major headings.
150 Financial Management
Capital
Fixed Capital Working Capital
Fig. 10.1 Capital of the Business
Fixed capital means that capital, which is used for long-term investment of the business
concern. For example, purchase of permanent assets. Normally it consists of non-recurring
in nature.
Working Capital is another part of the capital which is needed for meeting day to day
requirement of the business concern. For example, payment to creditors, salary paid to
workers, purchase of raw materials etc., normally it consists of recurring in nature. It can
be easily converted into cash. Hence, it is also known as short-term capital.
Definitions
According to the definition of Mead, Baker and Malott, “Working Capital means Current
Assets”.
According to the definition of J.S.Mill, “The sum of the current asset is the working
capital of a business”.
According to the definition of Weston and Brigham, “Working Capital refers to a
firm’s investment in short-term assets, cash, short-term securities, accounts receivables
and inventories”.
According to the definition of Bonneville, “Any acquisition of funds which increases
the current assets, increase working capital also for they are one and the same”.
According to the definition of Shubin, “Working Capital is the amount of funds
necessary to cover the cost of operating the enterprises”.
According to the definition of Genestenberg, “Circulating capital means current assets
of a company that are changed in the ordinary course of business from one form to another,
for example, from cash to inventories, inventories to receivables, receivables to cash”.
CONCEPT OF WORKING CAPITAL
Working capital can be classified or understood with the help of the following two important
concepts.
Working Capital 151
Gross
Working
Capital
Net
Working
Capital
Fig. 10.2 Working Capital Concept
Gross Working Capital
Gross Working Capital is the general concept which determines the working capital concept.
Thus, the gross working capital is the capital invested in total current assets of the business
concern.
Gross Working Capital is simply called as the total current assets of the concern.
GWC = CA
Net Working Capital
Net Working Capital is the specific concept, which, considers both current assets and
current liability of the concern.
Net Working Capital is the excess of current assets over the current liability of the
concern during a particular period.
If the current assets exceed the current liabilities it is said to be positive working
capital; it is reverse, it is said to be Negative working capital.
NWC = C A – CL
Component of Working Capital
Working capital constitutes various current assets and current liabilities. This can be
illustrated by the following chart.
152 Financial Management
Working Capital
Cash in Hand
Current Assets Current Liability
Cash at Bank
Bills Receivable
Sundry Debtors
Shotr-term Loans Advances
Inventories
Prepaid Expenses
Accrued Income
Bills Payable
Sundry Creditors
Outstanding Expenses
Short-term Loans and Advances
Dividend Payable
Bank Overdraft
Provision for Taxation
TYPES OF WORKING CAPITAL
Working Capital may be classified into three important types on the basis of time.
Working Capital
Permanent
Working Capital
Temporary
Working Capital
Semi Variable
Working Capital
Seasonal Working
Capital
Special Working
Capital
Fig. 10.3 Types of Working Capital
Permanent Working Capital
It is also known as Fixed Working Capital. It is the capital; the business concern must
maintain certain amount of capital at minimum level at all times. The level of Permanent
Capital depends upon the nature of the business. Permanent or Fixed Working Capital will
not change irrespective of time or volume of sales.
Working Capital 153
Amount of
Working Capital
Permanent Working Capital
Time
Fig. 10.4 Permanent Working Capital
Temporary Working Capital
It is also known as variable working capital. It is the amount of capital which is required to
meet the Seasonal demands and some special purposes. It can be further classified into
Seasonal Working Capital and Special Working Capital.
The capital required to meet the seasonal needs of the business concern is called as
Seasonal Working Capital. The capital required to meet the special exigencies such as
launching of extensive marketing campaigns for conducting research, etc.
Temporary
Working
Capital
Amount
of Working
Capital
Time
Fig. 10.5 Temporary Working Capital
Semi Variable Working Capital
Certain amount of Working Capital is in the field level up to a certain stage and after that it
will increase depending upon the change of sales or time.
Semi Variable Working Capital
Time
Amount of
Working Capital
Fig. 10.6 Semi Variable Working Capital
154 Financial Management
NEEDS OF WORKING CAPITAL
Working Capital is an essential part of the business concern. Every business concern must
maintain certain amount of Working Capital for their day-to-day requirements and meet
the short-term obligations.
Working Capital is needed for the following purposes.
1. Purchase of raw materials and spares: The basic part of manufacturing process
is, raw materials. It should purchase frequently according to the needs of the
business concern. Hence, every business concern maintains certain amount as
Working Capital to purchase raw materials, components, spares, etc.
2. Payment of wages and salary: The next part of Working Capital is payment of
wages and salaries to labour and employees. Periodical payment facilities make
employees perfect in their work. So a business concern maintains adequate the
amount of working capital to make the payment of wages and salaries.
3. Day-to-day expenses: A business concern has to meet various expenditures
regarding the operations at daily basis like fuel, power, office expenses, etc.
4. Provide credit obligations: A business concern responsible to provide credit
facilities to the customer and meet the short-term obligation. So the concern must
provide adequate Working Capital.
Working Capital Position/ Balanced Working Capital Position.
A business concern must maintain a sound Working Capital position to improve the efficiency
of business operation and efficient management of finance. Both excessive and inadequate
Working Capital lead to some problems in the business concern.
A. Causes and effects of excessive working capital.
(i) Excessive Working Capital leads to unnecessary accumulation of raw
materials, components and spares.
(ii) Excessive Working Capital results in locking up of excess Working Capital.
(iii) It creates bad debts, reduces collection periods, etc.
(iv) It leads to reduce the profits.
B. Causes and effects of inadequate working capital
(i) Inadequate working capital cannot buy its requirements in bulk order.
(ii) It becomes difficult to implement operating plans and activate the firm’s
profit target.
(iii) It becomes impossible to utilize efficiently the fixed assets.
(iv) The rate of return on investments also falls with the shortage of Working
Capital.
(v) It reduces the overall operation of the business.
Working Capital 155
FACTORS DETERMINING WORKING CAPITAL REQUIREMENTS
Working Capital requirements depends upon various factors. There are no set of rules or
formula to determine the Working Capital needs of the business concern. The following
are the major factors which are determining the Working Capital requirements.
Working
Capital
Determinants
Factors Factors
Factors
Factors
Fig. 10.7 Factors Determining Working Capital Requirements
1. Nature of business: Working Capital of the business concerns largely depend
upon the nature of the business. If the business concerns follow rigid credit policy
and sell goods only for cash, they can maintain lesser amount of Working Capital.
A transport company maintains lesser amount of Working Capital while a
construction company maintains larger amount of Working Capital.
2. Production cycle: Amount of Working Capital depends upon the length of the
production cycle. If the production cycle length is small, they need to maintain
lesser amount of Working Capital. If it is not, they have to maintain large amount
of Working Capital.
3. Business cycle: Business fluctuations lead to cyclical and seasonal changes in the
business condition and it will affect the requirements of the Working Capital. In
the booming conditions, the Working Capital requirement is larger and in the
depression condition, requirement of Working Capital will reduce. Better business
results lead to increase the Working Capital requirements.
4. Production policy: It is also one of the factors which affects the Working Capital
requirement of the business concern. If the company maintains the continues
production policy, there is a need of regular Working Capital. If the production
policy of the company depends upon the situation or conditions, Working Capital
requirement will depend upon the conditions laid down by the company.
156 Financial Management
5. Credit policy: Credit policy of sales and purchase also affect the Working Capital
requirements of the business concern. If the company maintains liberal credit
policy to collect the payments from its customers, they have to maintain more
Working Capital. If the company pays the dues on the last date it will create the
cash maintenance in hand and bank.
6. Growth and expansion: During the growth and expansion of the business
concern, Working Capital requirements are higher, because it needs some additional
Working Capital and incurs some extra expenses at the initial stages.
7. Availability of raw materials: Major part of the Working Capital requirements
are largely depend on the availability of raw materials. Raw materials are the basic
components of the production process. If the raw material is not readily available,
it leads to production stoppage. So, the concern must maintain adequate raw
material; for that purpose, they have to spend some amount of Working Capital.
8. Earning capacity: If the business concern consists of high level of earning
capacity, they can generate more Working Capital, with the help of cash from
operation. Earning capacity is also one of the factors which determines the
Working Capital requirements of the business concern.
COMPUTATION (OR ESTIMATION) OF WORKING CAPITAL
Working Capital requirement depends upon number of factors, which are already discussed
in the previous parts. Now the discussion is on how to calculate the Working Capital needs
of the business concern. It may also depend upon various factors but some of the common
methods are used to estimate the Working Capital.
A. Estimation of components of working capital method
Working capital consists of various current assets and current liabilities. Hence,
we have to estimate how much current assets as inventories required and how
much cash required to meet the short term obligations.
Finance Manager first estimates the assets and required Working Capital for a
particular period.
B. Percent of sales method
Based on the past experience between Sales and Working Capital requirements, a
ratio can be determined for estimating the Working Capital requirement in future.
It is the simple and tradition method to estimate the Working Capital requirements.
Under this method, first we have to find out the sales to Working Capital ratio and
based on that we have to estimate Working Capital requirements. This method also
expresses the relationship between the Sales and Working Capital.
C. Operating cycle
Working Capital requirements depend upon the operating cycle of the business.
The operating cycle begins with the acquisition of raw material and ends with
the collection of receivables.
Working Capital 157
Operating cycle consists of the following important stages:
1. Raw Material and Storage Stage, (R)
2. Work in Process Stage, (W)
3. Finished Goods Stage, (F)
4. Debtors Collection Stage, (D)
5. Creditors Payment Period Stage. (C)
R
D W
F
O = R + W + F + D–C
Fig. 10.8 Working Capital Cycle
Each component of the operating cycle can be calculated by the following formula:
R =
Average Stock of Raw Material
Average Raw Material Consumption Per Day
W =
Average Work in Process Inventory
Average Cost of Production Per Day
F =
Average Finished Stock Inventory
Average Cost of Goods Sold Per Day
D =
Average Book Debts
Average Credit Sales Per Day
C =
Average Trade Creditors .
Average Credit Purchase Per Day
Exercise 1
From the following information extracted from the books of a manufacturing company,
compute the operating cycle in days and the amount of working capital required:
158 Financial Management
Period Covered 365 days
Average period of credit allowed by suppliers 16 days
Average Total of Debtors Outstanding 480 00
Raw Material Consumption 4,400 00
Total Production Cost 10,000 00
Total Cost of Sales 10,500 00
Sales for the year 16,000 00
Value of Average Stock maintained:
Raw Material 320 00
Work-in-progress 350 00
Finished Goods 260 00
(ICWA Final, JUNE, 1986 adapted)
Solution
Computation of Operating Cycle
(i) Raw material held in stock:
Average stocks of raw materials held
Average consumption per day
=
320
4,400 × 365
=
320 × 365
4,400
= 275 days
Less: Average credit period granted by Suppliers
16 days
11 days
(ii) Work-in-progress:
Average WIP maintained
Average cost of production per day
=
350
10,000/365
=
365 × 320
10,000
= 13 days
(iii) Finished good held in stock:
Average finished goods maintained
Average cost of goods sold per days
=
260
10,500/365
=
260 × 365
10,500
= 9 days
Working Capital 159
(iv) Credit period allowed to debtors:
Average total of outstanding debtors
Average credit sales per day =
480
16,000 × 365
=
365 × 480
16,000
= 11days
Total operating cycle period: (i) + (ii) + (iii) + (iv) = 44 days
Number of Operating cycles in a year = 365/44
= 8.30
Amount of Working Capital required =
Total operating cost
Number of operating
cycles in a year
= 10,500/8.3
= Rs. 1,265
Alternatively, the amount of working capital could have also been calculated by
estimating the components of working capital method, as shown below:
Value of Average Stock Maintained 320
Raw Material 350
Work-in-progress 260
Finished Goods 480
Average Debtors Outstanding: 1,410
Less: Average Creditors Outstanding 145
1,265
WORKING CAPITAL MANAGEMENT POLICY
Working Capital Management formulates policies to manage and handle efficiently; for
that purpose, the management established three policies based on the relationship between
Sales and Working Capital.
1. Conservative Working Capital Policy.
2. Moderate Working Capital Policy.
3. Aggressive Working Capital Policy.
1. Conservative working capital policy: Conservative Working Capital Policy refers
to minimize risk by maintaining a higher level of Working Capital. This type of
Working Capital Policy is suitable to meet the seasonal fluctuation of the
manufacturing operation.
160 Financial Management
2. Moderate working capital policy: Moderate Working Capital Policy refers to the
moderate level of Working Capital maintainance according to moderate level of sales.
It means one percent of change in Working Capital, that is Working Capital is equal
to sales.
3. Aggressive working capital policy: Aggressive Working Capital Policy is one
of the high risky and profitability policies which maintains low level of Aggressive
Working Capital against the high level of sales, in the business concern during
a particular period.
Conservative Policy
Moderate Policy
Aggressive
Policy
Current Assets
Sales
Fig. 10.9 Working Capital Policies
SOURCES OF WORKING CAPITAL
Working Capital requirement can be normalized from short-term and long-term sources.
Each source will have both merits and limitations up to certain extract. Uses of Working
Capital may be differing from stage to stage.
Sources
Long-term Short-term
Shares Debenture Public
Deposit
Loans
from
Financial
Institutions
Retained
Earning
Bank
Loan and
Credit
Arrangements
Advances
Installment
Credit
Short-term
Instruments
Fig. 10.10 Sources of Working Capital
Working Capital 161
The above sources are also classified into internal sources and external sources of
working capital.
Internal sources such as:
• Retained Earnings
• Reserve and Surplus
• Depreciation Funds etc.
External sources such as:
• Debentures and Public Deposits
• Loans from Banks and Financial Institutions
• Advances and Credit
• Financial arrangements like Factoring, etc.
Determining the Finance Mix
Determining the finance mix is an important part of working capital management. Under
this decision, the relationship among risk, return and liquidity are measured and also which
type of financing is suitable to meet the Working Capital requirements of the business
concern. There are three basic approaches for determining an appropriate Working Capital
finance mix.
1. Hedging or matching approach
2. Conservative approach
3. Aggressive approach.
Hedging Approach
Hedging approach is also known as matching approach. Under this approach, the
business concern can adopt a financial plan which matches the expected life of assets with
the expected life of the sources of funds raised to finance assets.
When the business follows matching approach, long-term finance shall be used to fixed
assets and permanent current assets and short-term financing to finance temporary or
variable assets.
Permanent Current Assets
Fixed Assets
Long-term
Financing
Financing
Time
Assets
Temporary Current Assets
Short-term
Fig. 10.11 Financing under Matching Approach
162 Financial Management
Conservative Approach
Under this approach, the entire estimated finance in current assets should be financed
from long-term sources and the short-term sources should be used only for emergency
requirements. This approach is called as “Low Profit – Low Risk” concept.
Permanent Current Assets
Fixed Assets
Long-term
Financing
Short-term
Time
Assets
Temporary Current Assets
Financing
Fig. 10.12 Conservative Approach
Aggressive Approach
Under this approach, the entire estimated requirement of current assets should be
financed from short-term sources and even a part of fixed assets financing be financed
from short- term sources. This approach makes the finance mix more risky, less costly and
more profitable.
Permanent Current Assets
Fixed Assets
Time
Long-term
Financing
Short-term
Assets
Temporary Current Assets
Financing
Fig. 10.13 Aggressive Approach
Working Capital 163
WORKING CAPITAL AND BANKING COMMITTEE
Banking finance to working capital requirements is a very important part of the business
concern. Banks provide finance to business concerns to meet the requirements. To regulate
and control bank finance, RBI constitute committees. These committees submit reports
with findings and recommendations to formulate the finance policy of the banks. The
major committee and the recommendations are as follows:
Committee Year Major Recommendations
DEHEJIA 1969 Appraisal of credit applications received by banks for granting loan.
TANDON 1975 Banks must carry out the realize appraisal for granting loan Fixation
of norms for bank lending to industry.
CHORE 1980 No bifurcation of cash credit accounts separate limits for peak
level and non peak level requirements.
MARATHE 1984 Second method of lending to industry, introduction of fast track
concept.
KANNAN 1997 Regular conduct with the borrowers, periodical monitoring the credit
disposition.
MODEL QUESTIONS
1. What is working capital? Define it.
2. Discuss the concept of working capital?
3. What are the types of working capital.
4. Explain the needs of working capital.
5. Critically explain the factors affecting the requirement of working capital.
6. Explain the working capital management policy.
This page
intentionally left
blank
Management of Working Capital is also an important part of financial manager. The main
objective of the Working Capital Management is managing the Current Asset and Current
Liabilities effectively and maintaining adequate amount of both Current Asset and Current
Liabilities. Simply it is called Administration of Current Asset and Current Liabilities of the
business concern.
Management of key components of working capital like cash, inventories and receivables
assumes paramount importance due to the fact the major potion of working capital gets
blocked in these assets.
Meaning
Working capital management is an act of planning, organizing and controlling the
components of working capital like cash, bank balance inventory, receivables, payables,
overdraft and short-term loans.
Definition
According to Smith K.V, “Working capital management is concerned with the problems
that arise in attempting to manage the current asset, current liabilities and the inter-
relationship that exist between them”.
According to Weston and Brigham, “Working capital generally stands for excess of
current assets over current liabilities. Working capital management therefore refers to all
aspects of the administration of both current assets and current liabilities”.
INVENTORY MANAGEMENT
Introduction
Inventories constitute the most significant part of current assets of the business concern.
It is also essential for smooth running of the business activities.
166 Financial Management
A proper planning of purchasing of raw material, handling, storing and recording is to be
considered as a part of inventory management. Inventory management means, management
of raw materials and related items. Inventory management considers what to purchase,
how to purchase, how much to purchase, from where to purchase, where to store and
when to use for production etc.
Meaning
The dictionary meaning of the inventory is stock of goods or a list of goods. In accounting
language, inventory means stock of finished goods. In a manufacturing point of view,
inventory includes, raw material, work in process, stores, etc.
Kinds of Inventories
Inventories can be classified into five major categories.
A. Raw Material
It is basic and important part of inventories. These are goods which have not yet
been committed to production in a manufacturing business concern.
B. Work in Progress
These include those materials which have been committed to production process
but have not yet been completed.
C. Consumables
These are the materials which are needed to smooth running of the manufacturing
process.
D. Finished Goods
These are the final output of the production process of the business concern. It
is ready for consumers.
E. Spares
It is also a part of inventories, which includes small spares and parts.
Objectives of Inventory Management
Inventory occupy 30–80% of the total current assets of the business concern. It is also
very essential part not only in the field of Financial Management but also it is closely
associated with production management. Hence, in any working capital decision regarding
the inventories, it will affect both financial and production function of the concern. Hence,
efficient management of inventories is an essential part of any kind of manufacturing process
concern.
The major objectives of the inventory management are as follows:
• To efficient and smooth production process.
• To maintain optimum inventory to maximize the profitability.
• To meet the seasonal demand of the products.
Working Capital Management 167
• To avoid price increase in future.
• To ensure the level and site of inventories required.
• To plan when to purchase and where to purchase
• To avoid both over stock and under stock of inventory.
Techniques of Inventory Management
Inventory management consists of effective control and administration of inventories.
Inventory control refers to a system which ensures supply of required quantity and quality
of inventories at the required time and at the same time prevent unnecessary investment
in inventories. It needs the following important techniques.
Inventory management techniques may be classified into various types:
Inventory Management Technique
Techniques Based on
Order Quantity
Techniques Based on
the Records
Inventory
Budget
Inventory
Report
Aging
Schedule
HML
Analysis
VED
Analysis
ABC
Analysis
Techniques Based on
the Classification
Determination
of Stock Level
Determination
of Stock
Economic Order
Quality
Fig. 11.1 Inventory Management Techniques
A. Techniques based on the order quantity of Inventories
Order quantity of inventories can be determined with the help of the following
techniques:
Stock Level
Stock level is the level of stock which is maintained by the business concern at all times.
Therefore, the business concern must maintain optimum level of stock to smooth running
of the business process. Different level of stock can be determined based on the volume of
the stock.
168 Financial Management
Minimum Level
The business concern must maintain minimum level of stock at all times. If the stocks are
less than the minimum level, then the work will stop due to shortage of material.
Re-order Level
Re-ordering level is fixed between minimum level and maximum level. Re-order level is the
level when the business concern makes fresh order at this level.
Re-order level=maximum consumption × maximum Re-order period.
Maximum Level
It is the maximum limit of the quantity of inventories, the business concern must maintain.
If the quantity exceeds maximum level limit then it will be overstocking.
Maximum level = Re-order level + Re-order quantity
– (Minimum consumption × Minimum delivery period)
Danger Level
It is the level below the minimum level. It leads to stoppage of the production process.
Danger level=Average consumption ×
Maximum re-order period for
emergency purchase
Average Stock Level
It is calculated such as,
Average stock level= Minimum stock level +
½ of re-order quantity
maximum level
75
500
Stock Level
25
10
0
Optimum Level/Re-order Level
Average Stock Level
Minimum Level
Danger Level
Time
Fig. 11.2 Determining the Stock Level
Lead Time
Lead time is the time normally taken in receiving delivery after placing orders with suppliers.
The time taken in processing the order and then executing it is known as lead time.
Working Capital Management 169
Safety Stock
Safety stock implies extra inventories that can be drawn down when actual lead time and/
or usage rates are greater than expected. Safety stocks are determined by opportunity cost
and carrying cost of inventories. If the business concerns maintain low level of safety
stock, it will lead to larger opportunity cost and the larger quantity of safety stock involves
higher carrying costs.
Economic Order Quantity (EOQ)
EOQ refers to the level of inventory at which the total cost of inventory comprising ordering
cost and carrying cost. Determining an optimum level involves two types of cost such as
ordering cost and carrying cost. The EOQ is that inventory level that minimizes the total
of ordering of carrying cost.
EOQ can be calculated with the help of the mathematical formula:
EOQ = 2ab/c
Where,
a = Annual usage of inventories (units)
b = Buying cost per order
c = Carrying cost per unit
Minimum
Total Cost
Carrying Cost
Ordering Cost
Order Size
Cost
Q
Fig. 11.3 Economic Order Quantity
Exercise 1
(a) Find out the economic order quantity and the number of orders per year from
the following information:
Annual consumption: 36,000 units
Purchase price per units: Rs. 54
170 Financial Management
Ordering cost per order: Rs. 150
Inventory carrying cost is 20% of the average inventory.
Solution
Inventory =
2AO
C
A = 36,000 units
O = Rs. 150
C = 20% of 54×10×8
2×36,000×150 = 1,000 units
EOQ = 1,000 units
Exercise 2
From the following information calculate, (1) Re-order level (2) Maximum level
(3) Minimum level (4) Average level
Normal usage: 100 units per week
Maximum usage: 150 units per week
Minimum usage: 50 units per week
Re-order quantity (EOQ) 500: units
Log in time: 5 to 7 weeks
Solution
(1) Re-order Level
= Maximum consumption × Maximum Re-order period
= 150×7=1050 units
(2) Maximum Level
= Re-order level+Re-order quantity
–( Minimum consumption×Minimum delivery period)
= 1050 + 500 – (50 × 5) = 1300 units
(3) Minimum Level
= Re-order level – (Normal consumption×Normal delivery period)
= 1050 – (100 × 6 ) = 450 units
(4) Average Level
=
Maximum level + Minimum level
2
=
1300 + 450
2
= 875 units.
Working Capital Management 171
TECHNIQUES BASED ON THE CLASSIFICATION OF INVENTORIES
A-B-C analysis
It is the inventory management techniques that divide inventory into three categories
based on the value and volume of the inventories; 10% of the inventory’s item contributs
to 70% of value of consumption and this category is known as A category. About 20% of
the inventory item contributes about 20% of value of consumption and this category is
called category B and 70% of inventory item contributes only 10% of value of consumption
and this category is called C category.
Inventory Breakdown Between Value and Volume
Category Volume (%) Value (%)
A 10 70
B 20 20
C 70 10
Total 100 100
ABC analysis can be explained with the help of the following Graphical presentation.
Value of
Inventory (%)
Volume of Inventory (%)
A B C
Fig. 11.4 ABC Analysis
Aging Schedule of Inventories
Inventories are classified according to the period of their holding and also this method
helps to identify the movement of the inventories. Hence, it is also called as, FNSD analysis—
where,
F = Fast moving inventories
N = Normal moving inventories
S = Slow moving inventories
D = Dead moving inventories
172 Financial Management
This analysis is mainly calculated for the purpose of taking disposal decision of the
inventories.
VED Analysis
This technique is ideally suited for spare parts in the inventory management like ABC
analysis. Inventories are classified into three categories on the basis of usage of the
inventories.
V = Vital item of inventories
E = Essential item of inventories
D = Desirable item of inventories
HML Analysis
Under this analysis, inventories are classified into three categories on the basis of the value
of the inventories.
H = High value of inventories
M = Medium value of inventories
L = Low value of inventories
TECHNIQUES ON THE BASIS OF RECORDS
A. Inventory budget
It is a kind of functional budget which facilitates the estimated inventory required for the
business concern during a particular period. This budget is prepared based on the past
experience.
B. Inventory reports
Preparation of periodical inventory reports provides information regarding the order level,
quantity to be procured and all other information related to inventories. On the basis of
these reports, Management takes necessary decision regarding inventory control and
Management in the business concern.
Valuation of Inventories
Inventories are valued at different methods depending upon the situation and nature of
manufacturing process. Some of the major methods of inventory valuation are mentioned
as follows:
1. First in First Out Method (FIFO)
2. Last in First Out Method (LIFO)
3. Highest in First Out Method (HIFO)
4. Nearest in First Out Method (NIFO)
5. Average Price Method
Working Capital Management 173
6. Base Stock Method
7. Standard Price Method
8. Market Price Method
Exercise 3
From the particulars given below write up the stores ledger card :
1988 January 1, Opening stock 1,000 units at Rs. 26 each.
5 Purchased 500 units at Rs. 24.50 each.
7 Issued 750 units.
10 Purchased 1,500 units at Rs. 24 each.
12 Issued 1,100 units.
15 Purchased 1,000 units at Rs. 25 each.
17 Issued 500 units.
18 Issued 300 units.
25 Purchased 1,500 units at Rs. 26 each.
29 Issued 1,500 units.
Adopt the FIFO and LIFO method of issue and ascertain the value of the closing stock.
CASH MANAGEMENT
Business concern needs cash to make payments for acquisition of resources and services
for the normal conduct of business. Cash is one of the important and key parts of the
current assets.
Cash is the money which a business concern can disburse immediately without any
restriction. The term cash includes coins, currency, cheques held by the business concern
and balance in its bank accounts. Management of cash consists of cash inflow and outflows,
cash flow within the concern and cash balance held by the concern etc.
Motives for Holding Cash
1. Transaction motive
It is a motive for holding cash or near cash to meet routine cash requirements
to finance transaction in the normal course of business. Cash is needed to make
purchases of raw materials, pay expenses, taxes, dividends etc.
2. Precautionary motive
It is the motive for holding cash or near cash as a cushion to meet unexpected
contingencies. Cash is needed to meet the unexpected situation like, floods
strikes etc.
174
Financial
Management
(A) First in First out Method FIFO Method
Receipts Issues Balance
Date Particulars Qty. Rate Amount Qty. Rate Amount Qty. Rate Amount
Or Units Rs. P. Rs. Units Rs. P. Rs. Units Rs. P. Rs.
Reference
1998
Jan. 1 Balance
B/d 1,000 26.00 26,000
5 G.R.N. No. 500 24.50 12,250 1,000 26.00 26,000
500 24.50 12,250
7 M.R. No. 750 26.00 19,500 250 26.00 6,500
500 24.50 12,250
10 G.R.N. No. 1,500 24.00 36,000 250 26.00 6,500
500 24.50 12,250
1,500 24.00 36,000
250 26.00 6,500
500 24.50 12,250
350 24.00 8,400 1,150 24.00 27,600
12 M.R. No. 1,100
15 G.R.N No. 1,000 25.00 25,000 1,150 24.00 27,600
1,000 25.00 25,000
17 M.R No. 500 24.00 12,000 650 24.00 15,600
1,000 25.00 25,000
18 M.R. No. 300 24.00 7,200 350 24.00 8,400
1,000 25.00 25,000
25 G.R.N. No. 1,500 26.00 39,000 350 24.00 8,400
1,000 25.00 25,000
1,500 26 39,000
350 24.00 8,400
1,000 25.00 25,000
150 26.00 3,900 1,350 26.00 35,100
29 M.R. No 1,500
Closing stock 1,350 units at Rs. 26 each = Rs. 35,100
Note : G.R.N. No. = Goods Received Note Number.
M.R. No. = Material Requisition Number.
Working
Capital
Management
175
Receipts Issues Balance
Date Particulars Qty. Rate Amount Qty. Rate Amount Qty. Rate Amount
Or Units Rs. P. Rs. Units Rs. P. Rs. Units Rs. P. Rs.
Reference
1998
Jan. 1 Balance
B/d 1,000 26.00 26,000
5 G.R.N. No. 500 24.50 12,250 1,000 26.00 26,000
500 24.50 12,250
7 M.R. No. 750 26.00 19,500 250 26.00 6,500
500 24.50 12,250
10 G.R.N. No 1,500 24.00 36,000 250 26.00 6,500
500 24.50 12,250
1,500 24.00 36,000
250 26.00 6,500
500 24.50 12,250
350 24.00 8,400 1,150 24.00 27,600
12 M.R. No 1,100
15 G.R.N. No 1,000 25.00 25,000 1,150 24.00 27,600
1,000 25.00 25,000
17 M.R. No. 500 24.00 12,000 650 24.00 15,600
1,000 25.00 25,000
18 M.R. No. 300 24.00 7,200 350 24.00 8,400
1,000 25.00 25,000
25 G.R.N. No. 1,500 26.00 39,000 350 24.00 8,400
1,000 25.00 25,000
1,500 26.00 39,000
29 M.R. No. 1,500 26.00 39,000 750 26.00 19,500
400 24.00 9,600
200 25.00 5,000
(B) Last in first out method (LIFO)
Closing Stock = 1,350 units, valued at Rs. 34,100 (750×26+400×24+200×25)
Note : G.R.N. No. = Goods Received Note Number; M.R. No. = Material Requisition Number.
176 Financial Management
3. Speculative motive
It is the motive for holding cash to quickly take advantage of opportunities
typically outside the normal course of business. Certain amount of cash is needed
to meet an opportunity to purchase raw materials at a reduced price or make
purchase at favorable prices.
4. Compensating motive
It is a motive for holding cash to compensate banks for providing certain services
or loans. Banks provide variety of services to the business concern, such as
clearance of cheque, transfer of funds etc.
Cash Management Techniques
Managing cash flow constitutes two important parts:
A. Speedy Cash Collections.
B. Slowing Disbursements.
Speedy Cash Collections
Business concern must concentrate in the field of Speedy Cash Collections from customers.
For that, the concern prepares systematic plan and refined techniques. These techniques
aim at, the customer who should be encouraged to pay as quickly as possible and the
payment from customer without delay. Speedy Cash Collection business concern applies
some of the important techniques as follows:
Prompt Payment by Customers
Business concern should encourage the customer to pay promptly with the help of
offering discounts, special offer etc. It helps to reduce the delaying payment of customers
and the firm can avoid delays from the customers. The firms may use some of the techniques
for prompt payments like billing devices, self address cover with stamp etc.
Early Conversion of Payments into Cash
Business concern should take careful action regarding the quick conversion of the
payment into cash. For this purpose, the firms may use some of the techniques like postal
float, processing float, bank float and deposit float.
Concentration Banking
It is a collection procedure in which payments are made to regionally dispersed collection
centers, and deposited in local banks for quick clearing. It is a system of decentralized
billing and multiple collection points.
Lock Box System
It is a collection procedure in which payers send their payment or cheques to a nearby
post box that is cleared by the firm’s bank. Several times that the bank deposit the cheque
Working Capital Management 177
in the firms account. Under the lock box system, business concerns hire a post office lock
box at important collection centers where the customers remit payments. The local banks
are authorized to open the box and pick up the remittances received from the customers.
As a result, there is some extra savings in mailing time compared to concentration bank.
Slowing Disbursement
An effective cash management is not only in the part of speedy collection of its cash and
receivables but also it should concentrate to slowing their disbursement of cash to the
customers or suppliers. Slowing disbursement of cash is not the meaning of delaying the
payment or avoiding the payment. Slowing disbursement of cash is possible with the help
of the following methods:
1. Avoiding the early payment of cash
The firm should pay its payable only on the last day of the payment. If the firm
avoids early payment of cash, the firm can retain the cash with it and that can
be used for other purpose.
2. Centralised disbursement system
Decentralized collection system will provide the speedy cash collections. Hence
centralized disbursement of cash system takes time for collection from our accounts
as well as we can pay on the date.
Cash Management Models
Cash management models analyse methods which provide certain framework as to how
the cash management is conducted in the firm. Cash management models are the
development of the theoretical concepts into analytical approaches with the mathematical
applications. There are three cash management models which are very popular in the field
of finance.
1. Baumol model
The basic objective of the Baumol model is to determine the minimum cost amount of cash
conversion and the lost opportunity cost.
It is a model that provides for cost efficient transactional balances and assumes that the
demand for cash can be predicated with certainty and determines the optimal conversion size.
Total conversion cost per period can be calculated with the help of the following formula:
t=
Tb
C
where,
T = Total transaction cash needs for the period
b = Cost per conversion
C = Value of marketable securities
178 Financial Management
Opportunity cost can be calculated with the help of the following formula;
i =
C
2
where,
i = interest rate earned
C/2 = Average cash balance
Optimal cash conversion can be calculated with the help of the following formula;
C =
2bT
i
where,
C = Optimal conversion amount
b = Cost of conversion into cash per lot or transaction
T = Projected cash requirement
i = interest rate earned
2. Miller-Orr model
This model was suggested by Miller Orr. This model is to determine the optimum cash
balance level which minimises the cost of management of cash. Miller-Orr Model can be
calculated with the help of the following formula;
C =
bE (N)
t
+ iE (M)
where,
C = Total cost of cash management
b = fixed cost per conversion
E(M) = expected average daily cash balance
E (N) = expected number of conversion
t = Number of days in the period
i = lost opportunity cost
3. Orgler’s model
Orgler model provides for integration of cash management with production and other
aspects of the business concern. Multiple linear programming is used to determine the
optimal cash management.
Orgler’s model is formulated, based on the set of objectives of the firm and specifing the
set of constrains of the firm.
Working Capital Management 179
RECEIVABLE MANAGEMENT
The term receivable is defined as debt owed to the concern by customers arising from sale
of goods or services in the ordinary course of business. Receivables are also one of the
major parts of the current assets of the business concerns. It arises only due to credit sales
to customers, hence, it is also known as Account Receivables or Bills Receivables.
Management of account receivable is defined as the process of making decision resulting
to the investment of funds in these assets which will result in maximizing the overall return
on the investment of the firm.
The objective of receivable management is to promote sales and profit until that point is
reached where the return on investment in further funding receivables is less than the cost
of funds raised to finance that additional credit.
The costs associated with the extension of credit and accounts receivables are identified
as follows:
A. Collection Cost
B. Capital Cost
C. Administrative Cost
D. Default Cost.
Collection Cost
This cost incurred in collecting the receivables from the customers to whom credit sales
have been made.
Capital Cost
This is the cost on the use of additional capital to support credit sales which alternatively
could have been employed elsewhere.
Administrative Cost
This is an additional administrative cost for maintaining account receivable in the form of
salaries to the staff kept for maintaining accounting records relating to customers, cost of
investigation etc.
Default Cost
Default costs are the over dues that cannot be recovered. Business concern may not be
able to recover the over dues because of the inability of the customers.
Factors Considering the Receivable Size
Receivables size of the business concern depends upon various factors. Some of the important
factors are as follows:
180 Financial Management
1. Sales Level
Sales level is one of the important factors which determines the size of receivable of the firm. If
the firm wants to increase the sales level, they have to liberalise their credit policy and terms and
conditions.Whenthefirmsmaintainmoresales,therewillbeapossibilityoflargesizeofreceivable.
2. Credit Policy
Credit policy is the determination of credit standards and analysis. It may vary from firm to
firm or even some times product to product in the same industry. Liberal credit policy leads
to increase the sales volume and also increases the size of receivable. Stringent credit policy
reduces the size of the receivable.
3. Credit Terms
Credit terms specify the repayment terms required of credit receivables, depend upon the
credit terms, size of the receivables may increase or decrease. Hence, credit term is one of
the factors which affects the size of receivable.
4. Credit Period
It is the time for which trade credit is extended to customer in the case of credit sales.
Normally it is expressed in terms of ‘Net days’.
5. Cash Discount
Cash discount is the incentive to the customers to make early payment of the due date. A
special discount will be provided to the customer for his payment before the due date.
6. Management of Receivable
It is also one of the factors which affects the size of receivable in the firm. When the management
involves systematic approaches to the receivable, the firm can reduce the size of receivable.
Exercise 4
The board of directors of Aravind mills limited request you to prepare a statement
showing the working capital requirements for a level of activity of 30,000 units of output for
the year. The cost structure for the company’s product for the above mentioned activity level
is given below.
Cost per Unit (Rs.)
Raw materials 20
Direct labour 5
Overheads 15
Total 40
Profit 10
Selling price 50
Working Capital Management 181
(a) Past experience indicates that raw materials are held in stock, on an average for
2 months.
(b) Work in progress (100% complete in regard to materials and 50% for labour and
overheads) will be half a month’s production.
(c) Finished goods are in stock on an average for 1 month.
(d) Credit allowed to suppliers: 1 month.
(e) Credit allowed to debtors: 2 months.
(f) A minimum cash balance of Rs 25,000 is expected to be maintained.
Prepare a statement of working capital requirements.
Solution
Output per annum = 30,000 units
Output per annum = 12% of 30,000 =2,500 units
Raw materials p. m. Rs. 20×2500 = 50,000
Labour p. m. Rs. 5×2,500 = 12,500
Overheads p. m. Rs. 15×2,500 = 37,500
1,00,000
Statement of Working Capital Requirements
Particulars Rs. Rs.
Current assets
Stock of raw materials (2 months) 50,000 x 2 1,00,000
Work-in-progress (1/2 months)
Raw materials = 50,000 x ½ 25,000
Labour = 12,500 x ½ x 50/100 3,125
Overheads = 37,500 x ½ x 50/100 9,375
37,500
Stock of finished goods (1 month) 1, 00,000 x 1 1,00,000
Debtors (2 month) 1,00,000 x 2 2,00,000
Cash balance required 25,000
4,62,500
Less: current liability
Creditors (1 month) 50,000 x 1 50,000
(Working capital required) 4,12,500
Exercise 5
Prepare an estimate of working capital requirement from the following information of
a trading concern.
Projected annual sales 10,000 units
Selling price Rs. 10 per unit
182 Financial Management
Percentage of net profit on sales 20%
Average credit period allowed to customers 8 Weeks
Average credit period allowed by suppliers 4 Weeks
Average stock holding in terms of sales requirements 12 Weeks
Allow 10% for contingencies
Solution
Statement of Working Capital Requirements
Current Assets Rs.
Debtors (8 weeks)
80,000×8
52
12,307
(at cost)
Stock (12 weeks)
80,000×12
52
18,462
30,770
Less: Current Liability
Credits (4 weeks)
80,000×4
52
6,154
24,616
Add 10% for contingencies 2,462
Working Capital Required 27,078
Working Notes
Sales = 10000×10 = Rs. 1,00,000
Profit 20% of Rs. 1,00,000 = Rs. 20,000
Cost of Sales=Rs.1,00,000 – 20,000 = Rs. 80,000
As it is a trading concern, cost of sales is assumed to be the purchases.
Exercise 6
Prepare an estimate of working capital requirement from the following informations of
a trading concern.
Projected annual sales Rs. 6,50,000
Percentage of net profit on sales 25%
Average credit period allowed to debtors 10 Weeks
Average credit period allowed by creditors 4 Weeks
Average stock holding in terms of sales requirements 8 Weeks
Allow 20% for contingencies
(M.Com., M.S. University Nov. 2001)
Working Capital Management 183
Solution
Statement of Working Capital Requirements
Current Assets Rs.
Debtors (10 weeks) (at cost)
×
5,20,000 10
52
1,00,000
Stock (8 weeks)
×
5,20,000 8
52
80,000
1,80,000
Less: Current Liability
Credits ( 4 weeks)
×
5,20,000 4
52
40,000
1,40,000
Add 20% for contingencies 28,000
(Working Capital Required) 1,68,000
Working Notes
Sales=Rs. 6,50,000
Profit 25/125 of Rs. 6,50,000= Rs. 1,30,000
Cost of Sales=Rs. 6,50,000–1,30,000=Rs. 5,20,000
As it is a trading concern, cost of sales is assumed to be the purchases.
Exercise 7
A Performa cost sheet of a company provides the following particulars:
Elements of cost
Material 35%
Direct Labours 25%
Overheads 20%
Further particulars available are:
(i) It is proposed to maintain a level of activity of 2,50,000 units.
(ii) Selling price is Rs. 10/- per unit
(iii) Raw materials are to remain in stores for an average period of one month.
(iv) Finished foods are required to be in stock for an average period of one month.
(v) Credit allowed to debtors is 3 months.
(vi) Credit allowed by suppliers is 2 months.
You are required to prepare a statement of working capital requirements, a forecost
profit and loss account and balance sheet of the company assuring that
Share Capital Rs. 12,00,000
10% Debentures Rs. 3,00,000
Fixed Assets Rs. 11,00,000
184 Financial Management
Solution
Statement of Working Capital
Particulars Rs. Rs.
Current Assets
Stock of Raw Materials (1 Month)
(5,00,000 x 35% x 1/12) 72,917
Work in process (1/2 months)
Materials (25,00,000 x 35% x 1/24) 36,458
Labour (25,00,000 x 25% x 1/24) 26,041
Overheads (25,00,000 x 20% x 1/24) 20,833 83,332
Stock of finished goods (one month)
Materials (25,00,000 x 35% x 1/12) 72,917
Labour (25,00,000 x 25% x 1/12) 52,083
Overheads (25,00,000 x 20% x 1/12) 41,667 1,66,667
Debtors (2 months) At cost
Materials (25,00,000 x 35% x 3/12) 2,18,750
Labour (25,00,000 x 25% x 3/12) 1,56,250
Overheads (5,00,000 x 20% x 3/12) 1,25,000 5,00,000
8,22,916
Less: Current liability
Credits (2 Months) for raw materials
25,00,000 x 35% x 2/12 1,45,833
Net working capital required 6,77,083
Forecast Profit and Loss Account
Dr. Cr.
To Materials By cost of goods sold 20,00,000
(25,00,000 x 35%) 8,75,000
To Wages
(25,00,000 x 25%) 6,25,000
To Overheads
(25,00,000 x 20%) 5,00,000
20,00,000 20,00,000
To Cost of goods sold 20,00,000 By Sales 25,00,000
To Gross profit 5,00,000
25,00,000 25,00,000
To Interest on
debentures 30,000 By Gross profit 5,00,000
To Net profit 4,70,000
5,00,000 5,00,000
Working Capital Management 185
Forecast Balance Sheet
Liabilities Rs. Assets Rs.
Share capital 12,00,000 Fixed Assets 11,00,000
Net profit 4,70,000 Stock
10% debentures 3,00,000 Raw material 72,917
Credits 1,45,833 Work-in-process 38,458
Finished goods 1,66,667
Debtors 5,00,000
Cash and Bank Balance 2,37,791
21,15,833 21,15,833
Exercise 8
Selva and Co. desires to purchase a business and has consulted you and one point on
which you are to advise them is the average amount of working capital which will be required
in the first year’s working.
You have given the following estimates and instructed to add 10% to your computed
figure to allow for contingencies.
(i) Amount blocked up for stocks: Figures for the year
Stocks of finished product 3,000
Stocks of stores, materials, etc., 5,000
(ii) Average credit given:
Inland sales 4 weeks credit 26,000
Export sales— 1
2
1 weeks credit 65,000
(iii) Lag in payment of wages and other outputs
Wages— 1
2
1 weeks 2,40,000
Stocks of materials, etc.— 1
2
1 month 36,000
Rent, Royalties, etc.—4 months 8,000
Clerical staff— 1
2
1 month 60,000
Manager— 1
2 month 4,000
Miscellaneous expenses— 1
2
1 month 36,000
(iv) Payment in advance
Sundry Expenses (paid quarterly in advance) 6,000
(v) Undrawn profit on the average throughout the year 9,000
State your calculations for the average amount of working capital required.
186 Financial Management
Solution
Statement of Working Capital
Particulars Rs.
Current Assets
Stock of finished products 3,000
Stock of stores material, etc. 5,000
Sundry debtors
(a) Inland (4 weeks) 2,60,000 × 4/52 20,000
(b) Export Sales (1 1
2
weeks) 65,000 × 1.5
12
1,875
21,875
Payments in advance 6,000 × ¼ 1,500
31,375
Less: Lag in payment of wages (1 1
2
weeks) 24,000 × 1.5
12
6,923
Stock, Materials etc. (1 1
2
months) 8000 × 6
12
4,500
Rent, Royalties, etc. (6 months) 8000 × 61
12
4,000
Clerical staff (1 1
2
month) 60,000 × 1.5
12
7,500
Manager ( 1
2
month) 4000 × .5
12
167
Miscellaneous Expenses (1 1
2
months) 36,000 × 1.5
12
4,500
27,590
Net Working Capital 3,785
Add: 10% Margin for Contingencies 379
Net working capital required 4,164
Exercise 9
A performa cost sheet of a company provides the following particulars:
Elements of Cost Amt. Per Unit (Rs.)
Raw Materials 140
Direct Labours 60
Overheads 70
Total Cost 270
Profit 30
Selling Price 300
Further particulars available are:
Raw materials are in stock on an average for one month. Materials are in process on an
average for half a month. Finished goods are in stock on an average for one month.
Credit allowed by suppliers is one month – credit allowed to customers is two months. Lag in
payment of wages is 1 1
2
weeks. Lag in payment of overhead expenses is one month. One fourth
of the output is sold against cash. Cash in hand and at bank is expected to be Rs. 50,000.
Working Capital Management 187
You are required to prepare a statement showing the working capital needed to finance,
a level of activity of 2,40,000 units of production. You may assume that production is
carried on evenly throughout the year; wages and overhead accrue similarly and a time
period of 4 weeks is equivalent to a month.
Note: Year = 4×12 = 48 weeks
Solution
Statement of Working Capital
Particulars Rs. Rs.
Current Assets
(i) Stock of raw materials (4 weeks) 2,40,000 ×
140
48 28,00,000
= 7,00,000× 4
(ii) Work in process (2 weeks)
Raw materials 7,00,000 × 2 14,00,000
Direct labour 2,40,000 ×
60
48 , 3,00,000 × 2 6,00,000
Overheads 2,40,000 ×
70
48 7,00,000
350000 × 2 27,00,000
(iii) Stock of finished good (4 weeks)
Raw Materials 7,00,000× 4 28,00,000
Direct Labour 30,000 × 4 1,20,000
Overheads 3,50,000 × 4 14,00,000
54,00,000
(iv) Sundry Debtors (8 weeks)
Raw Materials 7,00,000 × 8 × 3
4
42,00,000
Direct Labour 3,00,000 × 8 × 3
4
18,00,000
Overheads 3,50,000 × 8 × 3
4
21,00,000 81,00,000
Cash in hand and at Bank 50,000
1,90,50,000
(–) Current Liabilities
(i) Sundry creditors (4 weeks) 7,00,000 × 4 28,00,000
(ii) Wages Outstanding (1 1
2 weeks) 3,00,000 × 3
2 4,50,000
(iii) Lag in payment of overhead (4 weeks) 3,50,000 × 4 14,00,000 46,50,000
Net Working Capital required 1,44,00,000
Exercise 10
Mr. Siva wishes to commerce a new trading business and gives the following
informations.
(i) The total estimated sales in a year will be Rs. 20,00,000.
(ii) His expenses are estimated fixed Expenses of Rs. 3,000 per month plus variable
expenses equal to 10% of his turnover.
(iii) He expects to fix a sales price for each product which will be 1
3
33 % in excess
of his cost of purchase.
188 Financial Management
(iv) He expects to turnover his stock six times in a year.
(v) The sales and purchases will be evenly spread throughout the year. All sales will
be for cash but he expects one month’s credit for purchases.
Calculate
(i) His estimated profit for the year.
(ii) His average working capital requirements.
Solution
(i) Estimated profit of Mr. Siva for the year
Sales 20,00,000
(–) Gross Profit ( 20,00,000 × 1 1
3 3
33 133 ) 5,00,000
Cost of goods sold 15,00,000
Gross Profit 5,00,000
(–) Expenses
Fixed (3,000×12) 36,000
Variable 20,00,000×10/100 2,00,000
2,36,000
Net Profit 2,64,000
(ii) Statement of working capital
Particulars Rs.
Current Assets
Stock
Turnover of stock is 6 times 2,50,000
Stock Turnover =
Cost of goods sold
Average stock at cost
6 =
15,00,000
Average stock at cost
6 × Average stock at cost = 15,00,000
Average stock at cost =
15,00,000
6
= 2,50,000
Cash
To meet fixed expenses = 3,000
To meet variable expenses
20,00,000 ×
10
100
×
1
12
= 16,667 19,667
Debtors
(as all sales are for cash only) –
2,69,667
Less: Current Liabilities:
Creditors (1 months)
15,00,000 ×
1
12 1,25,000
Working capital required 1,44,667
Working Capital Management 189
Exercise 11
From the informations given below, you are required to prepare a projected balance
sheet, profit and loss account and then an estimate of working capital requirements.
(a) Issued share capital 5,00,000
6% debentures 2,50,000
Fixed Assets at cost 2,50,000
(b) The expected ratios to selling price are
Raw materials 45%
Labour 20%
Overheads 15%
Profit 20%
(c) Raw materials are kept in store for an average of 1 1
2
months.
(d) Finished goods remain in stock for an average period of 2 months.
(e) Production during the previous year was 2,40,000 units and it is planned to
maintain the rate in the current year also.
(f) Each unit of production is expected to lag in process for half a month.
(g) Credit allowed to customers is two months and given by suppliers is one month.
(h) Selling price is Rs. 6 per unit.
(i) There is a regular production and sales cycle.
(j) Calculation of debtors may be made at selling price.
Solution
Rs.
(i) Calculation of sales
Total Sales = 2,40,000×6 14,40,000
(ii) Calculation of Amount blocked in inventories.
(a) Stock of Raw Material
1,44,000×
45
100
×
1.5
12
81,000
(b) Stock of finished goods at cost
(Material + Labour + Overheads)
80 2
1,44,000
100 12
× × 1,92,000
190 Financial Management
(c) Work-in progress at cost
(Material + Labour + Overheads)
80 .5
144000×
100 12
× 48,000
(iii) Calculation of Amount locked up in Debtors
Total sales 14,40,000
Debtors = 14,40,000×
2
12
2,40,000
(at selling price, as given)
(iv) Calculations of creditors
(For Raw Materials)
Total Purchases = 14,40,000×
45
100
6,48,000
Creditors = 6,48,000×
1
12
54,000
Projected profit and loss account
To Cost of Goods sold : By Sales 14,40,000
To Raw Materials 6,48,000
To Labour 2,88,000
To Overheads 2,16,000
To Gross Profit 2,88,000
14,40,000 14,40,000
To Interest on Debentures 15,000 By Gross Profit 2,88,000
To Net Profit 2,73,000
2,88,000 2,88,000
Projected balance sheet
Liability Rs. Assets Rs. Rs.
Share Capital 5,00,000 Fixed Assets (at cost) 2,50,000
6% Debentures 2,50,000 Current Assets
Profit and Loss A/c 2,73,000 Stock 81,000
Creditors 54,000 Work in Process 48,000
Finished Goods 1,92,000
Debtors 2,40,000
5,61,000
Cash and Bank (Balance for) 2,66,000
10,77,000
10,77,000
Working Capital Management 191
Exercise 12
V.S.M. Ltd. is engaged in large scale retail business. From the following informations
you are required to forecast their working capital requirements.
Projected Annual Sales Rs. 130 lakhs
Percentage of net profit on cost of sales 25%
Average credit period allowed to debtors 8 weeks.
Average credit period allowed by creditors 4 weeks.
Average stock carrying 8 weeks (in terms of sales requirements).
Add : 10% to computed figures to allow for contingencies.
(MBA/MK Uni. May 2005)
Solution
Sales 1,30,00,000
Gross profit 25% of sales 32,50,000
Cost of goods sold 97,50,000
Statement showing working capital
Particulars Rs.
Current Assets
(i) Debtors (97,50,000 x
8
52
) 15,00,000
(ii) Stock (97,50,000 x
8
52
) 15,00,000
Total current assets 30,00,000
(–) Current Liabilities
Creditors (97,50,000 x
4
52
) 7,50,000
Net working capital 22,50,000
Add: Contingencies 10% 2,25,000
Net Working Capital Required 24,75,000
Exercise 13
Prepare an estimate of working capital requirements.
(i) Projected annual sales—80,000 units.
(ii) Selling price Rs. 8 per unit.
(iii) Percentage of profit 20%.
(iv) Credit allowed to debtors—10 weeks.
(v) Credit allowed to suppliers—8 weeks.
(vi) Average stock holding (in terms of sales)—10 weeks.
(vii) Allow 20% for contingencies.
(MFM/Bharathidasan AP, 2002)
192 Financial Management
Solution
Sales 80,000 Units
Selling Price Rs. 8
Total sales in Rs. 6,40,000
Sales Rs. 6,40,000
Profit 20% of sales 1,28,000
Cost of Goods Sold 5,12,000
Statement of Working Capital
Particulars Rs.
Current Assets
i. Debtors (5,12,000 x
10
52
) 98,462
ii. Stock (5,12,000 x
10
52
) 98,462
Total Current Assets 1,96,924
Less: Current Liabilities
Creditors (5,12,000 x
8
52
) 78,769
Net Working Capital 1,18,155
Add : Contingencies 20% 23,631
Net Working Capital Required 1,41,786
Cash Management
Exercise 14
A Company expects to have Rs. 37500 cash in hand on 1st April, and requires you to
prepare an estimate of cash position during the three months.
April, May and June the following information is supplied to you:
Month Sales Purchases Wages Factory Office Selling
Rs. Rs. Rs. Expenses Expenses Expenses
Rs. Rs. Rs.
Feb 75,000 45,000 9,000 7,500 6,000 4,500
March 84,000 48,000 9,750 8,250 6,000 4,500
April 90,000 52,500 10,500 9,000 6,000 5,250
May 1,20,000 60,000 13,500 11,250 6,000 6,570
June 1,35,000 60,000 14,250 14,000 7,000 7,000
Other Information:
(i) Period of credit allowed suppliers 2 months.
(ii) 20% of sales for cash and period of credit allowed to customers for credit is one month.
(iii) Delay in payment of all expenses:1 month.
Working Capital Management 193
(iv) Income tax of Rs. 57,500 is due to be paid on June 15th.
(v) The company is to pay dividend to shareholders and bonus to workers of Rs.
15,000 and Rs. 22,500 respectively in the month of April.
(vi) A plant has been ordered to be received and paid in May. It will cost Rs. 1,20,000.
(Periyar University M.Com., Nov. 2005)
Cash Budgets of April, May, June
Particulars April May June
Opening Balance b/d 37,500 10,950
Sales (i) Cash 20% 18,000 24,000 27,000
(ii) Credit sales 67,200 72,000 96,000
(One month)
Total Receipts (A) 1,22,700 1,06,950 1,23,000
Payments :
Purchase 45,000 48,000 52,500
Wages 10,500 13,500 14,250
Factory Expenses 8,250 9,000 11,250
Office Expenses 6,000 6,000 6,000
Selling Expenses 4,500 5,250 6,570
Income Tax – – 57,500
Dividend to Shareholders 15,000 – –
Bonus to workers 22,500 – –
Plant Cost – 1,20,000 –
Total Payments (B) 1,11,750 2,01,750 1,48,070
Balance c/d (A-B) 10,950 (–)94,800 (–)25,070
Bank Overdraft – (+)94,800 (+)25,070
Assumed that the company has arranged overdraft facility.
Receivable Management
Exercise 15
A Company’s collection period pattern is as follows:
• 10% of sales in the same month
• 20% of sales in the second month
• 40% of sales in the third month
• 30% of sales in the fourth month
The sales of the company for the first three quarters of the year are as follows:
Month Quarter I Quarter II Quarter III
First 15,000 7,00 22,500
Second 15,000 15,000 15,000
Third 15,000 22,500 7,500
45,000 45,000 45,000
194 Financial Management
Working Days 90 90 90
You are required to calculate the average age of receivables and comment upon the
results.
(MFM/Bharathidasan University AP 2001)
Solution
The collection period of the company’s policy indicates that the outstanding receivables
at the end of each month will consist of 90% of the month’s sales, 70% of the previous
month’s sales and 30% of the sales made two months earlier.
Statement of Accounts receivable and their age.
Sales I Quarter II Quarter III Quarter
30% 1st Month 4,500 2,250 6,750
70% 2nd Month 10,500 10,500 10,500
90% 3rd Month 13,500 20,250 6,700
28,500 33,000 24,000
Average of receivable is =
Accounts receivable (Debtors)
Sales
× No. of working days
=
28,500
45,000
×90
33,000
45,000
× 90
24,000
45,000
× 90
= 57 Days 66 Days 48 Days
The average age of receivable is affected because of sales is fluctuation.
MODEL QUESTIONS
1. Discuss the objectives of inventories.
2. Explain various inventory control techniques.
3. What are the techniques of classification of inventory?
4. Explain the motives of holding cash.
5. Discuss the cash management techniques.
6. What is receivable management? Explain it.
7. S Ltd. is engaged in large-scale retail business. From the following particulars you
are required to calculate the working capital requirement.
Project annual sales Rs. 208 lakhs
% of net profit on cost of sales 1
3
33 %
Working Capital Management 195
Average credit period allowed to Drs. 6 weeks
Average credit period allowed to Crs. 3 weeks
Average stock (in term of sales) 6 weeks
Add 10% to allow for contingencies.
(Ans. 29.7 lakhs)
8. The following details relating to Mr. Santosh want to start trading business. You
are required to calculate.
(a) Estimate profit.
(b) Working capital requirements.
Estimate annual sales – Rs. 12,00,000
Expected profit on purchase – 1
3
33 %
Fixed expenders Rs. 3,000 pm. of which
Depreciation amounts to Rs. 600 and variable
Expenders chargeable to PLL a/c equal 8% of sales.
Stock term over – 6 times
Sales and purchases will occur evenly throughout the year
Creditors allowed 1 month credit
Debtors allowed 2 months credit
30% of cash sales.
(Ans. (a)Net Profit Rs. 1,68,000 (b) Working capital Rs. 32,25,400)
9. Calculate the working capital from the following particulars:
Rs.
(a) Annual Expenses:
Wages 52,000
Stores and Material 9,600
Office Salaries 12,480
Rent 2,000
Other Expenses 9,600
(b) Average amount of stock to be maintained:
Stock of finished goods 1,000
Stock of materials and stores 1,600
Expenses paid in advance:
Quarterly advance 1,600 p.a.
(c) Annual Sales
Home Market 62,400
Foreign Market 15,600
196 Financial Management
(d) Lag in payment of expenses:
Wages
1
1
2
weeks
Stores and Material
1
1
2
months
Office Salaries
1
1
2
months
Rent 6 months
Other Expenses
1
1
2
months
(e) Credit allowed to customers :
Home Market 6 weeks
Foreign Market
1
1
2
weeks
(M.Com. Rajasthan)
(Ans. 5,230)
10. Arvind Ltd. supplies the following informations for calculating the working
capital firm levels of activity of Rs. 2,40,000 units. The cost structure particulars
are:
Cost Per Unit
Rs.
Raw materials 30
Direct labour 10
over-heads 20
Total 60
Profit 15
Selling price 75
(a) Raw materials are in store on average for 1 month.
(b) Work in process (100% complete in regard to materials and 50% for labour
and overheads for half a month’s production.
(c) Finished goods remain in godown on average for a month.
(d) Suppliers one month to customers 2 months (calculation of customers may
be made on selling price).
(e) Minimum cash balance required is Rs, 30,000.
(f) The production is evenly throughout the year.
(Ans. Rs. 46,80,000)
11. The Board of Directors of Nanak Engineering Company Private Ltd. request you
to prepare a statement showing the working Capital Requirements for a level of
activity of Rs. 1,56,000 units of production.
Working Capital Management 197
The following informations are available for your calculations:
(A) Per unit (Rs.)
Raw Materials 90
Direct Labour 40
Overheads 75
205
Profit 60
Selling price per unit 265
(B)
(i) Raw materials are in stock, on average one month.
(ii) Materials are in process, on average 2 weeks.
(iii) Finished goods are in stock, on average one month.
(iv) Credit allowed by suppliers, one month.
(v) Time lag in payment from debtors, 2 months.
(vi) Lag in payment of wages,
1
1
2
weeks.
(vii) Lag in payment of overheads is one month.
20% of the output is sold against cash. Cash in hand and at bank is expected
to be Rs. 60,000. It is to be assumed that production is carried on evenly
throughout the year; wages and overheads accrue similarly and a time period
of 4 weeks is equivalent to a month. (C.A. Final)
(Ans. 66,06,000)
12. A company Ltd. supplies the following cost sheet:
Element of cost
Raw material — 45%
Labour — 15%
Overheads — 25%
The following further particulars are available.
(i) Raw materials remain in shares 5 weeks.
(ii) Cash in processing 4 weeks.
(iii) Finished goods in own house 6 weeks.
(iv) Credit period to customers 8 weeks supplie 4 weeks.
(v) Lag in payment wages 2 weeks.
(vi) Selling price per unit Rs. 60.
You are required to prepare the working capital requirements adding 15%
for contribution in all levels of activity of 1,04,000 units of production made
during the period.
(Ans. Rs. 20,17,100)
Note: Debtors, calculate on the basis of cost.
198 Financial Management
13. On 1 April the director of XYZ Ltd. wants to know the amount of working capital
required for the fourth coming year. Prepare a working capital and for cost the
Balance sheet.
Issued share capital — Rs. 3,00,000
6% Debentures (floating charge on assets) — Rs. 1,00,000
Fixed assets — Rs. 1,50,000
Production during the previous year — 72,000 units
Same level should continue during the current year.
The following is the cost sheet:
Raw materials — 40%.
Directs — 15%
Overheads — 25%
Raw materials are to remain in stock for 1 month, within process half a month,
finished goods in warehouse for two months.
Credit allowed to debtors 2 months and creditors 1 month.
Selling price Rs. 8.
Work-in-process may be assumed to be 100%.
Complete in materials, one 50% complete in direct ways and overheads.
(Ans. W/C Rs. 1,72,800; NP 1,09,200; B/S 4,00,000;
Rs. 58,000 cash/bank balancing figure)
This chapter deals with some of the important special finance such as leasing, venture
capital, foreign direct investment etc. and also this chapter covers the advantages and
disadvantages, application in the present position and institution, which are providing.
These finance to the business concern. This part is divided into the following major parts
such as:
1. Lease Financing
2. Venture Capital
3. Factoring
4. Foreign Direct Investment
5. Merchant Banking
6. Credit Rating
7. Mutual Funds
LEASE FINANCING
Lease financing is one of the popular and common methods of assets based finance, which
is the alternative to the loan finance. Lease is a contract. A contract under which one
party, the leaser (owner) of an asset agrees to grant the use of that asset to another leaser,
in exchange for periodic rental payments.
Lease is contractual agreement between the owner of the assets and user of the assets
for a specific period by a periodical rent.
Definition of Leasing
Lease may be defined as a contractual arrangement in which a party owning an asset provides
the asset for use to another, the right to use the assets to the user over a certain period of
time, for consideration in form of periodic payment, with or without a further payment.
200 Financial Management
According to the equipment leasing association of UK definition, leasing is a contract
between the lesser and the leaser for hire of a specific asset selected from a manufacturers
or vender of such assets by the lessee. The leaser retains the ownership of the asset. The
leassee pass possession and uses the asset on payment for the specified period.
Elements of Leasing
Leasing is one of the important and popular parts of asset based finance. It consists of the
following essential elements. One should understand these elements before they are going to
study on leasing.
1. Parties: These are essentially two parties to a contract of lease financing, namely
the owner and user of the assets.
2. Leaser: Leaser is the owner of the assets that are being leased. Leasers may be
individual partnership, joint stock companies, corporation or financial institutions.
3. Lease: Lease is the receiver of the service of the assets under a lease contract.
Lease assets may be firms or companies.
4. Lease broker: Lease broker is an agent in between the leaser (owner) and lessee.
He acts as an intermediary in arranging the lease deals. Merchant banking divisions
of foreign banks, subsidiaries indian banking and private foreign banks are acting
as lease brokers.
5. Lease assets: The lease assets may be plant, machinery, equipments, land,
automobile, factory, building etc.
Term of Lease
The term of lease is the period for which the agreement of lease remains for operations.
The lease term may be fixed in the agreement or up to the expiry of the assets.
Lease Rental
The consideration that the lesae pays to the leaser for lease transaction is the rental.
Type of Leasing
Leasing, as a financing concept, is an arrangement between two parties for a specified
period. Leasing may be classified into different types according to the nature of the
agreement. The following are the major types of leasing as follows:
(A) Lease based on the term of lease
1. Finance Lease
2. Operating Lease
(B) Lease based on the method of lease
1. Sale and lease back
2. Direct lease
Special Financing 201
(C) Lease based in the parties involved
1. Single investor lease
2. Leveraged lease
(D) Lease based in the area
1. Domestic lease
2. International lease
1. Financing lease
Financing lease is also called as full payout lease. It is one of the long-term leases
and cannot be cancelable before the expiry of the agreement. It means a lease
for terms that approach the economic life of the asset, the total payments over
the term of the lease are greater than the leasers initial cost of the leased asset.
For example: Hiring a factory, or building for a long period. It includes all
expenditures related to maintenance.
2. Operating lease
Operating lease is also called as service lease. Operating lease is one of the short-term
and cancelable leases. It means a lease for a time shorter than the economic life of
the assets, generally the payments over the term of the lease are less than the leaser’s
initial cost of the leased asset. For example: Hiring a car for a particular travel. It
includes all expenses such as driver salary, maintenance, fuels, repairs etc.
3. Sale and lease back
Sale and lease back is a lease under which the leasee sells an asset for cash to
a prospective leaser and then leases back the same asset, making fixed periodic
payments for its use. It may be in the firm of operating leasing or financial leasing.
It is one of the convenient methods of leasing which facilitates the financial
liquidity of the company.
4. Direct lease
When the lease belongs to the owner of the assets and users of the assets with
direct relationship it is called as direct lease. Direct lease may be Dipartite lease
(two parties in the lease) or Tripartite lease. (Three parties in the lease)
5. Single investor lease
When the lease belongs to only two parties namely leaser and it is called as single
investor lease. It consists of only one investor (owner). Normally all types of
leasing such as operating, financially, sale and lease back and direct lease are
coming under this categories.
6. Leveraged lease
This type of lease is used to acquire the high level capital cost of assets and equipments.
Under this lease, there are three parties involved; the leaser, the lender and the lessee.
Under the leverage lease, the leaser acts as equity participant supplying a fraction of
the total cost of the assets while the lender supplies the major part.
202 Financial Management
7. Domestic lease
In the lease transaction, if both the parties belong to the domicile of the same
country it is called as domestic leasing.
8. International lease
If the lease transaction and the leasing parties belong to the domicile of different
countries, it is called as international leasing.
Advantages of Leasing
Leasing finance is one of the modern sources of finance, which plays a major role in the
part of the asset based financing of the company. It has the following important advantages.
1. Financing of fixed asset
Lease finance helps to mobilize finance for large investment in land and building,
plant and machinery and other fixed equipments, which are used in the business
concern.
2. Assets based finance
Leasing provides finance facilities to procure assets and equipments for the
company. Hence, it plays a important and additional source of finance.
3. Convenient
Leasing finance is convenient to the use of fixed assets without purchasing. This
type of finance is suitable where the company uses the assets only for a particular
period or particular purpose. The company need not spend or invest huge amount
for the acquiring of the assets or fixed equipments.
4. Low rate of interest
Lease rent is fixed by the lease agreement and it is based on the assets which are
used by the business concern. Lease rent may be less when compared to the rate
of interest payable to the fixed interest leasing finance like debt or loan finance.
5. Simplicity
Lease formalities and arrangement of lease finance facilities are very simple and
easy. If the leaser agrees to use the assets or fixed equipments by the lessee, the
leasing arrangement is mostly finished.
6. Transaction cost
When the company mobilizes finance through debt or equity, they have to pay
some amount as transaction cost. But in case of leasing finance, transaction cost
or floating cost is very less when compared to other sources of finance.
7. Reduce risk
Leasing finance reduces the financial risk of the lessee. Hence, he need not buy
the assets and if there is any price change in the assets, it will not affect the lessee.
Special Financing 203
8. Better alternative
Now a days, most of the commercial banks and financial institutions are providing
lease finance to the industrial concern. Some of the them have specialised lease
finance company. They are established to provide faster and speedy arrangement
of lease finance.
Leasing Finance Institutions in India
Presently, leasing finance becomes popular and effective financial sources for most of the
business concerns. With the importance of lease finance, now a days banks and financial
institutions provide leasing financial assistance to the industrial concern. The following
institutions are famous and widely providing lease finance in India:
Leasing financial institutions in India may be classified into the following groups.
Leasing Institutions
Public Sector Private Sector
Leasing Institutions Leasing Institutions
Leasing by
Development
Institutions
Leasing by
Specialized
Institutions
Leasing
Company
Finance
Company
Fig. 12.1 Leasing Institutions
Leasing by Development Institutions
All India development institutions are providing leasing finance assistance to industrial
concerns. Some of the public sector leasing finance company in India are follows:
• Industrial Credit & Investment Corporation of India (ICICI)
• Industrial Finance Corporation of India (IFCI)
• Industrial Investment Bank of India (IIBI)
• Small Industries Development Corporation (SIDC)
• State Industrial Investment Corporation (SIIC)
Leasing by Specialized Institutions
Specialized financial institutions also provide lease finance to the industrial concern. Some
of the lease finance providing institutions are as follows:
• Life Insurance Corporation of India (LIC)
• General Insurance Corporation of India (GIC)
204 Financial Management
• Unit Trust of India (UTI)
• Housing Development Finance Corporation of India (HDFC)
Private Sector Leasing Company
Private sector leasing companies also provide financial assistance to the industrial concerns.
The following are the example of the private sector leasing companies in India:
• Express Leasing Limited
• 20th Century Leasing Corporation Ltd.
• First Leasing Company of India
• Mazda Leasing Limited
• Grover Leasing Limited
Private Sector Financial Company
Private sector financial companies also involve in the field of leasing finance. The following
are the example of the private sector finance companies:
• Cholamandal Investment and Finance Company Ltd.
• Dcl Finance Limited
• Sundaram Finance Limited
• Anagram Finance Limited
• Nagarjuna Finance Limited.
VENTURE CAPITAL
Introduction
Venture Capital finance is a new type of financial intermediary which has emerged in India
during 1980s. It is a long-term financial assistance provided to projects, which are established
to introduce new products, inventions, idea and technology. Venture capital finance is more
suitable to risky oriented business which consists of huge investment and provides results
after 5 to 7 year.
Meaning of Venture Capital
The term Venture Capital fund is usually used to denote Mutual funds or Institutional
investors. They provide equity finance or risk capital to little known, unregistered, highly
risky, young and small private business, especially in technology oriented and knowledge
intensive business.
Venture Capital termed as long-term funds in equity or semi-equity form to finance hi-tech
projects involving high risk and yet having strong potential of high profitability.
Definition of Venture Capital
According to Jame Koloski Morries, venture capital is defined as providing seed, start up
and first stage financing and also funding expansion of companies that have already
Special Financing 205
demonstrated their business potential but do not yet have access to the public securities
market or to credit oriented institutional funding sources. Venture Capital also provides
management in leveraged buy out financing.
1995 finance bill define Venture Capital as long-term equity investment in novel
technology based projects with display potential for significant growth and financial return.
Features of Venture Capital
Venture Capital consists of the following important features:
(1) Venture Capital consists of high risk and high return based financing.
(2) Venture Capital financing is equity and quasi equity financing instruments.
(3) Venture Capital provides moderate interest bearing instruments.
(4) Venture Capital reduces the financial burden of the business concern at the initial
stage.
(5) Venture Capital is suitable for risky oriented and high technology based industry.
Venture Capital in India
ICICI Venture Capital is the first Venture Capital Financing in India. It was started in 1988
by the joint venture of ICICI and UTI.
The UTI launched Venture Capital Unit Scheme (VECAUS-I) to raise finance in 1990.
Technology Development and Information Company (TDICI) is another major Venture
Capital financing institution in India.
Risk Capital and Technology Finance Corporation Ltd. (RCIFC) provides Venture
Capital finance to technology based industries.
ANZ Grindlays Bank has set up India’s first private sector Venture Capital fund.
SBI and Canara Bank are also involved in Venture Capital Finance. They provide
either equity capital or conditionals loans.
S.No Name of Venture Capital Year Funds under Management
1. Alliance Venture Capital Advisors Ltd May. 1997 SWISS TEC VCF Rs. 1000 Million
2. APIDC–Venture Capital Funds Aug. 1989 APIDE – VCF Rs. 300 Million
3. Baring Private Equity Partners India Ltd. Jan. 1992 BII – off shore fund
4. Canara Bank Venture Capital Fund Ltd. Feb. 1995 Canara Bank Venture Capital
Rs.164.25 Million
5. Draper International Mar. 1994 DII Rs. 2090 Million
6. Gujarat Venture Finance Ltd. July. 1990 GVCF Rs. 240 Million
7. HSBC Private Equity Management Mauritius Ltd. Apl. 1995 HSBC equity fund Rs. 2400 million
8. ICF Advisors Pvt. Ltd. July. 1997 Indian capital fund Rs. 750 Million
9. IL and FS Venture Corporation Ltd. Feb. 1986 IT fund Rs. 100 Million
10. Indus Venture Management Ltd. Feb. 1989 IVC Rs. 210 Million
Contd....
206 Financial Management
11. IDBI July. 1984 IDBI – Rs. 1823.32 Million
12. Industrial Venture Capital Ltd. Sep. 1996 TN Venture fund Rs. 90 Million
13. International Venture Capital Management Ltd. Feb. 1996 Nandi Investment $ 30 Million
14. JF Electra Advisors India Ltd. Aug. 1995 JFE–$ 24 Million
15. Marigold Capital Services Ltd. Aug. 1995 MM fund Rs. 200 Million
16. Pathfinder Investment Company Ltd. Nov. 1993 Rs. 299.50 Million
17. Risk Capital and Investment Company Pvt. Ltd. Jan. 1998 Rs.1000 Million
18. SIDBI Apl. 1990 Rs. 600 Million
19. TDICI Ltd. Jan. 1998 Rs. 5500 Million and $ 75 Million
20. Kitven Aug. 1998 Rs. 18 Crore
FACTORING
Factoring is a service of financial nature involving the conversion of credit bills into cash.
Accounts receivables, bills recoverables and other credit dues resulting from credit sales appear,
in the books of accounts as book credits. Here the risk of credit, risk of credit worthiness of the
debtor and as number of incidental and consequential risks are involved. These risks are taken
by the factor which purchase these credit receivables without recourse and collects them
when due. These balance-sheet items are replaced by cash received from the factoring agent.
Factoring is also called “Invoice Agent” or purchase and discount of all “receivables”.
Although these can be with recourse or without recourse, normally the risk is taken by the
factoring agent. The discount rate includes the loss of interest, risk of credit and risk of loss
of both principal and interest on the amount involved.
Myths on Factoring
Myth Fact
Factoring is nothing but bill discounting or bill finance Factoring and bill discounting are two different
products tailored for two different markets.
Factoring is meant for “Open account sales”
and caters largely to a buyer’s market. Bill
discounting is normally prevalent in a seller’s
market. Factoring unlike bill discounting offers
a continuous relationship.
Factoring reduces bankers business Factoring is not merely financing and includes
a package of services like collection and follow-
up of each invoice, credit insurance. MIS support
etc., and improves the health of bank’s clients,
improveds cash flow through factoring,
increases production cycles and need for more
working capital. Factoring essentially aims at
replacing high cost market credit and not
necessarily reduce bank finance.
Contd....
Special Financing 207
Factoring is an high cost borrowing Comparable to interest rates of banks. (SSI –
13.50% to 15.75% Non-SSI 13.50% to
17.25%) Will to offer SBI’s PLR selectively)
Factoring service charge is high Service Charge is 0.1% to 0.3% only whereas
in Bills discounting, the collection charge is
0.5% to 0.6%.
Factoring is meant for manufacturing units only Extended to all sectors namely Manufacturing,
Trading and Services.
Factoring limits falls within MBBF/ Assessed Factoring is to be classified as other Current
Bank finance liability as per RBI guidelines and Factoring
replaces market credit and not bank borrowings.
History of the Early Factoring in Roman
Factoring has not been documented as having been used by the Romans. However, the
word ‘factoring’ has a Roman root. It is derived from the Latin verb ‘facio’ which can be
translated as “he who does things”. In Roman times this referred to agent of a property
owner, i.e., his business manager. Though the root word has nothing to do with the industry,
as they attempt to help their clients through their financial problem.
Factoring in United States
Factoring arose in the United States during 19th century, as direct result of the inability of
manufacturers to maintain constant and timely communications with their sales forces in
the field. At that time, as the case today, the sales force was paid by communications. If all
sales were at the risk of the manufacturer, the salesman had no incentive to exercise prudence
in connection with whom to sell to on credit.
On the other hand, the distant manufacturer was not in the position to make the credit
risk on sales. The risk of defective or non-conforming merchandise remained with the
manufacturer. The credit risk was now separated from disputes as to quality, workmanship
and conformity of goods. Soon after, the salesman began to act as independent sales agencies.
It was common for them to act for more than one manufacturer. Still later the sales function
was separated from the credit function and “Traditional Factoring” as the people know, it
had, at that point, developed in the United States.
Factoring in India
Banks provide generally bill collection and bill discounting and with recourse. They provide
working capital finance based on these bills classified by amounts maturity wise. Such bills
if accumulated in large quantities will burden the liquidity and solvency position of the
company and reduces the credit limits from the banks. It is therefore felt necessary that the
company assigns these book debts to a factor for taking them off from the balance sheet.
This reduces the workload, increases the solvency and improves the liquidity position of
the company.
208 Financial Management
In 1998 a study group under the chairmanship of C.S. Kalyana Sundram was constituted
to examine the feasibility of factoring services in India, their constitution, organizational
set up and scope of activities. The group recommended the setting up of specialized agencies
or subsidiaries for providing the factoring services in India with a professional expertise in
credit assessment, debt collection and management of sales ledger, and other related services.
Defaults or delays in collection and repayment can still remain which is the risk to be
taken by the factor for a fee. The group has estimated a good potential for this service to
the tune of about Rs. 4000 crores mainly emerging a collection problem, and delays in
collection and consequential liquidity problems.
Later the Vaghul Committee report on money market reforms has confirmed the need
for factoring services to be developed in India as part of the money market instruments.
Many new instruments were already introduced like Participation certificates, Commercial
papers, Certificate of deposits etc., but the factoring service has not developed to any
significant extent in India.
The Reserve Bank allowed some banks to set up subsidiaries on a zonal basis to take care
of the requirements of companies in need of such service. Thus Canara Bank, State Bank of
India, Punjab National Bank and a few other banks have been permitted to set up jointly
some factor, for Eastern, Western, Northern, and Southern Zones. The progress of the activity
did not show any worth while dimension, so far.
Modus of Operations
If a company wants to factor its receivables it submits a list of customers, their credit
rating, amount involved in maturity and other terms. If the factor scrutinizes the list of
buyers and they are in the approved list, the factor gives its decision of the clients and the
amounts they may take all receivables on wholesale discounting basis. The factor then
takes all the documents in respect of approved list and pays up to 80% to 90% of the
amount due less commission to the company which in turn removes these instruments,
from base of accounts and shows cash flow as against bills receivables written off.
Factoring services rendered the following services:
1. Purchase of book debts and receivables.
2. Administration of sales ledger of the clients.
3. Prepayments of debts partially or fully.
4. Collection of book debts or receivables or with or without documents.
5. Covering the credit risk of the suppliers.
6. Dealing in book debts of customers without recourse.
Why Factoring?
Factoring is one of the most important and unavoidable part of the business concern which
meets the short-term financial requirement of the concern. Factoring is favorable to the
industrial concern for the following reasons.
Special Financing 209
1. Quickest response–Customer oriented timely decisions and decision on sanction
within a week.
2. Low cost.
3. Low service charges (0.1% to 0.3%).
4. Low margin (20% onwards).
5. Instant finance–against each invoice.
6. Generous grace period.
7. Improves cashflow.
8. Substitutes sundry creditors.
9. Increases sales through better terms on sales.
10. More operating cycles and more profits.
11. No upfront recovery of charges.
12. Interest on daily products.
13. Very easy to operate.
14. Flexible credit periods.
15. No penal interest up to grace period.
16. Empowers cash purchase.
17. Improves credit reputation.
18. Follow up of each invoice.
19. Collection of receivables.
20. MIS reports like customers overdue invoices enabling constant evaluation of
customers.
21. Outstation payments at nominal rates.
Mechanics of Factoring
(1) Places Order for Goods
(3) Delivery of Goods with Notice
Pay the Factor
CLIENT (SELLER) CUSTOMER (BUYER)
(2)
Fixation
of
customer
limits
(4)
Copy
of
invoice
(5)
Prepayment
up
to
80%
(9)
Balance
Amount
unpaid
(8)
Payment.
(7)
Follow
up
of
Unpaid
by
Due
Date
(6) Monthly Statement
FACTOR
.
.
. .
.
.
Fig. 12.2 Mechanics of Factoring
210 Financial Management
The following are the steps for factoring:
1. The customer places an order with the seller (client).
2. The factor and the seller enter into a factoring agreement about the various terms
of factoring.
3. Sale contract is entered into with the buyer and the goods are delivered. The
invoice with the notice to pay the factor is sent alongwith.
4. The copy of invoice covering the above sale to the factor, who maintains the sale ledger.
5. The factor prepays 80% of the invoice value.
6. The monthly statement are sent by the factor to the buyer.
7. Follow up action is initiated if there are any unpaid invoices.
8. The buyer settles the invoices on the expiry of the credit period allowed.
9. The balance 20% less the cost of factoring is paid by the factor to the client.
Types of factoring
(1) Notified factoring: Here, the customer is intimated about the assignment of debt
to a factor, also directed to make payments to the factor instead of to the firm.
This is invariably done by a legend and the invoice has been assigned to or sold
to the factor.
(2) Non-notified or confidential factoring: Under this facility, the supplier/factor
arrangement is not declared to the customer unless or until there is a breach of
the agreement on the part of the client, or exceptionally, where the factor considers
himself to be at risk.
(3) With recourse or without recourse factoring: Under recourse arrangements,
the client will carry the credit risk in respect of debts sold to the factor. In without
recourse factoring, the bad debts are borne by the factor.
(4) Bank Participation Factoring: The client creates a floating charge on the
factoring reserves in favour of banks and borrow against these reserves.
(5) Export Factoring: There is usually the presence of two factors: an export factor
and an import factor. The former buys the invoices of a client exporter and assumes
the risk in case of default by the overseas customers. Because of distance, different
condition or lake of information, the export factor usually forms out to an agent,
known as the import factor, the administrative job of servicing the debts owed to
its exporting clients.
FOREIGN DIRECT INVESTMENT
According to the definition given by JMF, FDI is the category of international investment
that reflects the objective of a resident entity in one economy (direct investor or parent
enterprise) by obtaining a ‘lasting interest’ and control in an enterprise resident in another
economy (direct investment enterprise).
Special Financing 211
The IMF definition of FDI includes as many as twelve different elements, namely:
equity capital, reinvested earnings of foreign companies, inter-company debt transactions
including short-term and long-term loans, overseas commercial borrowings (financial leasing,
trade credits, grants, bonds), non cash acquisition of equity, investment made by foreign
vantage capital investors, earning data of indirectly held FDI enterprises, control premium,
non-competition fee and so on.
FDI in India
FDI is permitted as under the following form of investments:
Through financial collaborations;
Through joint ventures and technical collaborations;
Through capital markets Via Euro Uses.
Through Private Placements or Preferential Allotments
1. The government has reviewed the guidelines pertaining to foreign/technical
collaborations under automatic route for foreign financial/technical collaborations
with previous ventures/tie-ups in India as per Press Note No. 18 (1998), it has
been decided that new proposals for foreign investment/technical collaborations
would henceforth be allowed under the automatic route, subject to sectored policies
as per the following guidelines.
(a) Prior approval of the government would be required only in cases where
the foreign investor has an existing joint venture for technology transfer/
trade mark agreement in the ‘same’ field.
(b) Even in the above mentioned cases, the approval of the government would
not be required in respect of the following :
(1) Investments to be made by venture capital funds registered with SEBI.
(2) Where the existing joint venture investments by either of the parties
is less than 3%; or
(3) Where the existing, venture/collaboration is defunct or sick.
(c) In so far as joint venture to be ordered after the date of dated January, 12,
2005 are concerned, the joint venture agreement may embody a ‘conflict of
interest’ clause to safeguard the interest of joint venture partners in the event
of one of the partners desiring to set up another joint venture or a wholly
owned subsidiary in the ‘same’ field of economic activity.
2. Increase in the FDI limits in Air Transport Services (Domestic Airlines) up to
49% through automatic route and up to 100% by Non-resident Indians (RRIs)
through automatic routes (No direct or indirect equity participation by foreign
airlines is allowed).
3. Foreign investment in the banking sector has been further liberalized by raising,
FDI limit in private sector books to 74% under the automatic route including,
investment by FIIs.
212 Financial Management
4. FDI in telecom has been raised to 74% subject to certain security measures. From
August 1991 to August 2004, 926 proposals of FDI of Rs. 41,368 crore were
approved. The actual FDI inflow of approximately Rs. 5,763 crore between
January 2001 and August 2004 alone was about 56% of the total FDI flow in
telecom since its inception in 1991. In terms of approval of FDI, the telecom sector
is the second largest, after power and oil references.
5. FDI in construction sector has been opened. Still some more sectors vis-à-vis retail
mining and pension are under the consideration of the government.
6. A part of FDI comes from NRIs, to oversee the difficulties faced by NRIs
government has set up a separate NRI Ministry for facilitating hassle free investment
procedure and clearances.
A Comparative Study Between India and China
Country FDI Inflows ($bn)
India 0.08 0.24 0.54 0.97 2.15 2.53 3.35 2.64 2.17 2.32 3.40 3.45 4.27
China 4.32 16.16 27.52 33.79 36.85 40.18 44.24 45.46 40.2 40.72 46.88 52.74 53.51
World FDI 1581 168 208 226 332 338 473 691 1087 1388 818 679 560
* 2.22 6.67 13.23 14.98 10.80 11.90 9.35 6.58 3.71 2.93 5.73 7.77 9.56
** 6.06 0.14 0.26 0.43 0.65 0.75 0.71 0.38 0.20 0.17 0.42 0.51 0.76
* FDI in China as a % of World FDI.
** FDI in India as a % of World FDI.
Source : UNCTAD, World Investment Report, Various Issues (1991–2004).
Foreign Institutional Investors (FIIs)
The Union Government allowed Foreign Institutional Investors to enter both the primary
and secondary markets in India under liberalized policy resume. The large inflow and outflow
of capital by FIIs affect the sensex movements. A certain degree of front running by the
traders in anticipation of FIIs demand also determines the market direction.
FIIs have to appoint an agency as consolidation to deal in the securities and reporting.
Accounts have to be maintained on daily basis. Semi model reports should be submitted by
the custodian to SEBI and RBI. SEBI can conduct direct inspections on the accounting books
of a registered FII. A Foreign Institutional Investor is permitted to appoint more than one
domestic custodian with prior approval of the Board but only one custodian may be appointed
for a single sub-account of FIIs.
SEBI and FIIs
SEBI announced its guidelines for FIIs registration and their operations in India in 1992 in
February, 1993 SEBI has granted registration to 12 FIIs for investing in the Indian Stock
market. At the end of 1996, 97, 439 FIIs were registered with SEBI. SEBI permitted registered
FIIs to invest in all securities traded on the primary and secondary markets including: equity,
other securities and instruments of companies listed on stock exchanges including OTCEI.
Special Financing 213
According to the 1995 regulation, no person can buy or sell or otherwise deal in
securities as a foreign institutional investor unless he holds a certificate granted by SEBI.
The certificate would be given to FIIs only after considering—
1. The applicant’s track record, professional record, professional competence, financial
soundness, experience, general reputation of fairness and integrity.
2. Whether the applicant is regulated by an appropriate foreign regulatory authority.
3. Whether the applicant has been granted permission under the provisions of FERA
Act 1973, for making investments in India as FII.
4. Whether the applicant is
(a) An institution established or incorporated outsides Indian as Pension Fund
or Mutual Fund or Investment Trust, or
(b) An Asset Management Company or Nominee Company or Bank or Institutional
Portfolio Manager, established or incorporated outside India and proposing to
make investment in India on behalf of broad based funds or
(c) A Trustee or Power of Attorney holder, incorporated or established outside
India and proposing to make investments in India on behalf of broad based
funds.
The certificate is valid for a period of 5 years from the date of its grant. Provisions are
made for the renewal of the certificate.
FIIs are allowed to place orders directly. Separate codes are given to FIIs and stock
exchange have to use the code number. The code number have to be approved by SEBI.
All the transactions carried out on behalf to FIIs have to be on delivery basis. In other
words, the registered FIIs should not engage in short selling and have to take delivery of all
purchase and give delivery of sold securities .
To case the inflow of foreign capital, amendments have been made in the regulations
regarding the FIIs investment. They are given below.
1. SEBI exempted FIIs to attach copy of RBI approved with market lot where shares
are sold and a custodian signed the transfer deed on their behalf.
2. FIIs individual limit on investment in a company was raised from 5 per cent to
10 per cent. Further, they have been allowed to unlisted stock of any company.
The FIIs list has also been increased.
3. SEBI (FIIs) Regulations 1995, have been changed to allow the FIIs to invest not
only in the equity but also in debt instruments of corporate bodies. FIIs were
allowed to invest up to 100 per cent of the funds in debt instruments of Indian
companies through 100 per cent dedicated debt funds from January 15, 1997.
4. SEBI amended SEBI (FIIs) Regulations 1997, to make it mandatory for FIIs, having
securities of Rs.10 crore of these as on own interest.
5. In June 1998, SEBI permitted
(a) FIIs to invest in unlisted companies through the 100% debt route and to
tender their serenities directly in responses to an open offer made in terms
of the SEBI regulations 1997.
214 Financial Management
(b) SEBI simplified the process of approval of Sub-accounts of registered FIIs.
(c) SEBI permitted FIIs to buy derivative contracts, which are traded on the stock
exchanges.
6. The aggregate investment of FII/NRI/OCB has been raised to 30 per cent of the
equity of the company by the union budget for 1997–98. The Finance Minister
in his budget speech in February 2000 announced of this limit to 40 per cent.
MERCHANT BANKING
Introduction
Merchant banking is one of the fee based financial services which includes underwriting,
consultancy and other allied services to the business concern. The term merchant banking
has been used in different terms in different countries. In UK merchant banking is termed as
accepting and issuing house and in the USA it is known as investment banking.
Meaning
A merchant banking is one who underwrites corporate securities and advises clients on
issue like corporate mergers. Merchant banking is basically service banking which provides
non financial services such as issue management, portfolio management, asset management,
underwriting of new issues, to act as registrar, share transfer agents, trustees, provide leasing,
project consultation, foreign credits, etc. The merchant bankers may function in the form
of a bank, financial institutions, company or firm.
Merchant Banking in India
In India, the first merchant banking services were started only in 1967 by National Grindlays
Bank followed by Citi Bank in 1970. In 1972 State Bank of India started a merchant banking
division, followed by ICICI Bank in 1973. Nowadays, most of the public sectors, private
sectors, commercial banks and financial institutions established a separate division of
merchant banking services.
Classification of Merchant Banking
According to the Securities Exchange Board of India regulations, merchant bankings are
classified into the following categories on the basis of their activities and capital adequacy.
The merchant banking must register themselves with Securities Exchange Board of India.
Category Minimum Net worth for Activities Permitted by SEBI
Capital adequacy
Category I Rs. 5 Crore Issue Manager, Advisor, Consultant,
Underwriter and Portfolio Manager
Category II Rs. 50 Lakhs Advisor, Consultant, Underwriter and
Portfolio Manager
Category III Rs. 20 Lakhs Advisor, Consultant, Underwriter
Category IV –NIL Advisor and Consultant service only.
Special Financing 215
Functions of Merchant Banking
Merchant banking is one of the non financial services which provides to the corporate
sectors, commercial banks and financial institutions. The major functions of merchant
banking are explained as follows:
1. Management, Marketing and Underwriting of new issues.
2. Project finance and project promotion services.
3. Syndication of credit and other facilities.
4. Leasing including project leasing.
5. Corporate advisory services.
6. Investment advisory services.
7. Bought out deals.
8. Venture capital.
9. Mutual funds and off shore funds.
10. Investment Management.
11. Investment services for non resident Indians.
12. Management dealing in commercial paper.
13. Treasury management.
14. Stock broking.
15. Foreign Collaboration and foreign currency finance.
16. Counseling to Small Scale Industries.
17. Capital Structure counseling to cooperative sectors.
18. Meeting the working capital needs.
Merchant Banking Organizations
In India, merchant banking services are provided by the following types of organizations:
Merchant Banking Organizations
Commercial Banks Financial Institutions Private Consultancy
Fig. 12.3 Merchant Banking Organizations
The following commercial banks are wholly owned subsidiaries to carry out merchant
banking activities.
State Bank of India – SBI Capital Markets Limited.
Canara Bank – Can Bank Financial Service Limited
216 Financial Management
Bank of Baroda – BOB Fiscal Services Limited.
Grindlays Bank – Grindlays Merchant Banking Limited.
ICICI, IFIC and IDBI are some of the examples of the All India financial institutions
which are involving in the merchant banking activities.
DSP Financial Consultants, Credit Capital Finance Corporation Limited, J.M Financial
and Investment Services Limited are some of the examples of the private consultancy firms
which are involving merchant banking activities.
CREDIT RATING
Introduction
Credit rating is one of the fee based financial services which are provided by specialized
agencies like CRISIL, ICRA and CARE. It is a mechanism by which the reliability and viability
of a credit instrument is brought out. It is usually the effort of investors in financial instrument
to minimize or eliminate default risk. Credit rating service is useful to the investors.
According to Securities Exchange Board of India, credit rating is a compulsory mechanism
for listing of the companies in the stock market and also it is essential to the corporate
sectors who want to raise capital with the help of issue of fixed deposits, commercial papers
and other short-term instruments.
Meaning of Credit Rating
Credit rating is an act of assigning values to credit instruments by estimating or assessing the
solvency, and expressing them through predetermined symbols.
“Credit rating is designed exclusively for the purpose of granting bonds according to
their investment quality”.
Corporate or municipal debt rating is a current assessment of the credit worthiness of
the obligator with respect of a specific obligation.
Objectives of Credit Rating
These are the important objectives of the credit rating:
• To impose a healthy discipline on borrowings.
• To lend greater belief to financial and other representations.
• To facilitate formulation of public guidelines on institutional investment.
• To help merchant bankers, brokers and regulatory authorities.
• To encourage the information disclosure, better accounting standards, etc.
• To reduce interest cost for highly rated company.
Credit Rating in India
Credit rating in India begins from 1988. At present there are four credit rating agencies
very popular in rating.
Special Financing 217
Operational Performance of Credit Rating Business in India
Rs. in crore
Rating Agency 1994–95 1995–96 Cumulative Up to March 96
Number Amount Number Amount Number Amount
CRISAL 384 24,544 427 43,086 1736 1,14,873
ICRA 212 5,343 293 75,742 778 93,380
CARE 184 8,403 217 13,909 445 23,638
Total 780 38,290 937 1,32,737 2,959 2,31,891
Basis for Credit Rating
Credit rating agencies consider the following important informations for granting the rating
symbol to the borrowing company;
1. Historical background of the company.
2. Track record of the company.
3. Financial efficiency and profitable position.
4. Operational efficiency.
5. Market share of the company.
6. Labour efficiency and their turnover.
7. Future prospects.
Credit Rating Information Service of India Limited (CRISIL)
Credit Rating Information Service of India Limited was the first credit rating agency in
India, in January 1988 jointly by ICICI, UTI, LIC, GIC and ADB. The following are the
major objectives of the Credit Rating Information Service of India Limited.
(a) To rating of companies debentures, fixed deposits programmes, short-term
instruments etc.
(b) To provide corporate reports to business concern.
(c) To conduct industry studies.
Credit Rating Symbols of Credit Rating Information Service of India Limited
Long-term Medium-term Short-term Remarks
Instrument Instrument Instrument
AAA FAAA P1 Highest Safety
AA FAA P2 High Safety
A FA P3 Adequate Safety
BBB – – Moderate Safety
Contd....
218 Financial Management
BB FB P4 Inadequate Safety
B FC - Risk Prone
C - - Substantial Risk
D FD P5 Default
Operational Result of Credit rating Information Service of India Limited
Credit Rating Information Service of India Limited is one of the well known and largest
credit rating agencies in India which provides credit rating to corporate and banking sectors.
The operational performances of the Credit Rating Information Service of India Limited
are explained in the table below:
Instruments 1994-95 1995-96 Cumulative Up to March 96
Number Amount Number Amount Number Amount
Debenture 103 7,641 161 13,342 646 45,700
Fixed deposits 97 9,130 218 14,153 543 38,625
Commercial Papers 137 1,629 21 3,255 459 11,415
Others 49 6,144 27 12,336 88 19,133
Total 384 25,544 427 43,086 1,736 1,14,873
Source: RBI reports.
Investment Information and Credit Rating Agency of India Limited (ICRA)
Investment Information and Credit Rating Agency is one of the largest credit rating service
providers next to Credit Rating Information Service of India Limited. It was established
mainly for the purpose of rating of short-term, medium-term and long-term debt instruments
of the corporate and banking companies. It was set up in the year 1991 by the leading
banking and financial institutions.
Credit Rating Symbols of Investment Information and Credit Rating Agency of
India Limited
Long-term Medium-term Short-term Remarks
Instrument Instrument Instrument
LAAA MAAA A1 Highest Safety
LAA MAA A2 High Safety
LA MA A3 Adequate Safety
LBBB – – Moderate Safety
LBB MB – Inadequate Safety
LB MC A4 Risk Prone
LC – – Substantial Risk
LD MD P5 Default
(Rs. in crore)
Special Financing 219
Operational Result of ICRA
Investment Information and Credit Rating Agency of India Limited is also performing well
in the field of credit rating to various instruments. The operational result of the Investment
Information and Credit Rating Agency of India Limited is explained in the table below:
(Rs. in crore)
Instruments 1994–95 1995–96 Cumulative Up to March 96
Number Amount Number Amount Number Amount
Debenture 45 1,779 66 8,224 223 18,599
Fixed deposits 87 540 192 50,507 360 54,481
Commercial Papers 80 3,023 35 17,011 195 22,299
Total 212 5,343 293 75,742 774 93,380
Source: RBI reports
Credit Analysis and Research Limited (CARE)
Credit Analysis and Research Limited was set up by Industrial Development Bank of India
in November 1993, Credit Analysis and Research Limited also provides rating to long-term,
medium-term and short-term instruments.
The rating symbols of Credit Analysis and Research Limited are mentioned below:
Credit Rating Symbols of Credit Analysis and Research Limited
Long-term Medium-term Short-term Remarks
Instrument Instrument Instrument
CARE AAA CARE AAA PR1 Highest Safety
CARE AA CARE AA PR2 High Safety
CAREA CAREA PR3 Adequate Safety
CARE BBB CARE BBB - Moderate Safety
CARE BB CARE BB Inadequate Safety
CARE B CARE B PR 4 Risk Prone
CARE C CARE C - Substantial Risk
CARE CARE PR5 Default
Operational Result of Credit Analysis and Research Limited
Credit Analysis and Research Limited is one of the latest origins in the field of credit rating
which provides rating to various instruments. The operational result of the Credit
Analysis and Research Limited as explained in the table below:
220 Financial Management
(Rs. in crore)
Instruments 1994-95 1995-96 Cumulative Up to March 96
Number Amount Number Amount Number Amount
Debenture 34 3,429 54 9,330 93 13,572
Fixed deposits 112 1,639 39 1,692 179 3,704
Commercial Papers 38 3,335 124 2,887 173 6,362
Total 184 8,403 217 13,909 445 23,638
Source: RBI reports
MUTUAL FUNDS
Introduction
Mutual fund is one of the funds based financial services which provides the stock market
benefits to small investors. It is a concept, leading to attract the small investors to invest their
pooling of savings in a trusted as well as profitable manner. Mutual funds business becomes
very popular in developed countries and it is fast growing in developing countries like India
also. Mutual funds act as a link between the investor and the stock market. Now in India
mutual funds activities are performed by public, private and foreign sector financial institutions.
Origin of Mutual Funds
In the year 1822 the concept of mutual funds was found in Belgium. In 1868, foreign
colonial government trust was established in England to spread the risks in securities market.
Mutual funds concept was spread to USA and some of the mutual funds institutions were
established. Unit Trust of India was established in 1964 as a public sector mutual funds
institution by the central government. It is the first mutual fund in India.
Structure of Mutual Fund in India
Mutual Fund Sectors
Securities Exchange
Board of India
Association of Mutual
Funds
Mutual Fund
Sponsor Board of Trustee Custodian Investor
Public Sector Private Sector
Fig. 12.4 Structure of Mutual Fund in India
Special Financing 221
Meaning of Mutual Fund
A mutual fund is an investment vehicle for investors who pool their savings for investing in
diversified portfolio of securities with the aim of attractive yields and appreciation in their
value. Mutual fund is a trust that attracts savings which are then invested in capital markets.
According to SEBI, mutual fund define is as a fund, established in the form of a trust to
raise money through the sale of units to the public or a section of the public under one or
more scheme for investing in securities, including money market instruments.
Investment company institute of the US defined mutual fund is a financial service
organisation that receives money from shareholders, invests it, earns return on it, attempts
to make it grow and agrees to pay the shareholders cash on demand for the current value
of his investment.
Advantages of Mutual Funds
Mutual fund consists of the following important advantages:
1. Attract small and medium group investors: Mutual funds promote savings
among the lower and middle income groups of investors because mutual fund
units are available with a single unit of Rs. 10 and multiples by the same value.
2. Attractive return: If the investor invests in mutual fund, they can get attractive
returns because mutual funds are linked with stock market. The benefits of stock
market goes to the mutual fund investors.
3. Reduce the risk: Mutual fund investments minimize the risk on investments by
diversifying the investments into various portfolios such as shares, debentures,
bonds etc.
4. Assure return: Mutual funds are managed by experts in the field of investment
management; hence there is no risk and mutual fund offers assured return.
5. Tax concession: If the mutual funds belong to infrastructure development bonds,
there will be a tax concession to the mutual fund investment.
6. Liquidity: Mutual fund investment is one of the highly liquidity based investments
which can be recapitalized at any time or sold the mutual fund units at any time.
7. Convenience: Mutual fund investment is one of the most convenient investments
for those who want to invest or get back their investment through selling of
the units of mutual fund.
8. Flexibility: Mutual fund can be transfered from one scheme to the other scheme
on the basis of present market condition.
9. Benefits to minorities: Mutual fund investment schemes are most suitable to
the old age pensioners, widows middle class women, etc.
10. Contribution to the economy: Mutual fund companies promote the saving habits
of middle class people. Hence, the money invested in mutual fund schemes are
invested into the major economical activities like infrastructure development
construction of bridge, buildings, etc.
222 Financial Management
Types of Mutual Fund
Ownership
point of View
Scheme of
Operation point of
View
Portfolio point of
View
Location point
of View
Growth Income Balanced
Public
Sector
Private
Sector MF
Domestic
Fund
Global
Fund
Regional
Fund
Sector
Fund
Open ended
Scheme
Closed ended
Scheme
Fig. 12.5 Types of Mutual Fund
Public Sector Mutual Fund
Unit Trust of India is one of the public sector mutual funds operating from 1964 and it
enjoys the monopoly power in the field of mutual funds up to 1987. After 1987, Public
Sector Commercial Banks and Life Insurance Corporation of India also entered into mutual
funds activities. State Bank of India, Canara Bank, Punjab National Bank, General Insurance
Corporation are some of the public sector mutual funds activities.
Private Sector Mutual Fund
Apart from UTI and public sector commercial banks, some of the private sector financial
institutions also entered into the mutual fund activities in India from 1990 onwards. Kothari
Pioneer mutual fund, Twentieth century mutual fund, ICKI mutual fund, Morgan Stanly
mutual fund, Taurus mutual fund and CRB mutual fund are some of the examples of the
private sector mutual fund.
Open Ended Mutual Fund
When the units are sold and redeemed at any time on-going basis at the price determined
by the funds Net Assets Value (NAV) is called as open ended mutual fund. These mutual
fund has no fixed maturity periods. There is no ceilling on the amount invested by the
investors in these funds, and they can sell the units back to mutual funds whenever they
decide. Net Assets Value of the mutual fund is calculated by the following formula:
Special Financing 223
Net asset value of the unit =
Net assets value of fund
Number of outstanding units
.
Closed Ended Mutual Fund
Closed ended mutual funds have fixed maturity period ranging from two to 15 years. The
units of closed ended mutual funds are not repurchased or redeemed by mutual funds
before the maturity period. The investors cannot buy units directly from the fund after
the closing period.
Growth Generated Mutual Fund
Mutual fund investments which are reinvested in highly growth oriented equity shares
are called as growth oriented mutual fund. It consists of high return with growth potentials.
Income Generated Mutual Fund
If the investor needs regular income for their investment, they can select income oriented
mutual fund. It provides regular income to its investors.
Balanced Mutual Fund
Balanced mutual fund is a combination of mutual fund investment in company securities
as well as the government bonds. Investors can get moderate return with safety options.
Domestic Mutual Fund
When the mutual fund mobilizes savings from a particular country or region, it is called
domestic mutual fund.
Global Mutual Fund
When the mutual fund investment stocks are traded in markets throughout the world
with the exemption of the country which launches the fund.
Regional Mutual Fund
When the mutual fund consists of a particular region or a country, it is also called as off
shore mutual fund.
Sector Mutual Fund
Sector mutual funds are specializing in a particular industry which consist of aggressive
funds.
Top Ten Mutual Fund
• UTI Mutual Fund • Reliance Mutual Fund
• Prudential ICICI Mutual Fund • HDFC Mutual Fund
• Franklin Templeton Mutual Fund • Birla Sun Life Mutual Fund
• SBI Mutual Fund • DSP Merrill Lynch Mutual Fund
• Kotak Mahindra Mutual Fund • Tata Mutual Fund
224 Financial Management
MODEL QUESTIONS
1. Explain the types of leasing.
2. Discuss the advantages of lease financing.
3. Explain the features of venture capital.
4. Explain the types of factoring.
5. What is FDI? Explain it.
6. Discuss the functions of merchant banking.
7. Critically evaluate the role of credit rating agencies.
8. Enumerate the types of mutual funds.
INTRODUCTION
Finance plays a key role in the part of economic and business activities of the country.
Systematic and efficient flow of finance is needed to efficient and effective management of
the business concern. Arrangement of finance to required business concern, should be
properly maintained and channelised through regulated institutions and markets. In India,
with the effect of the new economic policy, emerging needs of financial institution and
markets should be looked after. Indian financial system has developed constantly and
successfully to infuse the new blood to the economic development of the nation. Hence,
the economic growth and development is purely based on the regulated and well established
financial system of the country.
FINANCIAL SYSTEM IN INDIA
Financial system is the basic concept for the industrial development of the nation. Financial
system provides adequate and smooth flow of finance to the needed parts. Indian financial
system consists of the four important components such as:
• Financial Institutions
• Financial Markets
• Financial Instruments
• Financial Services.
Financial system implies a set of complex and closely connected or intermixed
institutions, agent practices, markets, transactions, claims and liabilities in the economy.
The financial system is concerned about the money, loan and finance. These three
parts are very closely interrelated with each other and depend on each parts.
226 Financial Management
Financial System
Financial
Institutions
Financial
Markets
Financial
Services
Financial
Instruments
Fig. 13.1 Financial System
Financial Institutions
Financial institutions are the major part of the Indian financial system. Hence, it is more
importance than other component of the 1FS because all the components of IFS are directly
or indirectly related with the financial institutions. Financial institutions are providing
various services to the economic development with the help of issuing of the financial
instruments.
Financial institutions can be classified into banking and non-banking institutions. Now
in India, all the financial institutions are systematically regulated and controlled by respective
act.
.
Financial Institutions
Banking Non-banking
Non- anking
b
Non-financial
Institutions
Non- anking
b
Financial Institutions
Commercial
Banks
Cooperative
Banks
Fig. 13.2 Financial Institutions
Banking Institutions
Banking institutions are the key part of the economic development of the nation. Any
country’s financial transaction should be properly arranged from investors to the needed
industrialist. Banking institutions play a major role in the field of savings and investments
of money from public and lending loans to the business concern.
Indian Banking institutions may be classified into two board categories :
(1) Commercial Banks (2) Cooperative Banks
Commercial Banks
Commercial Banks are the most important deposits mobilisation and disbursers of finance.
Indian commercial banks are the oldest, biggest and fastest growing financial institutions.
The main function of the commercial banks are accepting deposits and rendering loans to
the public. Indian commercial banks can be classified into the following categories:
Scheduled Commercial Banks
Scheduled banks are those which are included in the second scheduled of Banking Regulation
Financial System 227
Act 1965 and others are non scheduled banks. To be included in the second scheduled of
the Banking regulation act the bank full fill the following conditions:
• Must have paid up capital and reserves of not less than Rs. five lakh.
• It must also satisfy the RBI that its affairs are conducted in a manner.
• It is required to maintain a certain amount of reserves with the RBI.
Nationalised Banks
To use financial institutions as the instrument of promoting economic and social
development in a more purposeful manner and to overcome the monopoly over financial
resources, the government of India nationalised 20 commercial banks during the tenure of
Prime Minister of Indira Gandhi.
On July 19, 1969, the first nationalisation of 14 banks took place with the following
banks:
1. Bank of India
2. Union Bank of India
3. Bank of Baroda
4. Bank of Maharashtra
5. Punjab National Bank
6. Indian Bank
7. Indian Overseas Bank
8. Central Bank of India
9. Canara Bank
10. Syndicate Bank
11. United Commercial Bank
12. Allahabad Bank
13. United Bank of India
14. Dena Bank
On April 15, 1980 the second nationalisation took place with the following banks:
1. Andhra Bank
2. Corporation Bank
3. New Bank of India
4. Oriental Bank of Commerce
5. Punjab and Sind Bank
6. Vijaya Bank
In October 1993 the new bank of India was merged with Punjab National Bank, in
March 2007, Bhart Overseas Bank merged with Indian Overseas Bank therefore, at present
there are only 19 nationalised banks in the country besides the RBI.
228 Financial Management
State Bank of India (SBI)
The largest Public sector bank of India which was created after nationalisation of Imperial
Bank of India in 1955. It is now the largest commercial banks in India and in terms of
branch largest in the world.
As part from the main State Bank of India, there are seven subsidiaries:
1. State Bank of Bikaner and Jaipur 5. State Bank of Hyderabad
2. State Bank of Indore 6. State Bank of Mysore
3. State Bank of Patiala 7. State Bank of Saurashtra
4. State Bank of Travancore
Indian Banking System
Reserve Bank of India
Scheduled Banks Non Scheduled Banks
State Co-op
Banks
Commercial
Banks
Central Co-op
Banks
Commercial
Banks
Indian Banks Foreign Banks
Public Sector
Banks
Private Sectors
Banks
SBI and its
Subsidiaries
Other Nationalised
Banks
RRB
Fig. 13.3 Indian Banking System
Growth and Structure of Commercial Banks in India
S. No. Particulars 1951 1986 1996 2002 2005
1. Number of Sch. Banks 92 79 91 98 98
2. Number of RRB - 194 196 196 196
3. Number of Non-Sch. Banks 474 3 3 4 4
Financial System 229
Private Sectors Banks
These comprise of foreign and private domestic banks. The foreign banks have market
share of 8.5% of total deposits into banking industry and the domestic private banks have
a share of 5.8% of total deposits of the banking industry. Presently 31 private domestic
banks and 33 foreign banks are functioning in India.
The following are the old generation private sector banks in India:
• Bharat Overseas Bank Ltd.
• City Union Bank Ltd.
• Development Credit Bank Ltd.
• Ing Vysya Bank Ltd.
• Karnataka Bank Ltd.
• Lord Krishna Bank Ltd.
• The Nainital Bank Ltd.
• SBI Coml. and Intl. Bank Ltd.
• Tamilnadu Mercantile Bank Ltd.
• The Bank of Rajasthan Ltd.
• The Catholic Syrian Bank Ltd.
• The Dhanalakshmi Bank Ltd.
• The Federal Bank Ltd.
• The Ganesh Bank of Kurndwad Ltd.
• The Jammu & Kashmir Bank Ltd.
• The Karur Vysys Bank Ltd.
• The Lakshmi Vilas Bank Ltd.
• The Ratnakar Bank Ltd.
• The Sangli Bank Ltd.
• The South Indian Bank Ltd.
• The United Wester Bank Ltd.
New Banks in Private Sectors
In the year 2000, the government of India related entry level for private sector by reducing
the government holding in nationalised banks from 51% to 33%. The RBI in 2003 thereby
issued directions for establishment of private banks in India. Some of the new banks in
private sector as follows:
• UTI Bank Ltd.
• Indus Ind Bank Ltd.
• ICICI Bank Ltd.
230 Financial Management
• Global Trust Bank Ltd.
• HDFC Bank Ltd.
• Centurian Bank Ltd.
• Bank of Punjab Ltd.
• Times Bank Ltd.
• IDBI Bank Ltd.
• Development Credit Bank Ltd.
• Kotak Mahindra Bank Ltd.
Foreign Banks in India
RBI has been issuing licenses to various foreign banks to operate in India. 33 foreign and
multinational banks are working in India today. The following are the major foreign banks
play in Indian banking markets.
• ABN-Amro Bank N.V.
• Abu Dhabi Commercial Bank Ltd.
• American Express Bank Ltd.
• Antwerp Diamond Bank N.V.
• Arab Bangladesh Bank Ltd.
• Bank International Indonesia
• Bank of America NA
• Bank of Bahrain and Kuwait BSC
• Bank of Ceylon
• Barclays Bank PLC
• BNP Paribas
• Chinatrust Commercial Bank
• Chohund Bank
• Citibank N.A.
• Calyon Bank
• Credit Lyonnais
• Deutshe Bank AG
• Ing Bank N.V.
• JP Morgan Chase Bank
• Krung Thai Bank Public Company Ltd.
• Mashreq Bank psc
• MIZUHO Corporate Bank Ltd.
Financial System 231
• Oman International Bank SAOG
• Societee Generale
• Sonali Bank
• Standard Chartered Bank
• State Bank of Mauritius Ltd.
• Sumitomo Mitsui Banking Corporation
• The Bank of Nova Soctia
• The Bank of Tokyo-Mitsubishi, Ltd.
• The Development Bank of Singapore Ltd.
• The Hong Kong and Shanghai Banking Corporation Ltd.
• UFJ Bank Ltd.
Non-banking Institutions
Apart from the banking institutions, Non-banking institutions are also performing their
function to improve the Indian financial system. Non-banking Institutions can be classified
into the following two major categories:
1. Non-banking Financial Institutions.
2. Non-banking Non-financial Institutions.
Non-banking Financial Institutions
Non-banking Financial Institutions are providing fund based services such as investment,
insurance, mutual funds and lending institutions:
NBFI
National Level Institutions State Level Institutions
Financial Investment
SFC
IFCI IDBI ICICI LIC UTI
Fig. 13.4 Non-banking Financial Institutions
INDUSTRIAL FINANCE CORPORATION OF INDIA (IFCI)
Origin
Industrial Finance Corporation of India, the first development bank in India was set up in
July, 1, 1948 by passing a special Act as Industrial Finance Corporation of India Act 1948
in the parliament.
232 Financial Management
Capital
Industrial finance corporation of India was started with the paid up share capital of
Rs. 10 crore. The share capital was contributed by Reserve Bank of India, scheduled banks.
Insurance companies, investment trust and co-operative banks. Industrial finance
corporation of India can raise further capital with the help of issue of bonds, debentures,
accepts deposits from public and advance from RBI.
Objectives
The objective of Industrial finance corporation of India is to make medium and long-term
credits more readily available to industrial concern in India particularly to the industries.
• Manufacturing, preservation or procession of goods
• The mining industry
• The shipping industries
• The hotel industries
• Generation or distribution of electricity or power
Functions
The following are the main functions of the Industrial finance corporation of India:
1. Granting loans and advances.
2. Subscribing to the shares and debentures floated by industrial concern.
3. Guaranteeing loan taken from capital market.
4. Guarantee deferred payment in respect of import of capital goods by approved
concerns.
5. Involves merchant banking activities.
6. Special assistance to women, SSI and backward area.
7. Consultancy for technical, marketing and financial.
Management
Industrial finance corporation of India is managed by the board of directors which consist
of 12 directors and one full time chairman. Some of the directors are nominated by IDBI,
Central government, Scheduled Commercial Bank, Co-operative Banks and Insurance
Companies.
Subsidies of Industrial Finance Corporation of India
Apart from the financial service to the industrial concern Industrial finance corporation of
India promote some of the institutions:
• Tourism Finance Corporation of India Ltd.
• Management Development Institute.
• Risk Capital and Technology Finance Corporation Ltd.
Financial System 233
• Technical consultancy organisation.
• Investment information and credit rating agency of India.
Working Result
In 1970–71 loan sanctioned was Rs. 32.2 crore, in 1998 it was reached to Rs. 8684 crore.
The total sanctioned by Industrial finance corporation of India as at the end of March
1999 stood at Rs. 47245 crore. Now-a- days Industrial finance corporation of India providing
all kind of financial assistance to medium and large scale industrial sector in India.
INDUSTRIAL CREDIT AND INVESTMENT CORPORATION OF INDIA(ICICI)
Origin
Industrial Credit and Investment Corporation of India was started in January, 5 1955 as a
Public Ltd. Companies under the companies act. It is only development bank which has
participation by foreign investors.
Capital
Paid up share Capital of Industrial Credit and Investment Corporation of India is Rs. 25 crore,
which was contributed by commercial banks, insurance companies, foreign investors from
UK, USA, Germany, France and Japan.
Objective
The following are the major objectives of Industrial Credit and Investment Corporation of India:
1. To provide following are the major objectives of Industrial Credit and Investment
Corporation of India:
2. To develop underwriting facilities, to help private sector units.
Functions
The main functions of the Industrial Credit and Investment Corporation of India are as
follows:
• Expansion of private sector industries.
• To give loans or guarantee of loans either in rupees or foreign currency.
• To underwrite shares and debentures and subscribes directory to share issued.
• To encourage and promote private capital.
• To promote private ownership of industrial investment alongwith the expansion
of investment market.
Management
Industrial Credit and Investment Corporation of India is managed by the board of directors
which full time chairman. The directors are nominated by Government, Reserve Bank of
India Foreign shareholders and IDBI.
234 Financial Management
Subsidies of Industrial Credit and Investment Corporation of India
Industrial Credit and Investment Corporation of India is one of the leading and wide range
of financial service providers in India. The following are the subsidies of the Industrial
Credit and Investment Corporation of India.
• ICICI Banking Corporation Ltd.
• ICICI Securities and Finance Company Ltd.
• ICICI Assets Management Company Ltd.
• ICICI Trust Ltd.
• ICICI Brokerage Service Ltd.
• ICICI Credit Corporation Ltd.
Working Result
Industrial Credit and Investment Corporation of India provided financial assistance to
industrial concerns has increased form 145.8 corer in 1961–62 to Rs. 34,220 crore in
1998–99 of the total loan sanctioned in 1998–99, 33% went to corporate finance, 29% to
infrastructure, 19.5 each to oil gas and petrochemicals industries.
INDUSTRIAL DEVELOPMENT BANK OF INDIA (IDBI)
Origin
The Industrial Development Bank of India was set up as a wholly owned subsidiary of the
RBI on July 1st 1964 under an act of parliament. In February 1976, it became an independent
and autonomous bank.
Capital
Industrial Development Bank of India was started with initial paid up capital of Rs. 100
crores and now it can raise further capital with the help of issue of shares, debentures and
accept deposits from public.
Objectives
The main objectives of the Industrial Development Bank of India are as follows:
• To provide credit, team finance, and financial services for the establishment of
new projects.
• To expansion, diversification modernization and technology upgradation of existing
Industrial concern.
• To provide several diversified financial products.
• To undertake merchant banking activities.
Functions
The functions of Industrial Development Bank of India are as follows:
Financial System 235
1. Direct finance—Project loan, soft loan, technical development loan, equipment
finance etc.
2. Indirect finance—Refinancing, rediscounting of bills, seed capital to new
entrepreneurs.
3. Special assistance—Promotion of development assistance funds.
4. General assistance—Non-financial promotional activities like marketing, research,
consultancy etc.
Management
Industrial Development Bank of India managed by board of directors which consist of 14
directors and one full time chairman. The directors are nominated by the government, Reserve
Bank of India, company law board, insurance companies and various industries.
Subsidies of Industrial Development Bank of India are as follows:
• IDBI Bank Ltd.
• IDBI Capital Market Service Ltd.
• IDBI Mutual Funds.
• SIDBI
• IDBI Intech Ltd.
Industrial Development Bank of India has helped to set up the following institutions:
• Technical Consultancy Organization.
• EXIM Bank.
• Entrepreneurship Development Institute.
• Credit Rating and information service India Ltd.
Working Result
Total assistance sanctioned by Industrial Development Bank of India in 1998–99 was
Rs. 25,555 crores, of this 96.7% goes to direct assistance, 0.4% belongs to refinance. The
total amount of assistance sanctioned by the Industrial Development Bank of India till the
end of March 1999 from the date of its incorporation has been Rs. 1,07,264 crores.
INDUSTRIAL RECONSTRUCTION BANK OF INDIA (IRBI)
Origin
In April 1971, Industrial Reconstruction Corporation of India (IRCI) was set up by IDBI
and other development and public sector banks. IRCI was reconstituted and renamed as
Industrial Reconstruction Bank of India in 1985 with a special Act in the parliament.
Capital
Industrial Reconstruction Bank of India was started with initial paid up capital of Rs. 50
crore which is contributed by central government, Reserve Bank of India, SCB and various
236 Financial Management
financial institutions. Further capital can be raised with the help of issue of shares,
debentures and accept deposits from public.
Objectives
Industrial Reconstruction Bank of India was established mainly for rehabilitating sick
industrial units in India.
• To identify and remedial measures to sick industries.
• To provides financial assistance to reconstruction of sick industrial units.
• To promote the sick units into profitable units.
Functions
The following are the major functions of the Industrial Reconstruction Bank of India Credit
and reconstruction agency for industrial revival modernization, rehabilitation, expansion,
reorganization, diversification and rationalization. Empowered to grant loans and advances:
• Underwrite stocks, share and bonds.
• Guarantee loans and advances, performances and deferred payments.
• Gives assistance for capital expenditure, addition of balancing equipment etc.
Management
Industrial Reconstruction Bank of India is managed by the Board of directors with a full
time chairman. Directors are nominated by central government, Reserve Bank of India,
Schedule commercial Bank and financial institutions.
Subsidies of Industrial Reconstruction Bank of India
On March 27 1997, Industrial Reconstruction Bank of India was transformed into
Industrial Investment Bank of India Ltd (IIBI) under the Companies Act. IIBI acts as a
coordinating agency in the field of reconstruction.
Working Result
Industrial Reconstruction Bank of India sanctioned financial assistance to various sick
industrial units. Industrial Reconstruction Bank of India sanctioned Rs. 92 crores in 1980–
81 but it has increased to Rs. 4526 crore in 2002–03. It contributed 80% of the financial
assistance at all over India.
STATE FINANCE CORPORATION (SFC)
Origin
Central government decided to promote the Small Scale Industries and Medium Scale
Industries at the state level by establishment of State Finance Corporation under a special
Act. It is called as State Finance Corporation Act 1951. According to this act, state
government have been empowered to set up State Finance Corporation. At present these
are 18 State Finance Corporation in India.
Financial System 237
Capital
State Finance Corporations will have a paid up capital from Rs. 50 lakhs to Rs. 5 crore
which will be contributed by the respective state government, Schedule Commercial Bank,
Reserved Bank of India and various financial institutions.
Objectives
• To provides financial assistance to Small scale industries
• To promote tiny, village and cottage Industries
• To provides infrastructure facilities to SSI
Functions
• Long term loans to Small Scale Industries.
• Refinance from Reserve Bank of India and Industrial Development Bank of India
• Assistance from International Development Agency (IDA) and foreign currency
hire of credit from the IDBI
Management
State Finance Corporation are managed by Board of directors constituted by the respective
State Government, Central Government, Reserve Bank of India, Schedule Commercial
Bank and Financial Institutions as nominated directors to the State Finance Corporation.
STATE FINANCE CORPORATION IN TAMIL NADU
The Madras Industrial Investment Corporation (MIIC) was started as early as 1949, under
the companies act and it was renamed as Tamil Nadu Industrial Investment Corporation
(TIIC). It was the first State Finance Corporation in India, after the establishment of the State
Finance Corporation Act, 1951, the first State Finance Corporation was in Punjab in 1953.
EXPORT IMPORT BANK (EXIM BANK)
Origin
EXIM bank was set up in January 1982 as a wholly owned by the central government.
Capital
EXIM bank was established with the paid up capital of Rs. 50 crores. It is empowered from
RBI and also from central government to further capital raise by issue of bonds and grants
from government.
Objectives
EXIM bank was established mainly for the purpose of promoting export and trading in
India. The objectives are as follows:
• To promote the export and import activities
• To meet the financial requirements of the exporters
• To provides guarantee and make foreign exchange facilities to exporters.
238 Financial Management
Functions
EXIM banks performs the following important functions:
1. Grants direct loans in India and outside for import and export.
2. Refinances loans and suppliers of credit.
3. Rediscounts usance export bills export bills for banks.
4. Provides overseas investment finance.
5. Bulk import finance.
6. Foreign currency preshipment credit.
7. Product equipment finance programme.
8. Business advisory and technical assistance (BATA).
Management
EXIM bank is one of the wholly owned by central government, hence, the entire
management is controlled by the central government.
Working Result
EXIM banks business is exclusively devoted to India’s export and import activities. The
aggregate loans and outstanding reached Rs. 16.16 billion during the first decade of the its
operation. During the year 1990–91, it was sanctioned Rs. 1984 crore and it has increased to
Rs. 12011 crore in 2002–03. The share of EXIM bank in industrial finance is 2.11% in the
year 2002–03.
NATIONAL BANK FOR AGRICULTURAL AND RURAL DEVELOPMENT
Origin
The National Bank for agricultural and rural development was set up on July 12, 1982,
based on the Recommendation of the All India rural credit survey committee under an act
of Parliament as a central or apex institution for financing agricultural and rural sectors. It
has taken over the functions of Agricultural Refinance and Development Corporation
(ARDC) and Agricultural credit department of Reserve Bank of India.
Capital
The National Bank for Agricultural and Rural Development Functioning with the paid up
capital of Rs. 100 crore which is subscribed by Government and Reserve Bank of India in
equal amount. Further capital can be raised from the special borrowings from the Central
Government.
Objectives
The main objectives of National Bank for Agricultural and Rural Development are as follows:
• To provides refinance assistance for agriculture, Small Scale Industries and Village
Industries.
Financial System 239
• To undertakes promotional activities for integrated rural development
• To coordinates agricultural finance alongwith the state government
• To undertakes research and development in agriculture, rural industries
Functions
The National Bank for agricultural and rural development discharges are:
It provides all sorts of reference to Co-operatives, Commercial Banks, and Regional Rural
Banks, in respect the above three agencies and advices the government thereon. It makes
loans to state government to enable them to subscribe to the share capital of co-operative bank.
It helps in promoting research in agriculture and rural development. National bank for
agricultural and rural development undertakes evaluation and monitoring projects financed
by it. It is responsible for the development, operation and co-ordination relating to rural
credit.
Management
National Bank for Agricultural and Rural Development is wholly owned by central
government, hence it is managed by the central government constituted management board.
Working Result
National Bank for Agricultural and Rural Development operates through 28 regional offices,
336 district offices, one sub-office at Port blair and one special cell in Srinagar during the
year 1986. National Bank for Agricultural and Rural Development sanctioned short-term
credit to Small Scale Industries Rs. 400 crore and it has increased to Rs. 1200 crore in the
year 1990-91. Nearly Rs. 400 crore have been provided as medium term loans to various
activities, Rs. 200 crore have been sanctioned as long-term loans contributing to the share
capital of co-operative institutions.
National Bank for Agricultural and Rural Development has refinanced banks for
implementing the national programmes of mass assistance of small and marginal farmers. It
also refinance development activities of the handloom sectors. It extends refinance to state
co-operative banks, provide block capital to industrial Co-operative Societies and rural artisans
against state government guarantee. Service area approach of commercial banks is supported
by National bank for agricultural and rural development through various special assistance.
SPECIALIZED FINANCIAL INSTITUTIONS
The following are the specialized financial institutions established by government to provide
financial and non–financial assistance to various industrial sectors in India.
• Shipping Credit and Investment Corporation of India (SCICI), 1986.
• Infrastructure Leasing and Financial Service Limited (IL and FS), 1988.
• Technology Development and Information Company of India Limited (TDICI),
1988.
• Risk Capital and Technology Finance Corporation Limited (RCTFC), 1988.
240 Financial Management
• Tourism Finance Corporation of India (TFCI), 1989.
• Small Industries Development Bank of India (SIDBI), 1989.
• Infrastructure Development Finance Company (IDFC), 1997.
INSURANCE SECTOR IN INDIA
Insurance is one of the fund based financial services which provides risk coverage facilities
to the human beings. Realising the vast potential in Indian market, foreign insurance
companies started entering into India and even banking organisations (SBI, ICICI, etc.)
also showed much interest in insurance business, this is being attributed to global technology
and conversions of services as a result of which Indian Insurance market registered highest
growth in the Asian region even though Indian’s share of global insurance premium is less
0.5% (1998) than that of US 24.2 percent and Japan 21 percent. The private players from
India and abroad are well aware that only 25 percent of the insurable population have been
covered by insurance by existing companies which includes that Indian insurance market
has potential enough to exploit. In this process IRDA has so for granted registration for 12
private life insurance companies and 9 general insurance. If the existing public sector insurance
companies are included, there are currently 14 insurance companies in the life side and 13
companies in general insurance business.
Insurance sectors in India has been classified into the following categories:
Insurance Sector
Public Sector
Insurance
Private Sector
Insurance
Life Insurance General Insurance Life Insurance General Insurance
LIC of India Postal Life Insurance
National
Insurance
New India
Assurance
Corporation
Oriental fire and
General
Insurance
Corporation
United India
Insurance
corporation
Fig. 13.5 Insurance Sector
Financial System 241
Some of the Private Sector Life Insurance Corporation
• ICICI Prudential Life Insurance Corporation Limited.
• ING Vysya Life Insurance Corporation Limited.
• HDFC Standard Life Insurance Corporation Limited.
• Birla Sun Life Insurance Corporation Limited.
• SBI Life Insurance Corporation Limited.
• Om Kotak Life Insurance Corporation Limited.
• Met Life Insurance Corporation Limited.
• Allianz Bajaj Life Insurance Corporation Limited.
• Max New Yark Life Insurance Corporation Limited.
• Tata AIG Life Insurance Corporation Limited.
• AMP Sanmar Life Insurance Corporation Limited.
Some of the Private Sector General Insurance Corporation in India are as follows:
• CH NBH Assn General Insurance Corporation.
• ICICI Lombard General Insurance Corporation.
• Bajaj Allianz General Insurance Corporation.
• AIG General Insurance Corporation.
• IFFCO Tokio General Insurance Corporation.
• Royal Sundaram General Insurance Corporation.
• Reliance General Insurance Corporation.
LIFE INSURANCE CORPORATION OF INDIA
The Life Insurance Corporation of India (LIC) was set up in the year 1956 by nationalizing
245 insurance companies. The Primary objective of nationalization was to protect the interest
of policy-holders against misuses and embezzlement of funds by private insurance companies.
Secondly, the object of nationalization was to direct investment of funds in government
securities, leaving a meager part for the private sector.
What marks and distinguishes the LIC from other long-term financial institutions is
this that it discharges the two fold function of mobilization of long-term savings and their
effective channelisation as well. The other agencies are suppliers of fund obtained from
government and the Reserve Bank of India.
Role of LIC
The activities of the LIC can be broadly classified into two categories. First, it mobilizes long-
term contractual savings. Its policy-holders view the LIC as a trustee of their funds, a source
of emergency fund to guard against any financial misfortune and a way to accumulates
funds by the time of retirement from work. As an agency it is designed to the inculcation of
savings for the sake of rainy days.
242 Financial Management
During the last forty years of its operations, there has been concentration of colossal
funds in hands of this monolithic state owned corporation.
The resources thus obtained by the LIC from policy-holders are invested in diverse
ways for different purposes. Basically LIC is an investment institution. It is a big investor
of funds in government marketable securities. Since April, 1975 the amended Section 27A
of the Insurance Act, 1938 the LIC is required to invest to not less than 50% of its accruals
of premium income in government marketable securities. Of this not less than 25% in
central government securities. Besides it has to give loans to approved authorities like
electricity boards or state government for socially oriented schemes like electricity, housing,
water supply etc. These loans and investments should not exceed 87.5 percent of accretion
to the controlled fund of the LIC.
The remaining 12.5 percent can be made to the private sector directly in the form of
purchase of shares and debentures. Besides it grants loans to the private corporate sector
and finances projects by subscribing shares and debentures of private industries. Its
contribution to financing of industries in the private corporate sector is also indirect. The
investment in the share capital and bonds of IFCI, SFCs, UTI and IDBI flow back to private
sector in the form of direct loans. The LIC is also engaged in underwriting new issues.
The LIC plays an important role in the securities market in India. It purchases even
when the market is dull (bearish) and prices are low in order to reap the benefit of future
price appreciation. Nor does it usually sell shares from its stock when the market is spturn at
higher prices.
Although Income Tax concessions provide incentive to higher income groups through
LIC policies, the insuring public does not get the real value of its long-term savings because
of chronic inflation. Barring risk coverage, the rate of return offered by LIC is much lower
compared to other savings media. It is true LIC has grown at a fast speed yet it can grow at a
faster rate if it can make the message of life insurance more attractive by its operational
efficiency and innovative attitude.
GENERAL INSURANCE COMPANIES
The General Insurance Corporation of India(GIC) was formed as a government company
in 1972 under the General Insurance Business (Nationalization) Act 1972. Before
nationalization a few big companies and about 100 small companies were in this business.
All these units were merged together and reorganized into four subsidies of GIC. They are:
• National Insurance Company
• New India Assurance Company
• Oriental Fire and General Insurance Company
• United India Fire and General Insurance Company.
On January 1, 1973 of all the Indian insurance companies were transferred to the GIC.
The feature of the GIC is this that it sell insurance service against some forms of risk like
Financial System 243
loss of physical assets of various kinds from fire or accident and against personal sickness
and accident. The insurer just purchases a service and not any financial asset. They draw
vast resources in the other approved securities.
As a financial intermediary, the GIC invests funds in a prudent way looking after national
priorities and meeting unforeseen claims under their policies. The GIC is required by law
to hold central government securities to the tune of 25 percent of new accrual and at least
10% in other approved securities.
The companies can invest in the shares and debentures of the corporate sector. But
shall not exceed 5%of the subscribed capital of a single company. It also participates in the
underwriting of new issues and in granting term loans to industries.
UNIT TRUST OF INDIA
Origin
Unit trust was set up in 1964 by a special act passed in the parliament under the name of
Unit Trust of India Act 1963, for the purpose to promote and regulate the mutual fund
activities in India.
Capital
The initial capital of Unit Trust of India was Rs. 5 crores which was contributed by Reserve
Bank of India, Life Insurance Corporation, State Bank of India, Schedule Commercial Banks
and foreign banks. Unit Trust of India can raise further capital through issue of bonds,
accepting deposits and borrowings from Reserve Bank of India and Life Insurance Corporation.
Objectives
Unit Trust of India functioning with the following major objectives:
• To promote the saving habits of small and medium investors.
• To provide stock exchange benefits to the small and medium investors.
• To reduce the risk of investors through diversified investment.
• To invest the funds on commercial purpose.
Functions
Unit Trust of India performs the following important functions:
• Mobilisation of funds through mutual funds.
• Grant term loans.
• Rediscount Bills.
• Undertake equipment leasing and hire purchasing.
• Housing and construction finance .
• Merchant banking services.
• Portfolio management services.
244 Financial Management
Management
Unit Trust of India is managed with an independent board of Trustees and a full time
chairman, which is appointed by the government. The trustees are nominated by the Reserve
Bank of India, Life Insurance Corporation, State Bank of India and other commercial banks.
Subsidiaries of Unit Trust of India
Unit Trust of India also established some of the associates and group of institutions apart
from their regular services:
• UTI Securities Exchange Limited –1994
• UTI Bank Ltd.–1994
• UTI Investment Advisory Service Limited–1988
• UTI Investors Services Limited–1993
• UTI Institute of Capital Market–1989
• UTI contributed to the establishments of the following institutions or organisations:
• Credit Rating Information Service of India Limited (CRISIL)
• Investment Information and Credit Rating Agency of India Limited (ICRA)
• Credit Analysis and Research Limited (CARE)
• Discount Finance House of India (DFHI)
• Stock Holding Corporation of India Limited (SHCIL)
• Over the Counter Exchange of India Limited (OTCEI)
Schemes of Unit Trust of India
Unit Trust of India introduced various scheme in the different periods. The major Unit
Trust of India schemes are under:
• Unit Scheme–64
• Monthly Income Scheme
• Children College and Career Fund Scheme
• Grihalakshmi Unit Plan
• UTI Bond Fund
• UTI Money Market Fund
• UTI Growth Sector Fund
• UTI Master Share.
Working Result of Unit Trust of India
Up to 1987 UTI enjoys the Monopoly power in the field of merchant banking activities.
In terms of cumulative indicators it accounted for 34% of the total schemes, 83% of
the resource mobilized, 82% the investment and 81% of the unit holding accounts at
Financial System 245
4th end of 1995-96. The gross net resources mobilized by Unit Trust of India through
open ended schemes were Rs 7092 crore and closed ended schemes were Rs 3.85 crore
in the year 2002-03. The Growth performance of the Unit Trust of India has been
explained in the below table.
Year Sales Repurchase Investable Repurchase as % of Sales
1964–65 19 0.4 25 2.06
1985–86 892 63 3218 7.06
1995–96 6373 7643 56620 119.92
2000–01 7910 10491 69346 132.63
2002–03 5767 11194 51990 194.10
Source: UTI reports
NON-BANKING NON-FINANCIAL INSTITUTIONS
Non-banking non–financial institutions are providing fee based services to the public, such
as merchant banking, underwriting, counseling, etc. These institutions will not lending
any financial assistance to public but they will provide financial services.
NBNFI
Merchant Banking Underwriting Credit Rating Consultancy Project Preparation
Fig. 13.6 Non-banking Non-financial Institutions
FINANCIAL MARKETS
Financial market deals in financial securities or instruments and financial services. It
may be variously classified as primary and secondary, money markets and capital markets,
organised and unorganised markets official and parallel markets, and foreign and domestic
markets. Financial market provides money and capital supply to the industrial concern
as well as promote the savings and investments habits of the public. In simple censes
financial market is a market which deals with various financial instruments (share,
debenture, bonds, treasury bills, commercial bills etc.) and financial services (merchant
banking, underwriting etc).
Financial markets may be divided into two major classifications:
A. Capital market B. Money market
246 Financial Management
Financial Market
Money Market Capital Market
Primary Market Secondary Market Primary Market Money Market
Call Money
Market
Treasury
Bill Market
Commercial
Bills Market
Short-term
Loan Market
Stock
Market
Debt Market
Over the Counter
Exchange of India
(OTCEI)
Regional Stock
Exchange
(RSE)
National
Stock Exchange
(NSE)
Fig. 13.7 Financial Market
Capital Market
Capital market may be defined as on organised mechanism for effective and efficient
transfer of money-capital or financial recourses from the individuals or institutional savers
to industrialist. The development of a effective capital market depends upon the availability
of savings, well organised financial system and the entrepreneurship quantities of its people.
Capital market is a market for long-term funds, just as the money market is the market
for short-term funds. It refers to all the facilities and the institutional arrangements for
borrowing and lending term funds (medium-term and long-term funds). It does not deal in
capital for purpose of investment.
The demand for long-term money capital comes predominantly from private sector
manufacturing industries and agriculture and from the government largely for the purpose
of economic development. As the central and state governments investment are not only on
economic overheads as transport, irrigation and power development but also on basic
industries and some times, even consumer goods industries, they require substantial sums
from the capital market. The supply of funds for the capital market comes largely from
individual savers, corporate savings, banks, insurance companies, specialized financing
agencies and government.
Among institutions, we may refer to the following:
1. Commercial banks are important investors, but are largely interested in government
securities and, to a small extent, debentures of companies.
2. LIC and GIC are growing importance in the Indian capital market, though their
major interest is still in government securities.
3. Provident funds constitute a major medium of savings but their investments are
mostly in government securities.
Financial System 247
4. Special institutions set up since Independence, viz. the IFCI, ICICI, IDBI, UTI etc.,
all these aim at providing long-term capital to the private sector.
The capital market in India can be classified into
• Gilt-edged Market on Government and Semi-government Securities;
• Industrial Securities Market;
• Development Financial Institutions (DFI), and
• Non-banking Financial Companies (NBFC)
Capital Market in India
Gilt-edged
Market
Industrial Securities
Market
Development Financial
Institutions (DFI)
Financial
Intermediaries
New Issues
Market
Old Issues
Market
Stock
Exchange
IFCI ICICI SFCs IDBI IIBI UTI
Merchant
Banks
Mutual
Funds
Leasing
Companies
Venture
Capital
Others
Companies
Fig. 13.8 Capital Market in India
The Gilt-edged market is the market for Government and semi-government securities,
which carry fixed interest rates and backed by RBI . The securities traded in this market
are stable in value and are much sought after by banks and other institutions.
The industrial securities market is the market for equities and debentures of
companies of the corporate sector. This market further classified into (a) New Issues
Markets; for raising fresh capital in the form of shares and debentures, and (b) Old Issues
Market; for buying and selling shares and debentures of existing companies–this market is
commonly known as the stock market or stock exchange.
Both markets are equally important, but often the new issues market will be facilitated
only when there are abundant facilities for transfer of existing securities. The capital market
is also classified into Primary Capital Market and Secondary Capital Market.
The primary capital market refers to the new issues market, which relates to the
issue of shares, preference shares and debentures of non-government public limited companies,
and also to the raising of fresh capital by Government companies, and also to the raising of
fresh capital by Government companies and the issue of public sector bonds.
248 Financial Management
The secondary capital market, on the other hand, is the market for old or already
issued securities. It is composed of Industry Security Market or the stock exchange in
where industrial securities are bought and sold, and the Gilt-edged Market where the
government and semi-government, securities are traded.
MIBOR and MIBID
On June 15, 1998 National Stock Exchange launched two new Reference Rates for the
loans of Inter-Bank Call Money Market. These rates are Mumbai Inter-Bank Offer Rate
(MIBOR) and Mumbai Inter-Bank Bid Rate (MIBID).
MIBOR will be the indicator of Landing Rate for loans which MIBID will be the landing
rate of receipts.
Share Market
India has a well developed share market system, which is one of the best in the developing
world. It has one of the oldest stock markets in Asia. The first stock exchange was established
in 1875 in Bombay (Mumbai), when the stock brokers against at their plight following the
severe depression in securities, decided to form an association to protect the character and
interest of native share and stock brokers.
India has the second largest share holding population with around 1.5 crore shareholders;
next only to the United States of America which has about 5 crore shareholders. India is
significantly ahead of countries like Japan, United Kingdom and France in this regard, the
Indian figure may look impressive, but it constitutes only 1.5 percent of the total population.
The country also has a large number of debenture holders, whose figure stands at around
50 lakhs (5 million). Here, it is important to note that most of the debenture holders are
prospective shareholders as they are waiting for the conversion of their debentures into
equity shares. The enhanced interest in capital market is a result of increasing
industrialization, growing awareness among people and globalization of the capital market.
Indian capital market can be divided into primary market (new issues market) and secondary
market.
Primary Market
The primary market refers to the set up by which the industry raises funds by issuing
different types of securities. These securities are issued directly to the investors, both
individual and institutions. The primary market discharges the important function of
transfer of savings, especially of the individual, Government and public sector undertakings.
In the primary market, the new issues of securities are presented in the form of Public
issues, Right issues and Private Placements. Its efficient operation is made possible by the
financial intermediaries and financial institutions, who arrange long-term financial
transactions for the clients. Issues of the securities in the primary market may be made
through (i) Prospectus, (ii) Offer for sale, and (iii) Private placement. The securities offered
Financial System 249
to the public through prospectus are directly subscribed by the investor. The issuing
companies widely publicise the offer through various media. The Securities Exchange
Board of India (SEBI) has classified various issues in three groups i.e., New issues, Right
issues and Preferential issues.
The SEBI has issued various guidelines regarding proper disclosure for investor’s
protection. These guidelines are required to be duly observed by the companies making issue
of capital. The guidelines issued by the SEBI broadly cover the requirements regarding issue
of capital by the companies. The guidelines are applicable to all the companies after the
repeal of Controller of Capital Issues (CCI ) Act 1947.
The boom in the primary capital market, that started in the mid-eighties and accelerated
thereafter, started slowing down by 1995. There are several reasons for this slowing down of
resource mobilization in the primary market. In particular, the low return on new issues,
some resulting in stock market fiasco, seems to have shattered the confidence of the investors.
Secondary Market
The secondary market refers to the network system for the subsequent sale and purchase
of securities. An investor can apply and get allotted, a specified number of securities by the
issuing company in the primary market. However, once allotted, the securities can thereafter
be sold and purchased in the secondary market only.
A security emerges in the primary market, but its subsequent movement takes place in
the secondary market. Secondary market is represented by stock exchanges in the capital
market. Stock exchanges provide an organized market place for investors to trade in securities.
A stock exchange permits the prices of the securities to be determined by the market forces.
The bidding process flows from demand and supply, underlying each security. This means
that the specific price of a security is determined, more or less, in the manner of an auction.
Stock exchange provides a market in which the members (share brokers) and investors
participate to ensure liquidity to the latter. At present, there are 22 stock exchanges operating
in India. Approved Stock Exchanges in India as follows:
1. Meerut Stock Exchange, Meerut (UP)
2. UP Stock Exchange, Kanpur (UP)
3. Mumbai Stock Exchange, Mumbai (Maharashtra)
4. Over the Counter Exchange of India, Mumbai (Maharashtra)
5. National Stock Exchange, Mumbai (Maharashtra)
6. Pune Stock Exchange, Pune (Maharashtra)
7. Ahmedabad Stock Exchange, Ahmedabad (Gujarat)
8. Sourashtra Stock Exchange, Rajkot (Gujarat)
9. Vadodara Stock Exchange, Vadodara (Gujarat)
10. Bangalore Stock Exchange, Bangalore(Karnataka)
11. Canara Stock Exchange, Mangalore (Karnataka)
250 Financial Management
12. Bhubaneshwar Stock Exchange, Bhubaneshwar (Orissa)
13. Calcutta Stock Exchange, Calcutta (West Bengal)
14. Delhi Stock Exchange, Delhi.
15. Guwahati Stock Exchange, Guwahati (Assam)
16. Hyderabad Stock Exchange, Hyderabad (Andhra Pradesh)
17. Jaipur Stock Exchange, Jaipur (Rajasthan)
18. Ludhiana Stock Exchange, Ludhiana (Punjab)
19. Chennai Stock Exchange, Chennai (Tamil Nadu)
20. Coimbatore Stock Exchange, Coimbatore (Tamil Nadu)
21. MP Stock Exchange, Indore (Madhya Pradesh)
22. Magadh Stock Exchange, Patna (Bihar)
23. Capital Stock Exchange, Kerala Ltd. Tiruvananthapuram (Kerala)
24. Cochin Stock Exchange, Cochin (Kerala)
Secondary market in India got a boost when Over The Counter Exchange of India
(OTCEI) and National Stock Exchange (NSE) were established. It may be noted that NSE
and OTCEI have been established by the all India Financial Institution, while other stock
exchanges are in the form of associations.
Methods of Raising Capital
Shares: Otherwise known as ‘ordinary shares’ these are shares in the issued capital of
company which are held on terms that make the holder a ‘member’ of the company, entitled
to vote at annual meetings and elect directors, and to participate through dividends in the
profits of the company. The holders of the ordinary shares carry the residual risk of the
business: they rank after debenture holders and preference shareholders for the payment
of dividends and they are liable for losses, although this liability is limited to the value of
the share and to the limit of guarantee given by them.
Debentures: Fixed-interest securities issued by limited companies in return for
long-term loans. The term is sometimes also used to refer to any title on a secured interest–
bearing loan. Debentures are dated for redemption (i.e. repayment of their nominal value
by the borrower to the holder), debentures are usually secured. Debenture interest must
be paid whether the company makes a profit or not. In the event of non-payment debenture
holders can force liquidation and rank ahead of all shareholders in their claims on the
company’s assets. The interest which debentures bear depends partly on long-term rates
of interest prevailing at the time and partly on the type of debenture, but will in any case,
because of the lower risk involved is less than borne by preference shares. Debenture
shares are most appropriate for financing companies whose profits are stable and which
have substantial fixed assets, such property companies.
Financial System 251
Convertible debentures: These carry an option at a fixed future date to convert the
stock into ordinary shares at a fixed price. This option is compensated for by a lower rate
of interest than an ordinary debenture, but convertible debentures are attractive since
they offer the investor, without sacrificing his security, the prospect of purchasing equity
shares cheaply in the future. For this reason, convertible debentures are issued at a time
when it is difficult to raise capital either by equity or fixed interest securities. There are
three ways in which a company may raise capital in the primary market.
PUBLIC ISSUE
By far the most important mode of issuing securities, a public issue involves sale of securities
to the public at large. A company making a public issue informs the public about it through
statutory announcements in the newspapers, makes application forms available through
stock brokers and others and keeps the subscription open for a period of three to seven
days. If the issue is over-subscribed, the pattern of allotment is decided in consultation
with the stock exchange where the issue is proposed to be listed.
After the allotment pattern is finalized the company mails the allotment advice/letter
alongwith refund order, if any. This is supposed to be done within 10 weeks of the closure
of subscription. If the full amount is not asked for at the time of allotment, the balance is
called in one or two calls later. The letter of allotment is exchangeable for share certificates
(or debenture certificates, as the case may be), after it is duly stamped by the bank where
the balance payment is made.
Of course, if the allottee wants he can sell the letter of allotment itself by transmitting
it alongwith a transfer deed. If the allottee fails to pay to call money as and when called by
the company, the shares are liable to be forfeited. In such a case, the allottee is not eligible
for any refund of the amounts already paid. While a new company set up by promoters
without a track record is required to issue its shares at par, other companies are allowed to
make a public issue at a premium.
Right Issue
A right issue involves selling securities in the primary market by issuing rights to the
existing shareholders. When a company issues additional equity capital, it has to be offered
in the first instance to the existing shareholders on a pro rata (proportional) basis. This is
required under Section 81 of the Companies Act 1956. The shareholders however, may by
a special resolution forfeit this right, partially or fully, to enable a company to issue additional
capital to the public.
Private Placement
In a private placement, funds are raised in the primary market by issuing securities privately
to some investors without resorting to underwriting (insurance against risk by a guarantor).
The investors in this case may by financial institutions, commercial banks, other companies,
shareholders of promoting companies, and friends and associates of the promoters.
252 Financial Management
Group A and Group B Shares
The listed shares are divided into two categories: Group A shares (also referred to as
cleared securities or specified shares) and Group B shares (also referred to as non-cleared
securities or non-specified shares).
For Group A shares, the facility for carrying forward a transaction from one account
period to another is available; for Group B shares, it is not. Group A shares basically represent
large, well-established companies that have a broad investor base and are very actively traded.
Since transactions in these shares can be carried forward, these shares attract a lot of
speculative trading.
This seems to be the reason why these shares, other things being equal, tend to command
higher price-earning multiples. This is clear from the fact that whenever a share is moved
from Group B to Group A, its market price rises; likewise, when a share is shifted from group
A to Group B market price declines.
The Mumbai Stock Exchange employs several criteria for shifting stocks from the
non-specified list to the specified list. The key ones are that the company must have an
equity base of Rs. 10 crore, a market capitalization of Rs. 25–30 crore, a public holding of
35 to 40 percent, a shareholding population of 15,000 to 20,000 a dividend paying status
and a good growth potential.
SECURITIES AND EXCHANGE BOARD OF INDIA (SEBI)
In 1988, SEBI was created by an administrative feat of the Ministry of Finance. Since then
SEBI has gradually been granted more and more powers. With the repeal of the Capital
Issues Control Act and the enactment of the SEBI Act in 1992, the regulation of the primary
market has become the preserve of SEBI. Further, the Ministry of Finance has transferred
a number of powers under the Securities Contracts (Regulation) Act 1956 also to SEBI.
Before the establishment of the SEBI, the principal legislations governing the securities
markets in India were the Capital Issues Control Act 1956 (governing the primary market)
and the Securities Contract (Regulation) Act 1956 (governing the secondary market). The
regulatory powers were vested with the Controller of Capital Issues (for the primary market)
and the Stock Exchange Division (for the secondary market) in the Ministry of Finance,
Government of India.
Functions
1. The SEBI Act armed SEBI with statutory powers.
2. It has entrusted SEBI with the responsibility of dealing with various matters
relating to the capital market.
SEBI’s principle tasks are to:
1. regulate the business in stock exchanges and any other securities market.
2. register and regulate the working of capital market intermediaries (brokers,
merchant bankers, portfolio mangers and so on).
Financial System 253
3. register and regulate the working of mutual funds.
4. promote and regulate self-regulatory organizations.
5. prohibit fraudulent and unfair trade practices in securities markets.
6. promote investors’ education and training of intermediaries of securities markets.
7. prohibit insider trading in securities.
8. regulate substantial acquisition of shares and take-over of companies.
9. perform such other functions as may be prescribed.
Trading Procedure at Stock Exchanges
Securities can be traded at a stock exchange only if it is listed at that stock exchange or any
of the other stock exchanges. Listing is a procedure by which, the issuing company has to
enter into an agreement, called the listing agreement, with a stock exchange and has to abide
by the clauses of the listing agreement regarding disclosure of information, payment of listing
fees redressal of investor’s grievance etc.
Once listed, the security can be traded at other stock exchanges too. The sale and purchase
(transaction) of securities at the stock exchange can be done only through registered share
brokers. An investor desiring to enter into a transaction has to place an order with one of the
share brokers. In the ‘outcry’ system where the brokers used to shout, the deals are confirmed
in few hours but in the screen-based system, the deals are confirmed immediately. The investor
then gives the delivery of the securities in case of sale, or makes the payment in case of
purchase of security, to the stock broker.
The stock broker in turn makes the payment for the securities sold or delivers the security
certificate purchased on the completion of settlement programme of the stock exchange.
Generally, it takes 15 to 20 days for completion of the transaction. The National Stock Exchange
and the Over The Counter Exchange of India (OTCEI) have been operating since their
inception at the national level through satellite-linked computer based system. To be in tune
with the NSE, the stock exchanges at Mumbai, Delhi, Ahmedebad, and Calcutta, have already
converted their operations from the ‘outcry’ system to the computerised one. The transactions
at these stock exchanges now take place through computer based online screen system.
Recent Trends in Capital Market
In recent years, Non-Banking Finance companies, variously called as “finance companies
or corporations”. Finance companies have mushroomed all over the country and have
been making rapid progress. These finance companies or corporations, with very little
capital of their own–less than Rs. 1 lakh have been raising deposits from the public by
offering attractive rates of interest and other incentives.
They advance loans to wholesale and retail traders, small-scale industries and self-
employed persons. Bulk of their loans is given to parties which do not either approach
commercial banks or are denied credit facilities by the latter. The finance companies give
loans which are generally unsecured and the rate of interest charged by the then generally
range between 24 to 36 percent per annum.
254 Financial Management
The number of official stock exchanges (SEs) in India has increased from nine in 1979–80
to 23 as at the end of March 2003. In fact, the number of SEs has remained to be 23 during
1993-94 to 2000-03. India has not the largest number of organized and recognized SEs in
the world. All of them are regulated by the SEBI. They are organized either as voluntary,
non-profit-making associations (viz., Mumbai, Ahmedabad, Indore), or public limited
companies (viz., Calcutta, Delhi, Bangalore), or company limited by guarantee (viz., Chennai,
Hyderabad).
The BSE is the premier or apex stock exchange in India. It is the biggest in size in terms
of the amount of fresh capital raised, secondary market turnover and captialisation and the
total listed companies and their paid-up capital. It is also the oldest market and has been
recognized permanently, while the recognition for other exchanges is renewed every five
years. Its business is no longer confined to Mumbai alone; at the end of 1997, there were
100 other cities in which it had set up business.
The NSEI has a fully automated, electronic, screen-based trading system. It is sponsored
by the IDBI and co-sponsored by other term-lending institutions, LIC, GIC, other insurance
companies, commercial banks, and other financial institutions; viz., SBI Caps, SHCIL, and
ILFs. Its objectives are : (a) to provide nation-wide equal access and fair, efficient, completely
transparent securities trading system to investors by using suitable communication network,
(b) to provide shorter settlement cycles and book entry settlement system, (c) to bring the
Indian stock market in line with international markets, (d) to promote the secondary market
in debt instruments such as government and corporate bonds.
It was set up in 1992 and was the first stock exchange in India to introduce screen-based
automated ring less trading system. It is promoted by UTI, ICICI, IDBI, IFCI, LIF, GIC, SBI
Caps, and CANBANK as a company under Section 25 of the Companies Act 1956, with
headquarters at Mumbai. Its objectives are : (a) to help companies to raise capital from the
market at the cheapest costs and on optimal terms; (b) to help investors to access capital
market safely and conveniently; (c) to cater to the needs of the companies which cannot be
listed on other official exchanges; (d) to eliminate the problems of illiquid securities, delayed
settlements, and unfair prices faced by the investors. There are 20 other national and regional
exchanges located in metropolitan centers and other cities in India.
Operational Performance of Stock Exchanges
Exchange No. of Listed Market Total Corporate
Companies Capitalization Members Members
(1) (2) (3) (4)
1. Ahmedabad 551 7,681 285(323) 49(151)
2. Bangalore 253 17,812 230(245) 51(114)
3. Bhubaneshwar 43 887 222(233) 8(18)
Contd....
Financial System 255
4. Calcutta 1,962 77,131 861(987) 78(200)
5. Cochin 90 7,244 488(464) 38(75)
6. Coimbatore 86 1,233 192(182) 42(62)
7. Delhi 1,579 30,465 379(374) 65(212)
8. Gawahati 175 786 206(175) 0(5)
9. Hyderabad 520 11,917 304(306) 23(120)
10. Jaipur 145 4,004 587(555) 0(19)
11. Ludhiana 227 7,198 275(302) 48(85)
12. Madhya Pradesh 229 6,645 188(188) 11(34)
13. Chennai 593 28,604 200(186) 49(71)
14. Magadh 29 246 193(199) 3(20)
15. Manglore 18 3,183 147(116) 2(11)
16. Mumbai 3,990 5,63,748 608(665) 71(446)
17. NSEI 422 2,17,721 873(1036) 736(918)
18. OTCEI 88 643 785(883) 544(675)
19. Pune 121 12,533 197(197) 23(59)
20. Saurashtra kutch 36 1,999 437(436) 38(85)
21. Uttar Pradesh 321 7,260 507(518) 13(103)
22. Vadodara 372 10,633 312(319) 25(65)
23. Total 11,750 10,19,573 8,476(9519) 1,917(3794)
Source : SEBI, Annual Report and RBI, Annual Report.
SHARE MARKET TERMINOLOGY
Ask price: The lowest price at which a seller is willing to offer a security of the time; also
known as the ‘offer’. If a person enters a market in order to buy a security, he will usually pay
the ask price.
Bear: A person who expects prices to fall and sells securities hoping to make a profit by
subsequently repurchasing at a lower price.
Bid: The price at which someone is prepared to buy shares.
Brokerage: Charges made by a broker for acting as a agent in the buying and selling of
shares.
Bull: A person who buys securities in the expectation that prices will rise and so give
him an opportunity to resell on a profit.
Call option: An option giving the taker the right, but not the obligation, to buy the
underlying shares at a specified price on or before a specified date.
256 Financial Management
Depreciation: Amounts charged to provide for that part of the cost, or book value of
a fixed asset, which is not recoverable when it is finally put out of use.
Dividend: Distribution of a part of a company’s net profit to shareholders as a reward
for investing in the company. Usually expressed as percentage of par value or as cents per
share.
Equity: The general term for ownership in securities value over debit balance.
Growth stock: Stock with good prospects for future expansion, which promises capital
gain. Immediate income prospects may be modest.
Limited liability: The liability of the shareholder in this type of company is limited to
the extent of any unpaid capital on his shares.
Market order: An order to buy or sell a security at the next available price. A buy order
is executed at the lowest price available and a sell order is executed at the highest price
available. All market orders are day orders.
Mutual funds: Type of investment operated by an investment company that raises
money from shareholders and invests it in a portfolio of stocks, bonds, or other securities.
These funds offer investors the advantages of diversification and professional management.
For these services they typically charge a management fee, which must be disclosed in the
prospectus. Each mutual fund has its own investment objectives and strategies.
NASDAQ (National Association of Securities Dealers Automated Quotations): Owned
and operated by the NASD, NASDAQ is the computerized network that provides price
quotations for securities traded over the counter as well as many listed securities.
Open price: The price at which a security starts in a trading day.
Portfolio: Investors holding of securities of various types.
Preference shares: Rank above ordinary shares for claims an assets, earnings and
dividends but rank below creditors and debenture holders. These shares usually have a fixed
dividend rate.
Premium: The amount by which a security is quoted or issued above its value. The
opposite to ‘discount’.
Security: An instrument that represents an ownership interest in a corporation (stock),
a creditor relationship with a corporation or government body (bond), or rights to ownership
through such investment vehicles as options, rights, and warrants.
Stag: A person who applies for a new issue of securities with the intention of selling
immediately at a profit as opposed to one who invests for long-term holding.
Par value: The par value is stated in the memorandum and written on the share script.
The par value of equity shares is generally Rs. 10 (the most popular denomination) or
Rs.100. As per the SEBI guidelines any company coming with new issues from April 2000
onwards the par value of their shares should be of Rs.10 denomination.
Book value: The book value of an equity share is
=
Paid up equity capital + Reserve and surplus
Number of outstanding equity shares
Financial System 257
Quite naturally, the book value of an equity share tends to increase as the ratio of reserves
and surplus to the paid-up equity capital increases.
Market value: The market value of an equity share is the price at which it is traded in
the market. This price can be easily established for a company that is listed on the stock
market and actively traded. For a company that is listed on the stock market but traded very
infrequently. It is difficult to obtain a reliable market quotation. For a company that is not
listed on the stock market, one can merely conjecture as to what its market price would be if
it were traded.
Insider trading: Share market dealing by persons who have ‘inside’ knowledge of the
companies whose shares are transacted. Insiders could be directors or top-level employees or
even auditors of the company. Insider trading is a punishable offence in India.
Commodity futures markets: One of the components of the Indian securities market
is the commodity futures markets. This functions through the introduction of nationwide
electronic trading and market access, as was done of the equity market during 1994–96.
For the transactions there new exchanges have come about: National Commodity Derivative
Exchange (NCDEX), Multi Commodity Exchange (MCX) and National Multi Commodity
Exchange (NECE). The National Commodity Derivative Exchange has emerged as the largest
commodity futures exchange.
Main Share Price Index in Famous Share Market of the World
Mumbai — DOLEX, SENSEX, S and PCNX, NIFTY FIFTY
New York — DOW JONES
Tokyo — NIKKEI
Frankfurt — MID DAX
Hong Kong — HANG SENG
Singapore — SIMEX, STRAITS TIMES
Sensex: The Stock Exchange Sensitive Index (popularly referred to as the SENSEX)
reflects the weighted arithmetic average of the price relative to a group of shares included in
the index of sensitive shares. For example, Bombay Stock Exchange Sensitive index is a
group of 30 sensitive shares.
Name of share price indices changed
On 28 July, 1988, main share price indices have been renamed as follows:
Old Name New Name
NSE – 50 — S and PCNX Nifty
Crisil 500 — S and PCNX–500
Money Market
Money market is one of the part of Indian financial market which provides short-term financial
requirements of the industrial and business concern. Money market again subdivided into
the following categories on the basis of the instruments used in the money market.
258 Financial Management
A well-organised money market is the basis for an effective monetary policy. A money
market may be defined as the market for lending and borrowing of short-term funds. It is the
place where the short-term surplus investable funds at the disposal of banks and other financial
institutions are bid by borrowers comprising companies, individuals and the government.
The Reserve Bank occupies a pivotal position in the Indian money market as it controls
the flow of currency and credit into the market. The Indian money market is classified into
the following ways:
Indian money market consists of two parts: The unorganised and the organised sectors.
The unorganised sector consists of indigenous bankers who pursue the banking business on
traditional lines. The organised sector comprises the Reserve Bank, the State Bank of India
and its associate banks, the 19 nationalised banks and other private sector banks, both Indian
and foreign.
The organised money market in India has a number of sub-markets such as the Treasury
Bills Market: the Commercial Bills Market and the Inter-Bank Call Money Market.
On the recommendations of the Sukhmoy Chakravarty Committee on the Review of the
working of the Monetary System, the RBI has initiated a series of money market reforms.
The Narasimhan Committee report on the Working of the Financial System in India,
(1991) also made important recommendations on the Indian money market.
As par of its anti-inflationary policy, the RBI has followed a strict policy of interest rate
control and regulations. Deposit rates of banks, lending rates of banks and financial institutions-
in fact, all kinds of interest rates were subject to strict control and regulation by the RBI.
Since 1988, the RBI has removed the ceiling stipulation (of 16.5% per annum) for all bank
advances and instead has fixed a minimum of 16% per annum.
Banks have been asked to ensure that the interest rates charged remain within reasonable
limits. Subsequently, the ceiling on interest rates on inter-bank call and short notice money,
inter short-term deposits, bills rediscounting and inter-bank participation were removed from
May 1989 and the rates were permitted to be determined by market forces.
Organised Banking
Sector
Unorganised Banking
Sector
Sub-markets
Call Money
Market
Bill Market 364 Days Bill
Market
Certificates of
Deposits (CDs)
Commercial
Papers (CPs)
Commercial
Bill
Treasury
Bills (91 days)
Indian Money Market
Fig. 13.9 Indian Money Market
Financial System 259
1. Call money market: It is the market for very short-term funds repayable on
demand and with the maturity period is less than 15 days. Call money market
is mainly located in major industrial and commercial areas like Delhi, Mumbai,
Kolkatta, Chennai and Ahmedabad.
2. Treasury bill market: Treasury bills are also one of the short-term financial
instruments, which deal in money market. Treasury bill is a kind of finance bill
or promissory note issued by the government to raise short-term funds. Treasury
bills duration vary from 14 days to 364 days.
Traditionally, the Indian money market had suffered from inadequacy of short-
term credit instruments. On the recommendations of the Vaghul Working Group,
the RBI has introduced many new money market instruments.
Treasury bills: Instruments for short-term borrowing by the government. The
bills are promissory notes to pay to the bearer after the maturity period. The bills
are issued by tender to the Money Market and to Government Departments.
Tenders are invited every week from bankers, discount houses and brokers. The
Treasury Bills provide the government with a highly flexible and relatively cheap
means of borrowing money to meet its fluctuating needs for cash.
In the past there were only 91days treasury bills, which were traded in the Indian
money market. The new instruments introduced by the RBI are: 182 days treasury
bills, 364 days treasury bills, longer maturity treasury bills, dated Governments
securities, certificates of deposits and commercial paper.
At one time, the demand for the treasury bills by commercial banks was solely
governed by Statutory Liquidity Ration (SLR) considerations. This is not true any
more. Besides, the secondary market transactions in them are being increasingly
driven by the felt-need for effective management of short-term liquidity by the
commercial banks.
182 days treasury bills were variable interest bills and were sold through
fortnightly auctions. The yield of these long-dated papers had become attractive
for a highly liquid instrument. These were replaced by 364 days treasury bills.
364 days treasury bills there is a considerable scope for banks and financial
institutions to be interested in long-dated bills, as they are far superior to their loan
assets and investments which cannot be easily liquidated in times of need, without
incurring heavy loses. The 364 days Treasury Bills have thus become an important
instrument of Government borrowing from the market and also leading money
market instrument in the sense that their yield is most reflective of market conditions.
Financial institutions recongnise the yield rate on 364 days Treasury Bills–at
present around 12.5 to 13 percent–as anchor rate on the basis of which interest
rate instruments are floated.
The fortnightly offerings of these bills bring in, annually, about Rs. 20,000 crores
to the Government. These bills are entirely held by the market and RBI does not
subscribe to them. RBI introduced two more Treasury Bills in 1997: (i) 14 days
260 Financial Management
Intermediate Treasury Bills from April 1997 at a discount rate equivalent to
the rate of interest on ways and means advances to the Government of India–these
bills cater to the needs of State Governments, foreign central banks and other
specified bodies (these have surplus funds which can be invested for very short
periods), (ii) A new category of 14 days Treasury Bills, sold through action
for the first time in June 1997 to meet the cash management requirements of
various sections of the economy.
Dated Government Securities: The Government of India has also decided to
sell dated securities (of 5 year maturity and 10 maturity) on an auction basis. The
purpose of this Government decision is:
(i) to develop dated securities as a monetary instrument with flexible yields;
(ii) to provide financial instruments to suit investors’ expectations; and
(iii) to meet Government needs directly from the market.
A very interesting development is the introduction of repurchase auctions (Repos, for
short), since December 1992, in respect of Central Government dated securities. Repos are
now a regular feature of RBI’s market operations. One purpose of Repos is to even out short-
term fluctuations in liquidity of the money market.
When Government securities are repurchased from the market, RBI makes payment to
commercial banks and this adds to their liquidity. Repos are developing into a useful
instrument to even out sharp fluctuations in the money market.
Discount and Finance House of India Ltd. (DFHI)
DFHI has been set up as a port of the package of reform of the money market. It fills the
long-standing need of a discount house in India, which will buy bills and other short-term
paper from banks and financial institutions. In this way, DFHI enables banks and financial
institutions to invest their idle funds for short periods in bills and short dated paper.
Banks can sell their short-term securities to DFHI and get funds, in case they need them,
without disturbing their investments. The DFHI has been very active in the short-term
money market and has effectively contributed to the overall stability of the money market.
3. Commercial bills market: Another Sub-division of money market is commercial
bill market. A commercial bill or a bill of exchange is a short-term, negotiable,
and self liquidating money market instrument. It may be classified into clean bills,
document bills, inland bills, foreign bills, accommodation bills and supply bills etc.
Commercial Paper (CP)
The commercial paper (CP) is issued by companies with a net worth of Rs. 5 crores. The CP
is issued in multiples of Rs. 25 lakhs subject to a minimum issue of Rs. 1 crore. The maturity
of CP is between 3 to 6 months. The CPs are issued at a discount rate is freely determined.
The maximum amount of CP that a company can raise was limited to 20% (now raised
to 30%) of the maximum permissible bank finance. The purpose of introducing CP is to
Financial System 261
enable high-level corporate borrowers to diversify their sources of short-term borrowings
on the one hand, and provide an additional instrument to the banks and financial institutions
in the money market, on the other.
4. Certificate of deposits(CDs): The CDs are another important instrument of
money market. They are issued by banks in multiples of Rs. 25 lakhs subject to
a minimum amount of Rs. 1 crore. The maturity is between 3 months and one
year. They are issued at a discount to the face value and the discount rate is freely
determined according to market conditions. CDs are freely transferable after 45
days from the date of issue.
Money Market Mutual Funds(MMMFs)
In April 1992 the Government announced the setting up of Money Market Mutual Funds
(MMMFs) with the purpose of bringing Money Market instruments within the reach of
individuals. Scheduled commercial banks and public financial institutions would set up the
MMMFs. The shares/units of MMMFs would be issued only to individuals. In this respect,
they will differ from UTI and other mutual funds which have been mobilizing the savings of
the middle classes (and also of others including companies) for investment in equities in
the capital market.
Mutual funds have emerged as an important segment of financial markets in India,
especially following the initiatives taken by Government in the 1999–2000. Budget to resolve
problems associated with UTIs US 64 scheme and to liberalise tax treatment of incomes
earned through mutual funds. The now plays a crucial role in channeling savings of millions
of individuals/households form different parts of the country into investment in both equity
and debt instruments.
The mutual fund industry has witnessed several innovations in the current financial
year. The monetary and credit policy for 1999–2000 has permitted money market mutual
funds to offer cheque writing facility to unit holders. Some of the Mutual Funds have
introduced limited cheque writing facility by allowing its unit holders to issue cheques against
a savings account with a designated bank.
The Mid-term Review of Monetary and Credit Policy announced the decision to permit
scheduled commercial banks to offer “cheque writing” facility to Gilt Funds and those Liquid
income Schemes of Mutual Funds which predominantly (not less than 80 percent of the
corpus) invest in money market instruments. Another significant development related to
the emergence of sector funds targeting sectors such as information technology,
pharmaceuticals, fast moving consumer goods, etc. Equally important was the emergence of
Dedicated Gilt Fund envisaging 100 percent investment in Government securities, which
has made the Gilt Market accessible to small investors. In order to promote dematerialization,
the mutual fund industry introduced an innovative product facilitating investment solely in
dematerialized securities and exchange of any security in dematerialised segment for the
units of the scheme.
262 Financial Management
Venture Capital Funds (VCFs)
The Union Budget for 1999–2000 stressed the need for higher investment in venture
capital activity (investment in economic activities where risk is high and there is considerable
innovation involved e.g. in the knowledge based enterprises). As it is difficult to access
capital market to raise funds for technology development/demonstration, especially for small
and medium industries, VCF has a major role to play in this area.
The National Venture Fund for Software and IT industry (NVFSIT) launched in the
current financial year merits mention in this context. The Small Industry Development
Bank of India (SIDBI) Venture Capital Ltd. (SVCL) manages NVFSIT, which is a wholly
owned subsidiary of SIDBI. In the backdrop of these developments, SEBI initiated a process
of interaction with industry participants and experts to identify the various issues and key
areas for the development of the VCF industry in India.
Financial Services
Financial Services are the another and unavoidable component of the financial system of
the country. Normally financial services are provided by the non-banking financial companies
and later it is called as non-banking financial service companies. Financial services are
divided into two major categories such as:
Financial Services
Fund Based Fee Base
Mutual
Fund
Venture
Capital
Leasing
Finance
Hire
Purchase
Merchant
Banking
Credit
Rating
Project
Counselling
Fig. 13.10 Financial Services
Fund Based Financial Services
Fund based financial services such as leasing, venture capital, hire purchasing, insurance
and mutual funds etc. Because, these services are related to the funds transfer from one
place to another place and one person to another person.
Fee Based Financial Services
Fee based financial services such as merchant banking, underwriting, project counseling,
credit rating etc., because, these services such as merchant banking, underwriting, project
counseling, credit rating etc., because, these services are not related to any funds transfer
activities.
Financial System 263
Non-banking Finance Companies (NBFC)
The categories of NBFCs and the nature of their main activities currently being followed
by the RBI, which are very similar to the ones discussed by the Shah Working Group, are
as follows:
1. Equipment leasing company (ELC) means any company which is carrying on
as its principal business, the activity of leasing of equipment or the financing of
such activity.
2. Hire-purchase finance company (HPFC) means any company which is carrying
on as its principal business, hire-purchase transactions or the financing of such
transactions.
3. Housing finance company (HFC) means any company which is carrying on as
its principal business, the financing of the acquisition or construction of houses
including the acquisition or development of plots of land in connection therewith.
4. Investment company (IC) means any company which is carrying on as its
principal business, the acquisition of securities.
5. Loan company (LC) means any company which is carrying on as its principal
business, the providing of finance whether by making loans or advances, or otherwise
for any activity other than its own. This category does not include an equipment
leasing company or a hire-purchase finance company or a housing finance company.
6. Mutual benefit financial company (MBFC) means any company which is
notified by the Central Government under Section 620A of the Companies Act
1956 (1 of 1956).
7. Miscellaneous non-banking company (MNBC) means a company carrying on
all or any of the following types of business :
(a) Managing, conducting or supervising as a promoter, foreman or agent of any
transaction or arrangement by which the company enters into an agreement
with a specified number of subscribers that every one of them shall subscribe
a certain sum in installment over a definite period and that every one of such
subscribers shall in his turn, as determines by lot or by auction or by tender
or in such other manner as may be provided for in the agreement be entitled
to the prize amount.
(b) Conducting any other form of chit or kuri which is different from the type
of business referred to above. Undertaking or carrying on or engaging in or
executing any other business similar to the business referred to above.
8. Residuary non-banking company (RNBC) means a company which receives
any deposit under any scheme or arrangement, by whatever name called, in one
lump sum or in installments by way of contributions or subscriptions or by sale
of units or certificates or other instruments, or in any other manner and which
according to the definitions contained in the Non-Banking Financial Companies
(Reserve Bank) Directions, 1977 or as the case may be, the Miscellaneous
264 Financial Management
Non-Banking Companies (Reserve Bank) Directions, 1977 is not an insurance
company or a company belonging to one to seven at the previous page.
MODEL QUESTIONS
1. Define financial system?
2. Explain the major component of financial system?
3. Discuss various classification of banking as per the RBI Act?
4. Explain the role of NBFI in Indian economy?
5. What is financial market?
6. Explain the money market instrument?
7. What are the major stock market instruments?
8. Discuss the stock market performance in India.
9. What is financial services?
10. Explain the different categories of financial services provided by the NBFC.
11. Discuss the role of Life Insurance Corporation of India.

financial_management.pdf

  • 4.
    Financial Management isan essential part of the economic and non economic activities which leads to decide the efficient procurement and utilization of finance with profitable manner. In the olden days the subject Financial Management was a part of accountancy with the traditional approaches. Now a days it has been enlarged with innovative and multi dimensional functions in the field of business with the effect of industrialization, Financial Management has become a vital part of the business concern and they are concentrating more in the field of Financial Management. Financial Management also developed as corporate finance, business finance, financial economics, financial mathematics and financial engineering. Understanding the basic concept about the financial management becomes an essential part for the students of economics, commerce and management. This book provides detailed information about the finance and finance related area with simple language and the concepts are explained with easy examples. This book is also prepared based on the B.Com., B.B.A., B.B.M., M.Com., and M.B.A. syllabus of various universities for the benefits of the students. AUTHORS Preface
  • 5.
    Preface (v) CHAPTER -1 INTRODUCTION TO FINANCIAL MANAGEMENT 1–10 Introduction 1 Meaning of Finance 1 Definition of Finance 1 Definition of Business Finance 2 Types of Finance 2 Definition of Financial Management 3 Scope of Financial Management 4 Objectives of Financial Management 5 • Profit maximization 5 • Favourable arguments for profit maximization 6 • Unfavorable arguments for profit maximization 6 • Drawbacks of profit maximization 6 • Wealth maximization 6 • Favourable arguments for wealth maximization 7 • Unfavourable arguments for wealth maximization 7 Approaches to Financial Management 7 • Traditional approach 8 Functions of Finance Manager 8 Importance of Financial Management 9 • Financial planning 9 • Acquisition of funds 9 • Proper use of funds 10 • Financial decision 10 • Improve profitability 10 Contents
  • 6.
    Contents • Increase thevalue of the firm 10 • Promoting savings 10 Model Questions 10 CHAPTER - 2 FINANCIAL STATEMENT ANALYSIS 11–24 Introduction 11 Meaning and Definition 11 • Income statement 12 • Position statement 12 • Statement of changes in owners equity 12 • Statement of changes in financial position 12 Types of Financial Statement Analysis 13 Techniques of Financial StatementAnalysis 14 • Comparative statement analysis 15 • Comparative balance-sheet analysis 15 • Comparative profit and loss account analysis 16 • Trend analysis 17 • Common size analysis 17 Funds Flow Statement 18 Cash Flow Statement 19 • Difference between funds flow and cash flow statement 19 Ratio Analysis 20 • Liquidity ratio 21 • Activity ratio 21 • Solvency ratio 22 • Profitability ratio 22 Model Questions 24 CHAPTER - 3 SOURCES OF FINANCING 25–39 Introduction 25 • Long-term financial requirements or Fixed capital requirement 25 • Short-term financial requirements or Working capital requirement 25 Sources of Finance 26 Security Finance 28 • Characters of security finance 28 • Types of security finance 28 • Ownership securities 28 Equity Shares 28 • Features of equity shares 28 • Advantages of equity shares 29 • Disadvantages of equity shares 30 Preference Shares 30 • Irredeemable preference shares 31
  • 7.
    Contents • Participating preferenceshares 31 • Non-participating preference shares 31 • Convertible preference shares 31 • Non-convertible preference shares 31 • Features of preference shares 31 • Advantages of preference shares 31 • Disadvantages of preference shares 32 Deferred Shares 32 No Par Shares 32 Creditorship securities 33 • Debentures 33 • Types of debentures 33 • Features of debentures 34 • Advantages of debenture 34 • Disadvantages of debenture 34 Internal Finance 35 • Depreciation funds 35 • Retained earnings 35 • Advantages of retained earnings 36 • Disadvantages of retained earnings 36 Loan Financing 37 • Financial institutions 37 • Commercial banks 37 • Short-term loans 38 • Development banks 38 Model Questions 38 CHAPTER - 4 CAPITALIZATION 41–45 Introduction 41 Meaning of Capital 41 • Fixed capital 41 • Definition of fixed capital 41 • Character of fixed capital 42 • Working capital 42 Capitalization 42 • Meaning of capitalization 42 • Definition of capitalization 43 Types of Capitalization 43 • Over capitalization 43 • Causes of over capitalization 43 • Effects of over capitalization 44 • Remedies for over capitalization 44 • Under capitalization 44 • Causes of under capitalization 44
  • 8.
    Contents • Effects ofunder capitalization 45 • Remedies of under capitalization 45 • Watered capitalization 45 • Causes of watered capital 45 CHAPTER - 5 CAPITAL STRUCTURE 47–64 Introduction 47 • Meaning of capital structure 47 • Definition of capital structure 47 Financial Structure 48 Optimum Capital Structure 49 • Objectives of capital structure 49 • Forms of capital structure 49 Factors Determining Capital Structure 50 • Leverage 50 • Cost of capital 50 Capital Structure Theories 50 • Traditional approach 51 • Assumptions 51 • Comments 53 • Net Income (NI) approach 53 • Net Operating Income (NOI) approach 55 • Modigliani and Miller approach 58 Model Questions 64 CHAPTER - 6 COST OF CAPITAL 65–82 Introduction 65 • Meaning of cost of capital 65 • Definitions 65 • Assumption of cost of capital 66 Classification of Cost of Capital 66 • Explicit and implicit cost 66 • Average and marginal cost 67 • Historical and future cost 67 • Specific and combine cost 67 Importance of Cost of Capital 67 • Importance to capital budgeting decision 67 • Importance to structure decision 67 • Importance to evolution of financial performance 68 • Importance to other financial decisions 68 Computation of Cost of Capital 68 • Measurement of cost of capital 68 • Cost of equity 68
  • 9.
    Contents • Dividend priceapproach 68 • Dividend price plus growth approach 69 • Earning price approach 70 • Realized yield approach 71 • Cost of debt 72 • Debt issued at par 72 • Debt issued at premium or discount 72 • Cost of perpetual debt and redeemable debt 73 • Cost of preference share capital 74 • Cost of retained earnings 76 • Measurement of overall cost of capital 77 Model Questions 80 CHAPTER - 7 LEVERAGE 83–98 Introduction 83 • Meaning of leverage 83 • Definition of leverage 83 • Types of leverage 83 Operating Leverage 84 • Degree of operating leverage 84 • Uses of operating leverage 85 Financial Leverage 86 • Degree of financial leverage 86 • Alternative definition of financial leverage 87 • Uses of financial leverage 87 Distinguish Between Operating Leverage and Financial Leverage 89 EBIT - EPS Break Even Chart for Three Different FinancingAlternatives 89 CombinedLeverage 90 • Degree of combined leverage 90 Working Capital Leverage 93 Model Questions 96 CHAPTER - 8 DIVIDEND DECISION 99–117 Introduction 99 • Meaning of dividend 99 Types of Dividend/Form of Dividend 99 • Cash dividend 100 • Stock dividend 100 • Bond dividend 100 • Property dividend 100 Dividend Decision 100 Irrelevance of Dividend 101
  • 10.
    Contents Modigliani and Miller’sApproach101 Relevance of Dividend 107 • Walter’s model 107 • Gordon’s model 111 Factors Determining Dividend Policy 115 • Profitable position of the firm 115 • Uncertainty of future income 115 • Legal constrains 115 • Liquidity position 115 • Sources of finance 115 • Growth rate of the firm 115 • Tax policy 115 • Capital market conditions 115 Types of Dividend Policy 116 • Regular dividend policy 116 • Stable dividend policy 116 • Irregular dividend policy 116 • No dividend policy 116 Model Questions 116 CHAPTER - 9 CAPITAL BUDGETING 119–147 Introduction 119 • Definitions 119 • Need and importance of capital budgeting 120 Capital Budgeting Process 120 Kinds of Capital Budgeting Decisions 122 Methods of Capital Budgeting of Evaluation 122 • Pay-back period 122 • Un even cash inflows 124 • Post pay-back profitability method 124 • Accounting rate of return orAverage rate of return 126 • Net present value 128 • Internal rate of return 131 • Excess present value index 135 • Capital rationing 135 Risk and Uncertainly in Capital Budgeting 136 • Risk adjusted cut off rate 136 • Certainly equivalent method 137 • Sensitivity technique 138 • Probability technique 139 • Standard deviation method 140 • Co-efficient of variation method 142 • Decision tree analysis 142
  • 11.
    Contents • Construction ofdecision tree 142 Model Questions 144 CHAPTER - 10 WORKING CAPITAL 149–163 Introduction 149 Meaning of Working Capital 149 • Definitions 150 Concept of Working Capital 150 • Gross working capital 151 • Net working capital 151 • Component of working capital 151 Types of Working Capital 152 • Permanent working capital 152 • Temporary working capital 153 • Semi variable working capital 153 Needs of Working Capital 154 • Working capital position/Balanced working capital position 154 Factors Determining Working Capital Requirements 155 Computation (or Estimation) of Working Capital 156 Working Capital Management Policy 159 Sources of Working Capital 160 • Determining the finance mix 161 — Hedging approach 161 — Conservative approach 162 —Aggressive approach 162 Working Capital and Banking Committee 163 Model Questions 163 CHAPTER - 11 WORKING CAPITAL MANAGEMENT 165–197 Introduction 165 • Meaning 165 • Definition 165 Inventory Management 165 Introduction 166 • Meaning 166 • Kinds of inventories 166 • Objectives of inventory management 166 • Techniques of inventory management 167 • Stock level 167 • Minimum level 168 • Re-order level 168 • Maximum level 168 • Danger level 168
  • 12.
    Contents • Average stocklevel 168 • Lead time 168 • Safety stock 169 • Economic order quantity (EOQ) 169 Techniques Based on the Classification of Inventories 171 • A-B-C analysis 171 • Aging schedule of inventories 171 • VED analysis 172 • HML analysis 172 Techniques on the Basis of Records 172 • Valuation of inventories 172 Cash Management 173 • Motives for holding cash 173 • Cash management techniques 176 • Speedy cash collections 176 — Prompt payment by customers 176 — Early conversion of payments into cash 176 — Concentration banking 176 — Lock box system 176 • Slowing disbursement 177 • Cash management models 177 Receivable Management 179 • Collection cost 179 • Capital cost 179 • Administrative cost 179 • Default cost 179 • Factors considering the receivable size 179 Model Questions 194 CHAPTER - 12 SPECIAL FINANCING 199–224 Lease Financing 199 • Definition of leasing 199 • Elements of leasing 200 • Term of lease 200 • Lease rental 200 • Type of leasing 200 • Advantages of leasing 202 • Leasing finance institutions in India 203 • Leasing by development institutions 203 • Leasing by specialized institutions 203 • Private sector leasing company 204 • Private sector financial company 204 Venture Capital 204
  • 13.
    Contents • Introduction 204 •Meaning of venture capital 204 • Definition of venture capital 204 • Features of venture capital 205 • Venture capital in India 205 Factoring 206 • Myths on factoring 206 • History of the early factoring in Roman 207 • Factoring in United States 207 • Factoring in India 207 • Modus of operations 208 • Why factoring? 208 • Mechanics of factoring 209 • Types of factoring 210 Foreign Direct Investment 210 • FDI in India 211 • Through private placements or preferential allotments 211 • A comparative study between India and China 212 • Foreign Institutional Investors (FIIS) 212 • SEBI and FIIs 212 Merchant Banking 214 • Introduction 214 • Meaning 214 • Merchant banking in India 214 • Classification of merchant banking 214 • Functions of merchant banking 215 • Merchant banking organizations 215 Credit Rating 216 • Introduction 216 • Meaning of credit rating 216 • Objectives of credit rating 216 • Credit rating in India 216 • Operational performance of credit rating business in India 217 • Basis for credit rating 217 • Credit Rating Information Service of India Limited (CRISIL) 217 • Credit rating symbols of credit rating information service of India limited 217 • Operational result of credit rating information service of India limited 218 • Investment Information and Credit RatingAgency of India limited (ICRA) 218 • Credit rating symbols of investment information and credit rating agency of India limited 218 • Operational result of ICRA 219 • CreditAnalysis and Research Limited (CARE) 219 • Credit rating symbols of credit analysis and research limited 219
  • 14.
    Contents • Operational resultof credit analysis and research limited 219 Mutual Funds 220 • Introduction 220 • Origin of mutual funds 220 • Structure of mutual fund in India 220 • Meaning of mutual fund 221 • Advantages of mutual funds 221 • Public sector mutual fund 222 • Private sector mutual fund 222 • Open ended mutual fund 222 • Closed ended mutual fund 223 • Growth generated mutual fund 223 • Income generated mutual fund 223 • Balanced mutual fund 223 • Domestic mutual fund 223 • Global mutual fund 223 • Regional mutual fund 223 • Sector mutual fund 223 • Top ten mutual fund 223 Model Questions 224 CHAPTER - 13 FINANCIAL SYSTEM 225–264 Introduction 225 Financial System in India 225 • Financial institutions 226 • Banking institutions 226 • Commercial banks 226 • Scheduled commercial banks 226 • Nationalised banks 227 • State Bank of India(SBI) 228 • Growth and structure of commercial banks in India 228 • Private sectors banks 229 • New banks in private sectors 229 • Foreign banks in India 230 • Non-banking institutions 231 • Non-banking financial institutions 231 Industrial Finance Corporation of India (IFCI) 231 • Origin 231 • Capital 232 • Objectives 232 • Functions 232 • Management 232 • Subsidies of industrial finance corporation of India 232 • Working result 233
  • 15.
    Contents Industrial Credit andInvestment Corporation of India (ICICI) 233 • Origin 233 • Capital 233 • Objective 233 • Functions 233 • Management 233 Subsidies of industrial credit and investment corporation of India 234 • Working result 234 Industrial Development Bank of India (IDBI) 234 • Origin 234 • Capital 234 • Objectives 234 • Functions 234 • Management 235 • Working result 235 Industrial Reconstruction Bank of India (IRBI) 235 • Origin 235 • Capital 235 • Objectives 236 • Functions 236 • Management 236 • Working result 236 State Finance Corporation (SFC) 236 • Origin 236 • Capital 237 • Objectives 237 • Functions 237 • Management 237 State Finance Corporation in Tamil Nadu 237 Export Import Bank (Exim Bank) 237 • Origin 237 • Capital 237 • Objectives 237 • Functions 238 • Management 238 • Working result 238 National Bank forAgricultural and Rural Development 238 • Origin 238 • Capital 238 • Objectives 238 • Functions 239 • Management 239 • Working result 239 Specialized Financial Institutions 239
  • 16.
    Contents Insurance Sector inIndia 240 • Some of the private sector life insurance corporation 241 Life Insurance Corporation of India 241 • Role of LIC 241 General Insurance Companies 242 Unit Trust of India 243 • Origin 243 • Capital 243 • Objectives 243 • Functions 243 • Management 244 • Subsidiaries of Unit Trust of India 244 • Schemes of Unit Trust of India 244 • Working result of Unit Trust of India 244 Non-banking Non-financial Institutions 245 Financial Markets 245 • Capital market 246 • MIBOR and MIBID 248 • Share market 248 • Primary market 248 • Secondary market 249 • Methods of raising capital 250 • Public issue 251 • Right Issue 251 • Private placement 251 • GroupA and group B shares 252 Securities and Exchange Board of India (SEBI) 252 • Functions 252 • Trading procedure at stock exchanges 253 • Recent trends in capital market 253 Share Market Terminology 255 • Main share price index in famous share market of the world 257 • Name of share price indices changed 257 • Money market 257 • Discount and Finance House of India Ltd. (DFHI) 260 • Commercial Paper (CP) 260 • Money Market Mutual Funds (MMMFs) 261 • Venture Capital Funds (VCFs) 262 • Financial services 262 • Fund based financial services 262 • Fee based financial services 262 • Non-banking Finance Companies (NBFC) 263 Model Questions 264
  • 17.
    INTRODUCTION Business concern needsfinance to meet their requirements in the economic world. Any kind of business activity depends on the finance. Hence, it is called as lifeblood of business organization. Whether the business concerns are big or small, they need finance to fulfil their business activities. In the modern world, all the activities are concerned with the economic activities and very particular to earning profit through any venture or activities. The entire business activities are directly related with making profit. (According to the economics concept of factors of production, rent given to landlord, wage given to labour, interest given to capital and profit given to shareholders or proprietors), a business concern needs finance to meet all the requirements. Hence finance may be called as capital, investment, fund etc., but each term is having different meanings and unique characters. Increasing the profit is the main aim of any kind of economic activity. MEANING OF FINANCE Finance may be defined as the art and science of managing money. It includes financial service and financial instruments. Finance also is referred as the provision of money at the time when it is needed. Finance function is the procurement of funds and their effective utilization in business concerns. The concept of finance includes capital, funds, money, and amount. But each word is having unique meaning. Studying and understanding the concept of finance become an important part of the business concern. DEFINITION OF FINANCE According to Khan and Jain, “Finance is the art and science of managing money”.
  • 18.
    2 Financial Management Accordingto Oxford dictionary, the word ‘finance’ connotes ‘management of money’. Webster’s Ninth New Collegiate Dictionary defines finance as “the Science on study of the management of funds’ and the management of fund as the system that includes the circulation of money, the granting of credit, the making of investments, and the provision of banking facilities. DEFINITION OF BUSINESS FINANCE According to the Wheeler, “Business finance is that business activity which concerns with the acquisition and conversation of capital funds in meeting financial needs and overall objectives of a business enterprise”. According to the Guthumann and Dougall, “Business finance can broadly be defined as the activity concerned with planning, raising, controlling, administering of the funds used in the business”. In the words of Parhter and Wert, “Business finance deals primarily with raising, administering and disbursing funds by privately owned business units operating in non- financial fields of industry”. Corporate finance is concerned with budgeting, financial forecasting, cash management, credit administration, investment analysis and fund procurement of the business concern and the business concern needs to adopt modern technology and application suitable to the global environment. According to the Encyclopedia of Social Sciences, “Corporation finance deals with the financial problems of corporate enterprises. These problems include the financial aspects of the promotion of new enterprises and their administration during early development, the accounting problems connected with the distinction between capital and income, the administrative questions created by growth and expansion, and finally, the financial adjustments required for the bolstering up or rehabilitation of a corporation which has come into financial difficulties”. TYPES OF FINANCE Finance is one of the important and integral part of business concerns, hence, it plays a major role in every part of the business activities. It is used in all the area of the activities under the different names. Finance can be classified into two major parts:
  • 19.
    Introduction to FinancialManagement 3 Finance Private Finance Public Finance Individual Finance Partnership Finance Business Finance Central Government State Government Semi Government Fig. 1.1 Types of Finance Private Finance, which includes the Individual, Firms, Business or Corporate Financial activities to meet the requirements. Public Finance which concerns with revenue and disbursement of Government such as Central Government, State Government and Semi-Government Financial matters. DEFINITION OF FINANCIAL MANAGEMENT Financial management is an integral part of overall management. It is concerned with the duties of the financial managers in the business firm. The term financial management has been defined by Solomon, “It is concerned with the efficient use of an important economic resource namely, capital funds”. The most popular and acceptable definition of financial management as given by S.C. Kuchal is that “Financial Management deals with procurement of funds and their effective utilization in the business”. Howard and Upton : Financial management “as an application of general managerial principles to the area of financial decision-making. Weston and Brigham : Financial management “is an area of financial decision-making, harmonizing individual motives and enterprise goals”. Joshep and Massie : Financial management “is the operational activity of a business that is responsible for obtaining and effectively utilizing the funds necessary for efficient operations. Thus, Financial Management is mainly concerned with the effective funds management in the business. In simple words, Financial Management as practiced by business firms can be called as Corporation Finance or Business Finance.
  • 20.
    4 Financial Management SCOPEOF FINANCIAL MANAGEMENT Financial management is one of the important parts of overall management, which is directly related with various functional departments like personnel, marketing and production. Financial management covers wide area with multidimensional approaches. The following are the important scope of financial management. 1. Financial Management and Economics Economic concepts like micro and macroeconomics are directly applied with the financial management approaches. Investment decisions, micro and macro environmental factors are closely associated with the functions of financial manager. Financial management also uses the economic equations like money value discount factor, economic order quantity etc. Financial economics is one of the emerging area, which provides immense opportunities to finance, and economical areas. 2. Financial Management and Accounting Accounting records includes the financial information of the business concern. Hence, we can easily understand the relationship between the financial management and accounting. In the olden periods, both financial management and accounting are treated as a same discipline and then it has been merged as Management Accounting because this part is very much helpful to finance manager to take decisions. But nowaday’s financial management and accounting discipline are separate and interrelated. 3. Financial Management or Mathematics Modern approaches of the financial management applied large number of mathematical and statistical tools and techniques. They are also called as econometrics. Economic order quantity, discount factor, time value of money, present value of money, cost of capital, capital structure theories, dividend theories, ratio analysis and working capital analysis are used as mathematical and statistical tools and techniques in the field of financial management. 4. Financial Management and Production Management Production management is the operational part of the business concern, which helps to multiple the money into profit. Profit of the concern depends upon the production performance. Production performance needs finance, because production department requires raw material, machinery, wages, operating expenses etc. These expenditures are decided and estimated by the financial department and the finance manager allocates the appropriate finance to production department. The financial manager must be aware of the operational process and finance required for each process of production activities. 5. Financial Management and Marketing Produced goods are sold in the market with innovative and modern approaches. For this, the marketing department needs finance to meet their requirements.
  • 21.
    Introduction to FinancialManagement 5 The financial manager or finance department is responsible to allocate the adequate finance to the marketing department. Hence, marketing and financial management are interrelated and depends on each other. 6. Financial Management and Human Resource Financial management is also related with human resource department, which provides manpower to all the functional areas of the management. Financial manager should carefully evaluate the requirement of manpower to each department and allocate the finance to the human resource department as wages, salary, remuneration, commission, bonus, pension and other monetary benefits to the human resource department. Hence, financial management is directly related with human resource management. OBJECTIVES OF FINANCIAL MANAGEMENT Effective procurement and efficient use of finance lead to proper utilization of the finance by the business concern. It is the essential part of the financial manager. Hence, the financial manager must determine the basic objectives of the financial management. Objectives of Financial Management may be broadly divided into two parts such as: 1. Profit maximization 2. Wealth maximization. Wealth Profit Fig. 1.2 Objectives of Financial Management Profit Maximization Main aim of any kind of economic activity is earning profit. A business concern is also functioning mainly for the purpose of earning profit. Profit is the measuring techniques to understand the business efficiency of the concern. Profit maximization is also the traditional and narrow approach, which aims at, maximizes the profit of the concern. Profit maximization consists of the following important features. 1. Profit maximization is also called as cashing per share maximization. It leads to maximize the business operation for profit maximization. 2. Ultimate aim of the business concern is earning profit, hence, it considers all the possible ways to increase the profitability of the concern. Objectives
  • 22.
    6 Financial Management 3.Profit is the parameter of measuring the efficiency of the business concern. So it shows the entire position of the business concern. 4. Profit maximization objectives help to reduce the risk of the business. Favourable Arguments for Profit Maximization The following important points are in support of the profit maximization objectives of the business concern: (i) Main aim is earning profit. (ii) Profit is the parameter of the business operation. (iii) Profit reduces risk of the business concern. (iv) Profit is the main source of finance. (v) Profitability meets the social needs also. Unfavourable Arguments for Profit Maximization The following important points are against the objectives of profit maximization: (i) Profit maximization leads to exploiting workers and consumers. (ii) Profit maximization creates immoral practices such as corrupt practice, unfair trade practice, etc. (iii) Profit maximization objectives leads to inequalities among the sake holders such as customers, suppliers, public shareholders, etc. Drawbacks of Profit Maximization Profit maximization objective consists of certain drawback also: (i) It is vague: In this objective, profit is not defined precisely or correctly. It creates some unnecessary opinion regarding earning habits of the business concern. (ii) It ignores the time value of money: Profit maximization does not consider the time value of money or the net present value of the cash inflow. It leads certain differences between the actual cash inflow and net present cash flow during a particular period. (iii) It ignores risk: Profit maximization does not consider risk of the business concern. Risks may be internal or external which will affect the overall operation of the business concern. Wealth Maximization Wealth maximization is one of the modern approaches, which involves latest innovations and improvements in the field of the business concern. The term wealth means shareholder wealth or the wealth of the persons those who are involved in the business concern. Wealth maximization is also known as value maximization or net present worth maximization. This objective is an universally accepted concept in the field of business.
  • 23.
    Introduction to FinancialManagement 7 Favourable Arguments for Wealth Maximization (i) Wealth maximization is superior to the profit maximization because the main aim of the business concern under this concept is to improve the value or wealth of the shareholders. (ii) Wealth maximization considers the comparison of the value to cost associated with the business concern. Total value detected from the total cost incurred for the business operation. It provides extract value of the business concern. (iii) Wealth maximization considers both time and risk of the business concern. (iv) Wealth maximization provides efficient allocation of resources. (v) It ensures the economic interest of the society. Unfavourable Arguments for Wealth Maximization (i) Wealth maximization leads to prescriptive idea of the business concern but it may not be suitable to present day business activities. (ii) Wealth maximization is nothing, it is also profit maximization, it is the indirect name of the profit maximization. (iii) Wealth maximization creates ownership-management controversy. (iv) Management alone enjoy certain benefits. (v) The ultimate aim of the wealth maximization objectives is to maximize the profit. (vi) Wealth maximization can be activated only with the help of the profitable position of the business concern. APPROACHES TO FINANCIAL MANAGEMENT Financial management approach measures the scope of the financial management in various fields, which include the essential part of the finance. Financial management is not a revolutionary concept but an evolutionary. The definition and scope of financial management has been changed from one period to another period and applied various innovations. Theoretical points of view, financial management approach may be broadly divided into two major parts. Approach Traditional Approach Modern Approach Fig. 1.3 Approaches to Finance Management
  • 24.
    8 Financial Management TraditionalApproach Traditional approach is the initial stage of financial management, which was followed, in the early part of during the year 1920 to 1950. This approach is based on the past experience and the traditionally accepted methods. Main part of the traditional approach is rising of funds for the business concern. Traditional approach consists of the following important area. Arrangement of funds from lending body. Arrangement of funds through various financial instruments. Finding out the various sources of funds. FUNCTIONS OF FINANCE MANAGER Finance function is one of the major parts of business organization, which involves the permanent, and continuous process of the business concern. Finance is one of the interrelated functions which deal with personal function, marketing function, production function and research and development activities of the business concern. At present, every business concern concentrates more on the field of finance because, it is a very emerging part which reflects the entire operational and profit ability position of the concern. Deciding the proper financial function is the essential and ultimate goal of the business organization. Finance manager is one of the important role players in the field of finance function. He must have entire knowledge in the area of accounting, finance, economics and management. His position is highly critical and analytical to solve various problems related to finance. A person who deals finance related activities may be called finance manager. Finance manager performs the following major functions: 1. Forecasting Financial Requirements It is the primary function of the Finance Manager. He is responsible to estimate the financial requirement of the business concern. He should estimate, how much finances required to acquire fixed assets and forecast the amount needed to meet the working capital requirements in future. 2. Acquiring Necessary Capital After deciding the financial requirement, the finance manager should concentrate how the finance is mobilized and where it will be available. It is also highly critical in nature. 3. Investment Decision The finance manager must carefully select best investment alternatives and consider the reasonable and stable return from the investment. He must be well versed in the field of capital budgeting techniques to determine the effective utilization of investment. The finance manager must concentrate to principles of safety, liquidity and profitability while investing capital.
  • 25.
    Introduction to FinancialManagement 9 4. Cash Management Present days cash management plays a major role in the area of finance because proper cash management is not only essential for effective utilization of cash but it also helps to meet the short-term liquidity position of the concern. 5. Interrelation with Other Departments Finance manager deals with various functional departments such as marketing, production, personel, system, research, development, etc. Finance manager should have sound knowledge not only in finance related area but also well versed in other areas. He must maintain a good relationship with all the functional departments of the business organization. Department-I Department-II Department-III Departme nt-IV Forecasting Funds Managing Funds Investing Funds Finance Manager Accquring Funds Fig 1.4 Functions of Financial Manager IMPORTANCE OF FINANCIAL MANAGEMENT Finance is the lifeblood of business organization. It needs to meet the requirement of the business concern. Each and every business concern must maintain adequate amount of finance for their smooth running of the business concern and also maintain the business carefully to achieve the goal of the business concern. The business goal can be achieved only with the help of effective management of finance. We can’t neglect the importance of finance at any time at and at any situation. Some of the importance of the financial management is as follows: Financial Planning Financial management helps to determine the financial requirement of the business concern and leads to take financial planning of the concern. Financial planning is an important part of the business concern, which helps to promotion of an enterprise. Acquisition of Funds Financial management involves the acquisition of required finance to the business concern. Acquiring needed funds play a major part of the financial management, which involve possible source of finance at minimum cost.
  • 26.
    10 Financial Management ProperUse of Funds Proper use and allocation of funds leads to improve the operational efficiency of the business concern. When the finance manager uses the funds properly, they can reduce the cost of capital and increase the value of the firm. Financial Decision Financial management helps to take sound financial decision in the business concern. Financial decision will affect the entire business operation of the concern. Because there is a direct relationship with various department functions such as marketing, production personnel, etc. Improve Profitability Profitability of the concern purely depends on the effectiveness and proper utilization of funds by the business concern. Financial management helps to improve the profitability position of the concern with the help of strong financial control devices such as budgetary control, ratio analysis and cost volume profit analysis. Increase the Value of the Firm Financial management is very important in the field of increasing the wealth of the investors and the business concern. Ultimate aim of any business concern will achieve the maximum profit and higher profitability leads to maximize the wealth of the investors as well as the nation. Promoting Savings Savings are possible only when the business concern earns higher profitability and maximizing wealth. Effective financial management helps to promoting and mobilizing individual and corporate savings. Nowadays financial management is also popularly known as business finance or corporate finances. The business concern or corporate sectors cannot function without the importance of the financial management. MODEL QUESTIONS 1. What is finance? Define business finance. 2. Explain the types of finance. 3. Discuss the objectives of financial management. 4. Critically evaluate various approaches to the financial management. 5. Explain the scope of financial management. 6. Discuss the role of financial manager. 7. Explain the importance of financial management.
  • 27.
    INTRODUCTION A financial statementis an official document of the firm, which explores the entire financial information of the firm. The main aim of the financial statement is to provide information and understand the financial aspects of the firm. Hence, preparation of the financial statement is important as much as the financial decisions. MEANING AND DEFINITION According to Hamptors John, the financial statement is an organized collection of data according to logical and consistent accounting procedures. Its purpose is to convey an understanding of financial aspects of a business firm. It may show a position at a moment of time as in the case of a balance-sheet or may reveal a service of activities over a given period of time, as in the case of an income statement. Financial statements are the summary of the accounting process, which, provides useful information to both internal and external parties. John N. Nyer also defines it “Financial statements provide a summary of the accounting of a business enterprise, the balance-sheet reflecting the assets, liabilities and capital as on a certain data and the income statement showing the results of operations during a certain period”. Financial statements generally consist of two important statements: (i) The income statement or profit and loss account. (ii) Balance sheet or the position statement. A part from that, the business concern also prepares some of the other parts of statements, which are very useful to the internal purpose such as: (i) Statement of changes in owner’s equity. (ii) Statement of changes in financial position.
  • 28.
    12 Financial Management FinancialStatement Income Statement Position Statement Statement of changes in Owner's Equity Statement of changes in Financial Position Fig. 2.1 Financial Statement Income Statement Income statement is also called as profit and loss account, which reflects the operational position of the firm during a particular period. Normally it consists of one accounting year. It determines the entire operational performance of the concern like total revenue generated and expenses incurred for earning that revenue. Income statement helps to ascertain the gross profit and net profit of the concern. Gross profit is determined by preparation of trading or manufacturing a/c and net profit is determined by preparation of profit and loss account. Position Statement Position statement is also called as balance sheet, which reflects the financial position of the firm at the end of the financial year. Position statement helps to ascertain and understand the total assets, liabilities and capital of the firm. One can understand the strength and weakness of the concern with the help of the position statement. Statement of Changes in Owner’s Equity It is also called as statement of retained earnings. This statement provides information about the changes or position of owner’s equity in the company. How the retained earnings are employed in the business concern. Nowadays, preparation of this statement is not popular and nobody is going to prepare the separate statement of changes in owner’s equity. Statement of Changes in Financial Position Income statement and position statement shows only about the position of the finance, hence it can’t measure the actual position of the financial statement. Statement of changes in financial position helps to understand the changes in financial position from one period to another period.
  • 29.
    Financial Statement Analysis13 Statement of changes in financial position involves two important areas such as fund flow statement which involves the changes in working capital position and cash flow statement which involves the changes in cash position. TYPES OF FINANCIAL STATEMENT ANALYSIS Analysis of Financial Statement is also necessary to understand the financial positions during a particular period. According to Myres, “Financial statement analysis is largely a study of the relationship among the various financial factors in a business as disclosed by a single set of statements and a study of the trend of these factors as shown in a series of statements”. Analysis of financial statement may be broadly classified into two important types on the basis of material used and methods of operations. Types of Financial Analysis On the basis of Materials Used On the basis of Methods of Operations External Analysis Internal Analysis Horizontal Analysis Vertical Analysis Fig. 2.2 Types of Financial Statement Analysis 1. Based on Material Used Based on the material used, financial statement analysis may be classified into two major types such as External analysis and internal analysis. A. External Analysis Outsiders of the business concern do normally external analyses but they are indirectly involved in the business concern such as investors, creditors, government organizations and other credit agencies. External analysis is very much useful to understand the financial and operational position of the business concern. External analysis mainly depends on the published financial statement of the concern. This analysis provides only limited information about the business concern. B. Internal Analysis The company itself does disclose some of the valuable informations to the business concern in this type of analysis. This analysis is used to understand
  • 30.
    14 Financial Management theoperational performances of each and every department and unit of the business concern. Internal analysis helps to take decisions regarding achieving the goals of the business concern. 2. Based on Method of Operation Based on the methods of operation, financial statement analysis may be classified into two major types such as horizontal analysis and vertical analysis. A. Horizontal Analysis Under the horizontal analysis, financial statements are compared with several years and based on that, a firm may take decisions. Normally, the current year’s figures are compared with the base year (base year is consider as 100) and how the financial information are changed from one year to another. This analysis is also called as dynamic analysis. B. Vertical Analysis Under the vertical analysis, financial statements measure the quantities relationship of the various items in the financial statement on a particular period. It is also called as static analysis, because, this analysis helps to determine the relationship with various items appeared in the financial statement. For example, a sale is assumed as 100 and other items are converted into sales figures. TECHNIQUES OF FINANCIAL STATEMENT ANALYSIS Financial statement analysis is interpreted mainly to determine the financial and operational performance of the business concern. A number of methods or techniques are used to analyse the financial statement of the business concern. The following are the common methods or techniques, which are widely used by the business concern. Techniques Ratio Analysis Comparative Statement Trend Analysis Cash Flow Statement Funds Flow Statement Common Size Analysis Fig. 2.3 Techniques of Financial Statement Analysis 1. Comparative Statement Analysis A. Comparative Income Statement Analysis B. Comparative Position Statement Analysis
  • 31.
    Financial Statement Analysis15 2. Trend Analysis 3. Common Size Analysis 4. Fund Flow Statement 5. Cash Flow Statement 6. Ratio Analysis Comparative Statement Analysis Comparative statement analysis is an analysis of financial statement at different period of time. This statement helps to understand the comparative position of financial and operational performance at different period of time. Comparative financial statements again classified into two major parts such as comparative balance sheet analysis and comparative profit and loss account analysis. Comparative Balance Sheet Analysis Comparative balance sheet analysis concentrates only the balance sheet of the concern at different period of time. Under this analysis the balance sheets are compared with previous year’s figures or one-year balance sheet figures are compared with other years. Comparative balance sheet analysis may be horizontal or vertical basis. This type of analysis helps to understand the real financial position of the concern as well as how the assets, liabilities and capitals are placed during a particular period. Exercise 1 The following are the balance sheets of Tamil Nadu Mercantile Bank Ltd., for the years 2003 and 2004 as on 31st March. Prepare a comparative balance sheet and discuss the operational performance of the business concern. Balance Sheet of Tamil Nadu Mercantile Bank Limited As on 31st March (Rs. in thousands) Liabilities 2003 2004 Assets 2003 2004 Rs. Rs. Rs. Rs. Capital 2,845 2,845 Cash and Balance Reserve and with RBI 27,06,808 22,37,601 Surplus 39,66,009 47,65,406 Balance with Banks Deposits 4,08,45,783 4,40,42,730 and Money at call & Borrowings and short notice 11,36,781 16,07,975 Other Liabilities 7,27,671 2,84,690 Investments 2,14,21,060 2,35,37,098 Provisions 16,74,165 17,99,197 Advances 1,95,99,764 2,11,29,869 Fixed Assets 4,93,996 5,36,442 Other Assets 18,58,064 18,35,883 4,72,16,473 5,08,94,868 4,72,16,473 5,08,94,868
  • 32.
    16 Financial Management Solution ComparativeBalance Sheet Analysis Increased/ Increased/ Particulars Year ending 31st March Decreased Decreased (Amount) (Percentage) 2003 2004 Rs. Rs. Rs. Rs. Assets Current Assets Cash and Balance with RBI 27,06,808 22,37,601 (+) 4,69,207 (+) 17.33 Balance with Banks and money at call and short notice 11,36,781 16,07,975 (–) 4,71,194 (–) 41.45 Total Current Assets 38,43,589 38,45,576 1987 0.052 Fixed Assets Investments 2,14,21,060 2,35,37,098 (-) 21,16,038 (-) 9.88 Advances 1,95,99,764 2,11,39,869 (-) 15,40,105 (-) 7.86 Fixed Assets 4,93,996 5,36,442 (-) 42,446 (-) 8.59 Other Assets 18,58,064 18,35,883 (+) 22,181 (+) 1.19 Total Fixed Assets 4,33,72,884 4,70,49,292 (+) 36,76,408 8.48 Total Assets 4,72,16,473 5,08,94,868 36,78,395 7.79 Current Liabilities Borrowings 7,27,671 2,84,690 (+) 4,42,981 60.88 Other Liability and Provisions 16,74,165 17,99,197 (–) 1,25,032 7.47 Total Current Liability 24,01,836 20,83,887 3,17,949 13.24 Fixed Liability Capital 2,845 2,845 — — Reserves surplus 39,66,009 47,65,406 (+) 7,99,397 20.16 Deposit 4,08,45,783 4,40,42,730 (+) 31,96,947 7.83 Total Fixed Liability 4,48,14,637 4,88,10,981 (+) 39,96,344 8.92 Total Liability 4,72,16,473 5,08,94,868 36,78,395 7.79 Comparative Profit and Loss Account Analysis Another comparative financial statement analysis is comparative profit and loss account analysis. Under this analysis, only profit and loss account is taken to compare with previous year’s figure or compare within the statement. This analysis helps to understand the operational performance of the business concern in a given period. It may be analyzed on horizontal basis or vertical basis.
  • 33.
    Financial Statement Analysis17 Trend Analysis The financial statements may be analysed by computing trends of series of information. It may be upward or downward directions which involve the percentage relationship of each and every item of the statement with the common value of 100%. Trend analysis helps to understand the trend relationship with various items, which appear in the financial statements. These percentages may also be taken as index number showing relative changes in the financial information resulting with the various period of time. In this analysis, only major items are considered for calculating the trend percentage. Exercise 2 Calculate the Trend Analysis from the following information of Tamilnadu Mercantile Bank Ltd., taking 1999 as a base year and interpret them (in thousands). Year Deposits Advances Profit 1999 2,05,59,498 97,14,728 3,50,311 2000 2,66,45,251 1,25,50,440 4,06,287 2001 3,19,80,696 1,58,83,495 5,04,020 2002 3,72,99,877 1,77,26,607 5,53,525 2003 4,08,45,783 1,95,99,764 6,37,634 2004 4,40,42,730 2,11,39,869 8,06,755 Solution Trend Analysis (Base year 1999=100) (Rs. in thousands) Deposits Advances Profits Year Amount Trend Amount Trend Amount Trend Rs. Percentage Rs. Percentage Rs. Percentage 1999 2,05,59,498 100.0 97,14,728 100.0 3,50,311 100.0 2000 2,66,45,251 129.6 1,25,50,440 129.2 4,06,287 115.9 2001 3,19,80,696 155.5 1,58,83,495 163.5 5,04,020 143.9 2002 3,72,99,877 181.4 1,77,26,607 182.5 5,53,525 150.0 2003 4,08,45,783 198.7 1,95,99,764 201.8 6,37,634 182.0 2004 4,40,42,730 214.2 2,11,39,869 217.6 8,06,755 230.3 Common Size Analysis Another important financial statement analysis techniques are common size analysis in which figures reported are converted into percentage to some common base. In the balance sheet the total assets figures is assumed to be 100 and all figures are expressed as a percentage of this total. It is one of the simplest methods of financial statement analysis, which reflects the relationship of each and every item with the base value of 100%.
  • 34.
    18 Financial Management Exercise3 Common size balance sheet of Tamilnadu Mercantile Bank Ltd., as on 31st March 2003 and 2004. Particulars 31st March 2003 31st March 2004 Amount Percentage Amount Percentage Fixed Assets Investments 2,14,21,060 45.37 2,35,37,098 46.25 Advances 1,95,99,764 41.51 2,11,39,869 41.54 Fixed Assets 4,93,996 1.05 5,36,442 1.05 Other Assets 18,58,064 3.94 18,35,883 3.61 Total Fixed Assets 4,33,72,884 91.86 4,70,49,292 94.44 Current Assets Cash and Balance with RBI 27,06,808 5.73 22,37,601 4.40 Balance with banks and money at call and short notice 11,36,781 2.41 16,07,975 3.20 Total Current Assets 38,43,589 8.14 38,45,576 7.60 Total Assets 4,72,16,473 100.00 5,08,94,868 100.00 Fixed Liabilities Capital 2,845 0.01 2,845 0.01 Reserve and Surplus 39,66,009 8.40 47,65,406 9.36 Deposits 4,08,45,783 86.50 4,40,42,730 86.54 Total Fixed Liabilities 4,48,14,637 94.91 4,88,10,981 95.91 Current Liability Borrowings 7,27,671 1.54 2,84,690 0.56 Other Liabilities Provisions 16,74,165 3.55 17,99,197 3.53 Total Current Liability 24,01,836 5.09 20,83,887 4.09 Total Liabilities 4,72,16,473 100.00 5,08,94,868 100.00 FUNDS FLOW STATEMENT Funds flow statement is one of the important tools, which is used in many ways. It helps to understand the changes in the financial position of a business enterprise between the beginning and ending financial statement dates. It is also called as statement of sources and uses of funds. Institute of Cost and Works Accounts of India, funds flow statement is defined as “a statement prospective or retrospective, setting out the sources and application of the funds of an enterprise. The purpose of the statement is to indicate clearly the requirement of funds and how they are proposed to be raised and the efficient utilization and application of the same”.
  • 35.
    Financial Statement Analysis19 CASH FLOW STATEMENT Cash flow statement is a statement which shows the sources of cash inflow and uses of cash out-flow of the business concern during a particular period of time. It is the statement, which involves only short-term financial position of the business concern. Cash flow statement provides a summary of operating, investment and financing cash flows and reconciles them with changes in its cash and cash equivalents such as marketable securities. Institute of Chartered Accountants of India issued the Accounting Standard (AS-3) related to the preparation of cash flow statement in 1998. Difference Between Funds Flow and Cash Flow Statement Funds Flow Statement Cash Flow Statement 1. Funds flow statement is the report on the 1. Cash flow statement is the report showing movement of funds or working capital sources and uses of cash. 2. Funds flow statement explains how working 2. Cash flow statement explains the inflow and capital is raised and used during the particular out flow of cash during the particular period. 3. The main objective of fund flow statement is 3. The main objective of the cash flow statement to show the how the resources have been is to show the causes of changes in cash balanced mobilized and used. between two balance sheet dates. 4. Funds flow statement indicates the results of 4. Cash flow statement indicates the factors current financial management. contributing to the reduction of cash balance in spite of increase in profit and vice-versa. 5. In a funds flow statement increase or decrease 5. In a cash flow statement only cash receipt and in working capital is recorded. payments are recorded. 6. In funds flow statement there is no opening 6. Cash flow statement starts with opening cash and closing balances. balance and ends with closing cash balance. Exercise 4 From the following balance sheet of A Company Ltd. you are required to prepare a schedule of changes in working capital and statement of flow of funds. Balance Sheet of A Company Ltd., as on 31st March Liabilities 2004 2005 Assets 2004 2005 Share Capital 1,00,000 1,10,000 Land and Building 60,000 60,000 Profit and Loss a/c 20,000 23,000 Plant and Machinery 35,000 45,000 Loans — 10,000 Stock 20,000 25,000 Creditors 15,000 18,000 Debtors 18,000 28,000 Bills payable 5,000 4,000 Bills receivable 2,000 1,000 Cash 5,000 6,000 1,40,000 1,65,000 1,40,000 1,65,000
  • 36.
    20 Financial Management Solution Scheduleof Changes in Working Capital Particulars 2004 2005 Incharge Decharge Rs. Rs. Rs. Rs. Current Assets Stock 20,000 25,000 5,000 — Debtors 18,000 28,000 10,000 — Bills Receivable 2,000 1,000 — 1,000 Cash 5,000 6,000 1,000 A 45,000 60,000 Less Current Liabilities Creditors 15,000 18,000 3,000 Bills Payable 5,000 4,000 1,000 B 20,000 22,000 17,000 4,000 A-B 25,000 38,000 — 13,000 Increase in W.C. 38,000 38,000 17,000 17,000 Fund Flow Statement Sources Rs. Application Rs. Issued Share Capital 10,000 Purchase of Plant and Machinery 10,000 Loan 10,000 Increase in Working Capital 13,000 Funds From Operations 3,000 23,000 23,000 Exercise 5 From the above example 4 prepare a Cash Flow Statement. Solution Cash Flow Statement Inflow Rs. Outflow Rs. Balance b/d 5,000 Purchase of plant 10,000 Issued Share Capital 10,000 Increase Current Assets Loan 10,000 Stock Cash Opening Profit 3,000 Decrease in Bills Payable 5,000 Decrease in Bills 1,000 Balance c/d 10,000 Receivable 3,000 1,000 Increase in Creditors 6,000 32,000 32,000 RATIO ANALYSIS Ratio analysis is a commonly used tool of financial statement analysis. Ratio is a mathematical relationship between one number to another number. Ratio is used as an index for evaluating the financial performance of the business concern. An accounting ratio shows
  • 37.
    Financial Statement Analysis21 the mathematical relationship between two figures, which have meaningful relation with each other. Ratio can be classified into various types. Classification from the point of view of financial management is as follows: ● Liquidity Ratio ● Activity Ratio ● Solvency Ratio ● Profitability Ratio Liquidity Ratio It is also called as short-term ratio. This ratio helps to understand the liquidity in a business which is the potential ability to meet current obligations. This ratio expresses the relationship between current assets and current assets of the business concern during a particular period. The following are the major liquidity ratio: S. No. Ratio Formula Significant Ratio 1. Current Ratio = Current Assets CurrentLiability 2 : 1 2. Quick Ratio = Quick Assets Quick / Current 1 : 1 Liability Activity Ratio It is also called as turnover ratio. This ratio measures the efficiency of the current assets and liabilities in the business concern during a particular period. This ratio is helpful to understand the performance of the business concern. Some of the activity ratios are given below: S. No. Ratio Formula 1. Stock Turnover Ratio Costof Sales Average Inventory 2. Debtors Turnover Ratio Credit Sales AverageDebtors 3. Creditors Turnover Ratio Credit Purchase AverageCredit 4. Working Capital Turnover Ratio Sales Net WorkingCapital
  • 38.
    22 Financial Management SolvencyRatio It is also called as leverage ratio, which measures the long-term obligation of the business concern. This ratio helps to understand, how the long-term funds are used in the business concern. Some of the solvency ratios are given below: S. No Ratio Formula 1. Debt-Equity Ratio External Equity Internal Equity 2. Proprietary Ratio Shareholder / Shareholder 's Fund Total Assets 3. Interest Coverage Ratio EBIT Fixed Interest Charges Profitability Ratio Profitability ratio helps to measure the profitability position of the business concern. Some of the major profitability ratios are given below. S. No Ratio Formula 1. Gross Profit Ratio × Gross Profit 100 Net Sales 2. Net Profit Ratio × Net Profit after tax 100 Net Sales 3. Operating Profit Ratio × Operating Net Profit 100 Sales 4. Return in Investment × Net Profit after tax 100 Shareholder Fund Exercise 6 From the following balance sheet of Mr. Arvind Industries Ltd., as 31st March 2007. Liabilities Rs. Assets Rs. Equity Share Capital 10,000 Fixed assets (less 26,000 7% Preference Share Capital 2,000 depreciation Rs. 10,000) Reserves and Surplus 8,000 Current Assets: 6% Mortgage Debentures 14,000 Cash 1,000 Current Liabilities: Investments (10%) 3,000 Creditors 1,200 Sundry debtors 4,000 Bills payable 2,000 Stock 6,000 Outstanding expenses 200 Tax Provision 2,600 40,000 40,000
  • 39.
    Financial Statement Analysis23 Other information: 1. Net sales Rs. 60,000 2. Cost of goods sold Rs. 51,600 3. Net income before tax Rs. 4,000 4. Net income after tax Rs. 2,000 Calculate appropriate ratios. Solution Short-term solvency ratios Current Ratio = = = CurrentAssets 14,000 2.33:1 CurrentLiability 6,000 Liquid Ratio = = = LiquidRatio 8,000 1.33 :1 CurrentLiability 6,000 Long-term solvency ratios Proprietary ratio = ′ = = Proprietor s funds 20,000 0.5 :1 Total Assets 40,000 Proprietor’s fund or Shareholder’s fund=Equity share capital+Preference share capital+Reserve and surplus = 10,000+2,000+8,000=20,000 Debt-Equity ratio = = = Externalequities 20,000 1:1 Internalequities 20,000 Interest coverage ratio = EBIT 4,000+840 = =5.7times Fixed interest charges 840 Fixed interest charges = 6% on debentures of Rs.14,000 = Rs. 840 Activity Ratio Stock Turnover Ratio = Costof Sales 51,600 = =8.6times AverageInventory 6,000 As there is no opening stock, closing stock is taken as average stock.
  • 40.
    24 Financial Management DebtorsTurnover Ratio = CreditSales 60,000 = =10times AverageDebtors 6,000 In the absence of credit sales and opening debtors, total sales is considered as credit sales and closing debtors as average debtors. Creditors turn over ratio = = = Credit Purchases 43,200 36times AverageCreditors 1,200 In absence of purchases, cost of goods sold – gross profit treated as credit purchases and in the absence of opening creditors, closing creditors are treated as average creditors. Working Capital Turnover Ratio = = = Sales 60,000 7.5times Net WorkingCapital 8,000 Profitability Ratios Gross profit ratio = × × GrossProfit 8,400 100= 100=14% Sales 60,000 Net profit ratio = × × Net Profit 2,000 100= 100=3.33% Sales 60,000 In the absence of non-operating income, operating profit ratio is equal to net profit ratio. Return of Investment = × × ′ NetProfitafterTax 2,000 100= 100=10% Shareholder sFund 20,000 MODEL QUESTIONS 1. What is financial statement? 2. What is financial statement analysis? 3. Discuss various types of financial statement analysis. 4. Explain various methods of financial statement analysis. 5. What are the differences between fund flow and cash flow? 6. What is ratio analysis? Explain its types.
  • 41.
    INTRODUCTION Finance is thelifeblood of business concern, because it is interlinked with all activities performed by the business concern. In a human body, if blood circulation is not proper, body function will stop. Similarly, if the finance not being properly arranged, the business system will stop. Arrangement of the required finance to each department of business concern is highly a complex one and it needs careful decision. Quantum of finance may be depending upon the nature and situation of the business concern. But, the requirement of the finance may be broadly classified into two parts: Long-term Financial Requirements or Fixed Capital Requirement Financial requirement of the business differs from firm to firm and the nature of the requirements on the basis of terms or period of financial requirement, it may be long term and short-term financial requirements. Long-term financial requirement means the finance needed to acquire land and building for business concern, purchase of plant and machinery and other fixed expenditure. Long- term financial requirement is also called as fixed capital requirements. Fixed capital is the capital, which is used to purchase the fixed assets of the firms such as land and building, furniture and fittings, plant and machinery, etc. Hence, it is also called a capital expenditure. Short-term Financial Requirements or Working Capital Requirement Apart from the capital expenditure of the firms, the firms should need certain expenditure like procurement of raw materials, payment of wages, day-to-day expenditures, etc. This kind of expenditure is to meet with the help of short-term financial requirements which will meet the operational expenditure of the firms. Short-term financial requirements are popularly known as working capital.
  • 42.
    26 Financial Management SOURCESOF FINANCE Sources of finance mean the ways for mobilizing various terms of finance to the industrial concern. Sources of finance state that, how the companies are mobilizing finance for their requirements. The companies belong to the existing or the new which need sum amount of finance to meet the long-term and short-term requirements such as purchasing of fixed assets, construction of office building, purchase of raw materials and day-to-day expenses. Sources of finance may be classified under various categories according to the following important heads: 1. Based on the Period Sources of Finance may be classified under various categories based on the period. Long-term sources: Finance may be mobilized by long-term or short-term. When the finance mobilized with large amount and the repayable over the period will be more than five years, it may be considered as long-term sources. Share capital, issue of debenture, long-term loans from financial institutions and commercial banks come under this kind of source of finance. Long-term source of finance needs to meet the capital expenditure of the firms such as purchase of fixed assets, land and buildings, etc. Long-term sources of finance include: ● Equity Shares ● Preference Shares ● Debenture ● Long-term Loans ● Fixed Deposits Short-term sources: Apart from the long-term source of finance, firms can generate finance with the help of short-term sources like loans and advances from commercial banks, moneylenders, etc. Short-term source of finance needs to meet the operational expenditure of the business concern. Short-term source of finance include: ● Bank Credit ● Customer Advances ● Trade Credit ● Factoring ● Public Deposits ● Money Market Instruments 2. Based on Ownership Sources of Finance may be classified under various categories based on the period:
  • 43.
    Sources of Financing27 An ownership source of finance include ● Shares capital, earnings ● Retained earnings ● Surplus and Profits Borrowed capital include ● Debenture ● Bonds ● Public deposits ● Loans from Bank and Financial Institutions. 3. Based on Sources of Generation Sources of Finance may be classified into various categories based on the period. Internal source of finance includes ● Retained earnings ● Depreciation funds ● Surplus External sources of finance may be include ● Share capital ● Debenture ● Public deposits ● Loans from Banks and Financial institutions 4. Based in Mode of Finance Security finance may be include ● Shares capital ● Debenture Retained earnings may include ● Retained earnings ● Depreciation funds Loan finance may include ● Long-term loans from Financial Institutions ● Short-term loans from Commercial banks. The above classifications are based on the nature and how the finance is mobilized from various sources. But the above sources of finance can be divided into three major classifications: ● Security Finance ● Internal Finance ● Loans Finance
  • 44.
    28 Financial Management SECURITYFINANCE If the finance is mobilized through issue of securities such as shares and debenture, it is called as security finance. It is also called as corporate securities. This type of finance plays a major role in the field of deciding the capital structure of the company. Characters of Security Finance Security finance consists of the following important characters: 1. Long-term sources of finance. 2. It is also called as corporate securities. 3. Security finance includes both shares and debentures. 4. It plays a major role in deciding the capital structure of the company. 5. Repayment of finance is very limited. 6. It is a major part of the company’s total capitalization. Types of Security Finance Security finance may be divided into two major types: 1. Ownership securities or capital stock. 2. Creditorship securities or debt capital. Ownership Securities The ownership securities also called as capital stock, is commonly called as shares. Shares are the most Universal method of raising finance for the business concern. Ownership capital consists of the following types of securities. ● Equity Shares ● Preference Shares ● No par stock ● Deferred Shares EQUITY SHARES Equity Shares also known as ordinary shares, which means, other than preference shares. Equity shareholders are the real owners of the company. They have a control over the management of the company. Equity shareholders are eligible to get dividend if the company earns profit. Equity share capital cannot be redeemed during the lifetime of the company. The liability of the equity shareholders is the value of unpaid value of shares. Features of Equity Shares Equity shares consist of the following important features: 1. Maturity of the shares: Equity shares have permanent nature of capital, which has no maturity period. It cannot be redeemed during the lifetime of the company.
  • 45.
    Sources of Financing29 2. Residual claim on income: Equity shareholders have the right to get income left after paying fixed rate of dividend to preference shareholder. The earnings or the income available to the shareholders is equal to the profit after tax minus preference dividend. 3. Residual claims on assets: If the company wound up, the ordinary or equity shareholders have the right to get the claims on assets. These rights are only available to the equity shareholders. 4. Right to control: Equity shareholders are the real owners of the company. Hence, they have power to control the management of the company and they have power to take any decision regarding the business operation. 5. Voting rights: Equity shareholders have voting rights in the meeting of the company with the help of voting right power; they can change or remove any decision of the business concern. Equity shareholders only have voting rights in the company meeting and also they can nominate proxy to participate and vote in the meeting instead of the shareholder. 6. Pre-emptive right: Equity shareholder pre-emptive rights. The pre-emptive right is the legal right of the existing shareholders. It is attested by the company in the first opportunity to purchase additional equity shares in proportion to their current holding capacity. 7. Limited liability: Equity shareholders are having only limited liability to the value of shares they have purchased. If the shareholders are having fully paid up shares, they have no liability. For example: If the shareholder purchased 100 shares with the face value of Rs. 10 each. He paid only Rs. 900. His liability is only Rs. 100. Total number of shares 100 Face value of shares Rs. 10 Total value of shares 100 × 10 = 1,000 Paid up value of shares 900 Unpaid value/liability 100 Liability of the shareholders is only unpaid value of the share (that is Rs. 100). Advantages of Equity Shares Equity shares are the most common and universally used shares to mobilize finance for the company. It consists of the following advantages. 1. Permanent sources of finance: Equity share capital is belonging to long-term permanent nature of sources of finance, hence, it can be used for long-term or fixed capital requirement of the business concern. 2. Voting rights: Equity shareholders are the real owners of the company who have voting rights. This type of advantage is available only to the equity shareholders. 3. No fixed dividend: Equity shares do not create any obligation to pay a fixed rate of dividend. If the company earns profit, equity shareholders are eligible for
  • 46.
    30 Financial Management profit,they are eligible to get dividend otherwise, and they cannot claim any dividend from the company. 4. Less cost of capital: Cost of capital is the major factor, which affects the value of the company. If the company wants to increase the value of the company, they have to use more share capital because, it consists of less cost of capital (Ke ) while compared to other sources of finance. 5. Retained earnings: When the company have more share capital, it will be suitable for retained earnings which is the less cost sources of finance while compared to other sources of finance. Disadvantages of Equity Shares 1. Irredeemable: Equity shares cannot be redeemed during the lifetime of the business concern. It is the most dangerous thing of over capitalization. 2. Obstacles in management: Equity shareholder can put obstacles in management by manipulation and organizing themselves. Because, they have power to contrast any decision which are against the wealth of the shareholders. 3. Leads to speculation: Equity shares dealings in share market lead to secularism during prosperous periods. 4. Limited income to investor: The Investors who desire to invest in safe securities with a fixed income have no attraction for equity shares. 5. No trading on equity:When the company raises capital only with the help of equity, the company cannot take the advantage of trading on equity. PREFERENCE SHARES The parts of corporate securities are called as preference shares. It is the shares, which have preferential right to get dividend and get back the initial investment at the time of winding up of the company. Preference shareholders are eligible to get fixed rate of dividend and they do not have voting rights. Preference shares may be classified into the following major types: 1. Cumulative preference shares: Cumulative preference shares have right to claim dividends for those years which have no profits. If the company is unable to earn profit in any one or more years, C.P. Shares are unable to get any dividend but they have right to get the comparative dividend for the previous years if the company earned profit. 2. Non-cumulative preference shares: Non-cumulative preference shares have no right to enjoy the above benefits. They are eligible to get only dividend if the company earns profit during the years. Otherwise, they cannot claim any dividend.
  • 47.
    Sources of Financing31 3. Redeemable preference shares: When, the preference shares have a fixed maturity period it becomes redeemable preference shares. It can be redeemable during the lifetime of the company. The Company Act has provided certain restrictions on the return of the redeemable preference shares. Irredeemable Preference Shares Irredeemable preference shares can be redeemed only when the company goes for liquidator. There is no fixed maturity period for such kind of preference shares. Participating Preference Shares Participating preference sharesholders have right to participate extra profits after distributing the equity shareholders. Non-Participating Preference Shares Non-participating preference sharesholders are not having any right to participate extra profits after distributing to the equity shareholders. Fixed rate of dividend is payable to the type of shareholders. Convertible Preference Shares Convertible preference sharesholders have right to convert their holding into equity shares after a specific period. The articles of association must authorize the right of conversion. Non-convertible Preference Shares There shares, cannot be converted into equity shares from preference shares. Features of Preference Shares The following are the important features of the preference shares: 1. Maturity period: Normally preference shares have no fixed maturity period except in the case of redeemable preference shares. Preference shares can be redeemable only at the time of the company liquidation. 2. Residual claims on income: Preferential sharesholders have a residual claim on income. Fixed rate of dividend is payable to the preference shareholders. 3. Residual claims on assets: The first preference is given to the preference shareholders at the time of liquidation. If any extra Assets are available that should be distributed to equity shareholder. 4. Control of Management: Preference shareholder does not have any voting rights. Hence, they cannot have control over the management of the company. Advantages of Preference Shares Preference shares have the following important advantages. 1. Fixed dividend: The dividend rate is fixed in the case of preference shares. It is called as fixed income security because it provides a constant rate of income to the investors.
  • 48.
    32 Financial Management 2.Cumulative dividends: Preference shares have another advantage which is called cumulative dividends. If the company does not earn any profit in any previous years, it can be cumulative with future period dividend. 3. Redemption: Preference Shares can be redeemable after a specific period except in the case of irredeemable preference shares. There is a fixed maturity period for repayment of the initial investment. 4. Participation: Participative preference sharesholders can participate in the surplus profit after distribution to the equity shareholders. 5. Convertibility: Convertibility preference shares can be converted into equity shares when the articles of association provide such conversion. Disadvantages of Preference Shares 1. Expensive sources of finance: Preference shares have high expensive source of finance while compared to equity shares. 2. No voting right: Generally preference sharesholders do not have any voting rights. Hence they cannot have the control over the management of the company. 3. Fixed dividend only: Preference shares can get only fixed rate of dividend. They may not enjoy more profits of the company. 4. Permanent burden: Cumulative preference shares become a permanent burden so far as the payment of dividend is concerned. Because the company must pay the dividend for the unprofitable periods also. 5. Taxation: In the taxation point of view, preference shares dividend is not a deductible expense while calculating tax. But, interest is a deductible expense. Hence, it has disadvantage on the tax deduction point of view. DEFERRED SHARES Deferred shares also called as founder shares because these shares were normally issued to founders. The shareholders have a preferential right to get dividend before the preference shares and equity shares. According to Companies Act 1956 no public limited company or which is a subsidiary of a public company can issue deferred shares. These shares were issued to the founder at small denomination to control over the management by the virtue of their voting rights. NO PAR SHARES When the shares are having no face value, it is said to be no par shares. The company issues this kind of shares which is divided into a number of specific shares without any specific denomination. The value of shares can be measured by dividing the real net worth of the company with the total number of shares. Value of no. per share = Therealnet worth Total no.of shares
  • 49.
    Sources of Financing33 CREDITORSHIP SECURITIES Creditorship Securities also known as debt finance which means the finance is mobilized from the creditors. Debenture and Bonds are the two major parts of the Creditorship Securities. Debentures A Debenture is a document issued by the company. It is a certificate issued by the company under its seal acknowledging a debt. According to the Companies Act 1956, “debenture includes debenture stock, bonds and any other securities of a company whether constituting a charge of the assets of the company or not.” Types of Debentures Debentures may be divided into the following major types: 1. Unsecured debentures: Unsecured debentures are not given any security on assets of the company. It is also called simple or naked debentures. This type of debentures are treaded as unsecured creditors at the time of winding up of the company. 2. Secured debentures: Secured debentures are given security on assets of the company. It is also called as mortgaged debentures because these debentures are given against any mortgage of the assets of the company. 3. Redeemable debentures: These debentures are to be redeemed on the expiry of a certain period. The interest is paid periodically and the initial investment is returned after the fixed maturity period. 4. Irredeemable debentures: These kind of debentures cannot be redeemable during the life time of the business concern. 5. Convertible debentures: Convertible debentures are the debentures whose holders have the option to get them converted wholly or partly into shares. These debentures are usually converted into equity shares. Conversion of the debentures may be: Non-convertible debentures Fully convertible debentures Partly convertible debentures 6. Other types: Debentures can also be classified into the following types. Some of the common types of the debentures are as follows: 1. Collateral Debenture 2. Guaranteed Debenture 3. First Debenture 4. Zero Coupon Bond 5. Zero Interest Bond/Debenture
  • 50.
    34 Financial Management Featuresof Debentures 1. Maturity period: Debentures consist of long-term fixed maturity period. Normally, debentures consist of 10–20 years maturity period and are repayable with the principle investment at the end of the maturity period. 2. Residual claims in income: Debenture holders are eligible to get fixed rate of interest at every end of the accounting period. Debenture holders have priority of claim in income of the company over equity and preference shareholders. 3. Residual claims on asset: Debenture holders have priority of claims on Assets of the company over equity and preference shareholders. The Debenture holders may have either specific change on the Assets or floating change of the assets of the company. Specific change of Debenture holders are treated as secured creditors and floating change of Debenture holders are treated as unsecured creditors. 4. No voting rights: Debenture holders are considered as creditors of the company. Hence they have no voting rights. Debenture holders cannot have the control over the performance of the business concern. 5. Fixed rate of interest: Debentures yield fixed rate of interest till the maturity period. Hence the business will not affect the yield of the debenture. Advantages of Debenture Debenture is one of the major parts of the long-term sources of finance which of consists the following important advantages: 1. Long-term sources: Debenture is one of the long-term sources of finance to the company. Normally the maturity period is longer than the other sources of finance. 2. Fixed rate of interest: Fixed rate of interest is payable to debenture holders, hence it is most suitable of the companies earn higher profit. Generally, the rate of interest is lower than the other sources of long-term finance. 3. Trade on equity: A company can trade on equity by mixing debentures in its capital structure and thereby increase its earning per share. When the company apply the trade on equity concept, cost of capital will reduce and value of the company will increase. 4. Income tax deduction: Interest payable to debentures can be deducted from the total profit of the company. So it helps to reduce the tax burden of the company. 5. Protection: Various provisions of the debenture trust deed and the guidelines issued by the SEB1 protect the interest of debenture holders. Disadvantages of Debenture Debenture finance consists of the following major disadvantages: 1. Fixed rate of interest: Debenture consists of fixed rate of interest payable to securities. Even though the company is unable to earn profit, they have to pay the fixed rate of interest to debenture holders, hence, it is not suitable to those company earnings which fluctuate considerably.
  • 51.
    Sources of Financing35 2. No voting rights: Debenture holders do not have any voting rights. Hence, they cannot have the control over the management of the company. 3. Creditors of the company: Debenture holders are merely creditors and not the owners of the company. They do not have any claim in the surplus profits of the company. 4. High risk: Every additional issue of debentures becomes more risky and costly on account of higher expectation of debenture holders. This enhanced financial risk increases the cost of equity capital and the cost of raising finance through debentures which is also high because of high stamp duty. 5. Restrictions of further issues: The company cannot raise further finance through debentures as the debentures are under the part of security of the assets already mortgaged to debenture holders. INTERNAL FINANCE A company can mobilize finance through external and internal sources. A new company may not raise internal sources of finance and they can raise finance only external sources such as shares, debentures and loans but an existing company can raise both internal and external sources of finance for their financial requirements. Internal finance is also one of the important sources of finance and it consists of cost of capital while compared to other sources of finance. Internal source of finance may be broadly classified into two categories: A. Depreciation Funds B. Retained earnings Depreciation Funds Depreciation funds are the major part of internal sources of finance, which is used to meet the working capital requirements of the business concern. Depreciation means decrease in the value of asset due to wear and tear, lapse of time, obsolescence, exhaustion and accident. Generally depreciation is changed against fixed assets of the company at fixed rate for every year. The purpose of depreciation is replacement of the assets after the expired period. It is one kind of provision of fund, which is needed to reduce the tax burden and overall profitability of the company. Retained Earnings Retained earnings are another method of internal sources of finance. Actually is not a method of raising finance, but it is called as accumulation of profits by a company for its expansion and diversification activities. Retained earnings are called under different names such as; self finance, inter finance, and plugging back of profits. According to the Companies Act 1956 certain percentage, as prescribed by the central government (not exceeding 10%) of the net profits after tax of a
  • 52.
    36 Financial Management financialyear have to be compulsorily transferred to reserve by a company before declaring dividends for the year. Under the retained earnings sources of finance, a part of the total profits is transferred to various reserves such as general reserve, replacement fund, reserve for repairs and renewals, reserve funds and secrete reserves, etc. Advantages of Retained Earnings Retained earnings consist of the following important advantages: 1. Useful for expansion and diversification: Retained earnings are most useful to expansion and diversification of the business activities. 2. Economical sources of finance: Retained earnings are one of the least costly sources of finance since it does not involve any floatation cost as in the case of raising of funds by issuing different types of securities. 3. No fixed obligation: If the companies use equity finance they have to pay dividend and if the companies use debt finance, they have to pay interest. But if the company uses retained earnings as sources of finance, they need not pay any fixed obligation regarding the payment of dividend or interest. 4. Flexible sources: Retained earnings allow the financial structure to remain completely flexible. The company need not raise loans for further requirements, if it has retained earnings. 5. Increase the share value: When the company uses the retained earnings as the sources of finance for their financial requirements, the cost of capital is very cheaper than the other sources of finance; Hence the value of the share will increase. 6. Avoid excessive tax: Retained earnings provide opportunities for evasion of excessive tax in a company when it has small number of shareholders. 7. Increase earning capacity: Retained earnings consist of least cost of capital and also it is most suitable to those companies which go for diversification and expansion. Disadvantages of Retained Earnings Retained earnings also have certain disadvantages: 1. Misuses: The management by manipulating the value of the shares in the stock market can misuse the retained earnings. 2. Leads to monopolies: Excessive use of retained earnings leads to monopolistic attitude of the company. 3. Over capitalization: Retained earnings lead to over capitalization, because if the company uses more and more retained earnings, it leads to insufficient source of finance. 4. Tax evasion: Retained earnings lead to tax evasion. Since, the company reduces tax burden through the retained earnings.
  • 53.
    Sources of Financing37 5. Dissatisfaction: If the company uses retained earnings as sources of finance, the shareholder can’t get more dividends. So, the shareholder does not like to use the retained earnings as source of finance in all situations. LOAN FINANCING Loan financing is the important mode of finance raised by the company. Loan finance may be divided into two types: (a) Long-Term Sources (b) Short-Term Sources Loan finance can be raised through the following important institutions. Loan Financing Institutions Commercial Banks Development Banks Specialist Institutions Direct Finance Indirect Finance Domestic Finance Foreign Currency Finance Short-term Advance Long-term Loans Fig. 3.1 Loan Financing Financial Institutions With the effect of the industrial revaluation, the government established nation wide and state wise financial industries to provide long-term financial assistance to industrial concerns in the country. Financial institutions play a key role in the field of industrial development and they are meeting the financial requirements of the business concern. IFCI, ICICI, IDBI, SFC, EXIM Bank, ECGC are the famous financial institutions in the country. Commercial Banks Commercial Banks normally provide short-term finance which is repayable within a year. The major finance of commercial banks is as follows: Short-term advance: Commercial banks provide advance to their customers with or without securities. It is one of the most common and widely used short-term sources of finance, which are needed to meet the working capital requirement of the company. It is a cheap source of finance, which is in the form of pledge, mortgage, hypothecation and bills discounted and rediscounted.
  • 54.
    38 Financial Management Short-termLoans Commercial banks also provide loans to the business concern to meet the short-term financial requirements. When a bank makes an advance in lump sum against some security it is termed as loan. Loan may be in the following form: (a) Cash credit: A cash credit is an arrangement by which a bank allows his customer to borrow money up to certain limit against the security of the commodity. (b) Overdraft: Overdraft is an arrangement with a bank by which a current account holder is allowed to withdraw more than the balance to his credit up to a certain limit without any securities. Development Banks Development banks were established mainly for the purpose of promotion and development the industrial sector in the country. Presently, large number of development banks are functioning with multidimensional activities. Development banks are also called as financial institutions or statutory financial institutions or statutory non-banking institutions. Development banks provide two important types of finance: (a) Direct Finance (b) Indirect Finance/Refinance Some of the important development banks are discussed in Chapter 11. Presently the commercial banks are providing all kinds of financial services including development-banking services. And also nowadays development banks and specialisted financial institutions are providing all kinds of financial services including commercial banking services. Diversified and global financial services are unavoidable to the present day economics. Hence, we can classify the financial institutions only by the structure and set up and not by the services provided by them. MODEL QUESTIONS 1. Explain the various sources of financing. 2. What is meant by security financing? 3. What is debt financing? 4. Critically examine the advantages and disadvantages of equity shares. 5. Discuss the features of equity shares. 6. What are the merits of the deferred shares? 7. Explain the merits and demerits of preference shares? 8. List out the types of debentures.
  • 55.
    Sources of Financing39 9. Evaluate the overall view of debentures. 10. How internal sources of finance is used in the industrial concern? 11. What is retained earnings? 12. Evaluate the advantages and disadvantages of retained earnings. 13. How does depreciation funds help the industrial concern as sources of finance? 14. Evaluate the overall structure of the loan financing? 15. Explain the Commercial Bank financing? 16. Enumerate the major development banks. 17. Explain the role of UTI and LIC in industrial financing? 18. What is cash credit? 19. Mention the functions of IFCI.
  • 56.
  • 57.
    INTRODUCTION Financial planning anddecision play a major role in the field of financial management which consists of the major area of financial management such as, capitalization, financial structure, capital structure, leverage and financial forecasting. Financial planning includes the following important parts: ● Estimating the amount of capital to be raised. ● Determining the form and proportionate amount of securities. ● Formulating policies to manage the financial plan. MEANING OF CAPITAL The term capital refers to the total investment of the company in terms of money, and assets. It is also called as total wealth of the company. When the company is going to invest large amount of finance into the business, it is called as capital. Capital is the initial and integral part of new and existing business concern. The capital requirements of the business concern may be classified into two categories: (a) Fixed capital (b) Working capital. Fixed Capital Fixed capital is the capital, which is needed for meeting the permanent or long-term purpose of the business concern. Fixed capital is required mainly for the purpose of meeting capital expenditure of the business concern and it is used over a long period. It is the amount invested in various fixed or permanent assets, which are necessary for a business concern. Definition of Fixed Capital According to the definition of Hoagland, “Fixed capital is comparatively easily defined to include land, building, machinery and other assets having a relatively permanent existence”.
  • 58.
    42 Financial Management Characterof Fixed Capital ● Fixed capital is used to acquire the fixed assets of the business concern. ● Fixed capital meets the capital expenditure of the business concern. ● Fixed capital normally consists of long period. ● Fixed capital expenditure is of nonrecurring nature. ● Fixed capital can be raised only with the help of long-term sources of finance. Working Capital Working capital is the capital which is needed to meet the day-to-day transaction of the business concern. It may cross working capital and net working capital. Normally working capital consists of various compositions of current assets such as inventories, bills, receivable, debtors, cash, and bank balance and prepaid expenses. According to the definition of Bonneville, “any acquisition of funds which increases the current assets increase the Working Capital also for they are one and the same”. Working capital is needed to meet the following purpose: ● Purchase of raw material ● Payment of wages to workers ● Payment of day-to-day expenses ● Maintenance expenditure etc. Working Capital Capital Fixed Capital Fig. 4.1 Position of Capital CAPITALIZATION Capitalization is one of the most important parts of financial decision, which is related to the total amount of capital employed in the business concern. Understanding the concept of capitalization leads to solve many problems in the field of financial management. Because there is a confusion among the capital, capitalization and capital structure. Meaning of Capitalization Capitalization refers to the process of determining the quantum of funds that a firm needs to run its business. Capitalization is only the par value of share capital and debenture and it does not include reserve and surplus.
  • 59.
    Capitalization 43 Definition ofCapitalization Capitalization can be defined by the various financial management experts. Some of the definitions are mentioned below: According to Guthman and Dougall, “capitalization is the sum of the par value of stocks and bonds outstanding”. “Capitalization is the balance sheet value of stocks and bonds outstands”. — Bonneville and Dewey According to Arhur. S. Dewing, “capitalization is the sum total of the par value of all shares”. TYPES OF CAPITALIZATION Capitalization may be classified into the following three important types based on its nature: • Over Capitalization • Under Capitalization • Water Capitalization Over Capitalization Over capitalization refers to the company which possesses an excess of capital in relation to its activity level and requirements. In simple means, over capitalization is more capital than actually required and the funds are not properly used. According to Bonneville, Dewey and Kelly, over capitalization means, “when a business is unable to earn fair rate on its outstanding securities”. Example A company is earning a sum of Rs. 50,000 and the rate of return expected is 10%. This company will be said to be properly capitalized. Suppose the capital investment of the company is Rs. 60,000, it will be over capitalization to the extent of Rs. 1,00,000. The new rate of earning would be: 50,000/60,000×100=8.33% When the company has over capitalization, the rate of earnings will be reduced from 10% to 8.33%. Causes of Over Capitalization Over capitalization arise due to the following important causes: • Over issue of capital by the company. • Borrowing large amount of capital at a higher rate of interest. • Providing inadequate depreciation to the fixed assets.
  • 60.
    44 Financial Management •Excessive payment for acquisition of goodwill. • High rate of taxation. • Under estimation of capitalization rate. Effects of Over Capitalization Over capitalization leads to the following important effects: • Reduce the rate of earning capacity of the shares. • Difficulties in obtaining necessary capital to the business concern. • It leads to fall in the market price of the shares. • It creates problems on re-organization. • It leads under or misutilisation of available resources. Remedies for Over Capitalization Over capitalization can be reduced with the help of effective management and systematic design of the capital structure. The following are the major steps to reduce over capitalization. • Efficient management can reduce over capitalization. • Redemption of preference share capital which consists of high rate of dividend. • Reorganization of equity share capital. • Reduction of debt capital. Under Capitalization Under capitalization is the opposite concept of over capitalization and it will occur when the company’s actual capitalization is lower than the capitalization as warranted by its earning capacity. Under capitalization is not the so called inadequate capital. Under capitalization can be defined by Gerstenberg, “a corporation may be under capitalized when the rate of profit is exceptionally high in the same industry”. Hoagland defined under capitalization as “an excess of true assets value over the aggregate of stocks and bonds outstanding”. Causes of Under Capitalization Under capitalization arises due to the following important causes: • Under estimation of capital requirements. • Under estimation of initial and future earnings. • Maintaining high standards of efficiency. • Conservative dividend policy. • Desire of control and trading on equity. Effects of Under Capitalization Under Capitalization leads certain effects in the company and its shareholders. • It leads to manipulate the market value of shares. • It increases the marketability of the shares.
  • 61.
    Capitalization 45 • Itmay lead to more government control and higher taxation. • Consumers feel that they are exploited by the company. • It leads to high competition. Remedies of Under Capitalization Under Capitalization may be corrected by taking the following remedial measures: 1. Under capitalization can be compensated with the help of fresh issue of shares. 2. Increasing the par value of share may help to reduce under capitalization. 3. Under capitalization may be corrected by the issue of bonus shares to the existing shareholders. 4. Reducing the dividend per share by way of splitting up of shares. Watered Capitalization If the stock or capital of the company is not mentioned by assets of equivalent value, it is called as watered stock. In simple words, watered capital means that the realizable value of assets of the company is less than its book value. According to Hoagland’s definition, “A stock is said to be watered when its true value is less than its book value.” Causes of Watered Capital Generally watered capital arises at the time of incorporation of a company but it also arises during the life time of the business. The following are the main causes of watered capital: 1. Acquiring the assets of the company at high price. 2. Adopting ineffective depreciation policy. 3. Worthless intangible assets are purchased at higher price. MODEL QUESTIONS 1. What is capital and define the capital? 2. Explain the types of capital. 3. What is capitalization? 4. What are the kinds of capitalization? 5. Explain the effects of under capitalization. 6. Discuss the causes of over capitalization.
  • 62.
  • 63.
    INTRODUCTION Capital is themajor part of all kinds of business activities, which are decided by the size, and nature of the business concern. Capital may be raised with the help of various sources. If the company maintains proper and adequate level of capital, it will earn high profit and they can provide more dividends to its shareholders. Meaning of Capital Structure Capital structure refers to the kinds of securities and the proportionate amounts that make up capitalization. It is the mix of different sources of long-term sources such as equity shares, preference shares, debentures, long-term loans and retained earnings. The term capital structure refers to the relationship between the various long-term source financing such as equity capital, preference share capital and debt capital. Deciding the suitable capital structure is the important decision of the financial management because it is closely related to the value of the firm. Capital structure is the permanent financing of the company represented primarily by long-term debt and equity. Definition of Capital Structure The following definitions clearly initiate, the meaning and objective of the capital structures. According to the definition of Gerestenbeg, “Capital Structure of a company refers to the composition or make up of its capitalization and it includes all long-term capital resources”. According to the definition of James C. Van Horne, “The mix of a firm’s permanent long-term financing represented by debt, preferred stock, and common stock equity”. According to the definition of Presana Chandra, “The composition of a firm’s financing consists of equity, preference, and debt”.
  • 64.
    48 Financial Management Accordingto the definition of R.H. Wessel, “The long term sources of fund employed in a business enterprise”. FINANCIAL STRUCTURE The term financial structure is different from the capital structure. Financial structure shows the pattern total financing. It measures the extent to which total funds are available to finance the total assets of the business. Financial Structure = Total liabilities Or Financial Structure = Capital Structure + Current liabilities. The following points indicate the difference between the financial structure and capital structure. Financial Structures Capital Structures 1. It includes both long-term and short-term sources of funds 1. It includes only the long-term sources of funds. 2. It means the entire liabilities side of the balance sheet. 2. It means only the long-term liabilities of the company. 3. Financial structures consist of all sources of capital. 3. It consist of equity, preference and retained earning capital. 4. It will not be more important while determining the 4. It is one of the major determinations of value of the firm. the value of the firm. Example From the following information, calculate the capitalization, capital structure and financial structures. Balance Sheet Liabilities Assets Equity share capital 50,000 Fixed assets 25,000 Preference share capital 5,000 Good will 10,000 Debentures 6,000 Stock 15,000 Retained earnings 4,000 Bills receivable 5,000 Bills payable 2,000 Debtors 5,000 Creditors 3,000 Cash and bank 10,000 70,000 70,000 (i) Calculation of Capitalization S. No. Sources Amount 1. Equity share capital 50,000 2. Preference share capital 5,000 3. Debentures 6,000 Capitalization 61,000
  • 65.
    Capital Structure 49 (ii)Calculation of Capital Structures S. No. Sources Amount Proportion 1. Equity share capital 50,000 76.92 2. Preference share capital 5,000 7.69 3. Debentures 6,000 9.23 4. Retained earnings 4,000 6.16 65,000 100% (iii) Calculation of Financial Structure S. No. Sources Amount Proportion 1. Equity share capital 50,000 71.42 2. Preference share capital 5,000 7.14 3. Debentures 6,000 8.58 4 . Retained earnings 4,000 5.72 5. Bills payable 2,000 2.85 6. Creditors 3,000 4.29 70,000 100% OPTIMUM CAPITAL STRUCTURE Optimum capital structure is the capital structure at which the weighted average cost of capital is minimum and thereby the value of the firm is maximum. Optimum capital structure may be defined as the capital structure or combination of debt and equity, that leads to the maximum value of the firm. Objectives of Capital Structure Decision of capital structure aims at the following two important objectives: 1. Maximize the value of the firm. 2. Minimize the overall cost of capital. Forms of Capital Structure Capital structure pattern varies from company to company and the availability of finance. Normally the following forms of capital structure are popular in practice. • Equity shares only. • Equity and preference shares only. • Equity and Debentures only. • Equity shares, preference shares and debentures.
  • 66.
    50 Financial Management FACTORSDETERMINING CAPITAL STRUCTURE The following factors are considered while deciding the capital structure of the firm. Leverage It is the basic and important factor, which affect the capital structure. It uses the fixed cost financing such as debt, equity and preference share capital. It is closely related to the overall cost of capital. Cost of Capital Cost of capital constitutes the major part for deciding the capital structure of a firm. Normally long- term finance such as equity and debt consist of fixed cost while mobilization. When the cost of capital increases, value of the firm will also decrease. Hence the firm must take careful steps to reduce the cost of capital. (a) Nature of the business: Use of fixed interest/dividend bearing finance depends upon the nature of the business. If the business consists of long period of operation, it will apply for equity than debt, and it will reduce the cost of capital. (b) Size of the company: It also affects the capital structure of a firm. If the firm belongs to large scale, it can manage the financial requirements with the help of internal sources. But if it is small size, they will go for external finance. It consists of high cost of capital. (c) Legal requirements: Legal requirements are also one of the considerations while dividing the capital structure of a firm. For example, banking companies are restricted to raise funds from some sources. (d) Requirement of investors: In order to collect funds from different type of investors, it will be appropriate for the companies to issue different sources of securities. Government policy Promoter contribution is fixed by the company Act. It restricts to mobilize large, long- term funds from external sources. Hence the company must consider government policy regarding the capital structure. CAPITAL STRUCTURE THEORIES Capital structure is the major part of the firm’s financial decision which affects the value of the firm and it leads to change EBIT and market value of the shares. There is a relationship among the capital structure, cost of capital and value of the firm. The aim of effective capital structure is to maximize the value of the firm and to reduce the cost of capital. There are two major theories explaining the relationship between capital structure, cost of capital and value of the firm.
  • 67.
    Capital Structure 51 CapitalStructure Theories M odern Approach Traditional Approach Net Income Approach Net Operating Income Approach M odigliani-M iller Approach Fig. 5.1 Capital Structure Theories Traditional Approach It is the mix of Net Income approach and Net Operating Income approach. Hence, it is also called as intermediate approach. According to the traditional approach, mix of debt and equity capital can increase the value of the firm by reducing overall cost of capital up to certain level of debt. Traditional approach states that the Ko decreases only within the responsible limit of financial leverage and when reaching the minimum level, it starts increasing with financial leverage. Assumptions Capital structure theories are based on certain assumption to analysis in a single and convenient manner: • There are only two sources of funds used by a firm; debt and shares. • The firm pays 100% of its earning as dividend. • The total assets are given and do not change. • The total finance remains constant. • The operating profits (EBIT) are not expected to grow. • The business risk remains constant. • The firm has a perpetual life. • The investors behave rationally. Exercise 1 ABC Ltd., needs Rs. 30,00,000 for the installation of a new factory. The new factory expects to yield annual earnings before interest and tax (EBIT) of Rs.5,00,000. In choosing a financial plan, ABC Ltd., has an objective of maximizing earnings per share (EPS). The company proposes to issuing ordinary shares and raising debit of Rs. 3,00,000 and Rs. 10,00,000 of Rs. 15,00,000. The current market price per share is Rs. 250 and is expected to drop to Rs. 200 if the funds are borrowed in excess of Rs. 12,00,000. Funds can be raised at the following rates.
  • 68.
    52 Financial Management –upto Rs. 3,00,000 at 8% –over Rs. 3,00,000 to Rs. 15,000,00 at 10% –over Rs. 15,00,000 at 15% Assuming a tax rate of 50% advise the company. Solution Earnings Before Interest and Tax (BIT) less Interest Earnings Before Tax less: Tax@50%. Alternatives I II III (Rs. 3,00,000 debt) Rs. 10,00,000 debt) (Rs. 15,00,000 debt) 5,00,000 5,00,000 5,00,000 24,000 1,00,000 2,25,000 4,76,000 4,00,000 2,75,000 2,38,000 2,00,000 1,37,500 2,38,000 2,00,000 1,37,500 27,00,000 20,00,000 15,00,000 250 250 200 10800 8,000 7,500 2,38,000 2,00,000 1,37,500 No. of shares 10,800 8,000 7,500 Earnings per share 22.03 25 18.33 The secure alternative which gives the highest earnings per share is the best. Therefore the company is advised to revise Rs. 10,00,000 through debt amount Rs. 20,00,000 through ordinary shares. Exercise 2 Compute the market value of the firm, value of shares and the average cost of capital from the following information. Net operating income Rs. 1,00,000 Total investment Rs. 5,00,000 Equity capitalization Rate: (a) If the firm uses no debt 10% (b) If the firm uses Rs. 25,000 debentures 11% (c) If the firm uses Rs. 4,00,000 debentures 13% Assume that Rs. 5,00,000 debentures can be raised at 6% rate of interest whereas Rs. 4,00,000 debentures can be raised at 7% rate of interest. Solution Computation of market value of firm value of shares and the average cost of capital.
  • 69.
    Capital Structure 53 Particulars(a) No Debt (b) Rs. 2,50,000 (c) Rs. 4,00,000 6% debentures 7% debentures Net operating system 1,00,000 1,00,000 1,00,000 (–) Interest (i.e.) Cost of debt _ 15,000 28,000 Earnings available to Equity shareholders 1,00,000 85,000 72,000 Equity Capitalization Rate 10% 11% 13% Market value of shares × 10 10,000 100 × 100 85,000 11 × 100 72,000 13 Rs. 10,00,000/- Rs.772727/- Rs.553846/- Market Value of firm 10,00,000 10,22,727 9,53,846 1,00,000 1,00,000 1,00,000 Average cost of capital × 1,00,000 100 10,00,000 × 1 00 000 100 10 22 727 , , , , × 1 00 000 100 9 53 846 , , , , Earnings Valueof thefirm EBIT V =10% =9.78% =10.48% Comments From the above data, if debt of Rs. 2,50,000 is used, the value of the firm increases and the overall cost of capital decreases. But, if more debt is used to finance in place of equity i.e., Rs. 4,00,000 debentures, the value of the firm decreases and the overall cost of capital increases. Net Income (NI) Approach Net income approach suggested by the Durand. According to this approach, the capital structure decision is relevant to the valuation of the firm. In other words, a change in the capital structure leads to a corresponding change in the overall cost of capital as well as the total value of the firm. According to this approach, use more debt finance to reduce the overall cost of capital and increase the value of firm. Net income approach is based on the following three important assumptions: 1. There are no corporate taxes. 2. The cost debt is less than the cost of equity. 3. The use of debt does not change the risk perception of the investor.
  • 70.
    54 Financial Management where V= S+B V = Value of firm S = Market value of equity B = Market value of debt Market value of the equity can be ascertained by the following formula: S = e NI K where NI = Earnings available to equity shareholder Ke = Cost of equity/equity capitalization rate Format for calculating value of the firm on the basis of NI approach. Particulars Amount Net operating income (EBIT) XXX Less: interest on debenture (i) XXX Earnings available to equity holder (NI) XXX Equity capitalization rate (Ke ) XXX Market value of equity (S) XXX Market value of debt (B) XXX Total value of the firm (S+B) XXX Overall cost of capital = Ko = EBIT/V(%) XXX% Exercise 3 (a) A Company expects a net income of Rs. 1,00,000. It has Rs. 2,50,000, 8% debentures. The equality capitalization rate of the company is 10%. Calculate the value of the firm and overall capitalization rate according to the net income approach (ignoring income tax). (b) If the debenture debts are increased to Rs. 4,00,000. What shall be the value of the firm and the overall capitalization rate? Solution (a) Capitalization of the value of the firm Rs. Net income 1,00,000 Less: Interest on 8% Debentures of Rs. 2,50,000 20,000 Earnings available to equality shareholders 80,000 Equity capitalization rate 10% = × 80,000 100 10
  • 71.
    Capital Structure 55 Marketvalue of equity = 8,00,000 Market value of debentures = 2,50,000 Value of the firm = 10,50,000 Calculation of overall capitalization rate Overall cost of capital (Ko ) = Earnings Valueof thefirm EBIT V = 1,00,000 10,50,000 ×100 = 9.52% (b) Calculation of value of the firm if debenture debt is raised to Rs. 3,00,000. Rs. Net income 1,00,000 Less: Interest on 8% Debentures of Rs. 4,00,000 32,000 Equity Capitalization rate 68,000 10% Market value of equity = 68,000 × 100 10 = 6,80,000 = 6,80,000 Market value of Debentures = 4,00,000 Value of firm = 10,80,000 Overall cost of capital = 1,00,000 10,80,000 ×10 = 9.26% Thus, it is evident that with the increase in debt financing, the value of the firm has increased and the overall cost of capital has increased. Net Operating Income (NOI) Approach Another modern theory of capital structure, suggested by Durand. This is just the opposite to the Net Income approach. According to this approach, Capital Structure decision is irrelevant to the valuation of the firm. The market value of the firm is not at all affected by the capital structure changes. According to this approach, the change in capital structure will not lead to any change in the total value of the firm and market price of shares as well as the overall cost of capital.
  • 72.
    56 Financial Management NIapproach is based on the following important assumptions; The overall cost of capital remains constant; There are no corporate taxes; The market capitalizes the value of the firm as a whole; Value of the firm (V) can be calculated with the help of the following formula V = o EBIT K Where, V = Value of the firm EBIT = Earnings before interest and tax Ko = Overall cost of capital Exercise 4 XYZ expects a net operating income of Rs. 2,00,000. It has 8,00,000, 6% debentures. The overall capitalization rate is 10%. Calculate the value of the firm and the equity capitalization rate (Cost of Equity) according to the net operating income approach. If the debentures debt is increased to Rs. 10,00,000. What will be the effect on volume of the firm and the equity capitalization rate? Solution Net operating income = Rs. 2,00,000 Overall cost of capital = 10% Market value of the firm (V) = o EBIT K = 2,00,000× 100 10 = Rs. 20,00,000 Market value of the firm = Rs. 20,00,000 Less: market value of Debentures= Rs. 8,00,000 12,00,000 Equity capitalization rate (or) cost of equity (Ke) = − − EBIT I V D Where, V = value of the firm D = value of the debt capital = − 2,00,000– 48,000 20,00,000 8,00,000 ×100 =12.67%
  • 73.
    Capital Structure 57 Ifthe debentures debt is increased to Rs. 10,00,000, the value of the firm shall remain changed to Rs. 20,00,000. The equity capitalization rate will increase as follows: = − − EBIT I V D = − 2,00,000–60,000 20,00,000 10,00,000 ×100 = 1,40,000 10,00,000 ×100 = 14%. Exercise 5 Abinaya company Ltd. expresses a net operating income of Rs. 2,00,000. It has Rs. 8,00,000 to 7% debentures. The overall capitalization rate is 10%. (a) Calculate the value of the firm and the equity captialization rate (or) cost of equity according to the net operating income approach. (b) If the debenture debt is increasesd to Rs. 12,00,000. What will be the effect on the value of the firm, the equity capitalization rate? Solution (a) Net operating income = Rs. 2,00,000 Over all cost of capital = 10% Market value of the firm (V) NOI(EBIT) Overallcostof capital(OK) = 2,00,000×100/10 = Rs. 20,00,000 Market value of firm = Rs. 20,00,000 Less Market value of debentures = Rs. 8,00,000 Total marketing value of equity = Rs. 12,00,000 Equity capitalization rate (or) cost of equity (Ke) = − − EBIT I V D = 2,00,000 56,000 20,00,000 8,00,000 − − ×100 = 1,44,000 12,00,000 ×100 = 12%
  • 74.
    58 Financial Management whereI = Interest of debt V = Value of the firm D = Value of debt capital I = 8,00,000×7%=56,000 V = 20,00,000 D = 8,00,000 (b) If the debenture debt is increased at Rs. 12,00,000, the value of the firm shall changed to Rs. 20,00,000. Equity Capitalization Rate (Ke) = − − EBIT I V D = 2,00,000 84,000 20,00,000 12,00,000 − − = 14.5% where I= 12,00,000 at 7% = 84,000 Modigliani and Miller Approach Modigliani and Miller approach states that the financing decision of a firm does not affect the market value of a firm in a perfect capital market. In other words MM approach maintains that the average cost of capital does not change with change in the debt weighted equity mix or capital structures of the firm. Modigliani and Miller approach is based on the following important assumptions: • There is a perfect capital market. • There are no retained earnings. • There are no corporate taxes. • The investors act rationally. • The dividend payout ratio is 100%. • The business consists of the same level of business risk. Value of the firm can be calculated with the help of the following formula: − o EBIT (l t) K Where EBIT = Earnings before interest and tax Ko = Overall cost of capital t = Tax rate
  • 75.
    Capital Structure 59 Ke Ko k D/E RiskDue Debt Risk Bearing Debt R ate o f R etu rn Fig. 5.2 Modigliani and Miller Approach Exercise 6 There are two firms ‘A’ and ‘B’ which are exactly identical except that A does not use any debt in its financing, while B has Rs. 2,50,000 , 6% Debentures in its financing. Both the firms have earnings before interest and tax of Rs. 75,000 and the equity capitalization rate is 10%. Assuming the corporation tax is 50%, calculate the value of the firm. Solution The market value of firm A which does not use any debt. Vu= o EBIT K = 75,000 10/100 =75,000×100/10 = Rs. 7,50,000 The market value of firm B which uses debt financing of Rs. 2,50,000 Vt = Vu + t Vu = 7,50,000, t = 50% of Rs. 2,50,000 = 7,50,000 + 1,25,000 = Rs. 8,75,000 Exercise 7 The following data regarding the two companies ‘X’ and ‘Y’ belonging to the same equivalent class:
  • 76.
    60 Financial Management Company‘X’ Company ‘Y’ Number of ordinary shares 75,000 1,25,000 5% debentures 40,000 – Market price per shares Rs. 1.25 Rs. 1.00 Profit before interest Rs. 25,000 Rs. 25,000 All profits after paying debenture interest are distributed as dividends. You are required to explain how under Modigliani and Miller approach, an investor holding 10% of shares in company ‘X’ will be better off in switching his holding to company ‘Y’. Solution As per the opinion of Modigliani and Miller, two similar firms in all respects except their capital structure cannot have different market values because of arbitrage process. In case two similar firms except for their capital structure have different market values, arbitrage will take place and the investors will engage in ‘personal leverage’ as against the corporate leverage. In the given problem, the arbitrage will work out as below. 1. The investor will sell in the market 10% of shares in company ‘X’ for 75,000×10/100×1.25=Rs. 9375 2. He will raise a loan of Rs. 40,000×10/100=Rs. 4000 To take advantage of personal leverage as against the corporate leverage the company ‘Y’ does not use debt content in its capital structure. He will put 13375 shares in company ‘Y’ with the total amount realized from 1 and 2 i.e., Rs. 9375 plus Rs. 4000. Thus he will have 10.7% of shares in company ‘Y’. The investor will gain by switching his holding as below: Present income of the investor in company ‘X’ Rs. Profit before Interest of the Company 25,000 Less: Interest on Debentures 5% 2,000 Profit after Interest 23,000 Share of the investor = 10% of Rs. 23,000 i.e., Rs. 2300 Income of the investor after switching holding to company Profit before Interest of the company Rs. 25,000 Less Interest —— Profit after Interest 25,000 Share of the investor : 25,000× 13,375 1,25,000 = Rs. 2,675 Interest paid on loan taken 4000×5/100 200 Net Income of the Investor 2,475
  • 77.
    Capital Structure 61 Asthe net income of the investor in company ‘Y’ is higher than the cost of income from company ‘X’ due to switching the holding, the investor will gain in switching his holdings to company ‘Y’. Exercise 8 Paramount Products Ltd. wants to raise Rs. 100 lakh for diversification project. Current estimates of EBIT from the new project is Rs. 22 lakh p.a. Cost of debt will be 15% for amounts up to and including Rs. 40 lakh, 16% for additional amounts up to and including Rs. 50 lakh and 18% for additional amounts above Rs. 50 lakh. The equity shares (face value of Rs. 10) of the company have a current market value of Rs. 40. This is expected to fall to Rs. 32 if debts exceeding Rs. 50 lakh are raised. The following options are under consideration of the company. Option Debt Equity I 50% 50% II 40% 60% III 60% 40% Determine EPS for each option and state which option should the Company adopt. Tax rate is 50%. (ICWA Inter Dec. 1997) Solution I II III Equity 50,00,000 60,00,000 40,00,000 Debt 50,00,000 40,00,000 60,00,000 Amount to be raised 1,00,00,000 1,00,00,000 1,00,00,000 EBIT 22,00,000 22,00,000 22,00,000 Less: Interest of Debt 7,60,000 6,00,000 9,40,000 PBT 14,40,000 16,00,000 12,60,000 Less : Tax @ 50% 7,20,000 8,00,000 6,30,000 PAT 7,20,000 8,00,000 6,30,000 No. of equity shares 1,25,000 1,50,000 1,25,000 Rs. 5.76 Rs. 5.33 Rs. 5.04 Working Notes Calculation of Interest on Debt Total Debt I II III Interest on: 50,00,000 40,00,000 60,00,000 Ist Rs. 40,00,000 @ 15% 6,00,000 6,00,000 6,00,000 Next Rs.10,00,000 @ 16% 1,60,000 – 1,60,000 Balance Rs. 10,00,000 @ 18% – – 1,80,000 7,60,000 6,00,000 9,40,000
  • 78.
    62 Financial Management Exercise9 The following is the data regarding two Company’s. X and Y belonging to the same risk class. X Y No. of ordinary shares 90,000 1,50,000 Market price/share (Rs.) 1.2 1.0 6% debentures 60,000 – Profit before interest 18,000 18,000 All profits after interest are distributed as dividend. Explain how under Modigliani & Miller Approach an investor holding 10% of shares in Company X will be better off in switching his holding to Company Y. (CA Final Nov. 1993) Solution Both the firms have EBIT of Rs. 18,000. Company X has to pay interest of Rs. 3600 (i.e., 6% on Rs. 60,000) and the remaining profit of Rs. 14,400 is being distributed among the shareholders. The Company Y on the other hand has no interest liability and therefore is distributing Rs.18,000 among the shareholders. The investor will be well off under MM Model by selling the shares of X and shifting to shares of Y company through the arbitrage process as follows. If he sells shares of X Company He gets Rs. 10,800 (9,000 shares @ Rs.1.2 per share). He now takes a 6% loan of Rs.6,000 (i.e. 105 of Rs. 60,000) and out of the total cash of Rs. 16,800 he purchases 10% of shares of Company Y for Rs. 15,000; his position with regard to Company Y would be as follows: X Y Dividends (10% of Profits) 1,440 1,800 Less:Interest (6% on Rs. 6,000) – 360 Net Income 1,440 1,440 Thus by shifting from Company Y the investor is able to get the same income of Rs. 1,440 and still having funds of Rs. 1,800 (i.e., Rs. 16,800 – 15,000) at his disposal. He is better off not in terms of income but in terms of having capital of Rs. 1,800 with him which he can invest elsewhere. Exercise 10 Gentry Motors Ltd., a producer of turbine generators, is in this situation; EBIT = Rs. 40 lac. rate =35%, dept. outstanding = D = Rs. 20 lac., rate of Interest =10%, Ke = 15%, shares of stock outstanding = No. = Rs. 6,00,000 and book value per share = Rs. 10. Since Gentry’s product market is stable and the Company expects no growth, all earnings are paid out as dividends. The debt consists of perpetual bonds. What are the Gentry’s EBS and its price per share, Po ? (CS Final Dec. 1998)
  • 79.
    Capital Structure 63 Solution (a)EBIT 40,00,000 interest @ 10% 2,00,000 38,00,000 Tax @ 35% 13,30,000 24,70,000 No. of shares 6,00,000 EPS (or Dividend) Rs. 4.12 Ke (given) 15% Po (i.e., D/Ke) 4.12/.15 ⇒ Rs. 27.47 In the same question if the Company increases its debt by Rs. 80 lakh to a total of Rs. 1 crore using the new debt to buy and retire of its shares at current price, its interest rate on debt will be 12% and its cost of equity will rise from 15% to 17%. EBIT will remain constant, should this Company change its capital structure. If Company decides to increase its debt by Rs. 80 lacs, the Company may buy back 80,00,000 ÷ 27.47 = 2,91,226 shares. Thereafter the remaining no. of shares would be 3,08,774 (i.e., 6,00,000 – 2,91,226). The market price of the share may be ascertained as follows: EBIT 40,00,000 Interest @ 12% on Rs. 1 crore 12,00,000 28,00,000 Tax @ 35% 9,80,000 18,20,000 No. of equity shares 3,08,774 EPS Rs. 5.89 Ke 17% Po (i.e., D/Ke) 5.89 .17 = Rs. 34.64 As the price is expected to rise from 27.47 to Rs 34.64, the Company may change its capital structure by raising debt and retaining some number of shares.
  • 80.
    64 Financial Management MODELQUESTIONS 1. Define capital structure. 2. Differentiate the capital structure and financial structure. 3. What is optimum capital structure? 4. Discuss the various factors affecting the capital structure. 5. Explain the capital structure theories. 6. XYZ Ltd., expects a net income of Rs. 1,50,000. The company has 10% of 5,00,000 Debentures. The equity capitalization rate of the company is 10%. (a) Calculate the value of the firm and overall capitalization rate according to the net income approach (ignoring income tax). (b) If the debenture debt is increased to Rs. 7,50,000 and interest of debt is change to 9%. What is the value of the firm and overall capitalization rate? (Ans. (a) Rs. 15,00,000, 10% (b) Rs. 15,75,000 and 9.52%) 7. A Company Ltd., projected net operating income of Rs. 75,000. It has Rs. 3,00,000, 8% debentures. (a) Calculate the value of the firm according to 10 net opening income and overall capitalization rate is 10%. (b) If debenture debt is increased to Rs. 5,00,000. What is the value of the firm and the equity capitalization rate? (Ans. (a) Rs. 7,50,000, (b) 11.33%, 14%) 8. According to Traditional approach, compute the market value of the firm, value of shares and the average cost of capital from the following information: Net Operating Income 1,00,000 Total Investment 7,00,000 Equity capitalization Rate: (a) if the firms uses no debt 7%. (b) if the firm uses Rs. 2,00,000 debentures 8% (c) if the firm uses Rs. 4,00,000 debentures 9% Assume that Rs 2,00,000 debentures at 6% rate of interest whereas Rs. 4,00,000 debentures at 6% rate of interest whereas Rs. 4,00,000 debentures at 7% rate of interest. (Ans. 7%, 7.69%, 8.33)
  • 81.
    INTRODUCTION Cost of capitalis an integral part of investment decision as it is used to measure the worth of investment proposal provided by the business concern. It is used as a discount rate in determining the present value of future cash flows associated with capital projects. Cost of capital is also called as cut-off rate, target rate, hurdle rate and required rate of return. When the firms are using different sources of finance, the finance manager must take careful decision with regard to the cost of capital; because it is closely associated with the value of the firm and the earning capacity of the firm. Meaning of Cost of Capital Cost of capital is the rate of return that a firm must earn on its project investments to maintain its market value and attract funds. Cost of capital is the required rate of return on its investments which belongs to equity, debt and retained earnings. If a firm fails to earn return at the expected rate, the market value of the shares will fall and it will result in the reduction of overall wealth of the shareholders. Definitions The following important definitions are commonly used to understand the meaning and concept of the cost of capital. According to the definition of John J. Hampton “ Cost of capital is the rate of return the firm required from investment in order to increase the value of the firm in the market place”. According to the definition of Solomon Ezra, “Cost of capital is the minimum required rate of earnings or the cut-off rate of capital expenditure”.
  • 82.
    66 Financial Management Accordingto the definition of James C. Van Horne, Cost of capital is “A cut-off rate for the allocation of capital to investment of projects. It is the rate of return on a project that will leave unchanged the market price of the stock”. According to the definition of William and Donaldson, “Cost of capital may be defined as the rate that must be earned on the net proceeds to provide the cost elements of the burden at the time they are due”. Assumption of Cost of Capital Cost of capital is based on certain assumptions which are closely associated while calculating and measuring the cost of capital. It is to be considered that there are three basic concepts: 1. It is not a cost as such. It is merely a hurdle rate. 2. It is the minimum rate of return. 3. It consis of three important risks such as zero risk level, business risk and financial risk. Cost of capital can be measured with the help of the following equation. K = rj + b + f. Where, K = Cost of capital. rj = The riskless cost of the particular type of finance. b = The business risk premium. f = The financial risk premium. CLASSIFICATION OF COST OF CAPITAL Cost of capital may be classified into the following types on the basis of nature and usage: • Explicit and Implicit Cost. • Average and Marginal Cost. • Historical and Future Cost. • Specific and Combined Cost. Explicit and Implicit Cost The cost of capital may be explicit or implicit cost on the basis of the computation of cost of capital. Explicit cost is the rate that the firm pays to procure financing. This may be calculated with the help of the following equation; CIo = = + ∑ n t t t 1 CO (t C) Where, CIo = initial cash inflow C = outflow in the period concerned
  • 83.
    Cost of Captial67 N = duration for which the funds are provided T = tax rate Implicit cost is the rate of return associated with the best investment opportunity for the firm and its shareholders that will be forgone if the projects presently under consideration by the firm were accepted. Average and Marginal Cost Average cost of capital is the weighted average cost of each component of capital employed by the company. It considers weighted average cost of all kinds of financing such as equity, debt, retained earnings etc. Marginal cost is the weighted average cost of new finance raised by the company. It is the additional cost of capital when the company goes for further raising of finance. Historical and Future Cost Historical cost is the cost which as already been incurred for financing a particular project. It is based on the actual cost incurred in the previous project. Future cost is the expected cost of financing in the proposed project. Expected cost is calculated on the basis of previous experience. Specific and Combine Cost The cost of each sources of capital such as equity, debt, retained earnings and loans is called as specific cost of capital. It is very useful to determine the each and every specific source of capital. The composite or combined cost of capital is the combination of all sources of capital. It is also called as overall cost of capital. It is used to understand the total cost associated with the total finance of the firm. IMPORTANCE OF COST OF CAPITAL Computation of cost of capital is a very important part of the financial management to decide the capital structure of the business concern. Importance to Capital Budgeting Decision Capital budget decision largely depends on the cost of capital of each source. According to net present value method, present value of cash inflow must be more than the present value of cash outflow. Hence, cost of capital is used to capital budgeting decision. Importance to Structure Decision Capital structure is the mix or proportion of the different kinds of long term securities. A firm uses particular type of sources if the cost of capital is suitable. Hence, cost of capital helps to take decision regarding structure.
  • 84.
    68 Financial Management Importanceto Evolution of Financial Performance Cost of capital is one of the important determine which affects the capital budgeting, capital structure and value of the firm. Hence, it helps to evaluate the financial performance of the firm. Importance to Other Financial Decisions Apart from the above points, cost of capital is also used in some other areas such as, market value of share, earning capacity of securities etc. hence, it plays a major part in the financial management. COMPUTATION OF COST OF CAPITAL Computation of cost of capital consists of two important parts: 1. Measurement of specific costs 2. Measurement of overall cost of capital Measurement of Cost of Capital It refers to the cost of each specific sources of finance like: • Cost of equity • Cost of debt • Cost of preference share • Cost of retained earnings Cost of Equity Cost of equity capital is the rate at which investors discount the expected dividends of the firm to determine its share value. Conceptually the cost of equity capital (Ke) defined as the “Minimum rate of return that a firm must earn on the equity financed portion of an investment project in order to leave unchanged the market price of the shares”. Cost of equity can be calculated from the following approach: • Dividend price (D/P) approach • Dividend price plus growth (D/P + g) approach • Earning price (E/P) approach • Realized yield approach. Dividend Price Approach The cost of equity capital will be that rate of expected dividend which will maintain the present market price of equity shares. Dividend price approach can be measured with the help of the following formula: e p D K = N
  • 85.
    Cost of Captial69 Where, Ke = Cost of equity capital D = Dividend per equity share Np = Net proceeds of an equity share Exercise 1 A company issues 10,000 equity shares of Rs. 100 each at a premium of 10%. The company has been paying 25% dividend to equity shareholders for the past five years and expects to maintain the same in the future also. Compute the cost of equity capital. Will it make any difference if the market price of equity share is Rs. 175? Solution Ke = p D N = 25 100 × 100 = 22.72% If the market price of a equity share is Rs. 175. = e p D K N = 25 175 × 100 = 14.28% Dividend Price Plus Growth Approach The cost of equity is calculated on the basis of the expected dividend rate per share plus growth in dividend. It can be measured with the help of the following formula: = + e p D K g N Where, Ke = Cost of equity capital D = Dividend per equity share g = Growth in expected dividend Np = Net proceeds of an equity share Exercise 2 (a) A company plans to issue 10000 new shares of Rs. 100 each at a par. The floatation costs are expected to be 4% of the share price. The company pays a dividend of Rs. 12 per share initially and growth in dividends is expected to be 5%. Compute the cost of new issue of equity shares.
  • 86.
    70 Financial Management (b)If the current market price of an equity share is Rs. 120. Calculate the cost of existing equity share capital Solution (a) Ke= p D N +g = − 12 100 4 +5=17.5% (b) Ke= p D N + g = 12 120 +5%=15% Exercise 3 The current market price of the shares of A Ltd. is Rs. 95. The floatation costs are Rs. 5 per share amounts to Rs. 4.50 and is expected to grow at a rate of 7%. You are required to calculate the cost of equity share capital. Solution Market price Rs. 95 Dividend Rs. 4.50 Growth 7%. Ke = p D N + g = 4.50 95 × 100 + 7% = 4.73% + 7% = 11.73% Earning Price Approach Cost of equity determines the market price of the shares. It is based on the future earning prospects of the equity. The formula for calculating the cost of equity according to this approach is as follows. = e p E K N Where, Ke = Cost of equity capital E = Earning per share Np = Net proceeds of an equity share
  • 87.
    Cost of Captial71 Exercise 4 A firm is considering an expenditure of Rs. 75 lakhs for expanding its operations. The relevant information is as follows : Number of existing equity shares =10 lakhs Market value of existing share =Rs.100 Net earnings =Rs.100 lakhs Compute the cost of existing equity share capital and of new equity capital assuming that new shares will be issued at a price of Rs. 92 per share and the costs of new issue will be Rs. 2 per share. Solution Cost of existing equity share capital: Ke = p E N Earnings Per Share(EPS) = 100lakhs 10lakhs = Rs.10 Ke = 10 100 × 10 = 10% Cost of Equity Capital Ke = P E N = − 10 92 2 × 100 = 11.11% Realized Yield Approach It is the easy method for calculating cost of equity capital. Under this method, cost of equity is calculated on the basis of return actually realized by the investor in a company on their equity capital. = e K PV ×D f Where, Ke = Cost of equity capital. PVƒ = Present value of discount factor. D = Dividend per share.
  • 88.
    72 Financial Management Costof Debt Cost of debt is the after tax cost of long-term funds through borrowing. Debt may be issued at par, at premium or at discount and also it may be perpetual or redeemable. Debt Issued at Par Debt issued at par means, debt is issued at the face value of the debt. It may be calculated with the help of the following formula. Kd = (1 – t) R Where, Kd = Cost of debt capital t = Tax rate R = Debenture interest rate Debt Issued at Premium or Discount If the debt is issued at premium or discount, the cost of debt is calculated with the help of the following formula. Kd = p I N (1 – t) Where, Kd = Cost of debt capital I = Annual interest payable Np = Net proceeds of debenture t = Tax rate Exercise 5 (a) A Ltd. issues Rs. 10,00,000, 8% debentures at par. The tax rate applicable to the company is 50%. Compute the cost of debt capital. (b) B Ltd. issues Rs. 1,00,000, 8% debentures at a premium of 10%. The tax rate applicable to the company is 60%. Compute the cost of debt capital. (c) A Ltd. issues Rs. 1,00,000, 8% debentures at a discount of 5%. The tax rate is 60%, compute the cost of debt capital. (d) B Ltd. issues Rs. 10,00,000, 9% debentures at a premium of 10%. The costs of floatation are 2%. The tax rate applicable is 50%. Compute the cost of debt-capital. In all cases, we have computed the after-tax cost of debt as the firm saves on account of tax by using debt as a source of finance. Solution (a) Kda = p I N (1–t)
  • 89.
    Cost of Captial73 = 8,000 1,00,000 × (1 – 0.5) = 8,000 1,00,000 × 0.5 = 4% Kda = p I N (1 – t) (b) Np = Face Value + Premium = 1,00,000+10,000=1,10,000 = 8,000 1,10,000 × (1 – 0.6) = 8,000 1,10,000 × 0.6 = 2.91% (c) Kda = p I N (1 – t) = 8,000 95,000 × (1 – t) = 3.37% (d) Kda = p I N (1 – t), Np= Rs. (10,00,000 + 1,00,000) × 2 100 = 90,000 10,78,000 ×(1 – 0.5) = 4.17% = 11,00,000 – 22,000 = Rs. 10,78,000 Cost of Perpetual Debt and Redeemable Debt It is the rate of return which the lenders expect. The debt carries a certain rate of interest. Kdb = p p I 1/ n(P N )n 1/ n(P N )/ 2 + − + Where, I = Annual interest payable P = Par value of debt Np = Net proceeds of the debenture n = Number of years to maturity Kdb = Cost of debt before tax.
  • 90.
    74 Financial Management Costof debt after tax can be calculated with the help of the following formula: d d a b K =K ×(1–t) Where, Kda = Cost of debt after tax Kdb = Cost of debt before tax t = Tax rate Exercise 6 A company issues Rs. 20,00,000, 10% redeemable debentures at a discount of 5%. The costs of floatation amount to Rs. 50,000. The debentures are redeemable after 8 years. Calculate before tax and after tax. Cost of debt assuring a tax rate of 55%. Solution Kdb = = − + p p I 1/n (P N ) 1 2(P N ) = + + + 20,00,000 1/8(20,00,000 18,50,000) 1 2(20,00,000 18,50,000) Note Np = 20,00,000 – 10,00,000 – 50,000 = + 2,00,000 18750 19,25,000 = 11.36%. After Tax Cost of Debt Kdb = Kda (1– t) =11.36 (1–0.55) =5.11%. Cost of Preference Share Capital Cost of preference share capital is the annual preference share dividend by the net proceeds from the sale of preference share. There are two types of preference shares irredeemable and redeemable. Cost of redeemable preference share capital is calculated with the help of the following formula: p p p D K N = Where, Kp = Cost of preference share Dp = Fixed preference dividend Np = Net proceeds of an equity share
  • 91.
    Cost of Captial75 Cost of irredeemable preference share is calculated with the help of the following formula: p p p p D (P N )/n K (P N )/2 + − = + Where, Kp = Cost of preference share Dp = Fixed preference share P = Par value of debt Np = Net proceeds of the preference share n = Number of maturity period. Exercise 7 XYZ Ltd. issues 20,000, 8% preference shares of Rs. 100 each. Cost of issue is Rs. 2 per share. Calculate cost of preference share capital if these shares are issued (a) at par, (b) at a premium of 10% and (c) of a debentures of 6%. Solution Cost of preference share capital Kp = p p D N (a) Kp = − 1,60,000 20,00,000 40,000 ×100 = 8.16% (b) Kp = 1,60,000 20,00,000 2,00,000 40,000 + − × 100 = 7.40% I Kp = 1,60,000 20,00,000 1,20,000 40,000 − − ×100 = 1,60,000 18,40,000 ×100 = 8.69% Exercise 8 ABC Ltd. issues 20,000, 8% preference shares of Rs. 100 each. Redeemable after 8 years at a premium of 10%. The cost of issue is Rs. 2 per share. Calculate the cost of preference share capital. p p p p D (P N )/n K (P N )/2 + − = +
  • 92.
    76 Financial Management = +− + 1,60,000 1/8 (22,00,000 19,60,000) 1/2(22,00,000 19,60,000) = + 1,60,000 30,000 20,80,000 = 9.13% where Dp = 20,000×100×8%=1,60,000 P = 20,00,000+2,00,000 =22,00,00 Np = 20,00,000 – 40,000 =19,60,000 n = 8 years Exercise 9 ABC Ltd. issues 20,000, 8% preference shares of Rs. 100 each at a premium of 5% redeemable after 8 years at par. The cost of issue is Rs. 2 per share. Calculate the cost of preference share capital. Solution p p p p D (P N )/n K (P N )/2 + − = + = 1,60,000 1/8 (20,00,000 20,60,000) 1/2 (20,00,000 20,60,000) + − + = 1,60,000–7,500 20,30,000 = 7.51% where Dp = 20,000×100×8%=1,60,000 P = 20,00,000 n = 8 years Np = 20,00,000 + 10,00,000 – 40,000 =20,60,000 Cost of Retained Earnings Retained earnings is one of the sources of finance for investment proposal; it is different from other sources like debt, equity and preference shares. Cost of retained earnings is the same as the cost of an equivalent fully subscripted issue of additional shares, which is measured by the cost of equity capital. Cost of retained earnings can be calculated with the help of the following formula: r e K =K (1 – t) (1 – b)
  • 93.
    Cost of Captial77 Where, Kr = Cost of retained earnings Ke = Cost of equity t = Tax rate b = Brokerage cost Exercise 10 A firm’s Ke (return available to shareholders) is 10%, the average tax rate of shareholders is 30% and it is expected that 2% is brokerage cost that shareholders will have to pay while investing their dividends in alternative securities. What is the cost of retained earnings? Solution Cost of Retained Earnings, Kr = Ke (1 – t) (1 – b) Where, Ke = rate of return available to shareholders t = tax rate b = brokerage cost So, Kr = 10% (1–0.5) (1–0.02) = 10%×0.5×0.98 = 4.9% Measurement of Overall Cost of Capital It is also called as weighted average cost of capital and composite cost of capital. Weighted average cost of capital is the expected average future cost of funds over the long run found by weighting the cost of each specific type of capital by its proportion in the firms capital structure. The computation of the overall cost of capital (Ko) involves the following steps. (a) Assigning weights to specific costs. (b) Multiplying the cost of each of the sources by the appropriate weights. (c) Dividing the total weighted cost by the total weights. The overall cost of capital can be calculated with the help of the following formula; Ko = Kd Wd + Kp Wp + Ke We + Kr Wr Where, Ko = Overall cost of capital Kd = Cost of debt Kp = Cost of preference share Ke = Cost of equity Kr = Cost of retained earnings Wd= Percentage of debt of total capital
  • 94.
    78 Financial Management Wp= Percentage of preference share to total capital We = Percentage of equity to total capital Wr = Percentage of retained earnings Weighted average cost of capital is calculated in the following formula also: w XW K W Σ Σ Where, Kw = Weighted average cost of capital X = Cost of specific sources of finance W = Weight, proportion of specific sources of finance. Exercise 11 A firm has the following capital structure and after-tax costs for the different sources of funds used : Source of Funds Amount Proportion After-tax cost Rs. % % Debt 12,000 20 4 Preference Shares 15,000 25 8 Equity Shares 18,000 30 12 Retained Earnings 15,000 25 11 Total 60,000 100 You are required to compute the weighted average cost of capital. Exercise 12 A company has on its books the following amounts and specific costs of each type of capital. Type of Capital Book Value Market Value Specific Costs (%) Rs. Rs. Debt 4,00,000 3,80,000 5 Preference 1,00,000 1,10,000 8 Equity 6,00,000 9,00,000 15 Retained Earnings 2,00,000 3,00,000 13 ————— ————— 13,00,000 16,90,000 ————— —————
  • 95.
    Cost of Captial79 Determine the weighted average cost of capital using: (a) Book value weights, and (b) Market value weights. How are they different? Can you think of a situation where the weighted average cost of capital would be the same using either of the weights? (MBA – P.U. Nov. 2005) Solution Computation of Weighted Average Cost of Capital A. Book Value Source of Funds Amount Cost % (X) Weighted Cost Proportion X Cost (XW) Debt 4,00,000 5 20,000 Preference Shares 1,00,000 8 8,000 Equity Shares 6,00,000 15 90,000 Retained Earnings 2,00,000 13 26,000 ΣW = 13,00,000 ΣXW = 1,44,000 Kw = Σ Σ XW W Kw = 1,44,000 13,00,000 × 100 = 11.1% Computation Weighted Average Cost of Capital B. Market Value Source of Funds Amount Cost % (X) Weighted Cost Proportion X Cost (XW) Debt 3,80,000 5 19,000 Preference Shares 1,10,000 8 8,800 Equity Shares 9,00,000 15 13,500 Retained Earnings 3,00,000 13 39,000 ΣW = 16,90,000 ΣXW = 2,01,800 Σ = Σ w XW K W Kw = 2,01,800 16,90,000 × 100 = 11.9%
  • 96.
    80 Financial Management Exercise13 ABC Ltd. has the following capital structure. Rs. Equity (expected dividend 12%) 10,00,000 10% preference 5,00,000 8% loan 15,00,000 You are required to calculate the weighted average cost of capital, assuming 50% as the rate of income-tax, before and after tax. Solution Solution showing weighted average cost of capital: Particulars Rs. After Weights Cost Equity 10,00,000 12% 33.33% 3.99 Preference 5,00,000 10% 16.67 1.67 8% Loan 15,00,000 4% 50.00 2.00 7.66% Weight average cost of capital = 7.66% MODEL QUESTIONS 1. What is cost of capital? 2. Define cost of capital. 3. Cost of capital computation based on certain assumptions. Discuss. 4. Explain the classification of cost. 5. Mention the importance of cost of capital. 6. Explain the computation of specific sources of cost of capital. 7. How over all cost of capital is calculated? 8. Explain various approaches for calculation of cost of equity. 9. Rama company issues 120000 10% debentures of Rs. 10 each at a premium of 10%. The costs of floatation are 4%. The rate of tax applicable to the company is 55%. Complete the cost of debt capital. (Ans. 4.26%) 10. Siva Ltd., issues 8000 8% debentures for Rs. 100 each at a discount of 5%. The commission payable to underwriters and brokers is Rs. 40000. The debentures are redeemable after 5 years. Compute the after tax cost of debt assuming a tax rate of 60%. (Ans. 3.69%) 11. Bharathi Ltd., issues 4000 12% preference shares of Rs. 100 each at a discount of 5%. Costs of raising capital are Rs. 8000. Compute the cost of preference capital. (Ans. 12.90%)
  • 97.
    Cost of Captial81 12. Firm pays tax at 60%. Compute the after tax cost of capital of a preferred share sold at Rs. 100 with a 8%. Dividend and a redemption price of Rs.110, if the company redeems in five years. (Ans. 9.52%) 13. Your company share is quoted in the market at Rs. 40 currently. The company pays a dividend of Rs. 5 per share and the investors market expects a growth rate of 7.5% per year: (i) Compute the company’s equity cost of capital. (ii) If the anticipated growth rate is 10% p.a. Calculate the indicated market price per share. (iii) If the company’s cost of capital is 15% and the anticipated growth rate is 10% p.a. Calculate the indicated market price if the dividend of Rs. 5 per share is to be maintained. (Ans. (i) 20%, (ii) 1/10%, (iii) 1/5%) 14. Mr. Subramanian is a shareholder in Alpha Company Ltd. Although earnings for the Alpha company have varied considerably, Subramanian has determined that long turn average dividends for the firm have been Rs. 5 per share. He expects a similar pattern to prevail in the future. Given the volatility of the Alpha’s minimum rate of 40%, should it be earned on a share, what price would Subramanian be willing to pay for the Alpha is shares? (Ans. Rs. 12.50%) 15. A Beta Ltd., iron steel reserves are being depleted and its costs of recovering a declining quantity of iron steel are rising each year. As a equal to it the company earnings and dividends are declining at a rate of 12% p.a. If the previous year’s dividend (DO) was Rs. 40 and the required rate of return is 15%. What would be the current price of the equity share of the company? (Ans. Rs. 95.14) 16. The following items have been extracted from the liabilities side of the balance sheet of Vivekananda company as on 31st December 2004. Paid up capital Rs. 2500 Equity shares of Rs. 100 each 250000 Reserve and Surplus 350000 Loans: 10% Debentures 100000 12% Institutional Loans 300000 Other information about the company as relevant is given below: Year ended Dividend Earnings Average Market Price Per share Per share Per share 31st Dec. (Rs.) (Rs.) (Rs.) 2004 7.00 11.00 80.00 2003 6.00 10.00 60.00 2002 7.00 8.00 50.00
  • 98.
    82 Financial Management Youare required to calculate the weighted average cost of capital, using book values as weights and earnings/price (E/P) ratio as the basis of cost of equity. Assume 50% tax rate. (Ans. Weighted average cost of capital=10.55%) 17. The following is an extract from the financial statements of Ramakrishna Ltd. (Rs. Lakhs) Operating Profit 90 Less: Interest on Debentures 24 66 Less: Income Tax (50%) 33 Net Profit 33 Equity share capital (share of Rs. 10) 150 Reserve and Surplus 75 10% Debentures 150 375 The market price per equity share is 11 and per debenture Rs. 95. (i) What is the earning per share? (ii) What is the percentage cost of capital to the company for the equity and debentures funds? (Ans. (i) Rs. 2.20, (ii) 20%) (iii) Cost of debenture funds Book Value = 5% Market Price = 5.26% 18. Raj Ltd. is currently earning Rs. 2,00,000 and its share is selling at a market price of Rs. 160. The firm has 20,000 shares outstanding and has no debt. The earnings of the firm are expected to remain stable, and it has a payout ratio of 100%. What is the cost of equity? If the firms earns 15% rate of return on its investment opportunities then what would be the firm’s cost of equity if the payout ratio is 60%? (Ans. (i) When the payout ratio is 100%, 12.5% (ii) When the payout ratio is 60%, 13.5%) 19. Kumar Industries Ltd. has assets of Rs. 80000 which have been financed with Rs. 26,000 of debt and Rs. 45,000 of equity and a general reserve of Rs. 9,000 The firm’s total profit after interest and taxes for the year ended 31st March 2,000 were Rs. 6,750. It pays 10% interest on borrowed funds and is in the 60% tax bracket. It has 450 equity shares of Rs. 100 each selling at a market price of Rs. 120 per share. What is the weighted average cost of capital? (i) EPS Rs. 15 (ii) Cost of equity 12.5% (iii) Average cost of capital 9.74.
  • 99.
    INTRODUCTION Financial decision isone of the integral and important parts of financial management in any kind of business concern. A sound financial decision must consider the board coverage of the financial mix (Capital Structure), total amount of capital (capitalization) and cost of capital (Ko ). Capital structure is one of the significant things for the management, since it influences the debt equity mix of the business concern, which affects the shareholder’s return and risk. Hence, deciding the debt-equity mix plays a major role in the part of the value of the company and market value of the shares. The debt equity mix of the company can be examined with the help of leverage. The concept of leverage is discussed in this part. Types and effects of leverage is discussed in the part of EBIT and EPS. Meaning of Leverage The term leverage refers to an increased means of accomplishing some purpose. Leverage is used to lifting heavy objects, which may not be otherwise possible. In the financial point of view, leverage refers to furnish the ability to use fixed cost assets or funds to increase the return to its shareholders. Definition of Leverage James Horne has defined leverage as, “the employment of an asset or fund for which the firm pays a fixed cost or fixed return. Types of Leverage Leverage can be classified into three major headings according to the nature of the finance mix of the company.
  • 100.
    84 Financial Management Leverage Finacial Leverage Operating Leverage Composite Leverage Fig.7.1 Types of Leverage The company may use finance or leverage or operating leverage, to increase the EBIT and EPS. OPERATING LEVERAGE The leverage associated with investment activities is called as operating leverage. It is caused due to fixed operating expenses in the company. Operating leverage may be defined as the company’s ability to use fixed operating costs to magnify the effects of changes in sales on its earnings before interest and taxes. Operating leverage consists of two important costs viz., fixed cost and variable cost. When the company is said to have a high degree of operating leverage if it employs a great amount of fixed cost and smaller amount of variable cost. Thus, the degree of operating leverage depends upon the amount of various cost structure. Operating leverage can be determined with the help of a break even analysis. Operating leverage can be calculated with the help of the following formula: OL = C OP Where, OL = Operating Leverage C = Contribution OP = Operating Profits Degree of Operating Leverage The degree of operating leverage may be defined as percentage change in the profits resulting from a percentage change in the sales. It can be calculated with the help of the following formula: DOL = Percentagechangeinprofits Percentagechangeinsales
  • 101.
    Leverage 85 Exercise 1 Fromthe following selected operating data, determine the degree of operating leverage. Which company has the greater amount of business risk? Why? Company A Company B Rs. Rs. Sales 25,00,000 30,00,000 Fixed costs 7,50,000 15,00,000 Variable expenses as a percentage of sales are 50% for company A and 25% for company B. Solution Statement of Profit Company A Company B Rs. Rs. Sales 25,00,000 30,00,000 Variable cost 12,50,000 7,50,000 Contribution 12,50,000 22,50,000 Fixed cost 7,50,000 15,00,000 Operating Profit 5,00,000 7,50,000 Operating Leverage = Contribution Operating Profit “A” Company Leverage = 12,50,000 5,00,000 = 2.5 “B” Company Leverage = 2,25,000 7,50,000 = 3 Comments Operating leverage for B Company is higher than that of A Company; B Company has a higher degree of operating risk. The tendency of operating profit may vary portionately with sales, is higher for B Company as compared to A Company. Uses of Operating Leverage Operating leverage is one of the techniques to measure the impact of changes in sales which lead for change in the profits of the company. If any change in the sales, it will lead to corresponding changes in profit. Operating leverage helps to identify the position of fixed cost and variable cost.
  • 102.
    86 Financial Management Operatingleverage measures the relationship between the sales and revenue of the company during a particular period. Operating leverage helps to understand the level of fixed cost which is invested in the operating expenses of business activities. Operating leverage describes the over all position of the fixed operating cost. FINANCIAL LEVERAGE Leverage activities with financing activities is called financial leverage. Financial leverage represents the relationship between the company’s earnings before interest and taxes (EBIT) or operating profit and the earning available to equity shareholders. Financial leverage is defined as “the ability of a firm to use fixed financial charges to magnify the effects of changes in EBIT on the earnings per share”. It involves the use of funds obtained at a fixed cost in the hope of increasing the return to the shareholders. “The use of long-term fixed interest bearing debt and preference share capital along with share capital is called financial leverage or trading on equity”. Financial leverage may be favourable or unfavourable depends upon the use of fixed cost funds. Favourable financial leverage occurs when the company earns more on the assets purchased with the funds, then the fixed cost of their use. Hence, it is also called as positive financial leverage. Unfavourable financial leverage occurs when the company does not earn as much as the funds cost. Hence, it is also called as negative financial leverage. Financial leverage can be calculated with the help of the following formula: FL = OP PBT Where, FL = Financial leverage OP = Operating profit (EBIT) PBT = Profit before tax. Degree of Financial Leverage Degree of financial leverage may be defined as the percentage change in taxable profit as a result of percentage change in earning before interest and tax (EBIT). This can be calculated by the following formula Percentage change in taxable Income DFL= Precentage change in EBIT
  • 103.
    Leverage 87 Alternative Definitionof Financial Leverage According to Gitmar, “financial leverage is the ability of a firm to use fixed financial changes to magnify the effects of change in EBIT and EPS”. FL = EBIT EPS Where, FL = Financial Leverage EBIT = Earning Before Interest and Tax EPS = Earning Per share. Exercise 2 A Company has the following capital structure. Rs. Equity share capital 1,00,000 10% Prof. share capital 1,00,000 8% Debentures 1,25,000 The present EBIT is Rs. 50,000. Calculate the financial leverage assuring that the company is in 50% tax bracket. Solution Statement of Profit Rs. Earning Before Interest and Tax (EBIT) 50,000 (or) Operating Profit . Interest on Debenture 1,25,000 × 8 × 100 Earning before Tax (EBT) 10,000 40,000 Income Tax 20,000 20,000 Financial leverage = Operating Profit(OP) Profit BeforeTax(PBT) = 50,000 40,000 =1.25 Uses of Financial Leverage Financial leverage helps to examine the relationship between EBIT and EPS. Profit
  • 104.
    88 Financial Management Financialleverage measures the percentage of change in taxable income to the percentage change in EBIT. Financial leverage locates the correct profitable financial decision regarding capital structure of the company. Financial leverage is one of the important devices which is used to measure the fixed cost proportion with the total capital of the company. If the firm acquires fixed cost funds at a higher cost, then the earnings from those assets, the earning per share and return on equity capital will decrease. The impact of financial leverage can be understood with the help of the following exercise. Exercise 3 XYZ Ltd. decides to use two financial plans and they need Rs. 50,000 for total investment. Particulars Plan A Plan B Debenture (interest at 10%) 40,000 10,000 Equity share (Rs. 10 each) 10,000 40,000 Total investment needed 50,000 50,000 Number of equity shares 4,000 1,000 The earnings before interest and tax are assumed at Rs. 5,000, and 12,500. The tax rate is 50%. Calculate the EPS. Solution When EBIT is Rs. 5,000 Particulars Plan A Plan B Earnings before interest and tax (EBIT) 5,000 5,000 Less : Interest on debt (10%) 4,000 1,000 Earnings before tax (EBT) 1,000 4,000 Less : Tax at 50% 500 2,000 Earnings available to equity shareholders. Rs.500 Rs.2,000 No. of equity shares 1,000 4,000 Earnings per share (EPS) Rs. 0.50 Rs. 0.50 Earnings/No. of equity shares When EBIT is Rs. 12,500 Particulars Plan A Plan B Earnings before interest and tax (EBIT). 12,500 12,500 Less: Interest on debt (10%) 4,000 1,000 (Contd....)
  • 105.
    Leverage 89 Earning beforetax (EBT) 8,500 11,500 Less : Tax at 50% 4,250 5,750 Earnings available to equity shareholders 4,250 5,750 No. of equity shares 1,000 4,000 Earning per share 4.25 1.44 DISTINGUISH BETWEEN OPERATING LEVERAGE AND FINANCIAL LEVERAGE Operating Leverage/Financial Leverage Operating Leverage Financial Leverage 1. Operating leverage is associated with 1. Financial leverage is associated with financing investment activities of the company. activities of the company. 2. Operating leverage consists of fixed 2. Financial leverage consists of operating profit operating expenses of the company. of the company. 3. It represents the ability to use fixed 3. It represents the relationship between EBIT operating cost. and EPS. 4. Operating leverage can be calculated by 4. Financial leverage can be calculated by OL = C OP . FL = OP PBT . 5. A percentage change in the profits resulting 5. A percentage change in taxable profit is the from a percentage change in the sales is result of percentage change in EBIT. called as degree of operating leverage. 6. Trading on equity is not possible while the 6. Trading on equity is possible only when the company is operating leverage. company uses financial leverage. 7. Operating leverage depends upon fixed 7. Financial leverage depends upon the cost and variable cost. operating profits. 8. Tax rate and interest rate will not affect the 8. Financial leverage will change due to tax rate operating leverage. and interest rate. EBIT - EPS Break even chart for three different financing alternatives EPS DR = 70% X1 X2 X3 EBIT C1 C2 C3 DR = 0% DR = 30% Fig. 7.2 EBIT - EPS Break Even Chart
  • 106.
    90 Financial Management Where, DR=Debt Ratio C1 , C2 , C3 = Indifference Point X1 , X2 , X3 = Financial BEP Financial BEP It is the level of EBIT which covers all fixed financing costs of the company. It is the level of EBIT at which EPS is zero. Indifference Point It is the point at which different sets of debt ratios (percentage of debt to total capital employed in the company) gives the same EPS. COMBINED LEVERAGE When the company uses both financial and operating leverage to magnification of any change in sales into a larger relative changes in earning per share. Combined leverage is also called as composite leverage or total leverage. Combined leverage express the relationship between the revenue in the account of sales and the taxable income. Combined leverage can be calculated with the help of the following formulas: CL = OL × FL CL = C OP × OP PBT = C PBT Where, CL = Combined Leverage OL = Operating Leverage FL = Financial Leverage C = Contribution OP = Operating Profit (EBIT) PBT = Profit Before Tax Degree of Combined Leverage The percentage change in a firm’s earning per share (EPS) results from one percent change in sales. This is also equal to the firm’s degree of operating leverage (DOL) times its degree of financial leverage (DFL) at a particular level of sales. Degree of contributed coverage = Percentage change in EPS Percentage change in sales
  • 107.
    Leverage 91 Exercise 4 Kumarcompany has sales of Rs. 25,00,000. Variable cost of Rs. 12,50,000 and fixed cost of Rs. 50,000 and debt of Rs. 12,50,000 at 8% rate of interest. Calculate combined leverage. Solution Statement of Profit Sales 25,00,000 Less: Variable cost 15,00,000 Contribution 10,00,000 Less: Fixed cost 5,00,000 Operating Profit 5,00,000 Combined leverage =Operating leverage×Financial leverage Calculation of financial leverage Contribution 10,00,000 2 Operating Profit 5,00,000 = = Calculation of financial leverage Earning before Interest and Tax (EBIT) 5,00,000 Less: Interest on Debenture ( 8% of 12,50,000) 1,00,000 Earnings before Tax 4,00,000 Operating leverage = = Operating Profit 5,00,000 Earning Before Tax 4,00,000 =1.25 Combined leverage = 2 × 1.25 = 2.5 Exercise 5 Calculate the operating, financial and combined leverage under situations 1 and 2 and the financial plans for X and Y respectively from the following information relating to the operating and capital structure of a company, and also find out which gives the highest and the least value ? Installed capacity is 5000 units. Annual Production and sales at 60% of installed capacity. Selling price per unit Rs. 25 Variable cost per unit Rs. 15 Fixed cost: Situation 1 : Rs. 10,000 Situation 2 : Rs. 12,000
  • 108.
    92 Financial Management Capitalstructure: Financial Plan X (Rs.) Y (Rs.) Equity 25,000 50,000 Debt (cost 10%) 50,000 25,000 75,000 75,000 Solution Annual production and sales 60% of 5,000 = 3000 Unit Contribution per Unit Rs. Selling Price 25 Per Unit Variable Price 15 Per Unit 10 Per Unit Total contribution is 3000 Units×Rs. 10=Rs. 30,000 Computation of leverage. Financial plan PLAN-X PLAN-Y Situation 1 Situation 2 Situation 1 Situation 2 Contribution 30000 30000 30000 30000 Fixed cost operating profit (or) EBIT 10000 12000 10000 12000 20000 18000 20000 18000 Interest on Debts 10% of 50,000 5000 5000 2500 2500 10% of 25,000 Earnings before Tax 15000 13000 17500 15500 (i) Operating Leverage Contribution 30000 30000 30000 30000 20000 18000 20000 18000 = 1.5 1.67 1.5 1.67 (ii) Financial Leverage Operating Profit (op) 20000 18000 20000 18000 Profit Before Tax (PBI) 15000 13000 17500 15500 (iii) Combined leverage OL × FL = 1.5 × 1.33 1.67 × 1.38 1.5 × 1.14 1.67 × 1.16 1.995 2.30 1.71 1.94 Highest and least value of combined leverage. Highest Value = 2.30 under situation 2 plan X. Least Value = 1.71 under situation 1 plan Y.
  • 109.
    Leverage 93 Exercise 6 Calculateoperating, financial and combined leverages under situations when fixed costs are: (i) Rs. 5,000 and (ii) Rs. 10,000 and financial plans 1 and 2 respectively from the following information pertaining to the operating and capital structure of a textile company : Rs. Total Assets 30,000 Total Assets turnover 2 Variable cost as percentage of sales 60 Capital structure Financial Plan 1 2 Rs. Rs. Equity 30,000 10,000 10% debentures 10,000 30,000 Solution Computation of Leverage Financial Plan Plan 1 2 Situation i ii i ii Sales 60,000 60,000 60,000 60,000 Less : Variable cost 36,000 36,000 36,000 36,000 Contribution 24,000 24,000 24,000 24,000 Less : Fixed cost 5,000 10,000 5,000 10,000 Operating profit (EBIT) 19,000 14,000 19,000 14,000 Less : Interest 1,000 1,000 3,000 3,000 Profit before tax (PBT) 18,000 13,000 16,000 11,000 Operating leverage 24,000 24,000 24,000 24,000 Contribution 19,000 14,000 19,000 14,000 EBIT 1.26 1.71 1.26 1.71 Financial leverage 19,000 14,000 19,000 14,000 EBIT 18,000 13,000 16,000 11,000 PBT 1.05 1.07 1.18 1.27 Combined leverage 1.32 1.83 1.49 2.17 WORKING CAPITAL LEVERAGE One of the new models of leverage is working capital leverage which is used to locate the investment in working capital or current assets in the company. Working capital leverage measures the sensitivity of return in investment of charges in the level of current assets.
  • 110.
    94 Financial Management WCL= Percentage Change in ROI Percentage Change is WC If the earnings are not affected by the changes in current assets, the working capital leverage can be calculated with the help of the following formula. WCL = CA TA DCA ± Where, CA = Current Assets TA = Total Assets DCA = Changes in the level of Current Assets Exercise 7 The following information is available for two companies. X Ltd. Y Ltd. Fixed Assets Rs. 4,00,000 1,00,000 Current Assets Rs. 10,00,000 4,00,000 Total Assets Rs. 14,00,000 14,00,000 Earning before interest and taxes Rs. 1,50,000 1,50,000 You are required to compare the sensitivity earnings of the two companies for 30% charge in the level of their current assets. Solution Working capital leverage = Current Assets Total Assets DCA ± X Ltd. = 1,00,000 14,00,000 – 3,00,000 = 10,00,000 11,00,000 = 0 .90 Y Ltd. = 4,00,000 14,00,000 – 1,20,000 = 4,00,000 12,80,000 = 0.3125
  • 111.
    Leverage 95 Looking atthe working capital leverage of the two companies, we can say that the sensitivity of earnings for charge on the level of current assets of X Ltd. is a greater than of Y Ltd. Exercise 8 Calculate operating leverage and financial leverage under situations A, B and C and financial plans 1, 2 and 3 respectively from the following information relating to the operating and financial leverage which give the highest value and the least value. Installed capacity (units) 1,200 Actual production and sales (units) 800 Selling price per unit (Rs.) 15 Variable cost per unit (Rs.) 10 Fixed costs (Rs.) Situation A 1,000 Situation B 2,000 Situation C 3,000 Capital Structure Financial Plan 1 2 3 Equity Rs. 5,000 Rs. 7,500 Rs. 2,500 Debt Rs. 5,000 Rs. 2,500 Rs. 7,500 Cost of debt 12 per cent (for all plans) (MBA – P.U. Nov. 2005) Solution A B C S – VC 4,000 4,000 4,000 EBIT 3,000 2,000 1,000 DOL = − S VC EBIT 1.33 2 4 1 2 3 Situation A EBIT 3,000 3,000 3,000 Less : Interest 600 300 900 EBT 2,400 2,700 2,100 Financial Leverage 1.25 1.11 1.43 Situation B EBIT 2,000 2,000 2,000 Less : Interest 600 300 900
  • 112.
    96 Financial Management EBT1,400 1,700 1,100 Financial Leverage 1.43 1.18 1.82 Situation C EBIT 1,000 1,000 1,000 Less : Interest 600 300 900 EBT–I 400 700 100 Financial Leverage 2.5 1.43 10 Exercise 9 ‘ XYZ’ company has a choice of the following three financial plans. You are required to calculate the financial leverage in each case. Plan I Plan II Plan III Equity capital Rs. 2,000 Rs. 1,000 Rs. 3,000 Debt Rs. 2,000 Rs. 3,000 Rs. 1,000 EBIT Rs. 400 Rs. 400 Rs. 400 Interest @10% per annum on debts in all cases. Solution Plan I Plan II Plan III Rs. Rs. Rs. EBIT 400 400 400 Less Interest-(I) 200 300 100 EBIT–I 200 100 300 FL 2 4 1.33 MODEL QUESTIONS 1. Write a note on trading on equity. 2. What is meant by working capital leverage? 3. What is leverage? Mention different types of leverage? 4. Explain the operating leverage. 5. Discuss the concept of financial leverage. 6. How compared leverage is calculated? 7. Explain the working capital leverage.
  • 113.
    Leverage 97 8. Whatis point of indifference? 9. Distinguish the operating leverage from financial leverage. 10. Explain the uses of operating leverage. 11. From the following information find out operating, financial and combined leverages. Sales 1,00,000 Variable Cost 60,000 Fixed Cost 20,000 Interest 10,000 (Ans. OL 2, FL 1.33, LL 2.67) 12. Arvind Ltd. is having the following informations. Calculate financial leverage opening leverage and combined leverage. Sales 50,000 units Rs. 10 each UC Rs. 6 Per Unit FC Rs. 1,00,000 Interest 8 of 5,00,000 (Ans. FL 1.66, OL 2, CL 3.33) 13. X Ltd. is having the following capital structure. Calculate financial leverage, operating leverage and combined leverage having two situations A and B and financial plans I and II respectively. Capacity 1,500 units Production 1,200 units Selling Price Rs. 25 Variable Cost Rs. 18 Fixed Cost Situation I Rs. 1,400 Situation II Rs. 2,400 Capital structure Financial Plan A B Equity 80,000 60,000 Debt 20,000 40,000 (Ans. OL 1.2, 1.4, 1.2, 1.4 FL 1.16, 1.2, 1.4, 1.5 CL 1.39, 1.68, 1.68, 2.1)
  • 114.
    98 Financial Management 14.The following details are available for the two companies. X Ltd. Y Ltd. Fixed Assets 4,00,000 6,00,000 Current Assets 6,00,000 4,00,000 Total Asset 10,00,000 10,00,000 Earnings Before Interest and Taxes 1,50,000 1,50,000 You are required to compare the sensibility of the two companies for a 30% changes in the level of current assets with the help of using capital leverages. (Ans. X .73, Y 4.5)
  • 115.
    INTRODUCTION The financial managermust take careful decisions on how the profit should be distributed among shareholders. It is very important and crucial part of the business concern, because these decisions are directly related with the value of the business concern and shareholder’s wealth. Like financing decision and investment decision, dividend decision is also a major part of the financial manager. When the business concerns decide dividend policy, they have to consider certain factors such as retained earnings and the nature of shareholder of the business concern. Meaning of Dividend Dividend refers to the business concerns net profits distributed among the shareholders. It may also be termed as the part of the profit of a business concern, which is distributed among its shareholders. According to the Institute of Chartered Accountant of India, dividend is defined as “a distribution to shareholders out of profits or reserves available for this purpose”. TYPES OF DIVIDEND/FORM OF DIVIDEND Dividend may be distributed among the shareholders in the form of cash or stock. Hence, Dividends are classified into: A. Cash dividend B. Stock dividend C. Bond dividend D. Property dividend
  • 116.
    100 Financial Management Dividend CashDividend Bond Dividend Stock Dividend Property Dividend Fig. 8.1 Types of Dividend Cash Dividend If the dividend is paid in the form of cash to the shareholders, it is called cash dividend. It is paid periodically out the business concerns EAIT (Earnings after interest and tax). Cash dividends are common and popular types followed by majority of the business concerns. Stock Dividend Stock dividend is paid in the form of the company stock due to raising of more finance. Under this type, cash is retained by the business concern. Stock dividend may be bonus issue. This issue is given only to the existing shareholders of the business concern. Bond Dividend Bond dividend is also known as script dividend. If the company does not have sufficient funds to pay cash dividend, the company promises to pay the shareholder at a future specific date with the help of issue of bond or notes. Property Dividend Property dividends are paid in the form of some assets other than cash. It will distributed under the exceptional circumstance. This type of dividend is not published in India. DIVIDEND DECISION Dividend decision of the business concern is one of the crucial parts of the financial manager, because it determines the amount of profit to be distributed among shareholders and amount of profit to be treated as retained earnings for financing its long term growth. Hence, dividend decision plays very important part in the financial management. Dividend decision consists of two important concepts which are based on the relationship between dividend decision and value of the firm.
  • 117.
    Dividend Decision 101 DividendTheories Irrelevance of Dividend Relevance of Dividend Solomon Approach Gordon’s Model MM Approach Walter’s Model Fig. 8.2 Dividend Theories Irrelevance of Dividend According to professors Soloman, Modigliani and Miller, dividend policy has no effect on the share price of the company. There is no relation between the dividend rate and value of the firm. Dividend decision is irrelevant of the value of the firm. Modigliani and Miller contributed a major approach to prove the irrelevance dividend concept. Modigliani and Miller’s Approach According to MM, under a perfect market condition, the dividend policy of the company is irrelevant and it does not affect the value of the firm. “Under conditions of perfect market, rational investors, absence of tax discrimination between dividend income and capital appreciation, given the firm’s investment policy, its dividend policy may have no influence on the market price of shares”. Assumptions MM approach is based on the following important assumptions: 1. Perfect capital market. 2. Investors are rational. 3. There are no tax. 4. The firm has fixed investment policy. 5. No risk or uncertainty. Proof for MM approach MM approach can be proved with the help of the following formula: 1 1 o e D + P P (1 + K ) = Where, Po = Prevailing market price of a share. Ke = Cost of equity capital. D1 = Dividend to be received at the end of period one. P1 = Market price of the share at the end of period one.
  • 118.
    102 Financial Management P1can be calculated with the help of the following formula. P1 = Po (1+Ke) – D1 The number of new shares to be issued can be determined by the following formula: M × P1 = I – (X – nD1) Where, M = Number of new share to be issued. P1 = Price at which new issue is to be made. I = Amount of investment required. X = Total net profit of the firm during the period. nD1= Total dividend paid during the period. Exercise 1 X Company Ltd., has 100000 shares outstanding the current market price of the shares Rs. 15 each. The company expects the net profit of Rs. 2,00,000 during the year and it belongs to a rich class for which the appropriate capitalisation rate has been estimated to be 20%. The company is considering dividend of Rs. 2.50 per share for the current year. What will be the price of the share at the end of the year (i) if the dividend is paid and (ii) if the dividend is not paid. Solution 1 1 o e D + P P (1 + K ) = (i) If the dividend is paid Po = Rs.15 Ke = 20% D1 = 2.50 P1 = ? 15 = 1 2.50 + P 1 + 20% 15 = 1 2.50 + P 1.2 2.50 + P1 = 15 × 1.2 P1 = 18 – 2.50 P1 = Rs. 15.50 (ii) If the dividend is not paid Po = 15 Ke = 20% D1 = 0
  • 119.
    Dividend Decision 103 P1= ? 1 0 P 15 1 20% + = + 1 0 P 15 1.20 + = 0 + P1 = 15×1.20 P1 = Rs. 18. Exercise 2 Ram company belongs to a risk class for which the appropriate capitalization rate is 12%. It currently has outstanding 30000 shares selling at Rs. 100 each. The firm is contemplating the declaration of dividend of Rs. 6 per share at the end of the current financial year. The company expects to have a net income of Rs. 3,00,000 and a proposal for making new investments of Rs. 6,00,000. Show that under the MM assumptions, the payment of dividend does not affect the value of the firm. How many new shares issued and what is the market value at the end of the year? Solution Po = 1 1 e D + P 1+ K Po = 100 D1 = Rs. 6 P1 = ? Ke = 12% 100 = 1 6 P 1 127 + + 100 = 6 P 1.12 + 6 + P1 = 112 P1 = 112 – 6 P1 = Rs. 106 Dividend is not declared Ke = 12%, Po = 100, D1 = 0, P1 = ? 100 = 1 0 + P 1 + 12% 100 = 1 0 + P 1.12 P1 = Rs. 112
  • 120.
    104 Financial Management Calculationof number of new shares to be issued Dividends Paid Dividends not Paid Net Income 300000 300000 Total Dividends 180000 – Retained Earnings 120000 300000 Investment Budget 600000 600000 Amount to be raised as new shares 480000 300000 (Investment – Retained Earnings) Relevant – Market Price per share Rs. 106 Rs. 112 No. of new shares to be issued 4528.3 2678.6 Total number of shares at the end of the year 300000 30000 Existing shares 4528.3 2678.6 (+) new shares issued 34528.3 32678.6 Market price per share Rs. 106 112 Market value for shares Rs. 3660000 3660000 There is no change in the total market value of shares whether dividends are distributed or not distributed. Exercise 3 ABC Ltd. has a capital of Rs. 10,00,000 in equity shares of Rs. 100 each. The shares are currently quoted at par. The company proposes to declare a dividend of Rs. 10 per share at the end of the current financial year. The capitalization rate for the risk class to which the company belongs is 12%. What will be the MP of the share at the end of the year, if (i) A dividend is not declared. (ii) A dividend is declared. (iii) Assuming that the company pays the dividend and has net profits of Rs. 5,00,000 and makes new investments of Rs. 10,00,000 during the period, how many new shares must be issued? Use the MM Model. (C.A Final Nov. 1990) Solution As per MM Model, the current MP of the share is Po = 1 1 e D + P 1 + K (i) If the dividend is not declared 100 = 1 0 + P (1 + .12)
  • 121.
    Dividend Decision 105 100= 1 P 1.12 P1 = Rs. 112 (ii) If the dividend is declared 100 = 1 10 + P 1 + 0.12 100 = 1 10 + P 1.12 112 = 10 + P1 P1 = 112 – 10 P1 = Rs. 102 (iii) In case the firm which pays dividend of Rs. 10 per share, then the number of new shares to be issued is M. M×P1 = I – (X – nD1) M×102 = 10,00,000 – (5,00,000 – 10,000×10) 102 m = 10,00,000 – 4,00,000 M = 6,00,000 102 = 5882.35 (or) 5883 The firm should issue 5883 new shares @ Rs. 102 per share to finance its investment proposals. Exercise 4 Z Ltd., has risk allying firm for which capitalization rate is 12%. It currently has outstanding 8,000 shares selling at Rs. 100 each. The dividend for the current financial year is Rs. 7 per share. The company expects to have a net income of Rs. 69,000 and has a proposal formatting new investments of Rs. 1,60,000. Show that under the MM hypothesis the payment of dividend does not affect the value of the firm. (a) Value of the firm when dividends are paid. Price of the shares at the end of the current financial year. P1 = Po (1+Ke) – D1 = 100 (1 + .12) – 7 = 100×1.12 – 7 P1 = Rs. 105
  • 122.
    106 Financial Management (b)Number of shares to be issued. S = 1 I – (TE – nD) P = 1,60,000 – (69000–(8000×7)) 105 = 1,60,000 – (13000) 105 1,47,000 105 = 1400 shares The MM hypothesis explained in another firm also assumes that investment required by the firm on account of payment of dividends is finance out of the new issue of equity shares. S = 1 I – (TE – nD) M S = Value of the firm can be calculated as follows. nPo = 1 e (N + S) M – (1 – TE) 1 + K nPo = Value of the firm TE = Total Earnings M1 = Market Price at the end of the period Ke = Cost of capital D = Dividend paid at the end of the year (or) period N = Number of shares outstanding at the beginning of the period. nPo = 1 e (N + S) M – (1 – TE) 1 + K = 8000 + 1400 × 105 – (1,60,000 – 69,000) 1+12% = 9400 × 105 – 91000 1.12 = 8,00,000 Criticism of MM approach MM approach consists of certain criticisms also. The following are the major criticisms of MM approach.
  • 123.
    Dividend Decision 107 MMapproach assumes that tax does not exist. It is not applicable in the practical life of the firm. MM approach assumes that, there is no risk and uncertain of the investment. It is also not applicable in present day business life. MM approach does not consider floatation cost and transaction cost. It leads to affect the value of the firm. MM approach considers only single decrement rate, it does not exist in real practice. MM approach assumes that, investor behaves rationally. But we cannot give assurance that all the investors will behave rationally. RELEVANCE OF DIVIDEND According to this concept, dividend policy is considered to affect the value of the firm. Dividend relevance implies that shareholders prefer current dividend and there is no direct relationship between dividend policy and value of the firm. Relevance of dividend concept is supported by two eminent persons like Walter and Gordon. Walter’s Model Prof. James E. Walter argues that the dividend policy almost always affects the value of the firm. Walter model is based in the relationship between the following important factors: • Rate of return I • Cost of capital (k) According to the Walter’s model, if r > k, the firm is able to earn more than what the shareholders could by reinvesting, if the earnings are paid to them. The implication of r > k is that the shareholders can earn a higher return by investing elsewhere. If the firm has r = k, it is a matter of indifferent whether earnings are retained or distributed. Assumptions Walters model is based on the following important assumptions: 1. The firm uses only internal finance. 2. The firm does not use debt or equity finance. 3. The firm has constant return and cost of capital. 4. The firm has 100 recent payout. 5. The firm has constant EPS and dividend. 6. The firm has a very long life. Walter has evolved a mathematical formula for determining the value of market share. e e r D+ (E D) K P K − =
  • 124.
    108 Financial Management Where, P= Market price of an equity share D = Dividend per share r = Internal rate of return E = Earning per share Ke = Cost of equity capital Exercise 5 From the following information supplied to you, ascertain whether the firm is following an optional dividend policy as per Walter’s Model? Total Earnings Rs. 2,00,000 No. of equity shares (of Rs. 100 each 20,000) Dividend paid Rs. 1,00,000 P/E Ratio 10 Return Investment 15% The firm is expected to maintain its rate on return on fresh investments. Also find out what should be the E/P ratio at which the dividend policy will have no effect on the value of the share? Will your decision change if the P/E ratio is 7.25 and interest of 10%? Solution EPS = Earnings No. of Shares = 200000 20000 = Rs. 10 P/E Ratio = 10 Ke = 1 P/E Ratio 1 10 = 0.10 DPS = Total Dividends paid No. of Shares = 100000 20000 = Rs. 5 The value of the share as per Walter’s Model is P = e D+r/ke(E – D) K = 5+.15/.10 (10 – 5) 0.10
  • 125.
    Dividend Decision 109 = 5+ 7.5 0.10 = Rs. 12.5 Dividend Payout = DPS EPS ×100 = 5 10 ×100 = 60% r >Ke therefore by distributing 60% of earnings, the firm is not following an optional dividend policy. In this case, the optional dividend policy for the firm would be to pay zero dividend and the Market Price would be: P = 5+.15/.10 (10–0) .10 = 5 + 15 .10 = 20 .10 P = Rs. 200 So, the MP of the share can be increased by following a zero payout, of the P/E is 7.25 instead of 10 then the Ke =1=0.138 and in this case Ke>r and the MP of the share is 7.25. P = .15 5 + (10–5) .138 .138 .138 = 5 + 5.435 P=Rs. 75.62 Exercise 6 The earnings per share of a company are Rs. 80 and the rate of capitalization applicable to the company is 12%. The company has before it an option of adopting a payment ratio of 25 % (or) 50%(or) 75%. Using Walter’s formula of dividend payout, compute the market value of the company’s share of the productivity of retained earnings (i) 12% (ii) 8% (iii) 5%. Solution E = 10 and Ke=12%=0.12
  • 126.
    110 Financial Management Asper Walter’s Model, the market price of a share is P = e e r D+ (E – D) K K (A) If payout ratio is 25% (i) r=12%=0.12, D=25%of 10=Rs. 2.50 P = .12 2.5+ (10 – 2.50) .12 .12 = 2.50 + 7.50 0.12 = 10 0.12 = Rs. 83.33 R = 8% = 0.08 R = 8% = 0.08, D = 25% of 10 = Rs. 2.50 0.08 2.50 (10 2.50) 0.12 0.12 + − = = 2.50 + 5 0.12 = 7.50 0.12 = Rs. 62.5 Exercise 7 From the following data, calculate the MP of a share of ABC Ltd., under (i) Walter’s formula; and (ii) Dividend growth model. EPS = Rs. 10 DPS = Rs. 6 Ke = 18% r = 25% retention ratio (b) = 45% Solution: (i) Walter’s Model P = e D + r (EPS – DPS) K 6+.25 (10-6) .18 =
  • 127.
    Dividend Decision 111 = 6+ 5.56 .18 = 11.56 .18 = Rs. 64.22 (ii) Dividend Growth Model P = e E(1–b) K –br = 10( 1–.45) .18 – (.45×.25) = 10×.55 .18 – 0.1125 = 5.5 0.0675 = Rs. 81.48 Criticism of Walter’s Model The following are some of the important criticisms against Walter model: Walter model assumes that there is no extracted finance used by the firm. It is not practically applicable. There is no possibility of constant return. Return may increase or decrease, depending upon the business situation. Hence, it is applicable. According to Walter model, it is based on constant cost of capital. But it is not applicable in the real life of the business. Gordon’s Model Myron Gorden suggest one of the popular model which assume that dividend policy of a firm affects its value, and it is based on the following important assumptions: 1. The firm is an all equity firm. 2. The firm has no external finance. 3. Cost of capital and return are constant. 4. The firm has perpectual life. 5. There are no taxes. 6. Constant relation ratio (g=br). 7. Cost of capital is greater than growth rate (Ke >br).
  • 128.
    112 Financial Management Gordon’smodel can be proved with the help of the following formula: P = e E(1 – b) K – br Where, P = Price of a share E = Earnings per share 1 – b = D/p ratio (i.e., percentage of earnings distributed as dividends) Ke = Capitalization rate br = Growth rate = rate of return on investment of an all equity firm. Exercise 8 Raja company earns a rate of 12% on its total investment of Rs. 6,00,000 in assets. It has 6,00,000 outstanding common shares at Rs. 10 per share. Discount rate of the firm is 10% and it has a policy of retaining 40% of the earnings. Determine the price of its share using Gordon’s Model. What shall happen to the price of the share if the company has payout of 60% (or) 20%? Solution According to Gordon’s Model, the price of a share is P= e E (1 – b) K – br Given: E = 12% of Rs. 10=Rs. 1.20 r = 12%=0.12 K = 10%=0.10 t = 10%=0.10 b = 40%=0.40 Put the values in formula P = 1.20 (1–.40) 10–(.40×.12) = 1.20×(0.60) .10–0.048 = 0.72 0.052 = Rs. 13.85
  • 129.
    Dividend Decision 113 Ifthe firm follows a policy of 60% payout then b=20% =0.20 The price is P = 1.20 (1×0.20) .10 – (.2×.12) = 0.05 r=4% =0.04, D =25% of 10=2.50 0.04 (10 – 2.50) 0.12 =2.50+ 0.12 = 5 0.12 = Rs. 41.67 If payout ratio is 50%, D=50% of 10=Rs. 5 r=12%=0.12, D=50% of 10 = Rs. 5 = 0.12 (10 – 5) 0.12 5+ 0.12 = 5+5 0.12 = 10 0.12 = Rs. 83.33 r = 8% = 0.08, D = 50% of 10 = 5 = 0.8 5 (10– 5) 0.12 0.12 + = 5+3.33 0.12 = 8.33 0.12 = Rs. 69.42 r = 4% = 0.04, D = 50% of 10 = 5 = 0.04 5+ (10 – 5) 0.12 = 5+1.67 0.12 = 6.67 0.12 = Rs. 55.58
  • 130.
    114 Financial Management C.If payout ratio is 75% D = 75% of 10 = 7.50 (i) r = 12% = 0.12, D = 75% of 10 = 7.50 P = 7.50+0.08 (10 7.50) 0.12 0.12 − = 7.50 2.50 Rs. 83.33 0.12 + = (ii) r = 8% = 0.8, D = 75% of 10 = 7.50 P = 7.50+0.08 (10 7.50) 0.12 0.12 − = 7.50 1.67 0.12 + = 9.17 Rs. 76.42 0.12 = (iii) r = 4% = 0.04, D = 75% of 10 = 7.50 P = − 7.50+0.04 (10 7.50) 0.12 0.12 = 7.50 0.83 0.12 + = 8.33 Rs.69.42 0.12 = = 1.20 0.80 .10 0.024 × − = 0.96 Rs.12.63 0.076 = If the payout is 20% the value of b=0.60 and the price of the share is = 1.20 (1–0.60) .10–(.80×.12) = 1.20×0.40 .10–0.096 = 0.48 0.0004 = Rs. 120
  • 131.
    Dividend Decision 115 Criticismof Gordon’s Model Gordon’s model consists of the following important criticisms: Gordon model assumes that there is no debt and equity finance used by the firm. It is not applicable to present day business. Ke and r cannot be constant in the real practice. According to Gordon’s model, there are no tax paid by the firm. It is not practically applicable. FACTORS DETERMINING DIVIDEND POLICY Profitable Position of the Firm Dividend decision depends on the profitable position of the business concern. When the firm earns more profit, they can distribute more dividends to the shareholders. Uncertainty of Future Income Future income is a very important factor, which affects the dividend policy. When the shareholder needs regular income, the firm should maintain regular dividend policy. Legal Constrains The Companies Act 1956 has put several restrictions regarding payments and declaration of dividends. Similarly, Income Tax Act, 1961 also lays down certain restrictions on payment of dividends. Liquidity Position Liquidity position of the firms leads to easy payments of dividend. If the firms have high liquidity, the firms can provide cash dividend otherwise, they have to pay stock dividend. Sources of Finance If the firm has finance sources, it will be easy to mobilise large finance. The firm shall not go for retained earnings. Growth Rate of the Firm High growth rate implies that the firm can distribute more dividend to its shareholders. Tax Policy Tax policy of the government also affects the dividend policy of the firm. When the government gives tax incentives, the company pays more dividend. Capital Market Conditions Due to the capital market conditions, dividend policy may be affected. If the capital market is prefect, it leads to improve the higher dividend.
  • 132.
    116 Financial Management TYPESOF DIVIDEND POLICY Dividend policy depends upon the nature of the firm, type of shareholder and profitable position. On the basis of the dividend declaration by the firm, the dividend policy may be classified under the following types: • Regular dividend policy • Stable dividend policy • Irregular dividend policy • No dividend policy. Regular Dividend Policy Dividend payable at the usual rate is called as regular dividend policy. This type of policy is suitable to the small investors, retired persons and others. Stable Dividend Policy Stable dividend policy means payment of certain minimum amount of dividend regularly. This dividend policy consists of the following three important forms: Constant dividend per share Constant payout ratio Stable rupee dividend plus extra dividend. Irregular Dividend Policy When the companies are facing constraints of earnings and unsuccessful business operation, they may follow irregular dividend policy. It is one of the temporary arrangements to meet the financial problems. These types are having adequate profit. For others no dividend is distributed. No Dividend Policy Sometimes the company may follow no dividend policy because of its unfavourable working capital position of the amount required for future growth of the concerns. MODEL QUESTIONS 1. What is dividend? Explain the types of dividend. 2. Explain the approaches of dividend decision. 3. Explain the factors affecting the dividend policy. 4. Discuss the various types of dividend policy. 5. Explain the irrelevance and relevance dividend theories. 6. State the criticism of MM approach. 7. What are the assumptions of Walter’s model?
  • 133.
    Dividend Decision 117 8.What are the assumptions and criticisms of Gordon’s model? 9. U Ltd. belongs to risk class of capitalization rate which is 14%. It has currently 3000 shares outstanding at Rs. 50 each; during the year Rs. 5 is declared as dividend. The net income of the company is Rs. 83,000. For the new project investment is required of Rs. 1,20,000. Calculate under MM hypothesis that the payment of dividend does not affect the value of the firm. (Ans. dividend paid Rs. 52 number of equity shares 1000 and value of the firm Rs. 1,50,000. Dividend not paid Rs. 57. Number of equity shares 37000/57 shares (approx. 650 shares) Value of the firm is Rs. 1,50,000) 10. X Ltd., had 25,000 equity shares of Rs. 100 each outstanding on 1st April, the shares are issued at par in the market, the company removed restraint in the dividend policy, the company ready to pay dividend of Rs. 15 per share for the current calendar year. The capitalization rate is 15%. Using MM approach assuming that no taxes, calculate the price of the shares at the end of the year: (a) When dividend is not declared. (b) When dividend is declared. (c) Find out the number of new shares that the company issues to meet its investment needs of Rs 15,00,000 assuming that net income of Rs. 7,50,000 and assuming that the dividend is paid. (Ans. (a) Rs.105 (b) Rs.115 (c) 10,000 shares) 11. The following information is available in respect of a companys capitalization rate is 15% earnings per share Rs. 75. Assured rate on investment is 14% , 12%, 10%. The effect of dividend policy on market price of shares applying Walter’s model the dividend payout ratio is (a) 0% (b) 40% (c) 60% (d) 100%) 12. The following data are available for R Ltd. — Earnings per share Rs. 8 — Rate of return on investment 16% — Rate of return to shareholders 12% If Gordon’s basic valuation formula is applied what will be the price per share when the dividend pay out ratio is 25%, 50%, 60% and 100%. (Ans. Rs. 0, 100, 85.71, and 66.67)
  • 134.
  • 135.
    INTRODUCTION The word Capitalrefers to be the total investment of a company of firm in money, tangible and intangible assets. Whereas budgeting defined by the “Rowland and William” it may be said to be the art of building budgets. Budgets are a blue print of a plan and action expressed in quantities and manners. The examples of capital expenditure: 1. Purchase of fixed assets such as land and building, plant and machinery, good will, etc. 2. The expenditure relating to addition, expansion, improvement and alteration to the fixed assets. 3. The replacement of fixed assets. 4. Research and development project. Definitions According to the definition of Charles T. Hrongreen, “capital budgeting is a long-term planning for making and financing proposed capital out lays. According to the definition of G.C. Philippatos, “capital budgeting is concerned with the allocation of the firms source financial resources among the available opportunities. The consideration of investment opportunities involves the comparison of the expected future streams of earnings from a project with the immediate and subsequent streams of earning from a project, with the immediate and subsequent streams of expenditure”. According to the definition of Richard and Green law, “capital budgeting is acquiring inputs with long-term return”. According to the definition of Lyrich, “capital budgeting consists in planning development of available capital for the purpose of maximizing the long-term profitability of the concern”.
  • 136.
    120 Financial Management Itis clearly explained in the above definitions that a firm’s scarce financial resources are utilizing the available opportunities. The overall objectives of the company from is to maximize the profits and minimize the expenditure of cost. Need and Importance of Capital Budgeting 1. Huge investments: Capital budgeting requires huge investments of funds, but the available funds are limited, therefore the firm before investing projects, plan are control its capital expenditure. 2. Long-term: Capital expenditure is long-term in nature or permanent in nature. Therefore financial risks involved in the investment decision are more. If higher risks are involved, it needs careful planning of capital budgeting. 3. Irreversible: The capital investment decisions are irreversible, are not changed back. Once the decision is taken for purchasing a permanent asset, it is very difficult to dispose off those assets without involving huge losses. 4. Long-term effect: Capital budgeting not only reduces the cost but also increases the revenue in long-term and will bring significant changes in the profit of the company by avoiding over or more investment or under investment. Over investments leads to be unable to utilize assets or over utilization of fixed assets. Therefore before making the investment, it is required carefully planning and analysis of the project thoroughly. CAPITAL BUDGETING PROCESS Capital budgeting is a difficult process to the investment of available funds. The benefit will attained only in the near future but, the future is uncertain. However, the following steps followed for capital budgeting, then the process may be easier are. Identification of Various Investments Evaluation of Proposals Fixing Property Final Approval Implementation Identification of Various Investment Proposals Feedback Steps Screening or Matching the Available Resources Fig. 9.1 Capital Budgeting Process
  • 137.
    Capital Budgeting 121 1.Identification of various investments proposals: The capital budgeting may have various investment proposals. The proposal for the investment opportunities may be defined from the top management or may be even from the lower rank. The heads of various department analyse the various investment decisions, and will select proposals submitted to the planning committee of competent authority. 2. Screening or matching the proposals: The planning committee will analyse the various proposals and screenings. The selected proposals are considered with the available resources of the concern. Here resources referred as the financial part of the proposal. This reduces the gap between the resources and the investment cost. 3. Evaluation: After screening, the proposals are evaluated with the help of various methods, such as pay back period proposal, net discovered present value method, accounting rate of return and risk analysis. Each method of evaluation used in detail in the later part of this chapter. The proposals are evaluated by. (a) Independent proposals (b) Contingent of dependent proposals (c) Partially exclusive proposals. Independent proposals are not compared with another proposals and the same may be accepted or rejected. Whereas higher proposals acceptance depends upon the other one or more proposals. For example, the expansion of plant machinery leads to constructing of new building, additional manpower etc. Mutually exclusive projects are those which competed with other proposals and to implement the proposals after considering the risk and return, market demand etc. 4. Fixing property: After the evolution, the planning committee will predict which proposals will give more profit or economic consideration. If the projects or proposals are not suitable for the concern’s financial condition, the projects are rejected without considering other nature of the proposals. 5. Final approval: The planning committee approves the final proposals, with the help of the following: (a) Profitability (b) Economic constituents (c) Financial violability (d) Market conditions. The planning committee prepares the cost estimation and submits to the management. 6. Implementing: The competent autherity spends the money and implements the proposals. While implementing the proposals, assign responsibilities to the proposals, assign responsibilities for completing it, within the time allotted and reduce the cost for this purpose. The network techniques used such as PERT and CPM. It helps the management for monitoring and containing the implementation of the proposals.
  • 138.
    122 Financial Management 7.Performance review of feedback: The final stage of capital budgeting is actual results compared with the standard results. The adverse or unfavourable results identified and removing the various difficulties of the project. This is helpful for the future of the proposals. KINDS OF CAPITAL BUDGETING DECISIONS The overall objective of capital budgeting is to maximize the profitability. If a firm concentrates return on investment, this objective can be achieved either by increasing the revenues or reducing the costs. The increasing revenues can be achieved by expansion or the size of operations by adding a new product line. Reducing costs mean representing obsolete return on assets. METHODS OF CAPITAL BUDGETING OF EVALUATION By matching the available resources and projects it can be invested. The funds available are always living funds. There are many considerations taken for investment decision process such as environment and economic conditions. The methods of evaluations are classified as follows: (A) Traditional methods (or Non-discount methods) (i) Pay-back Period Methods (ii) Post Pay-back Methods (iii) Accounts Rate of Return (B) Modern methods (or Discount methods) (i) Net Present Value Method (ii) Internal Rate of Return Method (iii) Profitability Index Method Methods of Capital Budgeting Traditional Method Post pay-back Method Accounting Rate of Return Net present Value Method Internal Rate of Return Method Profitability Index Method Modern Methods Pay-back Method Fig. 9.2 Capital Budgeting Methods Pay-back Period Pay-back period is the time required to recover the initial investment in a project.
  • 139.
    Capital Budgeting 123 (Itis one of the non-discounted cash flow methods of capital budgeting). Pay-back period = Initial investment Annual cash inflows Merits of Pay-back method The following are the important merits of the pay-back method: 1. It is easy to calculate and simple to understand. 2. Pay-back method provides further improvement over the accounting rate return. 3. Pay-back method reduces the possibility of loss on account of obsolescence. Demerits 1. It ignores the time value of money. 2. It ignores all cash inflows after the pay-back period. 3. It is one of the misleading evaluations of capital budgeting. Accept/Reject criteria If the actual pay-back period is less than the predetermined pay-back period, the project would be accepted. If not, it would be rejected. Exercise 1 Project cost is Rs. 30,000 and the cash inflows are Rs. 10,000, the life of the project is 5 years. Calculate the pay-back period. Solution = Rs. 30,000 Rs. 10,000 = 3 Years The annual cash inflow is calculated by considering the amount of net income on the amount of depreciation project (Asset) before taxation but after taxation. The income precision earned is expressed as a percentage of initial investment, is called unadjusted rate of return. The above problem will be calculated as below: Unadjusted rate of return = Annual Return Investment × 100 = Rs. 10,000 × 100 Rs. 30,000 = 33.33% Exercise 2 A project costs Rs. 20,00,000 and yields annually a profit of Rs. 3,00,000 after depreciation @ 12½% but before tax at 50%. Calculate the pay-back period.
  • 140.
    124 Financial Management Profitafter depreciation 3,00,000 Tax 50% 1,50,000 1,50,000 Add depreciation 20,00,000 1 2 12 % 2,50,000 Cash in flow 4,00,000 Solution Pay-back period = Investment Cash flow = 20,00,000 4,00,000 = 5 years. Uneven Cash Inflows Normally the projects are not having uniform cash inflows. In those cases the pay-back period is calculated, cumulative cash inflows will be calculated and then interpreted. Exercise 3 Certain projects require an initial cash outflow of Rs. 25,000. The cash inflows for 6 years are Rs. 5,000, Rs. 8,000, Rs. 10,000, Rs. 12,000, Rs. 7,000 and Rs. 3,000. Solution Year Cash Inflows (Rs.) Cumulative Cash Inflows (Rs.) 1 5,000 5,000 2 8,000 13,000 3 10,000 23,000 4 12,000 35,000 5 7,000 42,000 6 3,000 45,000 The above calculation shows that in 3 years Rs. 23,000 has been recovered Rs. 2,000, is balance out of cash outflow. In the 4th year the cash inflow is Rs. 12,000. It means the pay-back period is three to four years, calculated as follows Pay-back period = 3 years+2000/12000×12 months = 3 years 2 months. Post Pay-back Profitability Method One of the major limitations of pay-back period method is that it does not consider the cash inflows earned after pay-back period and if the real profitability of the project cannot be assessed. To improve over this method, it can be made by considering the receivable after the pay-back period. These returns are called post pay-back profits.
  • 141.
    Capital Budgeting 125 Exercise4 From the following particulars, compute: 1. Payback period. 2. Post pay-back profitability and post pay-back profitability index. (a) Cash outflow Rs. 1,00,000 Annual cash inflow Rs. 25,000 (After tax before depreciation) Estimate Life 6 years (b) Cash outflow Rs. 1,00,000 Annual cash inflow (After tax depreciation) First five years Rs. 20,000 Next five years Rs. 8,000 Estimated life 10 Years Salvage value Rs. 16,000 Solution (a) (i) Pay-back period = Initial investment Annual cash inflows = 1,00,000 25,000 = 4 Years (ii) Post pay-back profitability =Cash inflow (Estimated life – Pay-back period) =25,000 (6 – 4) =Rs. 50,000 (iii) Post pay-back profitability index = 50,000 1,00,000 × 100 = 50% (b) Cash inflows are equal, therefore pay back period is calculated as follows: (i) Year Cash Inflows (Rs.) Cumulative Cash Inflows (Rs.) 1 20,000 20,000 2 20,000 40,000 3 20,000 60,000 4 20,000 80,000 Contd....
  • 142.
    126 Financial Management 520,000 1,00,000 6 8,000 1,08,000 7 8,000 1,16,000 8 8,000 1,24,000 9 8,000 1,32,000 10 8,000 1,40,000 (ii) Post pay-back profitability. = Cash inflow (estimated life – pay-back period) = 8,000 (10–5) = 8000×5 = 40,000 (iii) Post pay-back profitability index = 40,000 1,00,000 ×100=40% Accounting Rate of Return or Average Rate of Return Average rate of return means the average rate of return or profit taken for considering the project evaluation. This method is one of the traditional methods for evaluating the project proposals: Merits 1. It is easy to calculate and simple to understand. 2. It is based on the accounting information rather than cash inflow. 3. It is not based on the time value of money. 4. It considers the total benefits associated with the project. Demerits 1. It ignores the time value of money. 2. It ignores the reinvestment potential of a project. 3. Different methods are used for accounting profit. So, it leads to some difficulties in the calculation of the project. Accept/Reject criteria If the actual accounting rate of return is more than the predetermined required rate of return, the project would be accepted. If not it would be rejected. Exercise 5 A company has two alternative proposals. The details are as follows:
  • 143.
    Capital Budgeting 127 ProposalI Proposal II Automatic Machine Ordinary Machine Cost of the machine Rs. 2,20,000 Rs. 60,000 Estimated life 5½ years 8 years Estimated sales p.a. Rs. 1,50,000 Rs. 1,50,000 Costs : Material 50,000 50,000 Labour 12,000 60,000 Variable Overheads 24,000 20,000 Compute the profitability of the proposals under the return on investment method. (M.Com., Madras and Bharathidasan) Solution Profitability Statement Automatic Ordinary Machine Machine Cost of the machine Rs. 2,20,000 Rs. 60,000 Life of the machine 5½ years 8 years Rs. Rs. Estimated Sales (A) 1,50,000 1,50,000 Less : Cost : Material 50,000 50,000 Labour 12,000 60,000 Variable overheads 24,000 20,000 Depreciation (1) 40,000 7,000 Total Cost (B) 1,26,000 1,37,000 Profit (A) – (B) 24,000 12,500 Working: (1) Depreciation = Cost ÷ Life Automatic machine = 2,20,000 ÷ 5½ = 40,000 Ordinary machine = 60,000 ÷ 8 = 7,500 Return on investment = Average profit Original investment × 100 = 24,000 2,20,000 × 100 12,500 60,000 × 100 10.9% 20.8% Automatic machine is more profitable than the ordinary machine.
  • 144.
    128 Financial Management NetPresent Value Net present value method is one of the modern methods for evaluating the project proposals. In this method cash inflows are considered with the time value of the money. Net present value describes as the summation of the present value of cash inflow and present value of cash outflow. Net present value is the difference between the total present value of future cash inflows and the total present value of future cash outflows. Merits 1. It recognizes the time value of money. 2. It considers the total benefits arising out of the proposal. 3. It is the best method for the selection of mutually exclusive projects. 4. It helps to achieve the maximization of shareholders’ wealth. Demerits 1. It is difficult to understand and calculate. 2. It needs the discount factors for calculation of present values. 3. It is not suitable for the projects having different effective lives. Accept/Reject criteria If the present value of cash inflows is more than the present value of cash outflows, it would be accepted. If not, it would be rejected. Exercise 6 From the following information, calculate the net present value of the two project and suggest which of the two projects should be accepted a discount rate of the two. Project X Project Y Initial Investment Rs. 20,000 Rs. 30,000 Estimated Life 5 years 5 years Scrap Value Rs. 1,000 Rs. 2,000 The profits before depreciation and after taxation (cash flows) are as follows: Year 1 Year 2 Year 3 Year 4 Year 5 Rs. Rs. Rs. Rs. Rs. Project x 5,000 10,000 10,000 3,000 2,000 Project y 20,000 10,000 5,000 3,000 2,000
  • 145.
    Capital Budgeting 129 Note: The following are the present value factors @ 10% p.a. Year 1 2 3 4 5 6 Factor 0.909 0.826 0.751 0.683 0.621 0.564 (MBA, Madurai-Kamaraj University, May 2005) Solution Cash Inflows Present Present Value of Net Cash Value of Rs. Inflow Year Project X Rs. Project Y Rs. 1 @ 10% Project X Rs. Project Y Rs. 1 5,000 20,000 0.909 4,545 18,180 2 10,000 10,000 0.826 8,260 8,260 3 10,000 5,000 0.751 7,510 3,755 4 3,000 3,000 0.683 2,049 2,049 5 2,000 2,000 0.621 1,242 1,242 Scrap Value 1,000 2,000 0.621 621 1,245 Total present valueInitial 24,227 34,728 investments 20,000 30,000 Net present value 4,227 4,728 Project Y should be selected as net present value of project Y is higher. Exercise 7 The following are the cash inflows and outflows of a certain project. Year Outflows Inflows 0 1,75,000 - 1 5,50,000 35,000 2 45,000 3 65,000 4 85,000 5 50,000 The salvage value at the end of 5 years is Rs. 50,000. Taking the cutoff rate as 10%, calculate net present value. Year 1 2 3 4 5 P.V. 0.909 0.826 0.751 0.683 0.621 Solution Year Cash Inflows Present Value Present Value Rs. Factor @ 10% of Cash Inflows 1 35,000 0.909 31,815 2 45,000 0.826 37,170 Contd....
  • 146.
    130 Financial Management 365000 0.751 48815 4 85000 0.683 58055 5 50000 0.621 31050 5(Salvage) 50000 0.621 31050 Total present value of cash inflows 237955 Less : Total present value of outflows Cash outflow at the beginning 1,75,000 Cash outflow at the end of first Year 50000×0.909 45,450 Total value of outflows 2,20,450 Net Present Value 17,505 If the cash inflows are not given in that cases the calculation of cash inflows are Net profit after tax+Depreciation. In this type of situation first find out the Net profit after depreciation and deducting the tax and then add the deprecation. It gives the cash inflow. Exercise 8 From the following information you can learn after tex and depreciation concept. Initial Outlay Rs. 1,00,000 Estimated life 5 Years Scrap Value Rs. 10,000 Profit after tax : End of year 1 Rs. 6,000 2 Rs. 14,000 3 Rs. 24,000 4 16,000 5 Nil Solution Depreciation has been calculated under straight line method. The cost of capital may be taken at 10%. P.a. is given below. Year 1 2 3 4 5 PV factor @ 10% 0.909 0.826 0.751 0.683 0.621 Depreciation = Initial cash outflow – scrap value Estimated Life of the project = 1,00,000 –10,000 5 = 90,000 5 = Rs.18,000
  • 147.
    Capital Budgeting 131 YearProfit after Tax Depreciation Cash Inflow 1 6,000 18,000 24,000 2 14,000 18,000 32,000 3 24,000 18,000 42,000 4 16,000 18,000 34,000 5 Nil 18,000 18,000 Net Present Value Year Cash Inflow Discount factor @ 10% Present value (Rs.) 1 24,000 0.909 21,816 2 32,000 0.826 26,432 3 42,000 0.751 31,542 4 34,000 0.683 23,222 5 18,000 0.621 11,178 Total present value of cash inflows 1,14,190 Less : Initial cash investment 1,00,000 Net present value 1,41,90 Internal Rate of Return Internal rate of return is time adjusted technique and covers the disadvantages of the traditional techniques. In other words it is a rate at which discount cash flows to zero. It is expected by the following ratio: Cash inflow Investment initial Steps to be followed: Step1. find out factor Factor is calculated as follows: F= Cash outlay (or) initial investment Cash inflow Step 2. Find out positive net present value Step 3. Find out negative net present value Step 4. Find out formula net present value Formula IRR =Base factor + Positive net present value DP Difference in positive and Negative net present value ×
  • 148.
    132 Financial Management Basefactor = Positive discount rate DP = Difference in percentage Merits 1. It consider the time value of money. 2. It takes into account the total cash inflow and outflow. 3. It does not use the concept of the required rate of return. 4. It gives the approximate/nearest rate of return. Demerits 1. It involves complicated computational method. 2. It produces multiple rates which may be confusing for taking decisions. 3. It is assume that all intermediate cash flows are reinvested at the internal rate of return. Accept/Reject criteria If the present value of the sum total of the compounded reinvested cash flows is greater than the present value of the outflows, the proposed project is accepted. If not it would be rejected. Exercise 9 A company has to select one of the following two projects: Project A Project B Cost Rs.22,000 20,000 Cash inflows: Year 1 12,000 2,000 Year 2 4,000 2,000 Year 3 2,000 4,000 Year 4 10,000 20,000 Using the Internal Rate of Return method suggest which is Preferable. Solution F = Cash outlay Cash inflow Project A Cash Inflow = Total cash inflow No. of years = 28,000 4 = 7000
  • 149.
    Capital Budgeting 133 = 22000 7000 =3.14 The factor thus calculated will be located in table II below. This would give the estimated rate of return to be applied discounting the cash for the internal rate of returns. In this of project A the rate comes to 10% while in case of project B it comes to15%. Project A Cash Inflows Discounting Factor Present Value Year Rs. at 10% Rs. 1 12000 0.909 10908 2 4000 0.826 3304 3 2000 0.751 1502 4 10000 0.683 6830 22544 Less: Initial Investment. 22000 Net Present Value 544 The present value at 10% comes to Rs. 22,544. The initial investment is Rs. 22,000. Interest rate of return may be taken approximately at 10%. In the case more exactness is required another trial which is slightly higher than 10%(since at this rate the present value is more than initial investment) may be taken. Taking a rate of 12% the following results would emerge. Cash Inflows Discounting Factor Present Value Year Rs. at 12.6% Rs. 1 12,000 0.893 10,716 2 4,000 0.794 3,188 3 2,000 0.712 1,424 4 10,000 0.636 6,380 21,688 Less: Initial Investment Value 22,000 Net Present Value (–)312 IRR=Base factor + Positive net present value DP Difference in positive and Negative net present value × Base factor= 10% DP = 2%
  • 150.
    134 Financial Management =10% + 544 544 – (–312) ×2% = 10% + 5 4 4 8 5 6 ×2 = 10+1.27 = 11.27% Project B Year Cash Inflows Discount Present value Rs. Factor at 15% Rs. 1 2,000 0.909# 1,818 2 2,000 0.826 1,652 3 4,000 0.751 3,004 4 20,000 0.683 13,660 Total present value 20,134 Less: Initial investment 20,000 Net present value 134 IRR= 10% 134 134–(2676) × 5% = 10% + 0.24% IRR = 10.24% Thus, internal rate of return in project ‘A’ is higher as compared to project ‘B’. Therefore project ‘A’ is preferable. Exercise 10 A project costs Rs. 16,000 and is expected to generate cash inflows of Rs. 4,000 each 5 years. Calculate the Interest Rate of Return. Solution F = 16,000 4,000 = 4 Facts may lays between 6% to 8% 4.221 for 6% 3.993 for 8% 4000 × 4.21 = 16,840 4000 × 3.99 = 15,960 6% present value 16,840 Less: Investment 16,000 Net present value 840
  • 151.
    Capital Budgeting 135 8%present value 15,960 Less: Investment 16,000 –40 IRR = 6% + 840 840 – (–40) ×2% = 6% +1.91% = 7.91%. Excess Present Value Index Excess present value is calculated on basis of net present value. It gives the results in percentage. Exercise 11 The initial of an equipment is Rs. 10,000. Cash inflow for 5 years are estimated to be Rs. 3,500 per year. The management is desired minimum rate of excess present value index. Solution Present value of Rs. 1 received annually for 5 years can be had form the annuity table. Present value of 3,500 received annually for 5 years. Excess present value index = Total present value of cash inflows Total present value of cash outflows = 11,732 10,000 × 100 = 117,32% Capital Rationing In the rationing the company has only limited investment the project are selected according to the profitability. The project has selected the combination of proposal that will yield the greatest portability. Exercise 12 Let us assume that a firm has only Rs. 20 lakhs to invest and funds cannot be provided. The various proposals along with the cost and profitability index are as follows. Proposal Pool of the project Profitability Index 1 6,00,000 1.46 2 2,00,000 .098 3 10,00,000 2.31 4 4,00,000 1.32 5 3,00,000 1.25
  • 152.
    136 Financial Management Solution Inthis example all proposals expect number 2 give profitability exceeding one and are profitable investments. The total outlay required to be invested in all other (profitable) project is Rs. 25,00,000(1+2+3+4+5) but total funds available with the firm are Rs. 20 lakhs and hence the firm has to do capital combination of project within a total which has the lowest profitability index along with the profitable proposals cannot be taken. RISK AND UNCERTAINLY IN CAPITAL BUDGETING Capital budgeting requires the projection of cash inflow and outflow of the future. The future in always uncertain, estimate of demand, production, selling price, cost etc., cannot be exact. For example: The product at any time it become obsolete therefore, the future in unexpected. The following methods for considering the accounting of risk in capital budgeting. Various evaluation methods are used for risk and uncertainty in capital budgeting are as follows: (i) Risk-adjusted cut off rate (or method of varying discount rate) (ii) Certainly equivalent method. (iii) Sensitivity technique. (iv) Probability technique (v) Standard deviation method. (vi) Co-efficient of variation method. (vii) Decision tree analysis. (i) Risk-adjusted cutoff rate (or Method of varying) This is one of the simplest method while calculating the risk in capital budgeting increase cut of rate or discount factor by certain percentage an account of risk. Exercise 13 The Ramakrishna Ltd., in considering the purchase of a new investment. Two alternative investments are available (X and Y) each costing Rs. 150000. Cash inflows are expected to be as follows: Cash Inflows Year Investment X Investment Y Rs. Rs. 1 60,000 65,000 2 45,000 55,000 3 35,000 40,000 4 30,000 40,000 The company has a target return on capital of 10%. Risk premium rate are 2% and 8% respectively for investment X and Y. Which investment should be preferred?
  • 153.
    Capital Budgeting 137 Solution Theprofitability of the two investments can be compared on the basis of net present values cash inflows adjusted for risk premium rates as follows: Investment X Investment Y Discount Cash Present Discount Cash Present Year Factor10% + 2% Inflow Value Factor Inflow Values = 12% Rs. Rs. 10% + Rs. 8%=18% 1 0.893 60,000 53,580 0.847 85,000 71,995 2 0.797 45,000 35,865 0.718 55,000 39,490 3 0.712 35,000 24,920 0.609 40,000 24,360 4 0.635 30,000 19,050 0.516 40,000 20,640 1,33,415 1,56,485 Investment X Net present value = 133415 – 150000 = – Rs. 16585 Investment Y Net present value = 156485 – 150000 = Rs. 6485 As even at a higher discount rate investment Y gives a higher net present value, investment Y should be preferred. (ii) Certainly equivalent method It is also another simplest method for calculating risk in capital budgeting info reduceds expected cash inflows by certain amounts it can be employed by multiplying the expected cash inflows by certainly equivalent co-efficient in order the uncertain cash inflow to certain cash inflows. Exercise 14 There are two projects A and B. Each involves an investment of Rs. 50,000. The expected cash inflows and the certainly co-efficient are as under: Project A Project B Year Cash inflows Certainly Cash inflows Certainly co-efficient Co-efficient 1 35,000 .8 25,000 .9 2 30,000 .7 35,000 .8 3 20,000 .9 20,000 .7 Risk-free cutoff rate is 10%. Suggest which of the two projects. Should be preferred.
  • 154.
    138 Financial Management Solution Calculationsof cash Inflows with certainly: Year Project A Project B Cash Certainly Certain Cash Certainly Certain Inflow Co-efficient Cash Inflow Co-efficient Cash Inflow Inflow 1 35,000 .8 28,000 25,000 .9 22,500 2 30,000 .7 21,000 35,000 .8 28,000 3 20,000 .9 18,000 20,000 .7 14,000 Calculation of present values of cash inflows: Year Project A Project B Discount Cash Present Cash Present Factor @ 10% Inflows Values Inflows Value 1 0.909 28,000 25,452 22,500 20,453 2 0.826 21,000 17,346 28,000 23,128 3 0.751 18,000 13,518 14,000 10,514 Total 56,316 54,095 Project A Project B Net present value = Rs. 56,316 – 50,000 54,095 – 50,000 = Rs. 6,316 Rs. 4,095 As the net present value of project A in more than that of project B. Project A should be preferred: (iii) Sensitivity technique When cash inflows are sensitive under different circumstances more than one forecast of the future cash inflows may be made. These inflows may be regarded on ‘Optimistic’, ‘most likely’ and ‘pessimistic’. Further cash inflows may be discounted to find out the net present values under these three different situations. If the net present values under the three situations differ widely it implies that there is a great risk in the project and the investor’s is decision to accept or reject a project will depend upon his risk bearing activities. Exercise 15 Mr. Selva is considering two mutually exclusive project ‘X’ and ‘Y’. You are required to advise him about the acceptability of the projects from the following information.
  • 155.
    Capital Budgeting 139 ProjectX Projects Y Rs. Rs. Cost of the investment 1,0,0000 1,00,000 Forecast cash inflows per annum for 5 years Optimistic 60,000 55,000 Most likely 35,000 30,000 Pessimistic 20,000 20,000 (The cut-off rate may be assumed to be 15%). Solution Calculation of net present value of cash inflows at a discount rate of 15%. (Annuity of Re. 1 for 5 years). For Project X Event Annual cash Discount factor Present value Net Present Inflow Rs. @ 15 % Rs. value Rs. Optimistic 60,000 3.3522 2,01,132 1,01,132 Most likely 35,000 3.3522 1,17,327 17,327 Pessimistic 20,000 3.3522 67,105 (32,895) For Project Y Event Annual cash Discount factor Present value Net Present Inflow Rs. @ 15 % Rs. value Rs. Optimistic 55,000 3.3522 1,84,371 84,371 Most likely 30,000 3.3522 1,00,566 566 Pessimistic 20,000 3.3522 67,105 (32,895) The net present values on calculated above indicate that project Y is more risky as compared to project X. But at the same time during favourable condition, it is more profitable also. The acceptability of the project will depend upon Mr. Selva’s attitude towards risk. If he could afford to take higher risk, project Y may be more profitable. (iv) Probability technique Probability technique refers to the each event of future happenings are assigned with relative frequency probability. Probability means the likelihood of future event. The cash inflows of the future years further discounted with the probability. The higher present value may be accepted. Exercise 16 Two mutually exclusive investment proposals are being considered. The following information in available. Project A (Rs.) Project B ( Rs.) Cost 10,000 10,000
  • 156.
    140 Financial Management Cashinflows Year Rs. Probability Rs. Probability 1 10,000 .2 12,000 .2 2 18,000 .6 16,000 .6 3 8,000 .2 14,000 .2 Assuming cost of capital at (or) advise the selection of the project: Solution Calculation of net project values of the two projects. Project A Year P.V. Factor Cash Probability Monetary Present @ 10 % Inflow Value Value Rs. 1 0.909 10,000 .2 2,000 1,818 2 0.826 18,000 .6 10,800 8,921 3 0.751 8,000 .2 1,600 1,202 Total Present value 11,941 Cost of Investment 10,000 Net present value 1,941 Project B Year P.V. Factor Cash Probability Monetary Present @ 10 % Inflow Value Value Rs. 1 0.909 12,000 .2 2,400 2,182 2 0.826 14,000 .6 8,400 6,938 3 0.751 14,000 .2 2,800 2,103 Total present value 11,223 Cost of investment 10,000 Net present value 1,223 As net present value of project A is more than that of project B after taking into consideration the probabilities of cash inflows project A is more profitable one. (v) Standard deviation method Two Projects have the same cash outflow and their net values are also the same, standard durations of the expected cash inflows of the two Projects may be calculated to measure the comparative and risk of the Projects. The project having a higher standard deviation in said to be more risky as compared to the other. Exercise 17 From the following information, ascertain which project should be selected on the basis of standard deviation.
  • 157.
    Capital Budgeting 141 ProjectX Project Y Cash inflow Probability Cash inflow Probability Rs. Rs. 3,200 .2 32,000 .1 5,500 .3 5,500 .4 7,400 .3 7,400 .4 8,900 .2 8,900 .1 Solution Project X Cash inflow Deviation Square Probability Weighted from Deviations Deviations Mean (d) d2 (td2 ) 1 2 3 4 5 3,200 (–) 6,250 9,30,25,000 .2 18,60,500 5,500 (–) 750 56,2,500 .3 1,68,750 7,400 (+) 1,150 13,22,500 .3 3,96,750 8,900 (+) 2,650 70,22,500 .2 14,04,500 n= 1 Σfd2 = 38,30,500 Standard Deviation (6) = Σ 2 fd n = 3830500 1 = 1957.2 Project Y 1 2 3 4 5 3,200 (–) 3,050 9,30,25,000 .1 9,30,250 5,500 (–) 750 5,62,500 .4 2,25,000 7,400 (+) 1,150 13,22,500 .4 5,29,000 8,900 (+) 2,650 70,22,500 .1 7,02,250 n= 1 Σfd2 = 3830500 Standard deviation(6) = Σ 2 fd n
  • 158.
    142 Financial Management = 2386500 1 =1544.8 As the standard deviation of project X is more then that of project Y, A is more risky. (vi) Co-efficient of variation method Co-efficient of variation is a relative measure of dispersion. It the projects here the same cost but different net present values, relatives measure, i.e., Co-efficient of variation should be risk induced. It can be calculated as: Co-efficient of variation = Standard deviation mean × 100 Exercise 18 Using figure of previous example compute co-efficient of variation and suggest which proposal should be accepted: Solution For project X = 1957.2 6250 ×100 = 31.31% For project Y = 1544.8 6250 ×100 = 29.52% As the co-efficient of variation of project ‘X’ in more then that ‘Y’ project X in more risk. Hence, project Y should be selected. (vii) Decision tree analysis In the modern business world, putting the investments are become more complex and taking decisions in the risky situations. So, the decision tree analysis helpful for taking risky and complex decisions, because it consider all the possible event’s and each possible events are assigned with the probability. Construction of Decision Tree 1. Defined the problem 2. Evaluate the different alternatives 3. Indicating the decision points 4. Assign the probabilities of the monetary values 5. Analysis the alternatives.
  • 159.
    Capital Budgeting 143 Accept/Rejectcriteria If the net present values are in positive the project may be accepted otherwise it is rejected. Exercise 19 Mr. Kumar in considering an investment proposal of Rs.40,000. The expected returns during the left of the investment are as under: Year I Event Cash Inflow Probability (i) 16,000 .3 (ii) 24,000 .5 (iii) 20,000 .2 Year II Cash inflows in year1 are: 16,000 24,000 20,000 Cash Prob Cash Prob Cash Prob Inflows Inflows Inflows (Rs.) (Rs.) (Rs.) (i) 30,000 .2 40,000 .1 5,000 .2 (ii) 40,000 .6 60,000 .8 8,000 .5 (iii) 50,000 .2 80,000 .1 12,000 .3 using 10% as the cost of capital, advise about the acceptability of the proposal: Solution Calculation of net present values of cash inflows Year Year I Year II Net Present Joint Expected Net Prob. Prob. Value Prob. Present value Cash Inflow Cash Inflow of Inflow 2 30,000 (–) 676 .06 (–) 40.56 .3 1,6000 .6 40,000 7,584 .18 1,365.12 .2 50,000 15,844 .06 950.64 Cash outflow .1 20,000 14,856 .04 742.80 Rs.40,000 .5 24,000 .8 60,000 31,376 .10 2,550.40 .1 80,000 47,896 .06 2,394.80 .2 50,000 19,480 .04 779.20 .2 20,000 .5 80,000 44,260 .10 4,426.00 .3 1,20,000 77,300 .06 4,638.00 1.00 27,806.40
  • 160.
    144 Financial Management Asthe proposal yields a net present value of +27806.40 at a discount for of 10% other proposal may be accepted. MODEL QUESTIONS 1. What is capital budgeting? Explain its needs and importance. 2. What are the stages of capital budgeting process? 3. Explain the various methods of capital budgeting techniques. 4. What is risk and uncertainty? 5. Calculate the payback period from the following information: Cash outlay Rs. 50,000 and cash inflow Rs. 12,500. (Ans. 4 years) 6. From the following information, calculate the pay-back periods for the 3 projects. Which liquors Rs. 2,00,000 each? Suggest most profitable project. Year Project I Project II Project III 1 50,000 60,000 35,000 2 50,000 70,000 45,000 3 50,000 75,000 85,000 4 50,000 45,000 50,000 5 50,000 – 35,000 7. The machine cost Rs. 1,00,000 and has scrap value of Rs. 10,000 after 5 years. The net profits before depreciation and taxes for the five years period are to be projected that Rs. 20,000, Rs. 24,000, Rs. 30,000, Rs. 26,000 and Rs. 22,000. Taxes are 50%. Calculate pay-back period and accounting rate of return. (Ans. 4 years 3 months and 11.2%) 8. A company has to choose one of the following two actually exclusive machine. Both the machines have to be depreciated. Calculate NPV. Cash inflows Year Machine X Machine Y 0 –20,000 –20,000 1 5,500 6,200 2 6,200 8,800 3 7,800 4,300 4 4,500 3,700 5 3,000 2,000 (Ans. Machine X is recommended)
  • 161.
    Capital Budgeting 145 9.A machine cost Rs. 1,25,000. The cost of capital is 15%. The net cash inflows are as under: Year Rs. 1 25,000 2 35,000 3 50,000 4 40,000 5 25,000 Calculate internal rate of return and suggest whether the project should be accepted of cost. (Ans. Reject the machine) 10. Which project will be selected under NPU and IRR? A B Cash outflow 2,00,000 3,00,000 Cash inflows at the end of 1 Year 60,000 40,000 2 Year 50,000 50,000 3 Year 50,000 60,000 4 Year 40,000 90,000 5 Year 30,000 1,00,000 Cost of capital is 10%. (Reject the two projects because less then the cost of capital). 11. SP Limited company is having two projects, requiring a capital outflow of Rs. 3,00,000. The expected annual income after depreciation but before tax is as follows: Year Rs. 1 9,000 2 80,000 3 70,000 4 60,000 5 50,000 Depreciation may be taken as 20% of original cost and taxation at 50% of net income: You are required 10 calculated (a) Pay-back period (b) Net present value (c) According rate of return (d) Net present value index. (e) Internal rate of return. (Ans. 3.5 years, Rs. 25,745, 43.437%, 108.58%, 13.87%)
  • 162.
    146 Financial Management 12.From the following information, select which project is better. Cash Inflows (Year) I II 0 –20,000 –20,000 1 7,000 8,000 2 7,000 9,000 3 6,000 5,000 Risk less discount rate is 5%. Project I is less risks as compared to project II. The management consider risk premium rates at 5% and 10% respectively appropriate for discounting the cash inflows. 13. There are two mutually exclusive projects I and II. Each projects requires an investment of Rs. 60,000. The following are the cash inflows and certainly co-efficient are as follows. Project I Project II Year Cash inflow Certainty Cash Inflow Certainty Co-efficient Co-efficient 1 30,000 .7 25,000 .9 2 25,000 .8 25,000 .8 3 25,000 .9 30,000 .7 Risk-free cutoff rate is 10%. Evaluate which project will be considered. (Ans. Project II is considered) 14. Mr. X is considering two mutually exclusive investment I and II. From the following details advice Mr. X. Project I Project II Cost of investment 75,000 75,000 Annual income for 5 years Optimistic 37,500 41,250 Most likely 26,250 22,500 Pesionistic 15,000 15,000 The cutoff rate is 12%. (Ans. Project B is preferred)
  • 163.
    Capital Budgeting 147 15.Two mutually exclusive projects are being considered. The following detail is available. Year Project A Project B Rs. Profitability Rs. Profitability 1 12,000 - 12,000 - 2 10,000 .2 10,000 .2 3 15,000 .6 20,000 .6 4 25,000 .2 20,000 .2 (Ans. select Project B) 16. Mr. A is considering two mutually exclusive investment projects, from following information select the Project on the basis of standard deviation and co-efficient of variation method. Cash Project I Project II Rs. 15,000. Rs. 15,000 Cash inflow Rs. Probabilities Rs. Probabilities Year 1 3,000 .3 4,000 .1 2 4,000 .2 6,000 .4 3 7,000 .3 7,000 .3 4 6,000 .2 3,000 .2 (Ans. I Rs. 1673 and 33.46% II Rs. 1581 and 31.62% Select Project II) 17. Mr. X is considering the project an investment of Rs. 26,000. The expensed returns during the life if the project of are as follows: Year I Event Cash inflow Probability a 12,000 .2 b 14,000 .6 c 9,000 .2 Year II Cash inflows is year I are. Rs. 12,000 Rs. 14,000 Rs. 9,000 Cash inflow Probability Cash inflow Probability Cash inflow Probability 1 18,000 .3 22,000 .2 28,000 .4 2 20,000 .4 26,000 .7 32,000 .5 3 20,000 .3 30,000 .1 35,000 .1 Using 10% as the use of capital, advise about the acceptability of the proposal. (Ans. Accept the project because+Rs. 6657 at 10%)
  • 164.
  • 165.
    INTRODUCTION Working capital managementis also one of the important parts of the financial management. It is concerned with short-term finance of the business concern which is a closely related trade between profitability and liquidity. Efficient working capital management leads to improve the operating performance of the business concern and it helps to meet the short- term liquidity. Hence, study of working capital management is not only an important part of financial management but also are overall management of the business concern. Working capital is described as the capital which is not fixed but the more common uses of the working capital is to consider it as the difference between the book value of current assets and current liabilities. This chapter deals with the following important aspects of the working capital management. • Meaning of Working Capital • Concept of Working Capital • Types of Working Capital • Needs of Working Capital • Factors determining Working Capital • Computation of Working Capital • Sources of Working Capital • Working Capital Management Policy • Working Capital and Banking Committee MEANING OF WORKING CAPITAL Capital of the concern may be divided into two major headings.
  • 166.
    150 Financial Management Capital FixedCapital Working Capital Fig. 10.1 Capital of the Business Fixed capital means that capital, which is used for long-term investment of the business concern. For example, purchase of permanent assets. Normally it consists of non-recurring in nature. Working Capital is another part of the capital which is needed for meeting day to day requirement of the business concern. For example, payment to creditors, salary paid to workers, purchase of raw materials etc., normally it consists of recurring in nature. It can be easily converted into cash. Hence, it is also known as short-term capital. Definitions According to the definition of Mead, Baker and Malott, “Working Capital means Current Assets”. According to the definition of J.S.Mill, “The sum of the current asset is the working capital of a business”. According to the definition of Weston and Brigham, “Working Capital refers to a firm’s investment in short-term assets, cash, short-term securities, accounts receivables and inventories”. According to the definition of Bonneville, “Any acquisition of funds which increases the current assets, increase working capital also for they are one and the same”. According to the definition of Shubin, “Working Capital is the amount of funds necessary to cover the cost of operating the enterprises”. According to the definition of Genestenberg, “Circulating capital means current assets of a company that are changed in the ordinary course of business from one form to another, for example, from cash to inventories, inventories to receivables, receivables to cash”. CONCEPT OF WORKING CAPITAL Working capital can be classified or understood with the help of the following two important concepts.
  • 167.
    Working Capital 151 Gross Working Capital Net Working Capital Fig.10.2 Working Capital Concept Gross Working Capital Gross Working Capital is the general concept which determines the working capital concept. Thus, the gross working capital is the capital invested in total current assets of the business concern. Gross Working Capital is simply called as the total current assets of the concern. GWC = CA Net Working Capital Net Working Capital is the specific concept, which, considers both current assets and current liability of the concern. Net Working Capital is the excess of current assets over the current liability of the concern during a particular period. If the current assets exceed the current liabilities it is said to be positive working capital; it is reverse, it is said to be Negative working capital. NWC = C A – CL Component of Working Capital Working capital constitutes various current assets and current liabilities. This can be illustrated by the following chart.
  • 168.
    152 Financial Management WorkingCapital Cash in Hand Current Assets Current Liability Cash at Bank Bills Receivable Sundry Debtors Shotr-term Loans Advances Inventories Prepaid Expenses Accrued Income Bills Payable Sundry Creditors Outstanding Expenses Short-term Loans and Advances Dividend Payable Bank Overdraft Provision for Taxation TYPES OF WORKING CAPITAL Working Capital may be classified into three important types on the basis of time. Working Capital Permanent Working Capital Temporary Working Capital Semi Variable Working Capital Seasonal Working Capital Special Working Capital Fig. 10.3 Types of Working Capital Permanent Working Capital It is also known as Fixed Working Capital. It is the capital; the business concern must maintain certain amount of capital at minimum level at all times. The level of Permanent Capital depends upon the nature of the business. Permanent or Fixed Working Capital will not change irrespective of time or volume of sales.
  • 169.
    Working Capital 153 Amountof Working Capital Permanent Working Capital Time Fig. 10.4 Permanent Working Capital Temporary Working Capital It is also known as variable working capital. It is the amount of capital which is required to meet the Seasonal demands and some special purposes. It can be further classified into Seasonal Working Capital and Special Working Capital. The capital required to meet the seasonal needs of the business concern is called as Seasonal Working Capital. The capital required to meet the special exigencies such as launching of extensive marketing campaigns for conducting research, etc. Temporary Working Capital Amount of Working Capital Time Fig. 10.5 Temporary Working Capital Semi Variable Working Capital Certain amount of Working Capital is in the field level up to a certain stage and after that it will increase depending upon the change of sales or time. Semi Variable Working Capital Time Amount of Working Capital Fig. 10.6 Semi Variable Working Capital
  • 170.
    154 Financial Management NEEDSOF WORKING CAPITAL Working Capital is an essential part of the business concern. Every business concern must maintain certain amount of Working Capital for their day-to-day requirements and meet the short-term obligations. Working Capital is needed for the following purposes. 1. Purchase of raw materials and spares: The basic part of manufacturing process is, raw materials. It should purchase frequently according to the needs of the business concern. Hence, every business concern maintains certain amount as Working Capital to purchase raw materials, components, spares, etc. 2. Payment of wages and salary: The next part of Working Capital is payment of wages and salaries to labour and employees. Periodical payment facilities make employees perfect in their work. So a business concern maintains adequate the amount of working capital to make the payment of wages and salaries. 3. Day-to-day expenses: A business concern has to meet various expenditures regarding the operations at daily basis like fuel, power, office expenses, etc. 4. Provide credit obligations: A business concern responsible to provide credit facilities to the customer and meet the short-term obligation. So the concern must provide adequate Working Capital. Working Capital Position/ Balanced Working Capital Position. A business concern must maintain a sound Working Capital position to improve the efficiency of business operation and efficient management of finance. Both excessive and inadequate Working Capital lead to some problems in the business concern. A. Causes and effects of excessive working capital. (i) Excessive Working Capital leads to unnecessary accumulation of raw materials, components and spares. (ii) Excessive Working Capital results in locking up of excess Working Capital. (iii) It creates bad debts, reduces collection periods, etc. (iv) It leads to reduce the profits. B. Causes and effects of inadequate working capital (i) Inadequate working capital cannot buy its requirements in bulk order. (ii) It becomes difficult to implement operating plans and activate the firm’s profit target. (iii) It becomes impossible to utilize efficiently the fixed assets. (iv) The rate of return on investments also falls with the shortage of Working Capital. (v) It reduces the overall operation of the business.
  • 171.
    Working Capital 155 FACTORSDETERMINING WORKING CAPITAL REQUIREMENTS Working Capital requirements depends upon various factors. There are no set of rules or formula to determine the Working Capital needs of the business concern. The following are the major factors which are determining the Working Capital requirements. Working Capital Determinants Factors Factors Factors Factors Fig. 10.7 Factors Determining Working Capital Requirements 1. Nature of business: Working Capital of the business concerns largely depend upon the nature of the business. If the business concerns follow rigid credit policy and sell goods only for cash, they can maintain lesser amount of Working Capital. A transport company maintains lesser amount of Working Capital while a construction company maintains larger amount of Working Capital. 2. Production cycle: Amount of Working Capital depends upon the length of the production cycle. If the production cycle length is small, they need to maintain lesser amount of Working Capital. If it is not, they have to maintain large amount of Working Capital. 3. Business cycle: Business fluctuations lead to cyclical and seasonal changes in the business condition and it will affect the requirements of the Working Capital. In the booming conditions, the Working Capital requirement is larger and in the depression condition, requirement of Working Capital will reduce. Better business results lead to increase the Working Capital requirements. 4. Production policy: It is also one of the factors which affects the Working Capital requirement of the business concern. If the company maintains the continues production policy, there is a need of regular Working Capital. If the production policy of the company depends upon the situation or conditions, Working Capital requirement will depend upon the conditions laid down by the company.
  • 172.
    156 Financial Management 5.Credit policy: Credit policy of sales and purchase also affect the Working Capital requirements of the business concern. If the company maintains liberal credit policy to collect the payments from its customers, they have to maintain more Working Capital. If the company pays the dues on the last date it will create the cash maintenance in hand and bank. 6. Growth and expansion: During the growth and expansion of the business concern, Working Capital requirements are higher, because it needs some additional Working Capital and incurs some extra expenses at the initial stages. 7. Availability of raw materials: Major part of the Working Capital requirements are largely depend on the availability of raw materials. Raw materials are the basic components of the production process. If the raw material is not readily available, it leads to production stoppage. So, the concern must maintain adequate raw material; for that purpose, they have to spend some amount of Working Capital. 8. Earning capacity: If the business concern consists of high level of earning capacity, they can generate more Working Capital, with the help of cash from operation. Earning capacity is also one of the factors which determines the Working Capital requirements of the business concern. COMPUTATION (OR ESTIMATION) OF WORKING CAPITAL Working Capital requirement depends upon number of factors, which are already discussed in the previous parts. Now the discussion is on how to calculate the Working Capital needs of the business concern. It may also depend upon various factors but some of the common methods are used to estimate the Working Capital. A. Estimation of components of working capital method Working capital consists of various current assets and current liabilities. Hence, we have to estimate how much current assets as inventories required and how much cash required to meet the short term obligations. Finance Manager first estimates the assets and required Working Capital for a particular period. B. Percent of sales method Based on the past experience between Sales and Working Capital requirements, a ratio can be determined for estimating the Working Capital requirement in future. It is the simple and tradition method to estimate the Working Capital requirements. Under this method, first we have to find out the sales to Working Capital ratio and based on that we have to estimate Working Capital requirements. This method also expresses the relationship between the Sales and Working Capital. C. Operating cycle Working Capital requirements depend upon the operating cycle of the business. The operating cycle begins with the acquisition of raw material and ends with the collection of receivables.
  • 173.
    Working Capital 157 Operatingcycle consists of the following important stages: 1. Raw Material and Storage Stage, (R) 2. Work in Process Stage, (W) 3. Finished Goods Stage, (F) 4. Debtors Collection Stage, (D) 5. Creditors Payment Period Stage. (C) R D W F O = R + W + F + D–C Fig. 10.8 Working Capital Cycle Each component of the operating cycle can be calculated by the following formula: R = Average Stock of Raw Material Average Raw Material Consumption Per Day W = Average Work in Process Inventory Average Cost of Production Per Day F = Average Finished Stock Inventory Average Cost of Goods Sold Per Day D = Average Book Debts Average Credit Sales Per Day C = Average Trade Creditors . Average Credit Purchase Per Day Exercise 1 From the following information extracted from the books of a manufacturing company, compute the operating cycle in days and the amount of working capital required:
  • 174.
    158 Financial Management PeriodCovered 365 days Average period of credit allowed by suppliers 16 days Average Total of Debtors Outstanding 480 00 Raw Material Consumption 4,400 00 Total Production Cost 10,000 00 Total Cost of Sales 10,500 00 Sales for the year 16,000 00 Value of Average Stock maintained: Raw Material 320 00 Work-in-progress 350 00 Finished Goods 260 00 (ICWA Final, JUNE, 1986 adapted) Solution Computation of Operating Cycle (i) Raw material held in stock: Average stocks of raw materials held Average consumption per day = 320 4,400 × 365 = 320 × 365 4,400 = 275 days Less: Average credit period granted by Suppliers 16 days 11 days (ii) Work-in-progress: Average WIP maintained Average cost of production per day = 350 10,000/365 = 365 × 320 10,000 = 13 days (iii) Finished good held in stock: Average finished goods maintained Average cost of goods sold per days = 260 10,500/365 = 260 × 365 10,500 = 9 days
  • 175.
    Working Capital 159 (iv)Credit period allowed to debtors: Average total of outstanding debtors Average credit sales per day = 480 16,000 × 365 = 365 × 480 16,000 = 11days Total operating cycle period: (i) + (ii) + (iii) + (iv) = 44 days Number of Operating cycles in a year = 365/44 = 8.30 Amount of Working Capital required = Total operating cost Number of operating cycles in a year = 10,500/8.3 = Rs. 1,265 Alternatively, the amount of working capital could have also been calculated by estimating the components of working capital method, as shown below: Value of Average Stock Maintained 320 Raw Material 350 Work-in-progress 260 Finished Goods 480 Average Debtors Outstanding: 1,410 Less: Average Creditors Outstanding 145 1,265 WORKING CAPITAL MANAGEMENT POLICY Working Capital Management formulates policies to manage and handle efficiently; for that purpose, the management established three policies based on the relationship between Sales and Working Capital. 1. Conservative Working Capital Policy. 2. Moderate Working Capital Policy. 3. Aggressive Working Capital Policy. 1. Conservative working capital policy: Conservative Working Capital Policy refers to minimize risk by maintaining a higher level of Working Capital. This type of Working Capital Policy is suitable to meet the seasonal fluctuation of the manufacturing operation.
  • 176.
    160 Financial Management 2.Moderate working capital policy: Moderate Working Capital Policy refers to the moderate level of Working Capital maintainance according to moderate level of sales. It means one percent of change in Working Capital, that is Working Capital is equal to sales. 3. Aggressive working capital policy: Aggressive Working Capital Policy is one of the high risky and profitability policies which maintains low level of Aggressive Working Capital against the high level of sales, in the business concern during a particular period. Conservative Policy Moderate Policy Aggressive Policy Current Assets Sales Fig. 10.9 Working Capital Policies SOURCES OF WORKING CAPITAL Working Capital requirement can be normalized from short-term and long-term sources. Each source will have both merits and limitations up to certain extract. Uses of Working Capital may be differing from stage to stage. Sources Long-term Short-term Shares Debenture Public Deposit Loans from Financial Institutions Retained Earning Bank Loan and Credit Arrangements Advances Installment Credit Short-term Instruments Fig. 10.10 Sources of Working Capital
  • 177.
    Working Capital 161 Theabove sources are also classified into internal sources and external sources of working capital. Internal sources such as: • Retained Earnings • Reserve and Surplus • Depreciation Funds etc. External sources such as: • Debentures and Public Deposits • Loans from Banks and Financial Institutions • Advances and Credit • Financial arrangements like Factoring, etc. Determining the Finance Mix Determining the finance mix is an important part of working capital management. Under this decision, the relationship among risk, return and liquidity are measured and also which type of financing is suitable to meet the Working Capital requirements of the business concern. There are three basic approaches for determining an appropriate Working Capital finance mix. 1. Hedging or matching approach 2. Conservative approach 3. Aggressive approach. Hedging Approach Hedging approach is also known as matching approach. Under this approach, the business concern can adopt a financial plan which matches the expected life of assets with the expected life of the sources of funds raised to finance assets. When the business follows matching approach, long-term finance shall be used to fixed assets and permanent current assets and short-term financing to finance temporary or variable assets. Permanent Current Assets Fixed Assets Long-term Financing Financing Time Assets Temporary Current Assets Short-term Fig. 10.11 Financing under Matching Approach
  • 178.
    162 Financial Management ConservativeApproach Under this approach, the entire estimated finance in current assets should be financed from long-term sources and the short-term sources should be used only for emergency requirements. This approach is called as “Low Profit – Low Risk” concept. Permanent Current Assets Fixed Assets Long-term Financing Short-term Time Assets Temporary Current Assets Financing Fig. 10.12 Conservative Approach Aggressive Approach Under this approach, the entire estimated requirement of current assets should be financed from short-term sources and even a part of fixed assets financing be financed from short- term sources. This approach makes the finance mix more risky, less costly and more profitable. Permanent Current Assets Fixed Assets Time Long-term Financing Short-term Assets Temporary Current Assets Financing Fig. 10.13 Aggressive Approach
  • 179.
    Working Capital 163 WORKINGCAPITAL AND BANKING COMMITTEE Banking finance to working capital requirements is a very important part of the business concern. Banks provide finance to business concerns to meet the requirements. To regulate and control bank finance, RBI constitute committees. These committees submit reports with findings and recommendations to formulate the finance policy of the banks. The major committee and the recommendations are as follows: Committee Year Major Recommendations DEHEJIA 1969 Appraisal of credit applications received by banks for granting loan. TANDON 1975 Banks must carry out the realize appraisal for granting loan Fixation of norms for bank lending to industry. CHORE 1980 No bifurcation of cash credit accounts separate limits for peak level and non peak level requirements. MARATHE 1984 Second method of lending to industry, introduction of fast track concept. KANNAN 1997 Regular conduct with the borrowers, periodical monitoring the credit disposition. MODEL QUESTIONS 1. What is working capital? Define it. 2. Discuss the concept of working capital? 3. What are the types of working capital. 4. Explain the needs of working capital. 5. Critically explain the factors affecting the requirement of working capital. 6. Explain the working capital management policy.
  • 180.
  • 181.
    Management of WorkingCapital is also an important part of financial manager. The main objective of the Working Capital Management is managing the Current Asset and Current Liabilities effectively and maintaining adequate amount of both Current Asset and Current Liabilities. Simply it is called Administration of Current Asset and Current Liabilities of the business concern. Management of key components of working capital like cash, inventories and receivables assumes paramount importance due to the fact the major potion of working capital gets blocked in these assets. Meaning Working capital management is an act of planning, organizing and controlling the components of working capital like cash, bank balance inventory, receivables, payables, overdraft and short-term loans. Definition According to Smith K.V, “Working capital management is concerned with the problems that arise in attempting to manage the current asset, current liabilities and the inter- relationship that exist between them”. According to Weston and Brigham, “Working capital generally stands for excess of current assets over current liabilities. Working capital management therefore refers to all aspects of the administration of both current assets and current liabilities”. INVENTORY MANAGEMENT Introduction Inventories constitute the most significant part of current assets of the business concern. It is also essential for smooth running of the business activities.
  • 182.
    166 Financial Management Aproper planning of purchasing of raw material, handling, storing and recording is to be considered as a part of inventory management. Inventory management means, management of raw materials and related items. Inventory management considers what to purchase, how to purchase, how much to purchase, from where to purchase, where to store and when to use for production etc. Meaning The dictionary meaning of the inventory is stock of goods or a list of goods. In accounting language, inventory means stock of finished goods. In a manufacturing point of view, inventory includes, raw material, work in process, stores, etc. Kinds of Inventories Inventories can be classified into five major categories. A. Raw Material It is basic and important part of inventories. These are goods which have not yet been committed to production in a manufacturing business concern. B. Work in Progress These include those materials which have been committed to production process but have not yet been completed. C. Consumables These are the materials which are needed to smooth running of the manufacturing process. D. Finished Goods These are the final output of the production process of the business concern. It is ready for consumers. E. Spares It is also a part of inventories, which includes small spares and parts. Objectives of Inventory Management Inventory occupy 30–80% of the total current assets of the business concern. It is also very essential part not only in the field of Financial Management but also it is closely associated with production management. Hence, in any working capital decision regarding the inventories, it will affect both financial and production function of the concern. Hence, efficient management of inventories is an essential part of any kind of manufacturing process concern. The major objectives of the inventory management are as follows: • To efficient and smooth production process. • To maintain optimum inventory to maximize the profitability. • To meet the seasonal demand of the products.
  • 183.
    Working Capital Management167 • To avoid price increase in future. • To ensure the level and site of inventories required. • To plan when to purchase and where to purchase • To avoid both over stock and under stock of inventory. Techniques of Inventory Management Inventory management consists of effective control and administration of inventories. Inventory control refers to a system which ensures supply of required quantity and quality of inventories at the required time and at the same time prevent unnecessary investment in inventories. It needs the following important techniques. Inventory management techniques may be classified into various types: Inventory Management Technique Techniques Based on Order Quantity Techniques Based on the Records Inventory Budget Inventory Report Aging Schedule HML Analysis VED Analysis ABC Analysis Techniques Based on the Classification Determination of Stock Level Determination of Stock Economic Order Quality Fig. 11.1 Inventory Management Techniques A. Techniques based on the order quantity of Inventories Order quantity of inventories can be determined with the help of the following techniques: Stock Level Stock level is the level of stock which is maintained by the business concern at all times. Therefore, the business concern must maintain optimum level of stock to smooth running of the business process. Different level of stock can be determined based on the volume of the stock.
  • 184.
    168 Financial Management MinimumLevel The business concern must maintain minimum level of stock at all times. If the stocks are less than the minimum level, then the work will stop due to shortage of material. Re-order Level Re-ordering level is fixed between minimum level and maximum level. Re-order level is the level when the business concern makes fresh order at this level. Re-order level=maximum consumption × maximum Re-order period. Maximum Level It is the maximum limit of the quantity of inventories, the business concern must maintain. If the quantity exceeds maximum level limit then it will be overstocking. Maximum level = Re-order level + Re-order quantity – (Minimum consumption × Minimum delivery period) Danger Level It is the level below the minimum level. It leads to stoppage of the production process. Danger level=Average consumption × Maximum re-order period for emergency purchase Average Stock Level It is calculated such as, Average stock level= Minimum stock level + ½ of re-order quantity maximum level 75 500 Stock Level 25 10 0 Optimum Level/Re-order Level Average Stock Level Minimum Level Danger Level Time Fig. 11.2 Determining the Stock Level Lead Time Lead time is the time normally taken in receiving delivery after placing orders with suppliers. The time taken in processing the order and then executing it is known as lead time.
  • 185.
    Working Capital Management169 Safety Stock Safety stock implies extra inventories that can be drawn down when actual lead time and/ or usage rates are greater than expected. Safety stocks are determined by opportunity cost and carrying cost of inventories. If the business concerns maintain low level of safety stock, it will lead to larger opportunity cost and the larger quantity of safety stock involves higher carrying costs. Economic Order Quantity (EOQ) EOQ refers to the level of inventory at which the total cost of inventory comprising ordering cost and carrying cost. Determining an optimum level involves two types of cost such as ordering cost and carrying cost. The EOQ is that inventory level that minimizes the total of ordering of carrying cost. EOQ can be calculated with the help of the mathematical formula: EOQ = 2ab/c Where, a = Annual usage of inventories (units) b = Buying cost per order c = Carrying cost per unit Minimum Total Cost Carrying Cost Ordering Cost Order Size Cost Q Fig. 11.3 Economic Order Quantity Exercise 1 (a) Find out the economic order quantity and the number of orders per year from the following information: Annual consumption: 36,000 units Purchase price per units: Rs. 54
  • 186.
    170 Financial Management Orderingcost per order: Rs. 150 Inventory carrying cost is 20% of the average inventory. Solution Inventory = 2AO C A = 36,000 units O = Rs. 150 C = 20% of 54×10×8 2×36,000×150 = 1,000 units EOQ = 1,000 units Exercise 2 From the following information calculate, (1) Re-order level (2) Maximum level (3) Minimum level (4) Average level Normal usage: 100 units per week Maximum usage: 150 units per week Minimum usage: 50 units per week Re-order quantity (EOQ) 500: units Log in time: 5 to 7 weeks Solution (1) Re-order Level = Maximum consumption × Maximum Re-order period = 150×7=1050 units (2) Maximum Level = Re-order level+Re-order quantity –( Minimum consumption×Minimum delivery period) = 1050 + 500 – (50 × 5) = 1300 units (3) Minimum Level = Re-order level – (Normal consumption×Normal delivery period) = 1050 – (100 × 6 ) = 450 units (4) Average Level = Maximum level + Minimum level 2 = 1300 + 450 2 = 875 units.
  • 187.
    Working Capital Management171 TECHNIQUES BASED ON THE CLASSIFICATION OF INVENTORIES A-B-C analysis It is the inventory management techniques that divide inventory into three categories based on the value and volume of the inventories; 10% of the inventory’s item contributs to 70% of value of consumption and this category is known as A category. About 20% of the inventory item contributes about 20% of value of consumption and this category is called category B and 70% of inventory item contributes only 10% of value of consumption and this category is called C category. Inventory Breakdown Between Value and Volume Category Volume (%) Value (%) A 10 70 B 20 20 C 70 10 Total 100 100 ABC analysis can be explained with the help of the following Graphical presentation. Value of Inventory (%) Volume of Inventory (%) A B C Fig. 11.4 ABC Analysis Aging Schedule of Inventories Inventories are classified according to the period of their holding and also this method helps to identify the movement of the inventories. Hence, it is also called as, FNSD analysis— where, F = Fast moving inventories N = Normal moving inventories S = Slow moving inventories D = Dead moving inventories
  • 188.
    172 Financial Management Thisanalysis is mainly calculated for the purpose of taking disposal decision of the inventories. VED Analysis This technique is ideally suited for spare parts in the inventory management like ABC analysis. Inventories are classified into three categories on the basis of usage of the inventories. V = Vital item of inventories E = Essential item of inventories D = Desirable item of inventories HML Analysis Under this analysis, inventories are classified into three categories on the basis of the value of the inventories. H = High value of inventories M = Medium value of inventories L = Low value of inventories TECHNIQUES ON THE BASIS OF RECORDS A. Inventory budget It is a kind of functional budget which facilitates the estimated inventory required for the business concern during a particular period. This budget is prepared based on the past experience. B. Inventory reports Preparation of periodical inventory reports provides information regarding the order level, quantity to be procured and all other information related to inventories. On the basis of these reports, Management takes necessary decision regarding inventory control and Management in the business concern. Valuation of Inventories Inventories are valued at different methods depending upon the situation and nature of manufacturing process. Some of the major methods of inventory valuation are mentioned as follows: 1. First in First Out Method (FIFO) 2. Last in First Out Method (LIFO) 3. Highest in First Out Method (HIFO) 4. Nearest in First Out Method (NIFO) 5. Average Price Method
  • 189.
    Working Capital Management173 6. Base Stock Method 7. Standard Price Method 8. Market Price Method Exercise 3 From the particulars given below write up the stores ledger card : 1988 January 1, Opening stock 1,000 units at Rs. 26 each. 5 Purchased 500 units at Rs. 24.50 each. 7 Issued 750 units. 10 Purchased 1,500 units at Rs. 24 each. 12 Issued 1,100 units. 15 Purchased 1,000 units at Rs. 25 each. 17 Issued 500 units. 18 Issued 300 units. 25 Purchased 1,500 units at Rs. 26 each. 29 Issued 1,500 units. Adopt the FIFO and LIFO method of issue and ascertain the value of the closing stock. CASH MANAGEMENT Business concern needs cash to make payments for acquisition of resources and services for the normal conduct of business. Cash is one of the important and key parts of the current assets. Cash is the money which a business concern can disburse immediately without any restriction. The term cash includes coins, currency, cheques held by the business concern and balance in its bank accounts. Management of cash consists of cash inflow and outflows, cash flow within the concern and cash balance held by the concern etc. Motives for Holding Cash 1. Transaction motive It is a motive for holding cash or near cash to meet routine cash requirements to finance transaction in the normal course of business. Cash is needed to make purchases of raw materials, pay expenses, taxes, dividends etc. 2. Precautionary motive It is the motive for holding cash or near cash as a cushion to meet unexpected contingencies. Cash is needed to meet the unexpected situation like, floods strikes etc.
  • 190.
    174 Financial Management (A) First inFirst out Method FIFO Method Receipts Issues Balance Date Particulars Qty. Rate Amount Qty. Rate Amount Qty. Rate Amount Or Units Rs. P. Rs. Units Rs. P. Rs. Units Rs. P. Rs. Reference 1998 Jan. 1 Balance B/d 1,000 26.00 26,000 5 G.R.N. No. 500 24.50 12,250 1,000 26.00 26,000 500 24.50 12,250 7 M.R. No. 750 26.00 19,500 250 26.00 6,500 500 24.50 12,250 10 G.R.N. No. 1,500 24.00 36,000 250 26.00 6,500 500 24.50 12,250 1,500 24.00 36,000 250 26.00 6,500 500 24.50 12,250 350 24.00 8,400 1,150 24.00 27,600 12 M.R. No. 1,100 15 G.R.N No. 1,000 25.00 25,000 1,150 24.00 27,600 1,000 25.00 25,000 17 M.R No. 500 24.00 12,000 650 24.00 15,600 1,000 25.00 25,000 18 M.R. No. 300 24.00 7,200 350 24.00 8,400 1,000 25.00 25,000 25 G.R.N. No. 1,500 26.00 39,000 350 24.00 8,400 1,000 25.00 25,000 1,500 26 39,000 350 24.00 8,400 1,000 25.00 25,000 150 26.00 3,900 1,350 26.00 35,100 29 M.R. No 1,500 Closing stock 1,350 units at Rs. 26 each = Rs. 35,100 Note : G.R.N. No. = Goods Received Note Number. M.R. No. = Material Requisition Number.
  • 191.
    Working Capital Management 175 Receipts Issues Balance DateParticulars Qty. Rate Amount Qty. Rate Amount Qty. Rate Amount Or Units Rs. P. Rs. Units Rs. P. Rs. Units Rs. P. Rs. Reference 1998 Jan. 1 Balance B/d 1,000 26.00 26,000 5 G.R.N. No. 500 24.50 12,250 1,000 26.00 26,000 500 24.50 12,250 7 M.R. No. 750 26.00 19,500 250 26.00 6,500 500 24.50 12,250 10 G.R.N. No 1,500 24.00 36,000 250 26.00 6,500 500 24.50 12,250 1,500 24.00 36,000 250 26.00 6,500 500 24.50 12,250 350 24.00 8,400 1,150 24.00 27,600 12 M.R. No 1,100 15 G.R.N. No 1,000 25.00 25,000 1,150 24.00 27,600 1,000 25.00 25,000 17 M.R. No. 500 24.00 12,000 650 24.00 15,600 1,000 25.00 25,000 18 M.R. No. 300 24.00 7,200 350 24.00 8,400 1,000 25.00 25,000 25 G.R.N. No. 1,500 26.00 39,000 350 24.00 8,400 1,000 25.00 25,000 1,500 26.00 39,000 29 M.R. No. 1,500 26.00 39,000 750 26.00 19,500 400 24.00 9,600 200 25.00 5,000 (B) Last in first out method (LIFO) Closing Stock = 1,350 units, valued at Rs. 34,100 (750×26+400×24+200×25) Note : G.R.N. No. = Goods Received Note Number; M.R. No. = Material Requisition Number.
  • 192.
    176 Financial Management 3.Speculative motive It is the motive for holding cash to quickly take advantage of opportunities typically outside the normal course of business. Certain amount of cash is needed to meet an opportunity to purchase raw materials at a reduced price or make purchase at favorable prices. 4. Compensating motive It is a motive for holding cash to compensate banks for providing certain services or loans. Banks provide variety of services to the business concern, such as clearance of cheque, transfer of funds etc. Cash Management Techniques Managing cash flow constitutes two important parts: A. Speedy Cash Collections. B. Slowing Disbursements. Speedy Cash Collections Business concern must concentrate in the field of Speedy Cash Collections from customers. For that, the concern prepares systematic plan and refined techniques. These techniques aim at, the customer who should be encouraged to pay as quickly as possible and the payment from customer without delay. Speedy Cash Collection business concern applies some of the important techniques as follows: Prompt Payment by Customers Business concern should encourage the customer to pay promptly with the help of offering discounts, special offer etc. It helps to reduce the delaying payment of customers and the firm can avoid delays from the customers. The firms may use some of the techniques for prompt payments like billing devices, self address cover with stamp etc. Early Conversion of Payments into Cash Business concern should take careful action regarding the quick conversion of the payment into cash. For this purpose, the firms may use some of the techniques like postal float, processing float, bank float and deposit float. Concentration Banking It is a collection procedure in which payments are made to regionally dispersed collection centers, and deposited in local banks for quick clearing. It is a system of decentralized billing and multiple collection points. Lock Box System It is a collection procedure in which payers send their payment or cheques to a nearby post box that is cleared by the firm’s bank. Several times that the bank deposit the cheque
  • 193.
    Working Capital Management177 in the firms account. Under the lock box system, business concerns hire a post office lock box at important collection centers where the customers remit payments. The local banks are authorized to open the box and pick up the remittances received from the customers. As a result, there is some extra savings in mailing time compared to concentration bank. Slowing Disbursement An effective cash management is not only in the part of speedy collection of its cash and receivables but also it should concentrate to slowing their disbursement of cash to the customers or suppliers. Slowing disbursement of cash is not the meaning of delaying the payment or avoiding the payment. Slowing disbursement of cash is possible with the help of the following methods: 1. Avoiding the early payment of cash The firm should pay its payable only on the last day of the payment. If the firm avoids early payment of cash, the firm can retain the cash with it and that can be used for other purpose. 2. Centralised disbursement system Decentralized collection system will provide the speedy cash collections. Hence centralized disbursement of cash system takes time for collection from our accounts as well as we can pay on the date. Cash Management Models Cash management models analyse methods which provide certain framework as to how the cash management is conducted in the firm. Cash management models are the development of the theoretical concepts into analytical approaches with the mathematical applications. There are three cash management models which are very popular in the field of finance. 1. Baumol model The basic objective of the Baumol model is to determine the minimum cost amount of cash conversion and the lost opportunity cost. It is a model that provides for cost efficient transactional balances and assumes that the demand for cash can be predicated with certainty and determines the optimal conversion size. Total conversion cost per period can be calculated with the help of the following formula: t= Tb C where, T = Total transaction cash needs for the period b = Cost per conversion C = Value of marketable securities
  • 194.
    178 Financial Management Opportunitycost can be calculated with the help of the following formula; i = C 2 where, i = interest rate earned C/2 = Average cash balance Optimal cash conversion can be calculated with the help of the following formula; C = 2bT i where, C = Optimal conversion amount b = Cost of conversion into cash per lot or transaction T = Projected cash requirement i = interest rate earned 2. Miller-Orr model This model was suggested by Miller Orr. This model is to determine the optimum cash balance level which minimises the cost of management of cash. Miller-Orr Model can be calculated with the help of the following formula; C = bE (N) t + iE (M) where, C = Total cost of cash management b = fixed cost per conversion E(M) = expected average daily cash balance E (N) = expected number of conversion t = Number of days in the period i = lost opportunity cost 3. Orgler’s model Orgler model provides for integration of cash management with production and other aspects of the business concern. Multiple linear programming is used to determine the optimal cash management. Orgler’s model is formulated, based on the set of objectives of the firm and specifing the set of constrains of the firm.
  • 195.
    Working Capital Management179 RECEIVABLE MANAGEMENT The term receivable is defined as debt owed to the concern by customers arising from sale of goods or services in the ordinary course of business. Receivables are also one of the major parts of the current assets of the business concerns. It arises only due to credit sales to customers, hence, it is also known as Account Receivables or Bills Receivables. Management of account receivable is defined as the process of making decision resulting to the investment of funds in these assets which will result in maximizing the overall return on the investment of the firm. The objective of receivable management is to promote sales and profit until that point is reached where the return on investment in further funding receivables is less than the cost of funds raised to finance that additional credit. The costs associated with the extension of credit and accounts receivables are identified as follows: A. Collection Cost B. Capital Cost C. Administrative Cost D. Default Cost. Collection Cost This cost incurred in collecting the receivables from the customers to whom credit sales have been made. Capital Cost This is the cost on the use of additional capital to support credit sales which alternatively could have been employed elsewhere. Administrative Cost This is an additional administrative cost for maintaining account receivable in the form of salaries to the staff kept for maintaining accounting records relating to customers, cost of investigation etc. Default Cost Default costs are the over dues that cannot be recovered. Business concern may not be able to recover the over dues because of the inability of the customers. Factors Considering the Receivable Size Receivables size of the business concern depends upon various factors. Some of the important factors are as follows:
  • 196.
    180 Financial Management 1.Sales Level Sales level is one of the important factors which determines the size of receivable of the firm. If the firm wants to increase the sales level, they have to liberalise their credit policy and terms and conditions.Whenthefirmsmaintainmoresales,therewillbeapossibilityoflargesizeofreceivable. 2. Credit Policy Credit policy is the determination of credit standards and analysis. It may vary from firm to firm or even some times product to product in the same industry. Liberal credit policy leads to increase the sales volume and also increases the size of receivable. Stringent credit policy reduces the size of the receivable. 3. Credit Terms Credit terms specify the repayment terms required of credit receivables, depend upon the credit terms, size of the receivables may increase or decrease. Hence, credit term is one of the factors which affects the size of receivable. 4. Credit Period It is the time for which trade credit is extended to customer in the case of credit sales. Normally it is expressed in terms of ‘Net days’. 5. Cash Discount Cash discount is the incentive to the customers to make early payment of the due date. A special discount will be provided to the customer for his payment before the due date. 6. Management of Receivable It is also one of the factors which affects the size of receivable in the firm. When the management involves systematic approaches to the receivable, the firm can reduce the size of receivable. Exercise 4 The board of directors of Aravind mills limited request you to prepare a statement showing the working capital requirements for a level of activity of 30,000 units of output for the year. The cost structure for the company’s product for the above mentioned activity level is given below. Cost per Unit (Rs.) Raw materials 20 Direct labour 5 Overheads 15 Total 40 Profit 10 Selling price 50
  • 197.
    Working Capital Management181 (a) Past experience indicates that raw materials are held in stock, on an average for 2 months. (b) Work in progress (100% complete in regard to materials and 50% for labour and overheads) will be half a month’s production. (c) Finished goods are in stock on an average for 1 month. (d) Credit allowed to suppliers: 1 month. (e) Credit allowed to debtors: 2 months. (f) A minimum cash balance of Rs 25,000 is expected to be maintained. Prepare a statement of working capital requirements. Solution Output per annum = 30,000 units Output per annum = 12% of 30,000 =2,500 units Raw materials p. m. Rs. 20×2500 = 50,000 Labour p. m. Rs. 5×2,500 = 12,500 Overheads p. m. Rs. 15×2,500 = 37,500 1,00,000 Statement of Working Capital Requirements Particulars Rs. Rs. Current assets Stock of raw materials (2 months) 50,000 x 2 1,00,000 Work-in-progress (1/2 months) Raw materials = 50,000 x ½ 25,000 Labour = 12,500 x ½ x 50/100 3,125 Overheads = 37,500 x ½ x 50/100 9,375 37,500 Stock of finished goods (1 month) 1, 00,000 x 1 1,00,000 Debtors (2 month) 1,00,000 x 2 2,00,000 Cash balance required 25,000 4,62,500 Less: current liability Creditors (1 month) 50,000 x 1 50,000 (Working capital required) 4,12,500 Exercise 5 Prepare an estimate of working capital requirement from the following information of a trading concern. Projected annual sales 10,000 units Selling price Rs. 10 per unit
  • 198.
    182 Financial Management Percentageof net profit on sales 20% Average credit period allowed to customers 8 Weeks Average credit period allowed by suppliers 4 Weeks Average stock holding in terms of sales requirements 12 Weeks Allow 10% for contingencies Solution Statement of Working Capital Requirements Current Assets Rs. Debtors (8 weeks) 80,000×8 52 12,307 (at cost) Stock (12 weeks) 80,000×12 52 18,462 30,770 Less: Current Liability Credits (4 weeks) 80,000×4 52 6,154 24,616 Add 10% for contingencies 2,462 Working Capital Required 27,078 Working Notes Sales = 10000×10 = Rs. 1,00,000 Profit 20% of Rs. 1,00,000 = Rs. 20,000 Cost of Sales=Rs.1,00,000 – 20,000 = Rs. 80,000 As it is a trading concern, cost of sales is assumed to be the purchases. Exercise 6 Prepare an estimate of working capital requirement from the following informations of a trading concern. Projected annual sales Rs. 6,50,000 Percentage of net profit on sales 25% Average credit period allowed to debtors 10 Weeks Average credit period allowed by creditors 4 Weeks Average stock holding in terms of sales requirements 8 Weeks Allow 20% for contingencies (M.Com., M.S. University Nov. 2001)
  • 199.
    Working Capital Management183 Solution Statement of Working Capital Requirements Current Assets Rs. Debtors (10 weeks) (at cost) × 5,20,000 10 52 1,00,000 Stock (8 weeks) × 5,20,000 8 52 80,000 1,80,000 Less: Current Liability Credits ( 4 weeks) × 5,20,000 4 52 40,000 1,40,000 Add 20% for contingencies 28,000 (Working Capital Required) 1,68,000 Working Notes Sales=Rs. 6,50,000 Profit 25/125 of Rs. 6,50,000= Rs. 1,30,000 Cost of Sales=Rs. 6,50,000–1,30,000=Rs. 5,20,000 As it is a trading concern, cost of sales is assumed to be the purchases. Exercise 7 A Performa cost sheet of a company provides the following particulars: Elements of cost Material 35% Direct Labours 25% Overheads 20% Further particulars available are: (i) It is proposed to maintain a level of activity of 2,50,000 units. (ii) Selling price is Rs. 10/- per unit (iii) Raw materials are to remain in stores for an average period of one month. (iv) Finished foods are required to be in stock for an average period of one month. (v) Credit allowed to debtors is 3 months. (vi) Credit allowed by suppliers is 2 months. You are required to prepare a statement of working capital requirements, a forecost profit and loss account and balance sheet of the company assuring that Share Capital Rs. 12,00,000 10% Debentures Rs. 3,00,000 Fixed Assets Rs. 11,00,000
  • 200.
    184 Financial Management Solution Statementof Working Capital Particulars Rs. Rs. Current Assets Stock of Raw Materials (1 Month) (5,00,000 x 35% x 1/12) 72,917 Work in process (1/2 months) Materials (25,00,000 x 35% x 1/24) 36,458 Labour (25,00,000 x 25% x 1/24) 26,041 Overheads (25,00,000 x 20% x 1/24) 20,833 83,332 Stock of finished goods (one month) Materials (25,00,000 x 35% x 1/12) 72,917 Labour (25,00,000 x 25% x 1/12) 52,083 Overheads (25,00,000 x 20% x 1/12) 41,667 1,66,667 Debtors (2 months) At cost Materials (25,00,000 x 35% x 3/12) 2,18,750 Labour (25,00,000 x 25% x 3/12) 1,56,250 Overheads (5,00,000 x 20% x 3/12) 1,25,000 5,00,000 8,22,916 Less: Current liability Credits (2 Months) for raw materials 25,00,000 x 35% x 2/12 1,45,833 Net working capital required 6,77,083 Forecast Profit and Loss Account Dr. Cr. To Materials By cost of goods sold 20,00,000 (25,00,000 x 35%) 8,75,000 To Wages (25,00,000 x 25%) 6,25,000 To Overheads (25,00,000 x 20%) 5,00,000 20,00,000 20,00,000 To Cost of goods sold 20,00,000 By Sales 25,00,000 To Gross profit 5,00,000 25,00,000 25,00,000 To Interest on debentures 30,000 By Gross profit 5,00,000 To Net profit 4,70,000 5,00,000 5,00,000
  • 201.
    Working Capital Management185 Forecast Balance Sheet Liabilities Rs. Assets Rs. Share capital 12,00,000 Fixed Assets 11,00,000 Net profit 4,70,000 Stock 10% debentures 3,00,000 Raw material 72,917 Credits 1,45,833 Work-in-process 38,458 Finished goods 1,66,667 Debtors 5,00,000 Cash and Bank Balance 2,37,791 21,15,833 21,15,833 Exercise 8 Selva and Co. desires to purchase a business and has consulted you and one point on which you are to advise them is the average amount of working capital which will be required in the first year’s working. You have given the following estimates and instructed to add 10% to your computed figure to allow for contingencies. (i) Amount blocked up for stocks: Figures for the year Stocks of finished product 3,000 Stocks of stores, materials, etc., 5,000 (ii) Average credit given: Inland sales 4 weeks credit 26,000 Export sales— 1 2 1 weeks credit 65,000 (iii) Lag in payment of wages and other outputs Wages— 1 2 1 weeks 2,40,000 Stocks of materials, etc.— 1 2 1 month 36,000 Rent, Royalties, etc.—4 months 8,000 Clerical staff— 1 2 1 month 60,000 Manager— 1 2 month 4,000 Miscellaneous expenses— 1 2 1 month 36,000 (iv) Payment in advance Sundry Expenses (paid quarterly in advance) 6,000 (v) Undrawn profit on the average throughout the year 9,000 State your calculations for the average amount of working capital required.
  • 202.
    186 Financial Management Solution Statementof Working Capital Particulars Rs. Current Assets Stock of finished products 3,000 Stock of stores material, etc. 5,000 Sundry debtors (a) Inland (4 weeks) 2,60,000 × 4/52 20,000 (b) Export Sales (1 1 2 weeks) 65,000 × 1.5 12 1,875 21,875 Payments in advance 6,000 × ¼ 1,500 31,375 Less: Lag in payment of wages (1 1 2 weeks) 24,000 × 1.5 12 6,923 Stock, Materials etc. (1 1 2 months) 8000 × 6 12 4,500 Rent, Royalties, etc. (6 months) 8000 × 61 12 4,000 Clerical staff (1 1 2 month) 60,000 × 1.5 12 7,500 Manager ( 1 2 month) 4000 × .5 12 167 Miscellaneous Expenses (1 1 2 months) 36,000 × 1.5 12 4,500 27,590 Net Working Capital 3,785 Add: 10% Margin for Contingencies 379 Net working capital required 4,164 Exercise 9 A performa cost sheet of a company provides the following particulars: Elements of Cost Amt. Per Unit (Rs.) Raw Materials 140 Direct Labours 60 Overheads 70 Total Cost 270 Profit 30 Selling Price 300 Further particulars available are: Raw materials are in stock on an average for one month. Materials are in process on an average for half a month. Finished goods are in stock on an average for one month. Credit allowed by suppliers is one month – credit allowed to customers is two months. Lag in payment of wages is 1 1 2 weeks. Lag in payment of overhead expenses is one month. One fourth of the output is sold against cash. Cash in hand and at bank is expected to be Rs. 50,000.
  • 203.
    Working Capital Management187 You are required to prepare a statement showing the working capital needed to finance, a level of activity of 2,40,000 units of production. You may assume that production is carried on evenly throughout the year; wages and overhead accrue similarly and a time period of 4 weeks is equivalent to a month. Note: Year = 4×12 = 48 weeks Solution Statement of Working Capital Particulars Rs. Rs. Current Assets (i) Stock of raw materials (4 weeks) 2,40,000 × 140 48 28,00,000 = 7,00,000× 4 (ii) Work in process (2 weeks) Raw materials 7,00,000 × 2 14,00,000 Direct labour 2,40,000 × 60 48 , 3,00,000 × 2 6,00,000 Overheads 2,40,000 × 70 48 7,00,000 350000 × 2 27,00,000 (iii) Stock of finished good (4 weeks) Raw Materials 7,00,000× 4 28,00,000 Direct Labour 30,000 × 4 1,20,000 Overheads 3,50,000 × 4 14,00,000 54,00,000 (iv) Sundry Debtors (8 weeks) Raw Materials 7,00,000 × 8 × 3 4 42,00,000 Direct Labour 3,00,000 × 8 × 3 4 18,00,000 Overheads 3,50,000 × 8 × 3 4 21,00,000 81,00,000 Cash in hand and at Bank 50,000 1,90,50,000 (–) Current Liabilities (i) Sundry creditors (4 weeks) 7,00,000 × 4 28,00,000 (ii) Wages Outstanding (1 1 2 weeks) 3,00,000 × 3 2 4,50,000 (iii) Lag in payment of overhead (4 weeks) 3,50,000 × 4 14,00,000 46,50,000 Net Working Capital required 1,44,00,000 Exercise 10 Mr. Siva wishes to commerce a new trading business and gives the following informations. (i) The total estimated sales in a year will be Rs. 20,00,000. (ii) His expenses are estimated fixed Expenses of Rs. 3,000 per month plus variable expenses equal to 10% of his turnover. (iii) He expects to fix a sales price for each product which will be 1 3 33 % in excess of his cost of purchase.
  • 204.
    188 Financial Management (iv)He expects to turnover his stock six times in a year. (v) The sales and purchases will be evenly spread throughout the year. All sales will be for cash but he expects one month’s credit for purchases. Calculate (i) His estimated profit for the year. (ii) His average working capital requirements. Solution (i) Estimated profit of Mr. Siva for the year Sales 20,00,000 (–) Gross Profit ( 20,00,000 × 1 1 3 3 33 133 ) 5,00,000 Cost of goods sold 15,00,000 Gross Profit 5,00,000 (–) Expenses Fixed (3,000×12) 36,000 Variable 20,00,000×10/100 2,00,000 2,36,000 Net Profit 2,64,000 (ii) Statement of working capital Particulars Rs. Current Assets Stock Turnover of stock is 6 times 2,50,000 Stock Turnover = Cost of goods sold Average stock at cost 6 = 15,00,000 Average stock at cost 6 × Average stock at cost = 15,00,000 Average stock at cost = 15,00,000 6 = 2,50,000 Cash To meet fixed expenses = 3,000 To meet variable expenses 20,00,000 × 10 100 × 1 12 = 16,667 19,667 Debtors (as all sales are for cash only) – 2,69,667 Less: Current Liabilities: Creditors (1 months) 15,00,000 × 1 12 1,25,000 Working capital required 1,44,667
  • 205.
    Working Capital Management189 Exercise 11 From the informations given below, you are required to prepare a projected balance sheet, profit and loss account and then an estimate of working capital requirements. (a) Issued share capital 5,00,000 6% debentures 2,50,000 Fixed Assets at cost 2,50,000 (b) The expected ratios to selling price are Raw materials 45% Labour 20% Overheads 15% Profit 20% (c) Raw materials are kept in store for an average of 1 1 2 months. (d) Finished goods remain in stock for an average period of 2 months. (e) Production during the previous year was 2,40,000 units and it is planned to maintain the rate in the current year also. (f) Each unit of production is expected to lag in process for half a month. (g) Credit allowed to customers is two months and given by suppliers is one month. (h) Selling price is Rs. 6 per unit. (i) There is a regular production and sales cycle. (j) Calculation of debtors may be made at selling price. Solution Rs. (i) Calculation of sales Total Sales = 2,40,000×6 14,40,000 (ii) Calculation of Amount blocked in inventories. (a) Stock of Raw Material 1,44,000× 45 100 × 1.5 12 81,000 (b) Stock of finished goods at cost (Material + Labour + Overheads) 80 2 1,44,000 100 12 × × 1,92,000
  • 206.
    190 Financial Management (c)Work-in progress at cost (Material + Labour + Overheads) 80 .5 144000× 100 12 × 48,000 (iii) Calculation of Amount locked up in Debtors Total sales 14,40,000 Debtors = 14,40,000× 2 12 2,40,000 (at selling price, as given) (iv) Calculations of creditors (For Raw Materials) Total Purchases = 14,40,000× 45 100 6,48,000 Creditors = 6,48,000× 1 12 54,000 Projected profit and loss account To Cost of Goods sold : By Sales 14,40,000 To Raw Materials 6,48,000 To Labour 2,88,000 To Overheads 2,16,000 To Gross Profit 2,88,000 14,40,000 14,40,000 To Interest on Debentures 15,000 By Gross Profit 2,88,000 To Net Profit 2,73,000 2,88,000 2,88,000 Projected balance sheet Liability Rs. Assets Rs. Rs. Share Capital 5,00,000 Fixed Assets (at cost) 2,50,000 6% Debentures 2,50,000 Current Assets Profit and Loss A/c 2,73,000 Stock 81,000 Creditors 54,000 Work in Process 48,000 Finished Goods 1,92,000 Debtors 2,40,000 5,61,000 Cash and Bank (Balance for) 2,66,000 10,77,000 10,77,000
  • 207.
    Working Capital Management191 Exercise 12 V.S.M. Ltd. is engaged in large scale retail business. From the following informations you are required to forecast their working capital requirements. Projected Annual Sales Rs. 130 lakhs Percentage of net profit on cost of sales 25% Average credit period allowed to debtors 8 weeks. Average credit period allowed by creditors 4 weeks. Average stock carrying 8 weeks (in terms of sales requirements). Add : 10% to computed figures to allow for contingencies. (MBA/MK Uni. May 2005) Solution Sales 1,30,00,000 Gross profit 25% of sales 32,50,000 Cost of goods sold 97,50,000 Statement showing working capital Particulars Rs. Current Assets (i) Debtors (97,50,000 x 8 52 ) 15,00,000 (ii) Stock (97,50,000 x 8 52 ) 15,00,000 Total current assets 30,00,000 (–) Current Liabilities Creditors (97,50,000 x 4 52 ) 7,50,000 Net working capital 22,50,000 Add: Contingencies 10% 2,25,000 Net Working Capital Required 24,75,000 Exercise 13 Prepare an estimate of working capital requirements. (i) Projected annual sales—80,000 units. (ii) Selling price Rs. 8 per unit. (iii) Percentage of profit 20%. (iv) Credit allowed to debtors—10 weeks. (v) Credit allowed to suppliers—8 weeks. (vi) Average stock holding (in terms of sales)—10 weeks. (vii) Allow 20% for contingencies. (MFM/Bharathidasan AP, 2002)
  • 208.
    192 Financial Management Solution Sales80,000 Units Selling Price Rs. 8 Total sales in Rs. 6,40,000 Sales Rs. 6,40,000 Profit 20% of sales 1,28,000 Cost of Goods Sold 5,12,000 Statement of Working Capital Particulars Rs. Current Assets i. Debtors (5,12,000 x 10 52 ) 98,462 ii. Stock (5,12,000 x 10 52 ) 98,462 Total Current Assets 1,96,924 Less: Current Liabilities Creditors (5,12,000 x 8 52 ) 78,769 Net Working Capital 1,18,155 Add : Contingencies 20% 23,631 Net Working Capital Required 1,41,786 Cash Management Exercise 14 A Company expects to have Rs. 37500 cash in hand on 1st April, and requires you to prepare an estimate of cash position during the three months. April, May and June the following information is supplied to you: Month Sales Purchases Wages Factory Office Selling Rs. Rs. Rs. Expenses Expenses Expenses Rs. Rs. Rs. Feb 75,000 45,000 9,000 7,500 6,000 4,500 March 84,000 48,000 9,750 8,250 6,000 4,500 April 90,000 52,500 10,500 9,000 6,000 5,250 May 1,20,000 60,000 13,500 11,250 6,000 6,570 June 1,35,000 60,000 14,250 14,000 7,000 7,000 Other Information: (i) Period of credit allowed suppliers 2 months. (ii) 20% of sales for cash and period of credit allowed to customers for credit is one month. (iii) Delay in payment of all expenses:1 month.
  • 209.
    Working Capital Management193 (iv) Income tax of Rs. 57,500 is due to be paid on June 15th. (v) The company is to pay dividend to shareholders and bonus to workers of Rs. 15,000 and Rs. 22,500 respectively in the month of April. (vi) A plant has been ordered to be received and paid in May. It will cost Rs. 1,20,000. (Periyar University M.Com., Nov. 2005) Cash Budgets of April, May, June Particulars April May June Opening Balance b/d 37,500 10,950 Sales (i) Cash 20% 18,000 24,000 27,000 (ii) Credit sales 67,200 72,000 96,000 (One month) Total Receipts (A) 1,22,700 1,06,950 1,23,000 Payments : Purchase 45,000 48,000 52,500 Wages 10,500 13,500 14,250 Factory Expenses 8,250 9,000 11,250 Office Expenses 6,000 6,000 6,000 Selling Expenses 4,500 5,250 6,570 Income Tax – – 57,500 Dividend to Shareholders 15,000 – – Bonus to workers 22,500 – – Plant Cost – 1,20,000 – Total Payments (B) 1,11,750 2,01,750 1,48,070 Balance c/d (A-B) 10,950 (–)94,800 (–)25,070 Bank Overdraft – (+)94,800 (+)25,070 Assumed that the company has arranged overdraft facility. Receivable Management Exercise 15 A Company’s collection period pattern is as follows: • 10% of sales in the same month • 20% of sales in the second month • 40% of sales in the third month • 30% of sales in the fourth month The sales of the company for the first three quarters of the year are as follows: Month Quarter I Quarter II Quarter III First 15,000 7,00 22,500 Second 15,000 15,000 15,000 Third 15,000 22,500 7,500 45,000 45,000 45,000
  • 210.
    194 Financial Management WorkingDays 90 90 90 You are required to calculate the average age of receivables and comment upon the results. (MFM/Bharathidasan University AP 2001) Solution The collection period of the company’s policy indicates that the outstanding receivables at the end of each month will consist of 90% of the month’s sales, 70% of the previous month’s sales and 30% of the sales made two months earlier. Statement of Accounts receivable and their age. Sales I Quarter II Quarter III Quarter 30% 1st Month 4,500 2,250 6,750 70% 2nd Month 10,500 10,500 10,500 90% 3rd Month 13,500 20,250 6,700 28,500 33,000 24,000 Average of receivable is = Accounts receivable (Debtors) Sales × No. of working days = 28,500 45,000 ×90 33,000 45,000 × 90 24,000 45,000 × 90 = 57 Days 66 Days 48 Days The average age of receivable is affected because of sales is fluctuation. MODEL QUESTIONS 1. Discuss the objectives of inventories. 2. Explain various inventory control techniques. 3. What are the techniques of classification of inventory? 4. Explain the motives of holding cash. 5. Discuss the cash management techniques. 6. What is receivable management? Explain it. 7. S Ltd. is engaged in large-scale retail business. From the following particulars you are required to calculate the working capital requirement. Project annual sales Rs. 208 lakhs % of net profit on cost of sales 1 3 33 %
  • 211.
    Working Capital Management195 Average credit period allowed to Drs. 6 weeks Average credit period allowed to Crs. 3 weeks Average stock (in term of sales) 6 weeks Add 10% to allow for contingencies. (Ans. 29.7 lakhs) 8. The following details relating to Mr. Santosh want to start trading business. You are required to calculate. (a) Estimate profit. (b) Working capital requirements. Estimate annual sales – Rs. 12,00,000 Expected profit on purchase – 1 3 33 % Fixed expenders Rs. 3,000 pm. of which Depreciation amounts to Rs. 600 and variable Expenders chargeable to PLL a/c equal 8% of sales. Stock term over – 6 times Sales and purchases will occur evenly throughout the year Creditors allowed 1 month credit Debtors allowed 2 months credit 30% of cash sales. (Ans. (a)Net Profit Rs. 1,68,000 (b) Working capital Rs. 32,25,400) 9. Calculate the working capital from the following particulars: Rs. (a) Annual Expenses: Wages 52,000 Stores and Material 9,600 Office Salaries 12,480 Rent 2,000 Other Expenses 9,600 (b) Average amount of stock to be maintained: Stock of finished goods 1,000 Stock of materials and stores 1,600 Expenses paid in advance: Quarterly advance 1,600 p.a. (c) Annual Sales Home Market 62,400 Foreign Market 15,600
  • 212.
    196 Financial Management (d)Lag in payment of expenses: Wages 1 1 2 weeks Stores and Material 1 1 2 months Office Salaries 1 1 2 months Rent 6 months Other Expenses 1 1 2 months (e) Credit allowed to customers : Home Market 6 weeks Foreign Market 1 1 2 weeks (M.Com. Rajasthan) (Ans. 5,230) 10. Arvind Ltd. supplies the following informations for calculating the working capital firm levels of activity of Rs. 2,40,000 units. The cost structure particulars are: Cost Per Unit Rs. Raw materials 30 Direct labour 10 over-heads 20 Total 60 Profit 15 Selling price 75 (a) Raw materials are in store on average for 1 month. (b) Work in process (100% complete in regard to materials and 50% for labour and overheads for half a month’s production. (c) Finished goods remain in godown on average for a month. (d) Suppliers one month to customers 2 months (calculation of customers may be made on selling price). (e) Minimum cash balance required is Rs, 30,000. (f) The production is evenly throughout the year. (Ans. Rs. 46,80,000) 11. The Board of Directors of Nanak Engineering Company Private Ltd. request you to prepare a statement showing the working Capital Requirements for a level of activity of Rs. 1,56,000 units of production.
  • 213.
    Working Capital Management197 The following informations are available for your calculations: (A) Per unit (Rs.) Raw Materials 90 Direct Labour 40 Overheads 75 205 Profit 60 Selling price per unit 265 (B) (i) Raw materials are in stock, on average one month. (ii) Materials are in process, on average 2 weeks. (iii) Finished goods are in stock, on average one month. (iv) Credit allowed by suppliers, one month. (v) Time lag in payment from debtors, 2 months. (vi) Lag in payment of wages, 1 1 2 weeks. (vii) Lag in payment of overheads is one month. 20% of the output is sold against cash. Cash in hand and at bank is expected to be Rs. 60,000. It is to be assumed that production is carried on evenly throughout the year; wages and overheads accrue similarly and a time period of 4 weeks is equivalent to a month. (C.A. Final) (Ans. 66,06,000) 12. A company Ltd. supplies the following cost sheet: Element of cost Raw material — 45% Labour — 15% Overheads — 25% The following further particulars are available. (i) Raw materials remain in shares 5 weeks. (ii) Cash in processing 4 weeks. (iii) Finished goods in own house 6 weeks. (iv) Credit period to customers 8 weeks supplie 4 weeks. (v) Lag in payment wages 2 weeks. (vi) Selling price per unit Rs. 60. You are required to prepare the working capital requirements adding 15% for contribution in all levels of activity of 1,04,000 units of production made during the period. (Ans. Rs. 20,17,100) Note: Debtors, calculate on the basis of cost.
  • 214.
    198 Financial Management 13.On 1 April the director of XYZ Ltd. wants to know the amount of working capital required for the fourth coming year. Prepare a working capital and for cost the Balance sheet. Issued share capital — Rs. 3,00,000 6% Debentures (floating charge on assets) — Rs. 1,00,000 Fixed assets — Rs. 1,50,000 Production during the previous year — 72,000 units Same level should continue during the current year. The following is the cost sheet: Raw materials — 40%. Directs — 15% Overheads — 25% Raw materials are to remain in stock for 1 month, within process half a month, finished goods in warehouse for two months. Credit allowed to debtors 2 months and creditors 1 month. Selling price Rs. 8. Work-in-process may be assumed to be 100%. Complete in materials, one 50% complete in direct ways and overheads. (Ans. W/C Rs. 1,72,800; NP 1,09,200; B/S 4,00,000; Rs. 58,000 cash/bank balancing figure)
  • 215.
    This chapter dealswith some of the important special finance such as leasing, venture capital, foreign direct investment etc. and also this chapter covers the advantages and disadvantages, application in the present position and institution, which are providing. These finance to the business concern. This part is divided into the following major parts such as: 1. Lease Financing 2. Venture Capital 3. Factoring 4. Foreign Direct Investment 5. Merchant Banking 6. Credit Rating 7. Mutual Funds LEASE FINANCING Lease financing is one of the popular and common methods of assets based finance, which is the alternative to the loan finance. Lease is a contract. A contract under which one party, the leaser (owner) of an asset agrees to grant the use of that asset to another leaser, in exchange for periodic rental payments. Lease is contractual agreement between the owner of the assets and user of the assets for a specific period by a periodical rent. Definition of Leasing Lease may be defined as a contractual arrangement in which a party owning an asset provides the asset for use to another, the right to use the assets to the user over a certain period of time, for consideration in form of periodic payment, with or without a further payment.
  • 216.
    200 Financial Management Accordingto the equipment leasing association of UK definition, leasing is a contract between the lesser and the leaser for hire of a specific asset selected from a manufacturers or vender of such assets by the lessee. The leaser retains the ownership of the asset. The leassee pass possession and uses the asset on payment for the specified period. Elements of Leasing Leasing is one of the important and popular parts of asset based finance. It consists of the following essential elements. One should understand these elements before they are going to study on leasing. 1. Parties: These are essentially two parties to a contract of lease financing, namely the owner and user of the assets. 2. Leaser: Leaser is the owner of the assets that are being leased. Leasers may be individual partnership, joint stock companies, corporation or financial institutions. 3. Lease: Lease is the receiver of the service of the assets under a lease contract. Lease assets may be firms or companies. 4. Lease broker: Lease broker is an agent in between the leaser (owner) and lessee. He acts as an intermediary in arranging the lease deals. Merchant banking divisions of foreign banks, subsidiaries indian banking and private foreign banks are acting as lease brokers. 5. Lease assets: The lease assets may be plant, machinery, equipments, land, automobile, factory, building etc. Term of Lease The term of lease is the period for which the agreement of lease remains for operations. The lease term may be fixed in the agreement or up to the expiry of the assets. Lease Rental The consideration that the lesae pays to the leaser for lease transaction is the rental. Type of Leasing Leasing, as a financing concept, is an arrangement between two parties for a specified period. Leasing may be classified into different types according to the nature of the agreement. The following are the major types of leasing as follows: (A) Lease based on the term of lease 1. Finance Lease 2. Operating Lease (B) Lease based on the method of lease 1. Sale and lease back 2. Direct lease
  • 217.
    Special Financing 201 (C)Lease based in the parties involved 1. Single investor lease 2. Leveraged lease (D) Lease based in the area 1. Domestic lease 2. International lease 1. Financing lease Financing lease is also called as full payout lease. It is one of the long-term leases and cannot be cancelable before the expiry of the agreement. It means a lease for terms that approach the economic life of the asset, the total payments over the term of the lease are greater than the leasers initial cost of the leased asset. For example: Hiring a factory, or building for a long period. It includes all expenditures related to maintenance. 2. Operating lease Operating lease is also called as service lease. Operating lease is one of the short-term and cancelable leases. It means a lease for a time shorter than the economic life of the assets, generally the payments over the term of the lease are less than the leaser’s initial cost of the leased asset. For example: Hiring a car for a particular travel. It includes all expenses such as driver salary, maintenance, fuels, repairs etc. 3. Sale and lease back Sale and lease back is a lease under which the leasee sells an asset for cash to a prospective leaser and then leases back the same asset, making fixed periodic payments for its use. It may be in the firm of operating leasing or financial leasing. It is one of the convenient methods of leasing which facilitates the financial liquidity of the company. 4. Direct lease When the lease belongs to the owner of the assets and users of the assets with direct relationship it is called as direct lease. Direct lease may be Dipartite lease (two parties in the lease) or Tripartite lease. (Three parties in the lease) 5. Single investor lease When the lease belongs to only two parties namely leaser and it is called as single investor lease. It consists of only one investor (owner). Normally all types of leasing such as operating, financially, sale and lease back and direct lease are coming under this categories. 6. Leveraged lease This type of lease is used to acquire the high level capital cost of assets and equipments. Under this lease, there are three parties involved; the leaser, the lender and the lessee. Under the leverage lease, the leaser acts as equity participant supplying a fraction of the total cost of the assets while the lender supplies the major part.
  • 218.
    202 Financial Management 7.Domestic lease In the lease transaction, if both the parties belong to the domicile of the same country it is called as domestic leasing. 8. International lease If the lease transaction and the leasing parties belong to the domicile of different countries, it is called as international leasing. Advantages of Leasing Leasing finance is one of the modern sources of finance, which plays a major role in the part of the asset based financing of the company. It has the following important advantages. 1. Financing of fixed asset Lease finance helps to mobilize finance for large investment in land and building, plant and machinery and other fixed equipments, which are used in the business concern. 2. Assets based finance Leasing provides finance facilities to procure assets and equipments for the company. Hence, it plays a important and additional source of finance. 3. Convenient Leasing finance is convenient to the use of fixed assets without purchasing. This type of finance is suitable where the company uses the assets only for a particular period or particular purpose. The company need not spend or invest huge amount for the acquiring of the assets or fixed equipments. 4. Low rate of interest Lease rent is fixed by the lease agreement and it is based on the assets which are used by the business concern. Lease rent may be less when compared to the rate of interest payable to the fixed interest leasing finance like debt or loan finance. 5. Simplicity Lease formalities and arrangement of lease finance facilities are very simple and easy. If the leaser agrees to use the assets or fixed equipments by the lessee, the leasing arrangement is mostly finished. 6. Transaction cost When the company mobilizes finance through debt or equity, they have to pay some amount as transaction cost. But in case of leasing finance, transaction cost or floating cost is very less when compared to other sources of finance. 7. Reduce risk Leasing finance reduces the financial risk of the lessee. Hence, he need not buy the assets and if there is any price change in the assets, it will not affect the lessee.
  • 219.
    Special Financing 203 8.Better alternative Now a days, most of the commercial banks and financial institutions are providing lease finance to the industrial concern. Some of the them have specialised lease finance company. They are established to provide faster and speedy arrangement of lease finance. Leasing Finance Institutions in India Presently, leasing finance becomes popular and effective financial sources for most of the business concerns. With the importance of lease finance, now a days banks and financial institutions provide leasing financial assistance to the industrial concern. The following institutions are famous and widely providing lease finance in India: Leasing financial institutions in India may be classified into the following groups. Leasing Institutions Public Sector Private Sector Leasing Institutions Leasing Institutions Leasing by Development Institutions Leasing by Specialized Institutions Leasing Company Finance Company Fig. 12.1 Leasing Institutions Leasing by Development Institutions All India development institutions are providing leasing finance assistance to industrial concerns. Some of the public sector leasing finance company in India are follows: • Industrial Credit & Investment Corporation of India (ICICI) • Industrial Finance Corporation of India (IFCI) • Industrial Investment Bank of India (IIBI) • Small Industries Development Corporation (SIDC) • State Industrial Investment Corporation (SIIC) Leasing by Specialized Institutions Specialized financial institutions also provide lease finance to the industrial concern. Some of the lease finance providing institutions are as follows: • Life Insurance Corporation of India (LIC) • General Insurance Corporation of India (GIC)
  • 220.
    204 Financial Management •Unit Trust of India (UTI) • Housing Development Finance Corporation of India (HDFC) Private Sector Leasing Company Private sector leasing companies also provide financial assistance to the industrial concerns. The following are the example of the private sector leasing companies in India: • Express Leasing Limited • 20th Century Leasing Corporation Ltd. • First Leasing Company of India • Mazda Leasing Limited • Grover Leasing Limited Private Sector Financial Company Private sector financial companies also involve in the field of leasing finance. The following are the example of the private sector finance companies: • Cholamandal Investment and Finance Company Ltd. • Dcl Finance Limited • Sundaram Finance Limited • Anagram Finance Limited • Nagarjuna Finance Limited. VENTURE CAPITAL Introduction Venture Capital finance is a new type of financial intermediary which has emerged in India during 1980s. It is a long-term financial assistance provided to projects, which are established to introduce new products, inventions, idea and technology. Venture capital finance is more suitable to risky oriented business which consists of huge investment and provides results after 5 to 7 year. Meaning of Venture Capital The term Venture Capital fund is usually used to denote Mutual funds or Institutional investors. They provide equity finance or risk capital to little known, unregistered, highly risky, young and small private business, especially in technology oriented and knowledge intensive business. Venture Capital termed as long-term funds in equity or semi-equity form to finance hi-tech projects involving high risk and yet having strong potential of high profitability. Definition of Venture Capital According to Jame Koloski Morries, venture capital is defined as providing seed, start up and first stage financing and also funding expansion of companies that have already
  • 221.
    Special Financing 205 demonstratedtheir business potential but do not yet have access to the public securities market or to credit oriented institutional funding sources. Venture Capital also provides management in leveraged buy out financing. 1995 finance bill define Venture Capital as long-term equity investment in novel technology based projects with display potential for significant growth and financial return. Features of Venture Capital Venture Capital consists of the following important features: (1) Venture Capital consists of high risk and high return based financing. (2) Venture Capital financing is equity and quasi equity financing instruments. (3) Venture Capital provides moderate interest bearing instruments. (4) Venture Capital reduces the financial burden of the business concern at the initial stage. (5) Venture Capital is suitable for risky oriented and high technology based industry. Venture Capital in India ICICI Venture Capital is the first Venture Capital Financing in India. It was started in 1988 by the joint venture of ICICI and UTI. The UTI launched Venture Capital Unit Scheme (VECAUS-I) to raise finance in 1990. Technology Development and Information Company (TDICI) is another major Venture Capital financing institution in India. Risk Capital and Technology Finance Corporation Ltd. (RCIFC) provides Venture Capital finance to technology based industries. ANZ Grindlays Bank has set up India’s first private sector Venture Capital fund. SBI and Canara Bank are also involved in Venture Capital Finance. They provide either equity capital or conditionals loans. S.No Name of Venture Capital Year Funds under Management 1. Alliance Venture Capital Advisors Ltd May. 1997 SWISS TEC VCF Rs. 1000 Million 2. APIDC–Venture Capital Funds Aug. 1989 APIDE – VCF Rs. 300 Million 3. Baring Private Equity Partners India Ltd. Jan. 1992 BII – off shore fund 4. Canara Bank Venture Capital Fund Ltd. Feb. 1995 Canara Bank Venture Capital Rs.164.25 Million 5. Draper International Mar. 1994 DII Rs. 2090 Million 6. Gujarat Venture Finance Ltd. July. 1990 GVCF Rs. 240 Million 7. HSBC Private Equity Management Mauritius Ltd. Apl. 1995 HSBC equity fund Rs. 2400 million 8. ICF Advisors Pvt. Ltd. July. 1997 Indian capital fund Rs. 750 Million 9. IL and FS Venture Corporation Ltd. Feb. 1986 IT fund Rs. 100 Million 10. Indus Venture Management Ltd. Feb. 1989 IVC Rs. 210 Million Contd....
  • 222.
    206 Financial Management 11.IDBI July. 1984 IDBI – Rs. 1823.32 Million 12. Industrial Venture Capital Ltd. Sep. 1996 TN Venture fund Rs. 90 Million 13. International Venture Capital Management Ltd. Feb. 1996 Nandi Investment $ 30 Million 14. JF Electra Advisors India Ltd. Aug. 1995 JFE–$ 24 Million 15. Marigold Capital Services Ltd. Aug. 1995 MM fund Rs. 200 Million 16. Pathfinder Investment Company Ltd. Nov. 1993 Rs. 299.50 Million 17. Risk Capital and Investment Company Pvt. Ltd. Jan. 1998 Rs.1000 Million 18. SIDBI Apl. 1990 Rs. 600 Million 19. TDICI Ltd. Jan. 1998 Rs. 5500 Million and $ 75 Million 20. Kitven Aug. 1998 Rs. 18 Crore FACTORING Factoring is a service of financial nature involving the conversion of credit bills into cash. Accounts receivables, bills recoverables and other credit dues resulting from credit sales appear, in the books of accounts as book credits. Here the risk of credit, risk of credit worthiness of the debtor and as number of incidental and consequential risks are involved. These risks are taken by the factor which purchase these credit receivables without recourse and collects them when due. These balance-sheet items are replaced by cash received from the factoring agent. Factoring is also called “Invoice Agent” or purchase and discount of all “receivables”. Although these can be with recourse or without recourse, normally the risk is taken by the factoring agent. The discount rate includes the loss of interest, risk of credit and risk of loss of both principal and interest on the amount involved. Myths on Factoring Myth Fact Factoring is nothing but bill discounting or bill finance Factoring and bill discounting are two different products tailored for two different markets. Factoring is meant for “Open account sales” and caters largely to a buyer’s market. Bill discounting is normally prevalent in a seller’s market. Factoring unlike bill discounting offers a continuous relationship. Factoring reduces bankers business Factoring is not merely financing and includes a package of services like collection and follow- up of each invoice, credit insurance. MIS support etc., and improves the health of bank’s clients, improveds cash flow through factoring, increases production cycles and need for more working capital. Factoring essentially aims at replacing high cost market credit and not necessarily reduce bank finance. Contd....
  • 223.
    Special Financing 207 Factoringis an high cost borrowing Comparable to interest rates of banks. (SSI – 13.50% to 15.75% Non-SSI 13.50% to 17.25%) Will to offer SBI’s PLR selectively) Factoring service charge is high Service Charge is 0.1% to 0.3% only whereas in Bills discounting, the collection charge is 0.5% to 0.6%. Factoring is meant for manufacturing units only Extended to all sectors namely Manufacturing, Trading and Services. Factoring limits falls within MBBF/ Assessed Factoring is to be classified as other Current Bank finance liability as per RBI guidelines and Factoring replaces market credit and not bank borrowings. History of the Early Factoring in Roman Factoring has not been documented as having been used by the Romans. However, the word ‘factoring’ has a Roman root. It is derived from the Latin verb ‘facio’ which can be translated as “he who does things”. In Roman times this referred to agent of a property owner, i.e., his business manager. Though the root word has nothing to do with the industry, as they attempt to help their clients through their financial problem. Factoring in United States Factoring arose in the United States during 19th century, as direct result of the inability of manufacturers to maintain constant and timely communications with their sales forces in the field. At that time, as the case today, the sales force was paid by communications. If all sales were at the risk of the manufacturer, the salesman had no incentive to exercise prudence in connection with whom to sell to on credit. On the other hand, the distant manufacturer was not in the position to make the credit risk on sales. The risk of defective or non-conforming merchandise remained with the manufacturer. The credit risk was now separated from disputes as to quality, workmanship and conformity of goods. Soon after, the salesman began to act as independent sales agencies. It was common for them to act for more than one manufacturer. Still later the sales function was separated from the credit function and “Traditional Factoring” as the people know, it had, at that point, developed in the United States. Factoring in India Banks provide generally bill collection and bill discounting and with recourse. They provide working capital finance based on these bills classified by amounts maturity wise. Such bills if accumulated in large quantities will burden the liquidity and solvency position of the company and reduces the credit limits from the banks. It is therefore felt necessary that the company assigns these book debts to a factor for taking them off from the balance sheet. This reduces the workload, increases the solvency and improves the liquidity position of the company.
  • 224.
    208 Financial Management In1998 a study group under the chairmanship of C.S. Kalyana Sundram was constituted to examine the feasibility of factoring services in India, their constitution, organizational set up and scope of activities. The group recommended the setting up of specialized agencies or subsidiaries for providing the factoring services in India with a professional expertise in credit assessment, debt collection and management of sales ledger, and other related services. Defaults or delays in collection and repayment can still remain which is the risk to be taken by the factor for a fee. The group has estimated a good potential for this service to the tune of about Rs. 4000 crores mainly emerging a collection problem, and delays in collection and consequential liquidity problems. Later the Vaghul Committee report on money market reforms has confirmed the need for factoring services to be developed in India as part of the money market instruments. Many new instruments were already introduced like Participation certificates, Commercial papers, Certificate of deposits etc., but the factoring service has not developed to any significant extent in India. The Reserve Bank allowed some banks to set up subsidiaries on a zonal basis to take care of the requirements of companies in need of such service. Thus Canara Bank, State Bank of India, Punjab National Bank and a few other banks have been permitted to set up jointly some factor, for Eastern, Western, Northern, and Southern Zones. The progress of the activity did not show any worth while dimension, so far. Modus of Operations If a company wants to factor its receivables it submits a list of customers, their credit rating, amount involved in maturity and other terms. If the factor scrutinizes the list of buyers and they are in the approved list, the factor gives its decision of the clients and the amounts they may take all receivables on wholesale discounting basis. The factor then takes all the documents in respect of approved list and pays up to 80% to 90% of the amount due less commission to the company which in turn removes these instruments, from base of accounts and shows cash flow as against bills receivables written off. Factoring services rendered the following services: 1. Purchase of book debts and receivables. 2. Administration of sales ledger of the clients. 3. Prepayments of debts partially or fully. 4. Collection of book debts or receivables or with or without documents. 5. Covering the credit risk of the suppliers. 6. Dealing in book debts of customers without recourse. Why Factoring? Factoring is one of the most important and unavoidable part of the business concern which meets the short-term financial requirement of the concern. Factoring is favorable to the industrial concern for the following reasons.
  • 225.
    Special Financing 209 1.Quickest response–Customer oriented timely decisions and decision on sanction within a week. 2. Low cost. 3. Low service charges (0.1% to 0.3%). 4. Low margin (20% onwards). 5. Instant finance–against each invoice. 6. Generous grace period. 7. Improves cashflow. 8. Substitutes sundry creditors. 9. Increases sales through better terms on sales. 10. More operating cycles and more profits. 11. No upfront recovery of charges. 12. Interest on daily products. 13. Very easy to operate. 14. Flexible credit periods. 15. No penal interest up to grace period. 16. Empowers cash purchase. 17. Improves credit reputation. 18. Follow up of each invoice. 19. Collection of receivables. 20. MIS reports like customers overdue invoices enabling constant evaluation of customers. 21. Outstation payments at nominal rates. Mechanics of Factoring (1) Places Order for Goods (3) Delivery of Goods with Notice Pay the Factor CLIENT (SELLER) CUSTOMER (BUYER) (2) Fixation of customer limits (4) Copy of invoice (5) Prepayment up to 80% (9) Balance Amount unpaid (8) Payment. (7) Follow up of Unpaid by Due Date (6) Monthly Statement FACTOR . . . . . . Fig. 12.2 Mechanics of Factoring
  • 226.
    210 Financial Management Thefollowing are the steps for factoring: 1. The customer places an order with the seller (client). 2. The factor and the seller enter into a factoring agreement about the various terms of factoring. 3. Sale contract is entered into with the buyer and the goods are delivered. The invoice with the notice to pay the factor is sent alongwith. 4. The copy of invoice covering the above sale to the factor, who maintains the sale ledger. 5. The factor prepays 80% of the invoice value. 6. The monthly statement are sent by the factor to the buyer. 7. Follow up action is initiated if there are any unpaid invoices. 8. The buyer settles the invoices on the expiry of the credit period allowed. 9. The balance 20% less the cost of factoring is paid by the factor to the client. Types of factoring (1) Notified factoring: Here, the customer is intimated about the assignment of debt to a factor, also directed to make payments to the factor instead of to the firm. This is invariably done by a legend and the invoice has been assigned to or sold to the factor. (2) Non-notified or confidential factoring: Under this facility, the supplier/factor arrangement is not declared to the customer unless or until there is a breach of the agreement on the part of the client, or exceptionally, where the factor considers himself to be at risk. (3) With recourse or without recourse factoring: Under recourse arrangements, the client will carry the credit risk in respect of debts sold to the factor. In without recourse factoring, the bad debts are borne by the factor. (4) Bank Participation Factoring: The client creates a floating charge on the factoring reserves in favour of banks and borrow against these reserves. (5) Export Factoring: There is usually the presence of two factors: an export factor and an import factor. The former buys the invoices of a client exporter and assumes the risk in case of default by the overseas customers. Because of distance, different condition or lake of information, the export factor usually forms out to an agent, known as the import factor, the administrative job of servicing the debts owed to its exporting clients. FOREIGN DIRECT INVESTMENT According to the definition given by JMF, FDI is the category of international investment that reflects the objective of a resident entity in one economy (direct investor or parent enterprise) by obtaining a ‘lasting interest’ and control in an enterprise resident in another economy (direct investment enterprise).
  • 227.
    Special Financing 211 TheIMF definition of FDI includes as many as twelve different elements, namely: equity capital, reinvested earnings of foreign companies, inter-company debt transactions including short-term and long-term loans, overseas commercial borrowings (financial leasing, trade credits, grants, bonds), non cash acquisition of equity, investment made by foreign vantage capital investors, earning data of indirectly held FDI enterprises, control premium, non-competition fee and so on. FDI in India FDI is permitted as under the following form of investments: Through financial collaborations; Through joint ventures and technical collaborations; Through capital markets Via Euro Uses. Through Private Placements or Preferential Allotments 1. The government has reviewed the guidelines pertaining to foreign/technical collaborations under automatic route for foreign financial/technical collaborations with previous ventures/tie-ups in India as per Press Note No. 18 (1998), it has been decided that new proposals for foreign investment/technical collaborations would henceforth be allowed under the automatic route, subject to sectored policies as per the following guidelines. (a) Prior approval of the government would be required only in cases where the foreign investor has an existing joint venture for technology transfer/ trade mark agreement in the ‘same’ field. (b) Even in the above mentioned cases, the approval of the government would not be required in respect of the following : (1) Investments to be made by venture capital funds registered with SEBI. (2) Where the existing joint venture investments by either of the parties is less than 3%; or (3) Where the existing, venture/collaboration is defunct or sick. (c) In so far as joint venture to be ordered after the date of dated January, 12, 2005 are concerned, the joint venture agreement may embody a ‘conflict of interest’ clause to safeguard the interest of joint venture partners in the event of one of the partners desiring to set up another joint venture or a wholly owned subsidiary in the ‘same’ field of economic activity. 2. Increase in the FDI limits in Air Transport Services (Domestic Airlines) up to 49% through automatic route and up to 100% by Non-resident Indians (RRIs) through automatic routes (No direct or indirect equity participation by foreign airlines is allowed). 3. Foreign investment in the banking sector has been further liberalized by raising, FDI limit in private sector books to 74% under the automatic route including, investment by FIIs.
  • 228.
    212 Financial Management 4.FDI in telecom has been raised to 74% subject to certain security measures. From August 1991 to August 2004, 926 proposals of FDI of Rs. 41,368 crore were approved. The actual FDI inflow of approximately Rs. 5,763 crore between January 2001 and August 2004 alone was about 56% of the total FDI flow in telecom since its inception in 1991. In terms of approval of FDI, the telecom sector is the second largest, after power and oil references. 5. FDI in construction sector has been opened. Still some more sectors vis-à-vis retail mining and pension are under the consideration of the government. 6. A part of FDI comes from NRIs, to oversee the difficulties faced by NRIs government has set up a separate NRI Ministry for facilitating hassle free investment procedure and clearances. A Comparative Study Between India and China Country FDI Inflows ($bn) India 0.08 0.24 0.54 0.97 2.15 2.53 3.35 2.64 2.17 2.32 3.40 3.45 4.27 China 4.32 16.16 27.52 33.79 36.85 40.18 44.24 45.46 40.2 40.72 46.88 52.74 53.51 World FDI 1581 168 208 226 332 338 473 691 1087 1388 818 679 560 * 2.22 6.67 13.23 14.98 10.80 11.90 9.35 6.58 3.71 2.93 5.73 7.77 9.56 ** 6.06 0.14 0.26 0.43 0.65 0.75 0.71 0.38 0.20 0.17 0.42 0.51 0.76 * FDI in China as a % of World FDI. ** FDI in India as a % of World FDI. Source : UNCTAD, World Investment Report, Various Issues (1991–2004). Foreign Institutional Investors (FIIs) The Union Government allowed Foreign Institutional Investors to enter both the primary and secondary markets in India under liberalized policy resume. The large inflow and outflow of capital by FIIs affect the sensex movements. A certain degree of front running by the traders in anticipation of FIIs demand also determines the market direction. FIIs have to appoint an agency as consolidation to deal in the securities and reporting. Accounts have to be maintained on daily basis. Semi model reports should be submitted by the custodian to SEBI and RBI. SEBI can conduct direct inspections on the accounting books of a registered FII. A Foreign Institutional Investor is permitted to appoint more than one domestic custodian with prior approval of the Board but only one custodian may be appointed for a single sub-account of FIIs. SEBI and FIIs SEBI announced its guidelines for FIIs registration and their operations in India in 1992 in February, 1993 SEBI has granted registration to 12 FIIs for investing in the Indian Stock market. At the end of 1996, 97, 439 FIIs were registered with SEBI. SEBI permitted registered FIIs to invest in all securities traded on the primary and secondary markets including: equity, other securities and instruments of companies listed on stock exchanges including OTCEI.
  • 229.
    Special Financing 213 Accordingto the 1995 regulation, no person can buy or sell or otherwise deal in securities as a foreign institutional investor unless he holds a certificate granted by SEBI. The certificate would be given to FIIs only after considering— 1. The applicant’s track record, professional record, professional competence, financial soundness, experience, general reputation of fairness and integrity. 2. Whether the applicant is regulated by an appropriate foreign regulatory authority. 3. Whether the applicant has been granted permission under the provisions of FERA Act 1973, for making investments in India as FII. 4. Whether the applicant is (a) An institution established or incorporated outsides Indian as Pension Fund or Mutual Fund or Investment Trust, or (b) An Asset Management Company or Nominee Company or Bank or Institutional Portfolio Manager, established or incorporated outside India and proposing to make investment in India on behalf of broad based funds or (c) A Trustee or Power of Attorney holder, incorporated or established outside India and proposing to make investments in India on behalf of broad based funds. The certificate is valid for a period of 5 years from the date of its grant. Provisions are made for the renewal of the certificate. FIIs are allowed to place orders directly. Separate codes are given to FIIs and stock exchange have to use the code number. The code number have to be approved by SEBI. All the transactions carried out on behalf to FIIs have to be on delivery basis. In other words, the registered FIIs should not engage in short selling and have to take delivery of all purchase and give delivery of sold securities . To case the inflow of foreign capital, amendments have been made in the regulations regarding the FIIs investment. They are given below. 1. SEBI exempted FIIs to attach copy of RBI approved with market lot where shares are sold and a custodian signed the transfer deed on their behalf. 2. FIIs individual limit on investment in a company was raised from 5 per cent to 10 per cent. Further, they have been allowed to unlisted stock of any company. The FIIs list has also been increased. 3. SEBI (FIIs) Regulations 1995, have been changed to allow the FIIs to invest not only in the equity but also in debt instruments of corporate bodies. FIIs were allowed to invest up to 100 per cent of the funds in debt instruments of Indian companies through 100 per cent dedicated debt funds from January 15, 1997. 4. SEBI amended SEBI (FIIs) Regulations 1997, to make it mandatory for FIIs, having securities of Rs.10 crore of these as on own interest. 5. In June 1998, SEBI permitted (a) FIIs to invest in unlisted companies through the 100% debt route and to tender their serenities directly in responses to an open offer made in terms of the SEBI regulations 1997.
  • 230.
    214 Financial Management (b)SEBI simplified the process of approval of Sub-accounts of registered FIIs. (c) SEBI permitted FIIs to buy derivative contracts, which are traded on the stock exchanges. 6. The aggregate investment of FII/NRI/OCB has been raised to 30 per cent of the equity of the company by the union budget for 1997–98. The Finance Minister in his budget speech in February 2000 announced of this limit to 40 per cent. MERCHANT BANKING Introduction Merchant banking is one of the fee based financial services which includes underwriting, consultancy and other allied services to the business concern. The term merchant banking has been used in different terms in different countries. In UK merchant banking is termed as accepting and issuing house and in the USA it is known as investment banking. Meaning A merchant banking is one who underwrites corporate securities and advises clients on issue like corporate mergers. Merchant banking is basically service banking which provides non financial services such as issue management, portfolio management, asset management, underwriting of new issues, to act as registrar, share transfer agents, trustees, provide leasing, project consultation, foreign credits, etc. The merchant bankers may function in the form of a bank, financial institutions, company or firm. Merchant Banking in India In India, the first merchant banking services were started only in 1967 by National Grindlays Bank followed by Citi Bank in 1970. In 1972 State Bank of India started a merchant banking division, followed by ICICI Bank in 1973. Nowadays, most of the public sectors, private sectors, commercial banks and financial institutions established a separate division of merchant banking services. Classification of Merchant Banking According to the Securities Exchange Board of India regulations, merchant bankings are classified into the following categories on the basis of their activities and capital adequacy. The merchant banking must register themselves with Securities Exchange Board of India. Category Minimum Net worth for Activities Permitted by SEBI Capital adequacy Category I Rs. 5 Crore Issue Manager, Advisor, Consultant, Underwriter and Portfolio Manager Category II Rs. 50 Lakhs Advisor, Consultant, Underwriter and Portfolio Manager Category III Rs. 20 Lakhs Advisor, Consultant, Underwriter Category IV –NIL Advisor and Consultant service only.
  • 231.
    Special Financing 215 Functionsof Merchant Banking Merchant banking is one of the non financial services which provides to the corporate sectors, commercial banks and financial institutions. The major functions of merchant banking are explained as follows: 1. Management, Marketing and Underwriting of new issues. 2. Project finance and project promotion services. 3. Syndication of credit and other facilities. 4. Leasing including project leasing. 5. Corporate advisory services. 6. Investment advisory services. 7. Bought out deals. 8. Venture capital. 9. Mutual funds and off shore funds. 10. Investment Management. 11. Investment services for non resident Indians. 12. Management dealing in commercial paper. 13. Treasury management. 14. Stock broking. 15. Foreign Collaboration and foreign currency finance. 16. Counseling to Small Scale Industries. 17. Capital Structure counseling to cooperative sectors. 18. Meeting the working capital needs. Merchant Banking Organizations In India, merchant banking services are provided by the following types of organizations: Merchant Banking Organizations Commercial Banks Financial Institutions Private Consultancy Fig. 12.3 Merchant Banking Organizations The following commercial banks are wholly owned subsidiaries to carry out merchant banking activities. State Bank of India – SBI Capital Markets Limited. Canara Bank – Can Bank Financial Service Limited
  • 232.
    216 Financial Management Bankof Baroda – BOB Fiscal Services Limited. Grindlays Bank – Grindlays Merchant Banking Limited. ICICI, IFIC and IDBI are some of the examples of the All India financial institutions which are involving in the merchant banking activities. DSP Financial Consultants, Credit Capital Finance Corporation Limited, J.M Financial and Investment Services Limited are some of the examples of the private consultancy firms which are involving merchant banking activities. CREDIT RATING Introduction Credit rating is one of the fee based financial services which are provided by specialized agencies like CRISIL, ICRA and CARE. It is a mechanism by which the reliability and viability of a credit instrument is brought out. It is usually the effort of investors in financial instrument to minimize or eliminate default risk. Credit rating service is useful to the investors. According to Securities Exchange Board of India, credit rating is a compulsory mechanism for listing of the companies in the stock market and also it is essential to the corporate sectors who want to raise capital with the help of issue of fixed deposits, commercial papers and other short-term instruments. Meaning of Credit Rating Credit rating is an act of assigning values to credit instruments by estimating or assessing the solvency, and expressing them through predetermined symbols. “Credit rating is designed exclusively for the purpose of granting bonds according to their investment quality”. Corporate or municipal debt rating is a current assessment of the credit worthiness of the obligator with respect of a specific obligation. Objectives of Credit Rating These are the important objectives of the credit rating: • To impose a healthy discipline on borrowings. • To lend greater belief to financial and other representations. • To facilitate formulation of public guidelines on institutional investment. • To help merchant bankers, brokers and regulatory authorities. • To encourage the information disclosure, better accounting standards, etc. • To reduce interest cost for highly rated company. Credit Rating in India Credit rating in India begins from 1988. At present there are four credit rating agencies very popular in rating.
  • 233.
    Special Financing 217 OperationalPerformance of Credit Rating Business in India Rs. in crore Rating Agency 1994–95 1995–96 Cumulative Up to March 96 Number Amount Number Amount Number Amount CRISAL 384 24,544 427 43,086 1736 1,14,873 ICRA 212 5,343 293 75,742 778 93,380 CARE 184 8,403 217 13,909 445 23,638 Total 780 38,290 937 1,32,737 2,959 2,31,891 Basis for Credit Rating Credit rating agencies consider the following important informations for granting the rating symbol to the borrowing company; 1. Historical background of the company. 2. Track record of the company. 3. Financial efficiency and profitable position. 4. Operational efficiency. 5. Market share of the company. 6. Labour efficiency and their turnover. 7. Future prospects. Credit Rating Information Service of India Limited (CRISIL) Credit Rating Information Service of India Limited was the first credit rating agency in India, in January 1988 jointly by ICICI, UTI, LIC, GIC and ADB. The following are the major objectives of the Credit Rating Information Service of India Limited. (a) To rating of companies debentures, fixed deposits programmes, short-term instruments etc. (b) To provide corporate reports to business concern. (c) To conduct industry studies. Credit Rating Symbols of Credit Rating Information Service of India Limited Long-term Medium-term Short-term Remarks Instrument Instrument Instrument AAA FAAA P1 Highest Safety AA FAA P2 High Safety A FA P3 Adequate Safety BBB – – Moderate Safety Contd....
  • 234.
    218 Financial Management BBFB P4 Inadequate Safety B FC - Risk Prone C - - Substantial Risk D FD P5 Default Operational Result of Credit rating Information Service of India Limited Credit Rating Information Service of India Limited is one of the well known and largest credit rating agencies in India which provides credit rating to corporate and banking sectors. The operational performances of the Credit Rating Information Service of India Limited are explained in the table below: Instruments 1994-95 1995-96 Cumulative Up to March 96 Number Amount Number Amount Number Amount Debenture 103 7,641 161 13,342 646 45,700 Fixed deposits 97 9,130 218 14,153 543 38,625 Commercial Papers 137 1,629 21 3,255 459 11,415 Others 49 6,144 27 12,336 88 19,133 Total 384 25,544 427 43,086 1,736 1,14,873 Source: RBI reports. Investment Information and Credit Rating Agency of India Limited (ICRA) Investment Information and Credit Rating Agency is one of the largest credit rating service providers next to Credit Rating Information Service of India Limited. It was established mainly for the purpose of rating of short-term, medium-term and long-term debt instruments of the corporate and banking companies. It was set up in the year 1991 by the leading banking and financial institutions. Credit Rating Symbols of Investment Information and Credit Rating Agency of India Limited Long-term Medium-term Short-term Remarks Instrument Instrument Instrument LAAA MAAA A1 Highest Safety LAA MAA A2 High Safety LA MA A3 Adequate Safety LBBB – – Moderate Safety LBB MB – Inadequate Safety LB MC A4 Risk Prone LC – – Substantial Risk LD MD P5 Default (Rs. in crore)
  • 235.
    Special Financing 219 OperationalResult of ICRA Investment Information and Credit Rating Agency of India Limited is also performing well in the field of credit rating to various instruments. The operational result of the Investment Information and Credit Rating Agency of India Limited is explained in the table below: (Rs. in crore) Instruments 1994–95 1995–96 Cumulative Up to March 96 Number Amount Number Amount Number Amount Debenture 45 1,779 66 8,224 223 18,599 Fixed deposits 87 540 192 50,507 360 54,481 Commercial Papers 80 3,023 35 17,011 195 22,299 Total 212 5,343 293 75,742 774 93,380 Source: RBI reports Credit Analysis and Research Limited (CARE) Credit Analysis and Research Limited was set up by Industrial Development Bank of India in November 1993, Credit Analysis and Research Limited also provides rating to long-term, medium-term and short-term instruments. The rating symbols of Credit Analysis and Research Limited are mentioned below: Credit Rating Symbols of Credit Analysis and Research Limited Long-term Medium-term Short-term Remarks Instrument Instrument Instrument CARE AAA CARE AAA PR1 Highest Safety CARE AA CARE AA PR2 High Safety CAREA CAREA PR3 Adequate Safety CARE BBB CARE BBB - Moderate Safety CARE BB CARE BB Inadequate Safety CARE B CARE B PR 4 Risk Prone CARE C CARE C - Substantial Risk CARE CARE PR5 Default Operational Result of Credit Analysis and Research Limited Credit Analysis and Research Limited is one of the latest origins in the field of credit rating which provides rating to various instruments. The operational result of the Credit Analysis and Research Limited as explained in the table below:
  • 236.
    220 Financial Management (Rs.in crore) Instruments 1994-95 1995-96 Cumulative Up to March 96 Number Amount Number Amount Number Amount Debenture 34 3,429 54 9,330 93 13,572 Fixed deposits 112 1,639 39 1,692 179 3,704 Commercial Papers 38 3,335 124 2,887 173 6,362 Total 184 8,403 217 13,909 445 23,638 Source: RBI reports MUTUAL FUNDS Introduction Mutual fund is one of the funds based financial services which provides the stock market benefits to small investors. It is a concept, leading to attract the small investors to invest their pooling of savings in a trusted as well as profitable manner. Mutual funds business becomes very popular in developed countries and it is fast growing in developing countries like India also. Mutual funds act as a link between the investor and the stock market. Now in India mutual funds activities are performed by public, private and foreign sector financial institutions. Origin of Mutual Funds In the year 1822 the concept of mutual funds was found in Belgium. In 1868, foreign colonial government trust was established in England to spread the risks in securities market. Mutual funds concept was spread to USA and some of the mutual funds institutions were established. Unit Trust of India was established in 1964 as a public sector mutual funds institution by the central government. It is the first mutual fund in India. Structure of Mutual Fund in India Mutual Fund Sectors Securities Exchange Board of India Association of Mutual Funds Mutual Fund Sponsor Board of Trustee Custodian Investor Public Sector Private Sector Fig. 12.4 Structure of Mutual Fund in India
  • 237.
    Special Financing 221 Meaningof Mutual Fund A mutual fund is an investment vehicle for investors who pool their savings for investing in diversified portfolio of securities with the aim of attractive yields and appreciation in their value. Mutual fund is a trust that attracts savings which are then invested in capital markets. According to SEBI, mutual fund define is as a fund, established in the form of a trust to raise money through the sale of units to the public or a section of the public under one or more scheme for investing in securities, including money market instruments. Investment company institute of the US defined mutual fund is a financial service organisation that receives money from shareholders, invests it, earns return on it, attempts to make it grow and agrees to pay the shareholders cash on demand for the current value of his investment. Advantages of Mutual Funds Mutual fund consists of the following important advantages: 1. Attract small and medium group investors: Mutual funds promote savings among the lower and middle income groups of investors because mutual fund units are available with a single unit of Rs. 10 and multiples by the same value. 2. Attractive return: If the investor invests in mutual fund, they can get attractive returns because mutual funds are linked with stock market. The benefits of stock market goes to the mutual fund investors. 3. Reduce the risk: Mutual fund investments minimize the risk on investments by diversifying the investments into various portfolios such as shares, debentures, bonds etc. 4. Assure return: Mutual funds are managed by experts in the field of investment management; hence there is no risk and mutual fund offers assured return. 5. Tax concession: If the mutual funds belong to infrastructure development bonds, there will be a tax concession to the mutual fund investment. 6. Liquidity: Mutual fund investment is one of the highly liquidity based investments which can be recapitalized at any time or sold the mutual fund units at any time. 7. Convenience: Mutual fund investment is one of the most convenient investments for those who want to invest or get back their investment through selling of the units of mutual fund. 8. Flexibility: Mutual fund can be transfered from one scheme to the other scheme on the basis of present market condition. 9. Benefits to minorities: Mutual fund investment schemes are most suitable to the old age pensioners, widows middle class women, etc. 10. Contribution to the economy: Mutual fund companies promote the saving habits of middle class people. Hence, the money invested in mutual fund schemes are invested into the major economical activities like infrastructure development construction of bridge, buildings, etc.
  • 238.
    222 Financial Management Typesof Mutual Fund Ownership point of View Scheme of Operation point of View Portfolio point of View Location point of View Growth Income Balanced Public Sector Private Sector MF Domestic Fund Global Fund Regional Fund Sector Fund Open ended Scheme Closed ended Scheme Fig. 12.5 Types of Mutual Fund Public Sector Mutual Fund Unit Trust of India is one of the public sector mutual funds operating from 1964 and it enjoys the monopoly power in the field of mutual funds up to 1987. After 1987, Public Sector Commercial Banks and Life Insurance Corporation of India also entered into mutual funds activities. State Bank of India, Canara Bank, Punjab National Bank, General Insurance Corporation are some of the public sector mutual funds activities. Private Sector Mutual Fund Apart from UTI and public sector commercial banks, some of the private sector financial institutions also entered into the mutual fund activities in India from 1990 onwards. Kothari Pioneer mutual fund, Twentieth century mutual fund, ICKI mutual fund, Morgan Stanly mutual fund, Taurus mutual fund and CRB mutual fund are some of the examples of the private sector mutual fund. Open Ended Mutual Fund When the units are sold and redeemed at any time on-going basis at the price determined by the funds Net Assets Value (NAV) is called as open ended mutual fund. These mutual fund has no fixed maturity periods. There is no ceilling on the amount invested by the investors in these funds, and they can sell the units back to mutual funds whenever they decide. Net Assets Value of the mutual fund is calculated by the following formula:
  • 239.
    Special Financing 223 Netasset value of the unit = Net assets value of fund Number of outstanding units . Closed Ended Mutual Fund Closed ended mutual funds have fixed maturity period ranging from two to 15 years. The units of closed ended mutual funds are not repurchased or redeemed by mutual funds before the maturity period. The investors cannot buy units directly from the fund after the closing period. Growth Generated Mutual Fund Mutual fund investments which are reinvested in highly growth oriented equity shares are called as growth oriented mutual fund. It consists of high return with growth potentials. Income Generated Mutual Fund If the investor needs regular income for their investment, they can select income oriented mutual fund. It provides regular income to its investors. Balanced Mutual Fund Balanced mutual fund is a combination of mutual fund investment in company securities as well as the government bonds. Investors can get moderate return with safety options. Domestic Mutual Fund When the mutual fund mobilizes savings from a particular country or region, it is called domestic mutual fund. Global Mutual Fund When the mutual fund investment stocks are traded in markets throughout the world with the exemption of the country which launches the fund. Regional Mutual Fund When the mutual fund consists of a particular region or a country, it is also called as off shore mutual fund. Sector Mutual Fund Sector mutual funds are specializing in a particular industry which consist of aggressive funds. Top Ten Mutual Fund • UTI Mutual Fund • Reliance Mutual Fund • Prudential ICICI Mutual Fund • HDFC Mutual Fund • Franklin Templeton Mutual Fund • Birla Sun Life Mutual Fund • SBI Mutual Fund • DSP Merrill Lynch Mutual Fund • Kotak Mahindra Mutual Fund • Tata Mutual Fund
  • 240.
    224 Financial Management MODELQUESTIONS 1. Explain the types of leasing. 2. Discuss the advantages of lease financing. 3. Explain the features of venture capital. 4. Explain the types of factoring. 5. What is FDI? Explain it. 6. Discuss the functions of merchant banking. 7. Critically evaluate the role of credit rating agencies. 8. Enumerate the types of mutual funds.
  • 241.
    INTRODUCTION Finance plays akey role in the part of economic and business activities of the country. Systematic and efficient flow of finance is needed to efficient and effective management of the business concern. Arrangement of finance to required business concern, should be properly maintained and channelised through regulated institutions and markets. In India, with the effect of the new economic policy, emerging needs of financial institution and markets should be looked after. Indian financial system has developed constantly and successfully to infuse the new blood to the economic development of the nation. Hence, the economic growth and development is purely based on the regulated and well established financial system of the country. FINANCIAL SYSTEM IN INDIA Financial system is the basic concept for the industrial development of the nation. Financial system provides adequate and smooth flow of finance to the needed parts. Indian financial system consists of the four important components such as: • Financial Institutions • Financial Markets • Financial Instruments • Financial Services. Financial system implies a set of complex and closely connected or intermixed institutions, agent practices, markets, transactions, claims and liabilities in the economy. The financial system is concerned about the money, loan and finance. These three parts are very closely interrelated with each other and depend on each parts.
  • 242.
    226 Financial Management FinancialSystem Financial Institutions Financial Markets Financial Services Financial Instruments Fig. 13.1 Financial System Financial Institutions Financial institutions are the major part of the Indian financial system. Hence, it is more importance than other component of the 1FS because all the components of IFS are directly or indirectly related with the financial institutions. Financial institutions are providing various services to the economic development with the help of issuing of the financial instruments. Financial institutions can be classified into banking and non-banking institutions. Now in India, all the financial institutions are systematically regulated and controlled by respective act. . Financial Institutions Banking Non-banking Non- anking b Non-financial Institutions Non- anking b Financial Institutions Commercial Banks Cooperative Banks Fig. 13.2 Financial Institutions Banking Institutions Banking institutions are the key part of the economic development of the nation. Any country’s financial transaction should be properly arranged from investors to the needed industrialist. Banking institutions play a major role in the field of savings and investments of money from public and lending loans to the business concern. Indian Banking institutions may be classified into two board categories : (1) Commercial Banks (2) Cooperative Banks Commercial Banks Commercial Banks are the most important deposits mobilisation and disbursers of finance. Indian commercial banks are the oldest, biggest and fastest growing financial institutions. The main function of the commercial banks are accepting deposits and rendering loans to the public. Indian commercial banks can be classified into the following categories: Scheduled Commercial Banks Scheduled banks are those which are included in the second scheduled of Banking Regulation
  • 243.
    Financial System 227 Act1965 and others are non scheduled banks. To be included in the second scheduled of the Banking regulation act the bank full fill the following conditions: • Must have paid up capital and reserves of not less than Rs. five lakh. • It must also satisfy the RBI that its affairs are conducted in a manner. • It is required to maintain a certain amount of reserves with the RBI. Nationalised Banks To use financial institutions as the instrument of promoting economic and social development in a more purposeful manner and to overcome the monopoly over financial resources, the government of India nationalised 20 commercial banks during the tenure of Prime Minister of Indira Gandhi. On July 19, 1969, the first nationalisation of 14 banks took place with the following banks: 1. Bank of India 2. Union Bank of India 3. Bank of Baroda 4. Bank of Maharashtra 5. Punjab National Bank 6. Indian Bank 7. Indian Overseas Bank 8. Central Bank of India 9. Canara Bank 10. Syndicate Bank 11. United Commercial Bank 12. Allahabad Bank 13. United Bank of India 14. Dena Bank On April 15, 1980 the second nationalisation took place with the following banks: 1. Andhra Bank 2. Corporation Bank 3. New Bank of India 4. Oriental Bank of Commerce 5. Punjab and Sind Bank 6. Vijaya Bank In October 1993 the new bank of India was merged with Punjab National Bank, in March 2007, Bhart Overseas Bank merged with Indian Overseas Bank therefore, at present there are only 19 nationalised banks in the country besides the RBI.
  • 244.
    228 Financial Management StateBank of India (SBI) The largest Public sector bank of India which was created after nationalisation of Imperial Bank of India in 1955. It is now the largest commercial banks in India and in terms of branch largest in the world. As part from the main State Bank of India, there are seven subsidiaries: 1. State Bank of Bikaner and Jaipur 5. State Bank of Hyderabad 2. State Bank of Indore 6. State Bank of Mysore 3. State Bank of Patiala 7. State Bank of Saurashtra 4. State Bank of Travancore Indian Banking System Reserve Bank of India Scheduled Banks Non Scheduled Banks State Co-op Banks Commercial Banks Central Co-op Banks Commercial Banks Indian Banks Foreign Banks Public Sector Banks Private Sectors Banks SBI and its Subsidiaries Other Nationalised Banks RRB Fig. 13.3 Indian Banking System Growth and Structure of Commercial Banks in India S. No. Particulars 1951 1986 1996 2002 2005 1. Number of Sch. Banks 92 79 91 98 98 2. Number of RRB - 194 196 196 196 3. Number of Non-Sch. Banks 474 3 3 4 4
  • 245.
    Financial System 229 PrivateSectors Banks These comprise of foreign and private domestic banks. The foreign banks have market share of 8.5% of total deposits into banking industry and the domestic private banks have a share of 5.8% of total deposits of the banking industry. Presently 31 private domestic banks and 33 foreign banks are functioning in India. The following are the old generation private sector banks in India: • Bharat Overseas Bank Ltd. • City Union Bank Ltd. • Development Credit Bank Ltd. • Ing Vysya Bank Ltd. • Karnataka Bank Ltd. • Lord Krishna Bank Ltd. • The Nainital Bank Ltd. • SBI Coml. and Intl. Bank Ltd. • Tamilnadu Mercantile Bank Ltd. • The Bank of Rajasthan Ltd. • The Catholic Syrian Bank Ltd. • The Dhanalakshmi Bank Ltd. • The Federal Bank Ltd. • The Ganesh Bank of Kurndwad Ltd. • The Jammu & Kashmir Bank Ltd. • The Karur Vysys Bank Ltd. • The Lakshmi Vilas Bank Ltd. • The Ratnakar Bank Ltd. • The Sangli Bank Ltd. • The South Indian Bank Ltd. • The United Wester Bank Ltd. New Banks in Private Sectors In the year 2000, the government of India related entry level for private sector by reducing the government holding in nationalised banks from 51% to 33%. The RBI in 2003 thereby issued directions for establishment of private banks in India. Some of the new banks in private sector as follows: • UTI Bank Ltd. • Indus Ind Bank Ltd. • ICICI Bank Ltd.
  • 246.
    230 Financial Management •Global Trust Bank Ltd. • HDFC Bank Ltd. • Centurian Bank Ltd. • Bank of Punjab Ltd. • Times Bank Ltd. • IDBI Bank Ltd. • Development Credit Bank Ltd. • Kotak Mahindra Bank Ltd. Foreign Banks in India RBI has been issuing licenses to various foreign banks to operate in India. 33 foreign and multinational banks are working in India today. The following are the major foreign banks play in Indian banking markets. • ABN-Amro Bank N.V. • Abu Dhabi Commercial Bank Ltd. • American Express Bank Ltd. • Antwerp Diamond Bank N.V. • Arab Bangladesh Bank Ltd. • Bank International Indonesia • Bank of America NA • Bank of Bahrain and Kuwait BSC • Bank of Ceylon • Barclays Bank PLC • BNP Paribas • Chinatrust Commercial Bank • Chohund Bank • Citibank N.A. • Calyon Bank • Credit Lyonnais • Deutshe Bank AG • Ing Bank N.V. • JP Morgan Chase Bank • Krung Thai Bank Public Company Ltd. • Mashreq Bank psc • MIZUHO Corporate Bank Ltd.
  • 247.
    Financial System 231 •Oman International Bank SAOG • Societee Generale • Sonali Bank • Standard Chartered Bank • State Bank of Mauritius Ltd. • Sumitomo Mitsui Banking Corporation • The Bank of Nova Soctia • The Bank of Tokyo-Mitsubishi, Ltd. • The Development Bank of Singapore Ltd. • The Hong Kong and Shanghai Banking Corporation Ltd. • UFJ Bank Ltd. Non-banking Institutions Apart from the banking institutions, Non-banking institutions are also performing their function to improve the Indian financial system. Non-banking Institutions can be classified into the following two major categories: 1. Non-banking Financial Institutions. 2. Non-banking Non-financial Institutions. Non-banking Financial Institutions Non-banking Financial Institutions are providing fund based services such as investment, insurance, mutual funds and lending institutions: NBFI National Level Institutions State Level Institutions Financial Investment SFC IFCI IDBI ICICI LIC UTI Fig. 13.4 Non-banking Financial Institutions INDUSTRIAL FINANCE CORPORATION OF INDIA (IFCI) Origin Industrial Finance Corporation of India, the first development bank in India was set up in July, 1, 1948 by passing a special Act as Industrial Finance Corporation of India Act 1948 in the parliament.
  • 248.
    232 Financial Management Capital Industrialfinance corporation of India was started with the paid up share capital of Rs. 10 crore. The share capital was contributed by Reserve Bank of India, scheduled banks. Insurance companies, investment trust and co-operative banks. Industrial finance corporation of India can raise further capital with the help of issue of bonds, debentures, accepts deposits from public and advance from RBI. Objectives The objective of Industrial finance corporation of India is to make medium and long-term credits more readily available to industrial concern in India particularly to the industries. • Manufacturing, preservation or procession of goods • The mining industry • The shipping industries • The hotel industries • Generation or distribution of electricity or power Functions The following are the main functions of the Industrial finance corporation of India: 1. Granting loans and advances. 2. Subscribing to the shares and debentures floated by industrial concern. 3. Guaranteeing loan taken from capital market. 4. Guarantee deferred payment in respect of import of capital goods by approved concerns. 5. Involves merchant banking activities. 6. Special assistance to women, SSI and backward area. 7. Consultancy for technical, marketing and financial. Management Industrial finance corporation of India is managed by the board of directors which consist of 12 directors and one full time chairman. Some of the directors are nominated by IDBI, Central government, Scheduled Commercial Bank, Co-operative Banks and Insurance Companies. Subsidies of Industrial Finance Corporation of India Apart from the financial service to the industrial concern Industrial finance corporation of India promote some of the institutions: • Tourism Finance Corporation of India Ltd. • Management Development Institute. • Risk Capital and Technology Finance Corporation Ltd.
  • 249.
    Financial System 233 •Technical consultancy organisation. • Investment information and credit rating agency of India. Working Result In 1970–71 loan sanctioned was Rs. 32.2 crore, in 1998 it was reached to Rs. 8684 crore. The total sanctioned by Industrial finance corporation of India as at the end of March 1999 stood at Rs. 47245 crore. Now-a- days Industrial finance corporation of India providing all kind of financial assistance to medium and large scale industrial sector in India. INDUSTRIAL CREDIT AND INVESTMENT CORPORATION OF INDIA(ICICI) Origin Industrial Credit and Investment Corporation of India was started in January, 5 1955 as a Public Ltd. Companies under the companies act. It is only development bank which has participation by foreign investors. Capital Paid up share Capital of Industrial Credit and Investment Corporation of India is Rs. 25 crore, which was contributed by commercial banks, insurance companies, foreign investors from UK, USA, Germany, France and Japan. Objective The following are the major objectives of Industrial Credit and Investment Corporation of India: 1. To provide following are the major objectives of Industrial Credit and Investment Corporation of India: 2. To develop underwriting facilities, to help private sector units. Functions The main functions of the Industrial Credit and Investment Corporation of India are as follows: • Expansion of private sector industries. • To give loans or guarantee of loans either in rupees or foreign currency. • To underwrite shares and debentures and subscribes directory to share issued. • To encourage and promote private capital. • To promote private ownership of industrial investment alongwith the expansion of investment market. Management Industrial Credit and Investment Corporation of India is managed by the board of directors which full time chairman. The directors are nominated by Government, Reserve Bank of India Foreign shareholders and IDBI.
  • 250.
    234 Financial Management Subsidiesof Industrial Credit and Investment Corporation of India Industrial Credit and Investment Corporation of India is one of the leading and wide range of financial service providers in India. The following are the subsidies of the Industrial Credit and Investment Corporation of India. • ICICI Banking Corporation Ltd. • ICICI Securities and Finance Company Ltd. • ICICI Assets Management Company Ltd. • ICICI Trust Ltd. • ICICI Brokerage Service Ltd. • ICICI Credit Corporation Ltd. Working Result Industrial Credit and Investment Corporation of India provided financial assistance to industrial concerns has increased form 145.8 corer in 1961–62 to Rs. 34,220 crore in 1998–99 of the total loan sanctioned in 1998–99, 33% went to corporate finance, 29% to infrastructure, 19.5 each to oil gas and petrochemicals industries. INDUSTRIAL DEVELOPMENT BANK OF INDIA (IDBI) Origin The Industrial Development Bank of India was set up as a wholly owned subsidiary of the RBI on July 1st 1964 under an act of parliament. In February 1976, it became an independent and autonomous bank. Capital Industrial Development Bank of India was started with initial paid up capital of Rs. 100 crores and now it can raise further capital with the help of issue of shares, debentures and accept deposits from public. Objectives The main objectives of the Industrial Development Bank of India are as follows: • To provide credit, team finance, and financial services for the establishment of new projects. • To expansion, diversification modernization and technology upgradation of existing Industrial concern. • To provide several diversified financial products. • To undertake merchant banking activities. Functions The functions of Industrial Development Bank of India are as follows:
  • 251.
    Financial System 235 1.Direct finance—Project loan, soft loan, technical development loan, equipment finance etc. 2. Indirect finance—Refinancing, rediscounting of bills, seed capital to new entrepreneurs. 3. Special assistance—Promotion of development assistance funds. 4. General assistance—Non-financial promotional activities like marketing, research, consultancy etc. Management Industrial Development Bank of India managed by board of directors which consist of 14 directors and one full time chairman. The directors are nominated by the government, Reserve Bank of India, company law board, insurance companies and various industries. Subsidies of Industrial Development Bank of India are as follows: • IDBI Bank Ltd. • IDBI Capital Market Service Ltd. • IDBI Mutual Funds. • SIDBI • IDBI Intech Ltd. Industrial Development Bank of India has helped to set up the following institutions: • Technical Consultancy Organization. • EXIM Bank. • Entrepreneurship Development Institute. • Credit Rating and information service India Ltd. Working Result Total assistance sanctioned by Industrial Development Bank of India in 1998–99 was Rs. 25,555 crores, of this 96.7% goes to direct assistance, 0.4% belongs to refinance. The total amount of assistance sanctioned by the Industrial Development Bank of India till the end of March 1999 from the date of its incorporation has been Rs. 1,07,264 crores. INDUSTRIAL RECONSTRUCTION BANK OF INDIA (IRBI) Origin In April 1971, Industrial Reconstruction Corporation of India (IRCI) was set up by IDBI and other development and public sector banks. IRCI was reconstituted and renamed as Industrial Reconstruction Bank of India in 1985 with a special Act in the parliament. Capital Industrial Reconstruction Bank of India was started with initial paid up capital of Rs. 50 crore which is contributed by central government, Reserve Bank of India, SCB and various
  • 252.
    236 Financial Management financialinstitutions. Further capital can be raised with the help of issue of shares, debentures and accept deposits from public. Objectives Industrial Reconstruction Bank of India was established mainly for rehabilitating sick industrial units in India. • To identify and remedial measures to sick industries. • To provides financial assistance to reconstruction of sick industrial units. • To promote the sick units into profitable units. Functions The following are the major functions of the Industrial Reconstruction Bank of India Credit and reconstruction agency for industrial revival modernization, rehabilitation, expansion, reorganization, diversification and rationalization. Empowered to grant loans and advances: • Underwrite stocks, share and bonds. • Guarantee loans and advances, performances and deferred payments. • Gives assistance for capital expenditure, addition of balancing equipment etc. Management Industrial Reconstruction Bank of India is managed by the Board of directors with a full time chairman. Directors are nominated by central government, Reserve Bank of India, Schedule commercial Bank and financial institutions. Subsidies of Industrial Reconstruction Bank of India On March 27 1997, Industrial Reconstruction Bank of India was transformed into Industrial Investment Bank of India Ltd (IIBI) under the Companies Act. IIBI acts as a coordinating agency in the field of reconstruction. Working Result Industrial Reconstruction Bank of India sanctioned financial assistance to various sick industrial units. Industrial Reconstruction Bank of India sanctioned Rs. 92 crores in 1980– 81 but it has increased to Rs. 4526 crore in 2002–03. It contributed 80% of the financial assistance at all over India. STATE FINANCE CORPORATION (SFC) Origin Central government decided to promote the Small Scale Industries and Medium Scale Industries at the state level by establishment of State Finance Corporation under a special Act. It is called as State Finance Corporation Act 1951. According to this act, state government have been empowered to set up State Finance Corporation. At present these are 18 State Finance Corporation in India.
  • 253.
    Financial System 237 Capital StateFinance Corporations will have a paid up capital from Rs. 50 lakhs to Rs. 5 crore which will be contributed by the respective state government, Schedule Commercial Bank, Reserved Bank of India and various financial institutions. Objectives • To provides financial assistance to Small scale industries • To promote tiny, village and cottage Industries • To provides infrastructure facilities to SSI Functions • Long term loans to Small Scale Industries. • Refinance from Reserve Bank of India and Industrial Development Bank of India • Assistance from International Development Agency (IDA) and foreign currency hire of credit from the IDBI Management State Finance Corporation are managed by Board of directors constituted by the respective State Government, Central Government, Reserve Bank of India, Schedule Commercial Bank and Financial Institutions as nominated directors to the State Finance Corporation. STATE FINANCE CORPORATION IN TAMIL NADU The Madras Industrial Investment Corporation (MIIC) was started as early as 1949, under the companies act and it was renamed as Tamil Nadu Industrial Investment Corporation (TIIC). It was the first State Finance Corporation in India, after the establishment of the State Finance Corporation Act, 1951, the first State Finance Corporation was in Punjab in 1953. EXPORT IMPORT BANK (EXIM BANK) Origin EXIM bank was set up in January 1982 as a wholly owned by the central government. Capital EXIM bank was established with the paid up capital of Rs. 50 crores. It is empowered from RBI and also from central government to further capital raise by issue of bonds and grants from government. Objectives EXIM bank was established mainly for the purpose of promoting export and trading in India. The objectives are as follows: • To promote the export and import activities • To meet the financial requirements of the exporters • To provides guarantee and make foreign exchange facilities to exporters.
  • 254.
    238 Financial Management Functions EXIMbanks performs the following important functions: 1. Grants direct loans in India and outside for import and export. 2. Refinances loans and suppliers of credit. 3. Rediscounts usance export bills export bills for banks. 4. Provides overseas investment finance. 5. Bulk import finance. 6. Foreign currency preshipment credit. 7. Product equipment finance programme. 8. Business advisory and technical assistance (BATA). Management EXIM bank is one of the wholly owned by central government, hence, the entire management is controlled by the central government. Working Result EXIM banks business is exclusively devoted to India’s export and import activities. The aggregate loans and outstanding reached Rs. 16.16 billion during the first decade of the its operation. During the year 1990–91, it was sanctioned Rs. 1984 crore and it has increased to Rs. 12011 crore in 2002–03. The share of EXIM bank in industrial finance is 2.11% in the year 2002–03. NATIONAL BANK FOR AGRICULTURAL AND RURAL DEVELOPMENT Origin The National Bank for agricultural and rural development was set up on July 12, 1982, based on the Recommendation of the All India rural credit survey committee under an act of Parliament as a central or apex institution for financing agricultural and rural sectors. It has taken over the functions of Agricultural Refinance and Development Corporation (ARDC) and Agricultural credit department of Reserve Bank of India. Capital The National Bank for Agricultural and Rural Development Functioning with the paid up capital of Rs. 100 crore which is subscribed by Government and Reserve Bank of India in equal amount. Further capital can be raised from the special borrowings from the Central Government. Objectives The main objectives of National Bank for Agricultural and Rural Development are as follows: • To provides refinance assistance for agriculture, Small Scale Industries and Village Industries.
  • 255.
    Financial System 239 •To undertakes promotional activities for integrated rural development • To coordinates agricultural finance alongwith the state government • To undertakes research and development in agriculture, rural industries Functions The National Bank for agricultural and rural development discharges are: It provides all sorts of reference to Co-operatives, Commercial Banks, and Regional Rural Banks, in respect the above three agencies and advices the government thereon. It makes loans to state government to enable them to subscribe to the share capital of co-operative bank. It helps in promoting research in agriculture and rural development. National bank for agricultural and rural development undertakes evaluation and monitoring projects financed by it. It is responsible for the development, operation and co-ordination relating to rural credit. Management National Bank for Agricultural and Rural Development is wholly owned by central government, hence it is managed by the central government constituted management board. Working Result National Bank for Agricultural and Rural Development operates through 28 regional offices, 336 district offices, one sub-office at Port blair and one special cell in Srinagar during the year 1986. National Bank for Agricultural and Rural Development sanctioned short-term credit to Small Scale Industries Rs. 400 crore and it has increased to Rs. 1200 crore in the year 1990-91. Nearly Rs. 400 crore have been provided as medium term loans to various activities, Rs. 200 crore have been sanctioned as long-term loans contributing to the share capital of co-operative institutions. National Bank for Agricultural and Rural Development has refinanced banks for implementing the national programmes of mass assistance of small and marginal farmers. It also refinance development activities of the handloom sectors. It extends refinance to state co-operative banks, provide block capital to industrial Co-operative Societies and rural artisans against state government guarantee. Service area approach of commercial banks is supported by National bank for agricultural and rural development through various special assistance. SPECIALIZED FINANCIAL INSTITUTIONS The following are the specialized financial institutions established by government to provide financial and non–financial assistance to various industrial sectors in India. • Shipping Credit and Investment Corporation of India (SCICI), 1986. • Infrastructure Leasing and Financial Service Limited (IL and FS), 1988. • Technology Development and Information Company of India Limited (TDICI), 1988. • Risk Capital and Technology Finance Corporation Limited (RCTFC), 1988.
  • 256.
    240 Financial Management •Tourism Finance Corporation of India (TFCI), 1989. • Small Industries Development Bank of India (SIDBI), 1989. • Infrastructure Development Finance Company (IDFC), 1997. INSURANCE SECTOR IN INDIA Insurance is one of the fund based financial services which provides risk coverage facilities to the human beings. Realising the vast potential in Indian market, foreign insurance companies started entering into India and even banking organisations (SBI, ICICI, etc.) also showed much interest in insurance business, this is being attributed to global technology and conversions of services as a result of which Indian Insurance market registered highest growth in the Asian region even though Indian’s share of global insurance premium is less 0.5% (1998) than that of US 24.2 percent and Japan 21 percent. The private players from India and abroad are well aware that only 25 percent of the insurable population have been covered by insurance by existing companies which includes that Indian insurance market has potential enough to exploit. In this process IRDA has so for granted registration for 12 private life insurance companies and 9 general insurance. If the existing public sector insurance companies are included, there are currently 14 insurance companies in the life side and 13 companies in general insurance business. Insurance sectors in India has been classified into the following categories: Insurance Sector Public Sector Insurance Private Sector Insurance Life Insurance General Insurance Life Insurance General Insurance LIC of India Postal Life Insurance National Insurance New India Assurance Corporation Oriental fire and General Insurance Corporation United India Insurance corporation Fig. 13.5 Insurance Sector
  • 257.
    Financial System 241 Someof the Private Sector Life Insurance Corporation • ICICI Prudential Life Insurance Corporation Limited. • ING Vysya Life Insurance Corporation Limited. • HDFC Standard Life Insurance Corporation Limited. • Birla Sun Life Insurance Corporation Limited. • SBI Life Insurance Corporation Limited. • Om Kotak Life Insurance Corporation Limited. • Met Life Insurance Corporation Limited. • Allianz Bajaj Life Insurance Corporation Limited. • Max New Yark Life Insurance Corporation Limited. • Tata AIG Life Insurance Corporation Limited. • AMP Sanmar Life Insurance Corporation Limited. Some of the Private Sector General Insurance Corporation in India are as follows: • CH NBH Assn General Insurance Corporation. • ICICI Lombard General Insurance Corporation. • Bajaj Allianz General Insurance Corporation. • AIG General Insurance Corporation. • IFFCO Tokio General Insurance Corporation. • Royal Sundaram General Insurance Corporation. • Reliance General Insurance Corporation. LIFE INSURANCE CORPORATION OF INDIA The Life Insurance Corporation of India (LIC) was set up in the year 1956 by nationalizing 245 insurance companies. The Primary objective of nationalization was to protect the interest of policy-holders against misuses and embezzlement of funds by private insurance companies. Secondly, the object of nationalization was to direct investment of funds in government securities, leaving a meager part for the private sector. What marks and distinguishes the LIC from other long-term financial institutions is this that it discharges the two fold function of mobilization of long-term savings and their effective channelisation as well. The other agencies are suppliers of fund obtained from government and the Reserve Bank of India. Role of LIC The activities of the LIC can be broadly classified into two categories. First, it mobilizes long- term contractual savings. Its policy-holders view the LIC as a trustee of their funds, a source of emergency fund to guard against any financial misfortune and a way to accumulates funds by the time of retirement from work. As an agency it is designed to the inculcation of savings for the sake of rainy days.
  • 258.
    242 Financial Management Duringthe last forty years of its operations, there has been concentration of colossal funds in hands of this monolithic state owned corporation. The resources thus obtained by the LIC from policy-holders are invested in diverse ways for different purposes. Basically LIC is an investment institution. It is a big investor of funds in government marketable securities. Since April, 1975 the amended Section 27A of the Insurance Act, 1938 the LIC is required to invest to not less than 50% of its accruals of premium income in government marketable securities. Of this not less than 25% in central government securities. Besides it has to give loans to approved authorities like electricity boards or state government for socially oriented schemes like electricity, housing, water supply etc. These loans and investments should not exceed 87.5 percent of accretion to the controlled fund of the LIC. The remaining 12.5 percent can be made to the private sector directly in the form of purchase of shares and debentures. Besides it grants loans to the private corporate sector and finances projects by subscribing shares and debentures of private industries. Its contribution to financing of industries in the private corporate sector is also indirect. The investment in the share capital and bonds of IFCI, SFCs, UTI and IDBI flow back to private sector in the form of direct loans. The LIC is also engaged in underwriting new issues. The LIC plays an important role in the securities market in India. It purchases even when the market is dull (bearish) and prices are low in order to reap the benefit of future price appreciation. Nor does it usually sell shares from its stock when the market is spturn at higher prices. Although Income Tax concessions provide incentive to higher income groups through LIC policies, the insuring public does not get the real value of its long-term savings because of chronic inflation. Barring risk coverage, the rate of return offered by LIC is much lower compared to other savings media. It is true LIC has grown at a fast speed yet it can grow at a faster rate if it can make the message of life insurance more attractive by its operational efficiency and innovative attitude. GENERAL INSURANCE COMPANIES The General Insurance Corporation of India(GIC) was formed as a government company in 1972 under the General Insurance Business (Nationalization) Act 1972. Before nationalization a few big companies and about 100 small companies were in this business. All these units were merged together and reorganized into four subsidies of GIC. They are: • National Insurance Company • New India Assurance Company • Oriental Fire and General Insurance Company • United India Fire and General Insurance Company. On January 1, 1973 of all the Indian insurance companies were transferred to the GIC. The feature of the GIC is this that it sell insurance service against some forms of risk like
  • 259.
    Financial System 243 lossof physical assets of various kinds from fire or accident and against personal sickness and accident. The insurer just purchases a service and not any financial asset. They draw vast resources in the other approved securities. As a financial intermediary, the GIC invests funds in a prudent way looking after national priorities and meeting unforeseen claims under their policies. The GIC is required by law to hold central government securities to the tune of 25 percent of new accrual and at least 10% in other approved securities. The companies can invest in the shares and debentures of the corporate sector. But shall not exceed 5%of the subscribed capital of a single company. It also participates in the underwriting of new issues and in granting term loans to industries. UNIT TRUST OF INDIA Origin Unit trust was set up in 1964 by a special act passed in the parliament under the name of Unit Trust of India Act 1963, for the purpose to promote and regulate the mutual fund activities in India. Capital The initial capital of Unit Trust of India was Rs. 5 crores which was contributed by Reserve Bank of India, Life Insurance Corporation, State Bank of India, Schedule Commercial Banks and foreign banks. Unit Trust of India can raise further capital through issue of bonds, accepting deposits and borrowings from Reserve Bank of India and Life Insurance Corporation. Objectives Unit Trust of India functioning with the following major objectives: • To promote the saving habits of small and medium investors. • To provide stock exchange benefits to the small and medium investors. • To reduce the risk of investors through diversified investment. • To invest the funds on commercial purpose. Functions Unit Trust of India performs the following important functions: • Mobilisation of funds through mutual funds. • Grant term loans. • Rediscount Bills. • Undertake equipment leasing and hire purchasing. • Housing and construction finance . • Merchant banking services. • Portfolio management services.
  • 260.
    244 Financial Management Management UnitTrust of India is managed with an independent board of Trustees and a full time chairman, which is appointed by the government. The trustees are nominated by the Reserve Bank of India, Life Insurance Corporation, State Bank of India and other commercial banks. Subsidiaries of Unit Trust of India Unit Trust of India also established some of the associates and group of institutions apart from their regular services: • UTI Securities Exchange Limited –1994 • UTI Bank Ltd.–1994 • UTI Investment Advisory Service Limited–1988 • UTI Investors Services Limited–1993 • UTI Institute of Capital Market–1989 • UTI contributed to the establishments of the following institutions or organisations: • Credit Rating Information Service of India Limited (CRISIL) • Investment Information and Credit Rating Agency of India Limited (ICRA) • Credit Analysis and Research Limited (CARE) • Discount Finance House of India (DFHI) • Stock Holding Corporation of India Limited (SHCIL) • Over the Counter Exchange of India Limited (OTCEI) Schemes of Unit Trust of India Unit Trust of India introduced various scheme in the different periods. The major Unit Trust of India schemes are under: • Unit Scheme–64 • Monthly Income Scheme • Children College and Career Fund Scheme • Grihalakshmi Unit Plan • UTI Bond Fund • UTI Money Market Fund • UTI Growth Sector Fund • UTI Master Share. Working Result of Unit Trust of India Up to 1987 UTI enjoys the Monopoly power in the field of merchant banking activities. In terms of cumulative indicators it accounted for 34% of the total schemes, 83% of the resource mobilized, 82% the investment and 81% of the unit holding accounts at
  • 261.
    Financial System 245 4thend of 1995-96. The gross net resources mobilized by Unit Trust of India through open ended schemes were Rs 7092 crore and closed ended schemes were Rs 3.85 crore in the year 2002-03. The Growth performance of the Unit Trust of India has been explained in the below table. Year Sales Repurchase Investable Repurchase as % of Sales 1964–65 19 0.4 25 2.06 1985–86 892 63 3218 7.06 1995–96 6373 7643 56620 119.92 2000–01 7910 10491 69346 132.63 2002–03 5767 11194 51990 194.10 Source: UTI reports NON-BANKING NON-FINANCIAL INSTITUTIONS Non-banking non–financial institutions are providing fee based services to the public, such as merchant banking, underwriting, counseling, etc. These institutions will not lending any financial assistance to public but they will provide financial services. NBNFI Merchant Banking Underwriting Credit Rating Consultancy Project Preparation Fig. 13.6 Non-banking Non-financial Institutions FINANCIAL MARKETS Financial market deals in financial securities or instruments and financial services. It may be variously classified as primary and secondary, money markets and capital markets, organised and unorganised markets official and parallel markets, and foreign and domestic markets. Financial market provides money and capital supply to the industrial concern as well as promote the savings and investments habits of the public. In simple censes financial market is a market which deals with various financial instruments (share, debenture, bonds, treasury bills, commercial bills etc.) and financial services (merchant banking, underwriting etc). Financial markets may be divided into two major classifications: A. Capital market B. Money market
  • 262.
    246 Financial Management FinancialMarket Money Market Capital Market Primary Market Secondary Market Primary Market Money Market Call Money Market Treasury Bill Market Commercial Bills Market Short-term Loan Market Stock Market Debt Market Over the Counter Exchange of India (OTCEI) Regional Stock Exchange (RSE) National Stock Exchange (NSE) Fig. 13.7 Financial Market Capital Market Capital market may be defined as on organised mechanism for effective and efficient transfer of money-capital or financial recourses from the individuals or institutional savers to industrialist. The development of a effective capital market depends upon the availability of savings, well organised financial system and the entrepreneurship quantities of its people. Capital market is a market for long-term funds, just as the money market is the market for short-term funds. It refers to all the facilities and the institutional arrangements for borrowing and lending term funds (medium-term and long-term funds). It does not deal in capital for purpose of investment. The demand for long-term money capital comes predominantly from private sector manufacturing industries and agriculture and from the government largely for the purpose of economic development. As the central and state governments investment are not only on economic overheads as transport, irrigation and power development but also on basic industries and some times, even consumer goods industries, they require substantial sums from the capital market. The supply of funds for the capital market comes largely from individual savers, corporate savings, banks, insurance companies, specialized financing agencies and government. Among institutions, we may refer to the following: 1. Commercial banks are important investors, but are largely interested in government securities and, to a small extent, debentures of companies. 2. LIC and GIC are growing importance in the Indian capital market, though their major interest is still in government securities. 3. Provident funds constitute a major medium of savings but their investments are mostly in government securities.
  • 263.
    Financial System 247 4.Special institutions set up since Independence, viz. the IFCI, ICICI, IDBI, UTI etc., all these aim at providing long-term capital to the private sector. The capital market in India can be classified into • Gilt-edged Market on Government and Semi-government Securities; • Industrial Securities Market; • Development Financial Institutions (DFI), and • Non-banking Financial Companies (NBFC) Capital Market in India Gilt-edged Market Industrial Securities Market Development Financial Institutions (DFI) Financial Intermediaries New Issues Market Old Issues Market Stock Exchange IFCI ICICI SFCs IDBI IIBI UTI Merchant Banks Mutual Funds Leasing Companies Venture Capital Others Companies Fig. 13.8 Capital Market in India The Gilt-edged market is the market for Government and semi-government securities, which carry fixed interest rates and backed by RBI . The securities traded in this market are stable in value and are much sought after by banks and other institutions. The industrial securities market is the market for equities and debentures of companies of the corporate sector. This market further classified into (a) New Issues Markets; for raising fresh capital in the form of shares and debentures, and (b) Old Issues Market; for buying and selling shares and debentures of existing companies–this market is commonly known as the stock market or stock exchange. Both markets are equally important, but often the new issues market will be facilitated only when there are abundant facilities for transfer of existing securities. The capital market is also classified into Primary Capital Market and Secondary Capital Market. The primary capital market refers to the new issues market, which relates to the issue of shares, preference shares and debentures of non-government public limited companies, and also to the raising of fresh capital by Government companies, and also to the raising of fresh capital by Government companies and the issue of public sector bonds.
  • 264.
    248 Financial Management Thesecondary capital market, on the other hand, is the market for old or already issued securities. It is composed of Industry Security Market or the stock exchange in where industrial securities are bought and sold, and the Gilt-edged Market where the government and semi-government, securities are traded. MIBOR and MIBID On June 15, 1998 National Stock Exchange launched two new Reference Rates for the loans of Inter-Bank Call Money Market. These rates are Mumbai Inter-Bank Offer Rate (MIBOR) and Mumbai Inter-Bank Bid Rate (MIBID). MIBOR will be the indicator of Landing Rate for loans which MIBID will be the landing rate of receipts. Share Market India has a well developed share market system, which is one of the best in the developing world. It has one of the oldest stock markets in Asia. The first stock exchange was established in 1875 in Bombay (Mumbai), when the stock brokers against at their plight following the severe depression in securities, decided to form an association to protect the character and interest of native share and stock brokers. India has the second largest share holding population with around 1.5 crore shareholders; next only to the United States of America which has about 5 crore shareholders. India is significantly ahead of countries like Japan, United Kingdom and France in this regard, the Indian figure may look impressive, but it constitutes only 1.5 percent of the total population. The country also has a large number of debenture holders, whose figure stands at around 50 lakhs (5 million). Here, it is important to note that most of the debenture holders are prospective shareholders as they are waiting for the conversion of their debentures into equity shares. The enhanced interest in capital market is a result of increasing industrialization, growing awareness among people and globalization of the capital market. Indian capital market can be divided into primary market (new issues market) and secondary market. Primary Market The primary market refers to the set up by which the industry raises funds by issuing different types of securities. These securities are issued directly to the investors, both individual and institutions. The primary market discharges the important function of transfer of savings, especially of the individual, Government and public sector undertakings. In the primary market, the new issues of securities are presented in the form of Public issues, Right issues and Private Placements. Its efficient operation is made possible by the financial intermediaries and financial institutions, who arrange long-term financial transactions for the clients. Issues of the securities in the primary market may be made through (i) Prospectus, (ii) Offer for sale, and (iii) Private placement. The securities offered
  • 265.
    Financial System 249 tothe public through prospectus are directly subscribed by the investor. The issuing companies widely publicise the offer through various media. The Securities Exchange Board of India (SEBI) has classified various issues in three groups i.e., New issues, Right issues and Preferential issues. The SEBI has issued various guidelines regarding proper disclosure for investor’s protection. These guidelines are required to be duly observed by the companies making issue of capital. The guidelines issued by the SEBI broadly cover the requirements regarding issue of capital by the companies. The guidelines are applicable to all the companies after the repeal of Controller of Capital Issues (CCI ) Act 1947. The boom in the primary capital market, that started in the mid-eighties and accelerated thereafter, started slowing down by 1995. There are several reasons for this slowing down of resource mobilization in the primary market. In particular, the low return on new issues, some resulting in stock market fiasco, seems to have shattered the confidence of the investors. Secondary Market The secondary market refers to the network system for the subsequent sale and purchase of securities. An investor can apply and get allotted, a specified number of securities by the issuing company in the primary market. However, once allotted, the securities can thereafter be sold and purchased in the secondary market only. A security emerges in the primary market, but its subsequent movement takes place in the secondary market. Secondary market is represented by stock exchanges in the capital market. Stock exchanges provide an organized market place for investors to trade in securities. A stock exchange permits the prices of the securities to be determined by the market forces. The bidding process flows from demand and supply, underlying each security. This means that the specific price of a security is determined, more or less, in the manner of an auction. Stock exchange provides a market in which the members (share brokers) and investors participate to ensure liquidity to the latter. At present, there are 22 stock exchanges operating in India. Approved Stock Exchanges in India as follows: 1. Meerut Stock Exchange, Meerut (UP) 2. UP Stock Exchange, Kanpur (UP) 3. Mumbai Stock Exchange, Mumbai (Maharashtra) 4. Over the Counter Exchange of India, Mumbai (Maharashtra) 5. National Stock Exchange, Mumbai (Maharashtra) 6. Pune Stock Exchange, Pune (Maharashtra) 7. Ahmedabad Stock Exchange, Ahmedabad (Gujarat) 8. Sourashtra Stock Exchange, Rajkot (Gujarat) 9. Vadodara Stock Exchange, Vadodara (Gujarat) 10. Bangalore Stock Exchange, Bangalore(Karnataka) 11. Canara Stock Exchange, Mangalore (Karnataka)
  • 266.
    250 Financial Management 12.Bhubaneshwar Stock Exchange, Bhubaneshwar (Orissa) 13. Calcutta Stock Exchange, Calcutta (West Bengal) 14. Delhi Stock Exchange, Delhi. 15. Guwahati Stock Exchange, Guwahati (Assam) 16. Hyderabad Stock Exchange, Hyderabad (Andhra Pradesh) 17. Jaipur Stock Exchange, Jaipur (Rajasthan) 18. Ludhiana Stock Exchange, Ludhiana (Punjab) 19. Chennai Stock Exchange, Chennai (Tamil Nadu) 20. Coimbatore Stock Exchange, Coimbatore (Tamil Nadu) 21. MP Stock Exchange, Indore (Madhya Pradesh) 22. Magadh Stock Exchange, Patna (Bihar) 23. Capital Stock Exchange, Kerala Ltd. Tiruvananthapuram (Kerala) 24. Cochin Stock Exchange, Cochin (Kerala) Secondary market in India got a boost when Over The Counter Exchange of India (OTCEI) and National Stock Exchange (NSE) were established. It may be noted that NSE and OTCEI have been established by the all India Financial Institution, while other stock exchanges are in the form of associations. Methods of Raising Capital Shares: Otherwise known as ‘ordinary shares’ these are shares in the issued capital of company which are held on terms that make the holder a ‘member’ of the company, entitled to vote at annual meetings and elect directors, and to participate through dividends in the profits of the company. The holders of the ordinary shares carry the residual risk of the business: they rank after debenture holders and preference shareholders for the payment of dividends and they are liable for losses, although this liability is limited to the value of the share and to the limit of guarantee given by them. Debentures: Fixed-interest securities issued by limited companies in return for long-term loans. The term is sometimes also used to refer to any title on a secured interest– bearing loan. Debentures are dated for redemption (i.e. repayment of their nominal value by the borrower to the holder), debentures are usually secured. Debenture interest must be paid whether the company makes a profit or not. In the event of non-payment debenture holders can force liquidation and rank ahead of all shareholders in their claims on the company’s assets. The interest which debentures bear depends partly on long-term rates of interest prevailing at the time and partly on the type of debenture, but will in any case, because of the lower risk involved is less than borne by preference shares. Debenture shares are most appropriate for financing companies whose profits are stable and which have substantial fixed assets, such property companies.
  • 267.
    Financial System 251 Convertibledebentures: These carry an option at a fixed future date to convert the stock into ordinary shares at a fixed price. This option is compensated for by a lower rate of interest than an ordinary debenture, but convertible debentures are attractive since they offer the investor, without sacrificing his security, the prospect of purchasing equity shares cheaply in the future. For this reason, convertible debentures are issued at a time when it is difficult to raise capital either by equity or fixed interest securities. There are three ways in which a company may raise capital in the primary market. PUBLIC ISSUE By far the most important mode of issuing securities, a public issue involves sale of securities to the public at large. A company making a public issue informs the public about it through statutory announcements in the newspapers, makes application forms available through stock brokers and others and keeps the subscription open for a period of three to seven days. If the issue is over-subscribed, the pattern of allotment is decided in consultation with the stock exchange where the issue is proposed to be listed. After the allotment pattern is finalized the company mails the allotment advice/letter alongwith refund order, if any. This is supposed to be done within 10 weeks of the closure of subscription. If the full amount is not asked for at the time of allotment, the balance is called in one or two calls later. The letter of allotment is exchangeable for share certificates (or debenture certificates, as the case may be), after it is duly stamped by the bank where the balance payment is made. Of course, if the allottee wants he can sell the letter of allotment itself by transmitting it alongwith a transfer deed. If the allottee fails to pay to call money as and when called by the company, the shares are liable to be forfeited. In such a case, the allottee is not eligible for any refund of the amounts already paid. While a new company set up by promoters without a track record is required to issue its shares at par, other companies are allowed to make a public issue at a premium. Right Issue A right issue involves selling securities in the primary market by issuing rights to the existing shareholders. When a company issues additional equity capital, it has to be offered in the first instance to the existing shareholders on a pro rata (proportional) basis. This is required under Section 81 of the Companies Act 1956. The shareholders however, may by a special resolution forfeit this right, partially or fully, to enable a company to issue additional capital to the public. Private Placement In a private placement, funds are raised in the primary market by issuing securities privately to some investors without resorting to underwriting (insurance against risk by a guarantor). The investors in this case may by financial institutions, commercial banks, other companies, shareholders of promoting companies, and friends and associates of the promoters.
  • 268.
    252 Financial Management GroupA and Group B Shares The listed shares are divided into two categories: Group A shares (also referred to as cleared securities or specified shares) and Group B shares (also referred to as non-cleared securities or non-specified shares). For Group A shares, the facility for carrying forward a transaction from one account period to another is available; for Group B shares, it is not. Group A shares basically represent large, well-established companies that have a broad investor base and are very actively traded. Since transactions in these shares can be carried forward, these shares attract a lot of speculative trading. This seems to be the reason why these shares, other things being equal, tend to command higher price-earning multiples. This is clear from the fact that whenever a share is moved from Group B to Group A, its market price rises; likewise, when a share is shifted from group A to Group B market price declines. The Mumbai Stock Exchange employs several criteria for shifting stocks from the non-specified list to the specified list. The key ones are that the company must have an equity base of Rs. 10 crore, a market capitalization of Rs. 25–30 crore, a public holding of 35 to 40 percent, a shareholding population of 15,000 to 20,000 a dividend paying status and a good growth potential. SECURITIES AND EXCHANGE BOARD OF INDIA (SEBI) In 1988, SEBI was created by an administrative feat of the Ministry of Finance. Since then SEBI has gradually been granted more and more powers. With the repeal of the Capital Issues Control Act and the enactment of the SEBI Act in 1992, the regulation of the primary market has become the preserve of SEBI. Further, the Ministry of Finance has transferred a number of powers under the Securities Contracts (Regulation) Act 1956 also to SEBI. Before the establishment of the SEBI, the principal legislations governing the securities markets in India were the Capital Issues Control Act 1956 (governing the primary market) and the Securities Contract (Regulation) Act 1956 (governing the secondary market). The regulatory powers were vested with the Controller of Capital Issues (for the primary market) and the Stock Exchange Division (for the secondary market) in the Ministry of Finance, Government of India. Functions 1. The SEBI Act armed SEBI with statutory powers. 2. It has entrusted SEBI with the responsibility of dealing with various matters relating to the capital market. SEBI’s principle tasks are to: 1. regulate the business in stock exchanges and any other securities market. 2. register and regulate the working of capital market intermediaries (brokers, merchant bankers, portfolio mangers and so on).
  • 269.
    Financial System 253 3.register and regulate the working of mutual funds. 4. promote and regulate self-regulatory organizations. 5. prohibit fraudulent and unfair trade practices in securities markets. 6. promote investors’ education and training of intermediaries of securities markets. 7. prohibit insider trading in securities. 8. regulate substantial acquisition of shares and take-over of companies. 9. perform such other functions as may be prescribed. Trading Procedure at Stock Exchanges Securities can be traded at a stock exchange only if it is listed at that stock exchange or any of the other stock exchanges. Listing is a procedure by which, the issuing company has to enter into an agreement, called the listing agreement, with a stock exchange and has to abide by the clauses of the listing agreement regarding disclosure of information, payment of listing fees redressal of investor’s grievance etc. Once listed, the security can be traded at other stock exchanges too. The sale and purchase (transaction) of securities at the stock exchange can be done only through registered share brokers. An investor desiring to enter into a transaction has to place an order with one of the share brokers. In the ‘outcry’ system where the brokers used to shout, the deals are confirmed in few hours but in the screen-based system, the deals are confirmed immediately. The investor then gives the delivery of the securities in case of sale, or makes the payment in case of purchase of security, to the stock broker. The stock broker in turn makes the payment for the securities sold or delivers the security certificate purchased on the completion of settlement programme of the stock exchange. Generally, it takes 15 to 20 days for completion of the transaction. The National Stock Exchange and the Over The Counter Exchange of India (OTCEI) have been operating since their inception at the national level through satellite-linked computer based system. To be in tune with the NSE, the stock exchanges at Mumbai, Delhi, Ahmedebad, and Calcutta, have already converted their operations from the ‘outcry’ system to the computerised one. The transactions at these stock exchanges now take place through computer based online screen system. Recent Trends in Capital Market In recent years, Non-Banking Finance companies, variously called as “finance companies or corporations”. Finance companies have mushroomed all over the country and have been making rapid progress. These finance companies or corporations, with very little capital of their own–less than Rs. 1 lakh have been raising deposits from the public by offering attractive rates of interest and other incentives. They advance loans to wholesale and retail traders, small-scale industries and self- employed persons. Bulk of their loans is given to parties which do not either approach commercial banks or are denied credit facilities by the latter. The finance companies give loans which are generally unsecured and the rate of interest charged by the then generally range between 24 to 36 percent per annum.
  • 270.
    254 Financial Management Thenumber of official stock exchanges (SEs) in India has increased from nine in 1979–80 to 23 as at the end of March 2003. In fact, the number of SEs has remained to be 23 during 1993-94 to 2000-03. India has not the largest number of organized and recognized SEs in the world. All of them are regulated by the SEBI. They are organized either as voluntary, non-profit-making associations (viz., Mumbai, Ahmedabad, Indore), or public limited companies (viz., Calcutta, Delhi, Bangalore), or company limited by guarantee (viz., Chennai, Hyderabad). The BSE is the premier or apex stock exchange in India. It is the biggest in size in terms of the amount of fresh capital raised, secondary market turnover and captialisation and the total listed companies and their paid-up capital. It is also the oldest market and has been recognized permanently, while the recognition for other exchanges is renewed every five years. Its business is no longer confined to Mumbai alone; at the end of 1997, there were 100 other cities in which it had set up business. The NSEI has a fully automated, electronic, screen-based trading system. It is sponsored by the IDBI and co-sponsored by other term-lending institutions, LIC, GIC, other insurance companies, commercial banks, and other financial institutions; viz., SBI Caps, SHCIL, and ILFs. Its objectives are : (a) to provide nation-wide equal access and fair, efficient, completely transparent securities trading system to investors by using suitable communication network, (b) to provide shorter settlement cycles and book entry settlement system, (c) to bring the Indian stock market in line with international markets, (d) to promote the secondary market in debt instruments such as government and corporate bonds. It was set up in 1992 and was the first stock exchange in India to introduce screen-based automated ring less trading system. It is promoted by UTI, ICICI, IDBI, IFCI, LIF, GIC, SBI Caps, and CANBANK as a company under Section 25 of the Companies Act 1956, with headquarters at Mumbai. Its objectives are : (a) to help companies to raise capital from the market at the cheapest costs and on optimal terms; (b) to help investors to access capital market safely and conveniently; (c) to cater to the needs of the companies which cannot be listed on other official exchanges; (d) to eliminate the problems of illiquid securities, delayed settlements, and unfair prices faced by the investors. There are 20 other national and regional exchanges located in metropolitan centers and other cities in India. Operational Performance of Stock Exchanges Exchange No. of Listed Market Total Corporate Companies Capitalization Members Members (1) (2) (3) (4) 1. Ahmedabad 551 7,681 285(323) 49(151) 2. Bangalore 253 17,812 230(245) 51(114) 3. Bhubaneshwar 43 887 222(233) 8(18) Contd....
  • 271.
    Financial System 255 4.Calcutta 1,962 77,131 861(987) 78(200) 5. Cochin 90 7,244 488(464) 38(75) 6. Coimbatore 86 1,233 192(182) 42(62) 7. Delhi 1,579 30,465 379(374) 65(212) 8. Gawahati 175 786 206(175) 0(5) 9. Hyderabad 520 11,917 304(306) 23(120) 10. Jaipur 145 4,004 587(555) 0(19) 11. Ludhiana 227 7,198 275(302) 48(85) 12. Madhya Pradesh 229 6,645 188(188) 11(34) 13. Chennai 593 28,604 200(186) 49(71) 14. Magadh 29 246 193(199) 3(20) 15. Manglore 18 3,183 147(116) 2(11) 16. Mumbai 3,990 5,63,748 608(665) 71(446) 17. NSEI 422 2,17,721 873(1036) 736(918) 18. OTCEI 88 643 785(883) 544(675) 19. Pune 121 12,533 197(197) 23(59) 20. Saurashtra kutch 36 1,999 437(436) 38(85) 21. Uttar Pradesh 321 7,260 507(518) 13(103) 22. Vadodara 372 10,633 312(319) 25(65) 23. Total 11,750 10,19,573 8,476(9519) 1,917(3794) Source : SEBI, Annual Report and RBI, Annual Report. SHARE MARKET TERMINOLOGY Ask price: The lowest price at which a seller is willing to offer a security of the time; also known as the ‘offer’. If a person enters a market in order to buy a security, he will usually pay the ask price. Bear: A person who expects prices to fall and sells securities hoping to make a profit by subsequently repurchasing at a lower price. Bid: The price at which someone is prepared to buy shares. Brokerage: Charges made by a broker for acting as a agent in the buying and selling of shares. Bull: A person who buys securities in the expectation that prices will rise and so give him an opportunity to resell on a profit. Call option: An option giving the taker the right, but not the obligation, to buy the underlying shares at a specified price on or before a specified date.
  • 272.
    256 Financial Management Depreciation:Amounts charged to provide for that part of the cost, or book value of a fixed asset, which is not recoverable when it is finally put out of use. Dividend: Distribution of a part of a company’s net profit to shareholders as a reward for investing in the company. Usually expressed as percentage of par value or as cents per share. Equity: The general term for ownership in securities value over debit balance. Growth stock: Stock with good prospects for future expansion, which promises capital gain. Immediate income prospects may be modest. Limited liability: The liability of the shareholder in this type of company is limited to the extent of any unpaid capital on his shares. Market order: An order to buy or sell a security at the next available price. A buy order is executed at the lowest price available and a sell order is executed at the highest price available. All market orders are day orders. Mutual funds: Type of investment operated by an investment company that raises money from shareholders and invests it in a portfolio of stocks, bonds, or other securities. These funds offer investors the advantages of diversification and professional management. For these services they typically charge a management fee, which must be disclosed in the prospectus. Each mutual fund has its own investment objectives and strategies. NASDAQ (National Association of Securities Dealers Automated Quotations): Owned and operated by the NASD, NASDAQ is the computerized network that provides price quotations for securities traded over the counter as well as many listed securities. Open price: The price at which a security starts in a trading day. Portfolio: Investors holding of securities of various types. Preference shares: Rank above ordinary shares for claims an assets, earnings and dividends but rank below creditors and debenture holders. These shares usually have a fixed dividend rate. Premium: The amount by which a security is quoted or issued above its value. The opposite to ‘discount’. Security: An instrument that represents an ownership interest in a corporation (stock), a creditor relationship with a corporation or government body (bond), or rights to ownership through such investment vehicles as options, rights, and warrants. Stag: A person who applies for a new issue of securities with the intention of selling immediately at a profit as opposed to one who invests for long-term holding. Par value: The par value is stated in the memorandum and written on the share script. The par value of equity shares is generally Rs. 10 (the most popular denomination) or Rs.100. As per the SEBI guidelines any company coming with new issues from April 2000 onwards the par value of their shares should be of Rs.10 denomination. Book value: The book value of an equity share is = Paid up equity capital + Reserve and surplus Number of outstanding equity shares
  • 273.
    Financial System 257 Quitenaturally, the book value of an equity share tends to increase as the ratio of reserves and surplus to the paid-up equity capital increases. Market value: The market value of an equity share is the price at which it is traded in the market. This price can be easily established for a company that is listed on the stock market and actively traded. For a company that is listed on the stock market but traded very infrequently. It is difficult to obtain a reliable market quotation. For a company that is not listed on the stock market, one can merely conjecture as to what its market price would be if it were traded. Insider trading: Share market dealing by persons who have ‘inside’ knowledge of the companies whose shares are transacted. Insiders could be directors or top-level employees or even auditors of the company. Insider trading is a punishable offence in India. Commodity futures markets: One of the components of the Indian securities market is the commodity futures markets. This functions through the introduction of nationwide electronic trading and market access, as was done of the equity market during 1994–96. For the transactions there new exchanges have come about: National Commodity Derivative Exchange (NCDEX), Multi Commodity Exchange (MCX) and National Multi Commodity Exchange (NECE). The National Commodity Derivative Exchange has emerged as the largest commodity futures exchange. Main Share Price Index in Famous Share Market of the World Mumbai — DOLEX, SENSEX, S and PCNX, NIFTY FIFTY New York — DOW JONES Tokyo — NIKKEI Frankfurt — MID DAX Hong Kong — HANG SENG Singapore — SIMEX, STRAITS TIMES Sensex: The Stock Exchange Sensitive Index (popularly referred to as the SENSEX) reflects the weighted arithmetic average of the price relative to a group of shares included in the index of sensitive shares. For example, Bombay Stock Exchange Sensitive index is a group of 30 sensitive shares. Name of share price indices changed On 28 July, 1988, main share price indices have been renamed as follows: Old Name New Name NSE – 50 — S and PCNX Nifty Crisil 500 — S and PCNX–500 Money Market Money market is one of the part of Indian financial market which provides short-term financial requirements of the industrial and business concern. Money market again subdivided into the following categories on the basis of the instruments used in the money market.
  • 274.
    258 Financial Management Awell-organised money market is the basis for an effective monetary policy. A money market may be defined as the market for lending and borrowing of short-term funds. It is the place where the short-term surplus investable funds at the disposal of banks and other financial institutions are bid by borrowers comprising companies, individuals and the government. The Reserve Bank occupies a pivotal position in the Indian money market as it controls the flow of currency and credit into the market. The Indian money market is classified into the following ways: Indian money market consists of two parts: The unorganised and the organised sectors. The unorganised sector consists of indigenous bankers who pursue the banking business on traditional lines. The organised sector comprises the Reserve Bank, the State Bank of India and its associate banks, the 19 nationalised banks and other private sector banks, both Indian and foreign. The organised money market in India has a number of sub-markets such as the Treasury Bills Market: the Commercial Bills Market and the Inter-Bank Call Money Market. On the recommendations of the Sukhmoy Chakravarty Committee on the Review of the working of the Monetary System, the RBI has initiated a series of money market reforms. The Narasimhan Committee report on the Working of the Financial System in India, (1991) also made important recommendations on the Indian money market. As par of its anti-inflationary policy, the RBI has followed a strict policy of interest rate control and regulations. Deposit rates of banks, lending rates of banks and financial institutions- in fact, all kinds of interest rates were subject to strict control and regulation by the RBI. Since 1988, the RBI has removed the ceiling stipulation (of 16.5% per annum) for all bank advances and instead has fixed a minimum of 16% per annum. Banks have been asked to ensure that the interest rates charged remain within reasonable limits. Subsequently, the ceiling on interest rates on inter-bank call and short notice money, inter short-term deposits, bills rediscounting and inter-bank participation were removed from May 1989 and the rates were permitted to be determined by market forces. Organised Banking Sector Unorganised Banking Sector Sub-markets Call Money Market Bill Market 364 Days Bill Market Certificates of Deposits (CDs) Commercial Papers (CPs) Commercial Bill Treasury Bills (91 days) Indian Money Market Fig. 13.9 Indian Money Market
  • 275.
    Financial System 259 1.Call money market: It is the market for very short-term funds repayable on demand and with the maturity period is less than 15 days. Call money market is mainly located in major industrial and commercial areas like Delhi, Mumbai, Kolkatta, Chennai and Ahmedabad. 2. Treasury bill market: Treasury bills are also one of the short-term financial instruments, which deal in money market. Treasury bill is a kind of finance bill or promissory note issued by the government to raise short-term funds. Treasury bills duration vary from 14 days to 364 days. Traditionally, the Indian money market had suffered from inadequacy of short- term credit instruments. On the recommendations of the Vaghul Working Group, the RBI has introduced many new money market instruments. Treasury bills: Instruments for short-term borrowing by the government. The bills are promissory notes to pay to the bearer after the maturity period. The bills are issued by tender to the Money Market and to Government Departments. Tenders are invited every week from bankers, discount houses and brokers. The Treasury Bills provide the government with a highly flexible and relatively cheap means of borrowing money to meet its fluctuating needs for cash. In the past there were only 91days treasury bills, which were traded in the Indian money market. The new instruments introduced by the RBI are: 182 days treasury bills, 364 days treasury bills, longer maturity treasury bills, dated Governments securities, certificates of deposits and commercial paper. At one time, the demand for the treasury bills by commercial banks was solely governed by Statutory Liquidity Ration (SLR) considerations. This is not true any more. Besides, the secondary market transactions in them are being increasingly driven by the felt-need for effective management of short-term liquidity by the commercial banks. 182 days treasury bills were variable interest bills and were sold through fortnightly auctions. The yield of these long-dated papers had become attractive for a highly liquid instrument. These were replaced by 364 days treasury bills. 364 days treasury bills there is a considerable scope for banks and financial institutions to be interested in long-dated bills, as they are far superior to their loan assets and investments which cannot be easily liquidated in times of need, without incurring heavy loses. The 364 days Treasury Bills have thus become an important instrument of Government borrowing from the market and also leading money market instrument in the sense that their yield is most reflective of market conditions. Financial institutions recongnise the yield rate on 364 days Treasury Bills–at present around 12.5 to 13 percent–as anchor rate on the basis of which interest rate instruments are floated. The fortnightly offerings of these bills bring in, annually, about Rs. 20,000 crores to the Government. These bills are entirely held by the market and RBI does not subscribe to them. RBI introduced two more Treasury Bills in 1997: (i) 14 days
  • 276.
    260 Financial Management IntermediateTreasury Bills from April 1997 at a discount rate equivalent to the rate of interest on ways and means advances to the Government of India–these bills cater to the needs of State Governments, foreign central banks and other specified bodies (these have surplus funds which can be invested for very short periods), (ii) A new category of 14 days Treasury Bills, sold through action for the first time in June 1997 to meet the cash management requirements of various sections of the economy. Dated Government Securities: The Government of India has also decided to sell dated securities (of 5 year maturity and 10 maturity) on an auction basis. The purpose of this Government decision is: (i) to develop dated securities as a monetary instrument with flexible yields; (ii) to provide financial instruments to suit investors’ expectations; and (iii) to meet Government needs directly from the market. A very interesting development is the introduction of repurchase auctions (Repos, for short), since December 1992, in respect of Central Government dated securities. Repos are now a regular feature of RBI’s market operations. One purpose of Repos is to even out short- term fluctuations in liquidity of the money market. When Government securities are repurchased from the market, RBI makes payment to commercial banks and this adds to their liquidity. Repos are developing into a useful instrument to even out sharp fluctuations in the money market. Discount and Finance House of India Ltd. (DFHI) DFHI has been set up as a port of the package of reform of the money market. It fills the long-standing need of a discount house in India, which will buy bills and other short-term paper from banks and financial institutions. In this way, DFHI enables banks and financial institutions to invest their idle funds for short periods in bills and short dated paper. Banks can sell their short-term securities to DFHI and get funds, in case they need them, without disturbing their investments. The DFHI has been very active in the short-term money market and has effectively contributed to the overall stability of the money market. 3. Commercial bills market: Another Sub-division of money market is commercial bill market. A commercial bill or a bill of exchange is a short-term, negotiable, and self liquidating money market instrument. It may be classified into clean bills, document bills, inland bills, foreign bills, accommodation bills and supply bills etc. Commercial Paper (CP) The commercial paper (CP) is issued by companies with a net worth of Rs. 5 crores. The CP is issued in multiples of Rs. 25 lakhs subject to a minimum issue of Rs. 1 crore. The maturity of CP is between 3 to 6 months. The CPs are issued at a discount rate is freely determined. The maximum amount of CP that a company can raise was limited to 20% (now raised to 30%) of the maximum permissible bank finance. The purpose of introducing CP is to
  • 277.
    Financial System 261 enablehigh-level corporate borrowers to diversify their sources of short-term borrowings on the one hand, and provide an additional instrument to the banks and financial institutions in the money market, on the other. 4. Certificate of deposits(CDs): The CDs are another important instrument of money market. They are issued by banks in multiples of Rs. 25 lakhs subject to a minimum amount of Rs. 1 crore. The maturity is between 3 months and one year. They are issued at a discount to the face value and the discount rate is freely determined according to market conditions. CDs are freely transferable after 45 days from the date of issue. Money Market Mutual Funds(MMMFs) In April 1992 the Government announced the setting up of Money Market Mutual Funds (MMMFs) with the purpose of bringing Money Market instruments within the reach of individuals. Scheduled commercial banks and public financial institutions would set up the MMMFs. The shares/units of MMMFs would be issued only to individuals. In this respect, they will differ from UTI and other mutual funds which have been mobilizing the savings of the middle classes (and also of others including companies) for investment in equities in the capital market. Mutual funds have emerged as an important segment of financial markets in India, especially following the initiatives taken by Government in the 1999–2000. Budget to resolve problems associated with UTIs US 64 scheme and to liberalise tax treatment of incomes earned through mutual funds. The now plays a crucial role in channeling savings of millions of individuals/households form different parts of the country into investment in both equity and debt instruments. The mutual fund industry has witnessed several innovations in the current financial year. The monetary and credit policy for 1999–2000 has permitted money market mutual funds to offer cheque writing facility to unit holders. Some of the Mutual Funds have introduced limited cheque writing facility by allowing its unit holders to issue cheques against a savings account with a designated bank. The Mid-term Review of Monetary and Credit Policy announced the decision to permit scheduled commercial banks to offer “cheque writing” facility to Gilt Funds and those Liquid income Schemes of Mutual Funds which predominantly (not less than 80 percent of the corpus) invest in money market instruments. Another significant development related to the emergence of sector funds targeting sectors such as information technology, pharmaceuticals, fast moving consumer goods, etc. Equally important was the emergence of Dedicated Gilt Fund envisaging 100 percent investment in Government securities, which has made the Gilt Market accessible to small investors. In order to promote dematerialization, the mutual fund industry introduced an innovative product facilitating investment solely in dematerialized securities and exchange of any security in dematerialised segment for the units of the scheme.
  • 278.
    262 Financial Management VentureCapital Funds (VCFs) The Union Budget for 1999–2000 stressed the need for higher investment in venture capital activity (investment in economic activities where risk is high and there is considerable innovation involved e.g. in the knowledge based enterprises). As it is difficult to access capital market to raise funds for technology development/demonstration, especially for small and medium industries, VCF has a major role to play in this area. The National Venture Fund for Software and IT industry (NVFSIT) launched in the current financial year merits mention in this context. The Small Industry Development Bank of India (SIDBI) Venture Capital Ltd. (SVCL) manages NVFSIT, which is a wholly owned subsidiary of SIDBI. In the backdrop of these developments, SEBI initiated a process of interaction with industry participants and experts to identify the various issues and key areas for the development of the VCF industry in India. Financial Services Financial Services are the another and unavoidable component of the financial system of the country. Normally financial services are provided by the non-banking financial companies and later it is called as non-banking financial service companies. Financial services are divided into two major categories such as: Financial Services Fund Based Fee Base Mutual Fund Venture Capital Leasing Finance Hire Purchase Merchant Banking Credit Rating Project Counselling Fig. 13.10 Financial Services Fund Based Financial Services Fund based financial services such as leasing, venture capital, hire purchasing, insurance and mutual funds etc. Because, these services are related to the funds transfer from one place to another place and one person to another person. Fee Based Financial Services Fee based financial services such as merchant banking, underwriting, project counseling, credit rating etc., because, these services such as merchant banking, underwriting, project counseling, credit rating etc., because, these services are not related to any funds transfer activities.
  • 279.
    Financial System 263 Non-bankingFinance Companies (NBFC) The categories of NBFCs and the nature of their main activities currently being followed by the RBI, which are very similar to the ones discussed by the Shah Working Group, are as follows: 1. Equipment leasing company (ELC) means any company which is carrying on as its principal business, the activity of leasing of equipment or the financing of such activity. 2. Hire-purchase finance company (HPFC) means any company which is carrying on as its principal business, hire-purchase transactions or the financing of such transactions. 3. Housing finance company (HFC) means any company which is carrying on as its principal business, the financing of the acquisition or construction of houses including the acquisition or development of plots of land in connection therewith. 4. Investment company (IC) means any company which is carrying on as its principal business, the acquisition of securities. 5. Loan company (LC) means any company which is carrying on as its principal business, the providing of finance whether by making loans or advances, or otherwise for any activity other than its own. This category does not include an equipment leasing company or a hire-purchase finance company or a housing finance company. 6. Mutual benefit financial company (MBFC) means any company which is notified by the Central Government under Section 620A of the Companies Act 1956 (1 of 1956). 7. Miscellaneous non-banking company (MNBC) means a company carrying on all or any of the following types of business : (a) Managing, conducting or supervising as a promoter, foreman or agent of any transaction or arrangement by which the company enters into an agreement with a specified number of subscribers that every one of them shall subscribe a certain sum in installment over a definite period and that every one of such subscribers shall in his turn, as determines by lot or by auction or by tender or in such other manner as may be provided for in the agreement be entitled to the prize amount. (b) Conducting any other form of chit or kuri which is different from the type of business referred to above. Undertaking or carrying on or engaging in or executing any other business similar to the business referred to above. 8. Residuary non-banking company (RNBC) means a company which receives any deposit under any scheme or arrangement, by whatever name called, in one lump sum or in installments by way of contributions or subscriptions or by sale of units or certificates or other instruments, or in any other manner and which according to the definitions contained in the Non-Banking Financial Companies (Reserve Bank) Directions, 1977 or as the case may be, the Miscellaneous
  • 280.
    264 Financial Management Non-BankingCompanies (Reserve Bank) Directions, 1977 is not an insurance company or a company belonging to one to seven at the previous page. MODEL QUESTIONS 1. Define financial system? 2. Explain the major component of financial system? 3. Discuss various classification of banking as per the RBI Act? 4. Explain the role of NBFI in Indian economy? 5. What is financial market? 6. Explain the money market instrument? 7. What are the major stock market instruments? 8. Discuss the stock market performance in India. 9. What is financial services? 10. Explain the different categories of financial services provided by the NBFC. 11. Discuss the role of Life Insurance Corporation of India.