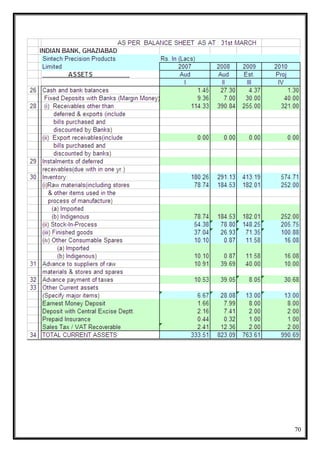
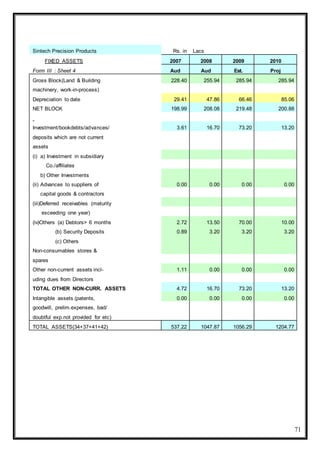
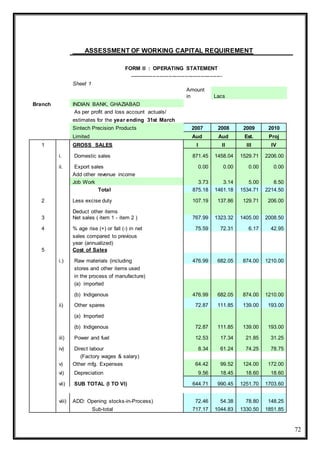
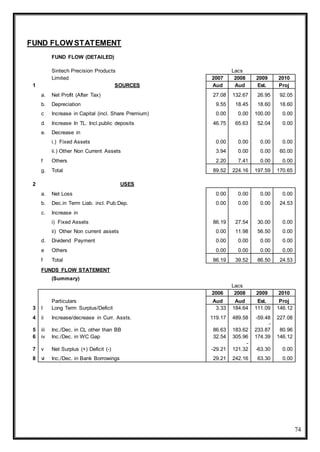
This document is a certificate from Sintech Precision Product Limited certifying that the summer training project titled "WORKING CAPITAL MANAGEMENT and ITS APPRAISAL" completed by Bulbul Sharma from 1st June, 2009 to 31st July, 2009 is an original work. It includes an acknowledgement thanking various people who helped with the project. The table of contents provides an outline of the project including sections on industry profile, company overview, conceptual framework, working capital analysis and findings. The abstract introduces the project as a study of working capital management at Mondelez India Foods Pvt Ltd evaluating inventory, working capital ratios, trends and short term financing.
![C-189 & 190, Site No. 1, B.S. Road, Ind. Area, Ghaziabad [U.P.]
Phone No.: 0120-2866320/21,3290635/37/38Fax No. 0120-2867715
E-mail: marketing@sintechpumps.com Web Site: www.sintechpumps.com
CERTIFICATE
This is to certify that the Summer-Training Project of FINANCE Titled
“WORKING CAPITAL MANAGEMENT and ITS APPRAISAL” is an original
work and that this work has not been submitted anywhere in any form. My
indebtedness to other works/publications has been duly acknowledged at the
relevant places. The project workwas carriedfrom 1st June, 2009 to 31st July 2009
in SINTECH PRECISION PRODUCT LIMITED.
Date: 31st July 2009
Signature
(Bulbul Sharma)
PGDM ( 2009-10)
Signature
(Mr. Sanjeev Garg)
Sintech Precision Product Limited](https://image.slidesharecdn.com/summer-training-finance-project-on-working-capital-management2-180204140437/85/Summer-training-finance-project-on-working-capital-management-2-1-320.jpg)

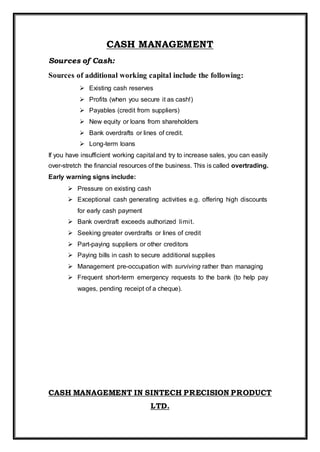


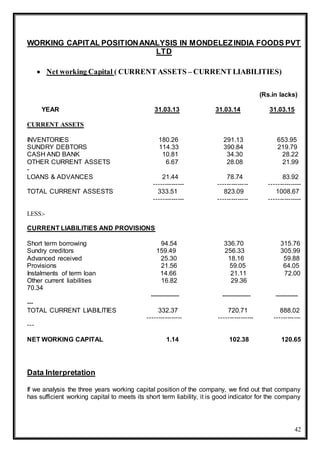
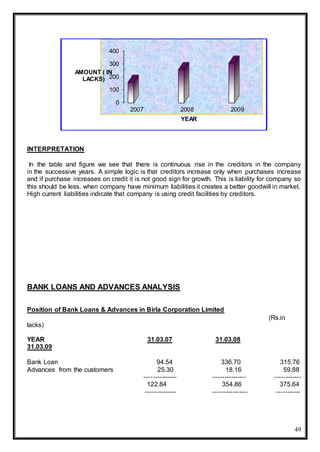

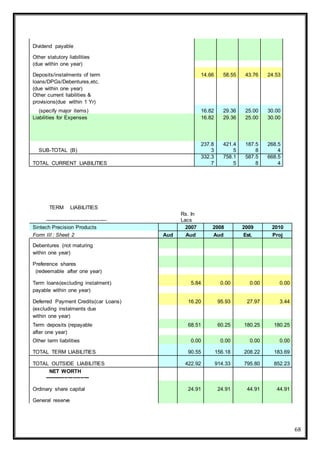
![73
Form II : Sheet 2 2007 2008 2009 2010
Sintech Precision Products Aud Aud Est. Proj
ix) Deduct : Closing stocks-in-
Process 54.38 78.80 148.25 205.75
x) Cost of Production 662.79 966.03 1182.25 1646.10
xi) Add : Opening stock of
finished goods 3.19 37.04 26.93 71.35
SUB-TOTAL 665.98 1003.07 1209.18 1717.45
xii) Deduct closing stock of
finished goods 37.04 26.93 71.35 100.88
xiii) SUB-TOTAL (Total cost of Sales) 628.94 976.14 1137.83 1616.57
6 Selling general and administrative
Expenses 82.59 143.09 158.00 190.00
7 SUB-TOTAL (5+6) 711.53 1119.23 1295.83 1806.57
8 Operating profit before interest 56.46 204.09 109.17 201.93
( 3-7 )
9 Interest 12.31 60.23 76.17 81.20
10 Operating profit after interest (8-9) 44.15 143.86 33.00 120.73
11 (i) Add other non-operating income
(a) Bank Interest on FDRs 0.15 1.43 2.00 2.00
(b)
(c)
(d)
Sub-total ( income ) 0.15 1.43 2.00 2.00
(ii) Deduct other non-operating expenses
(a) P&P expense inncluding 0.09 0.00 0.00 0.00
all book entries written off
(b)
Sub-total ( expenses ) 0.09 0.00 0.00 0.00
(iii) Net of other non-operating 0.06 1.43 2.00 2.00
income/expenses
12 Profit before tax/loss[10+11(iii)] 44.21 145.29 35.00 122.73
13 Provision for taxes 17.13 12.62 8.05 30.68
14 Prior Years Adjustment(if any)# 0.00 0.00 0.00 0.00
15 Net profit/loss for the year ( 12-13 ) 27.08 132.67 26.95 92.05
16 (a) Equity dividend paid-amt
(Already paid+ B.S. provision)
(b) Dividend Rate
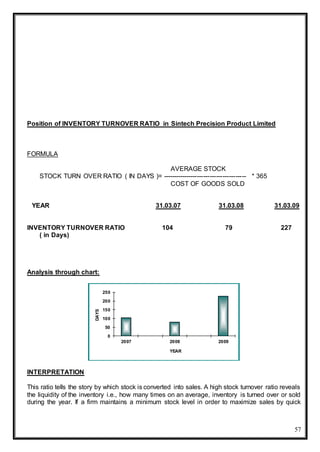
17 Retained profit ( 14-15 ) 27.08 132.67 26.95 92.05
18 Retained profit/Net profit (% age) 100.00 100.00 100.00 100.00
# (-)ve for expense/provisions and (+) ve for gains](https://image.slidesharecdn.com/summer-training-finance-project-on-working-capital-management2-180204140437/85/Summer-training-finance-project-on-working-capital-management-2-73-320.jpg)


![Manoj_RM[1].docxbddddddddddddddddddddddddddddd](https://cdn.slidesharecdn.com/ss_thumbnails/manojrm1-240714132239-8f901766-thumbnail.jpg?width=640&height=640&fit=bounds)


