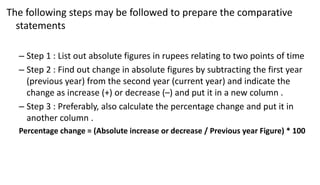
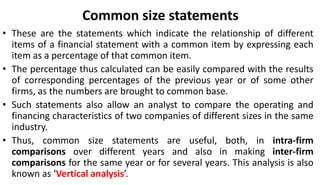
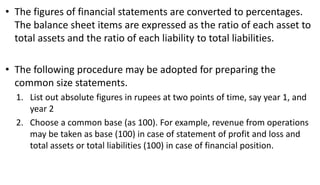
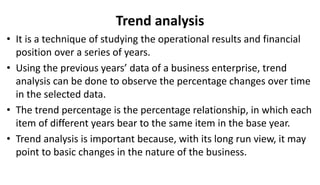
Financial Statement Analysis
What is financial statement analysis?
• Financial Statement Analysis is a method of reviewing and
analyzing a organization‘s accounting reports (financial
statements) in order to gauge its past, present or projected
future performance.
• It is an important means of assessing past performance and in
forecasting and planning future performance.
• Financial statement analysis is a systematic and specialized
arrangement of information for the purpose of its interpretation
• This process of reviewing the financial statements allows for
better economic decision making
Users of financial statement analysis
• Management - The managers of the company use their financial statement
analysis to make intelligent decisions about their performance.
For instance, they may gauge cost per distribution channel, or how much cash they have left,
from their accounting reports and make decisions from these analysis results.
• Owners - Small business owners need financial information from their
operations to determine whether the business is profitable.
It helps in making decisions like whether to continue operating the business, whether to
improve business strategies or whether to give up on the business altogether
• Investors - Investors who have purchased shares in a company need financial
information to known the method which used by the company in
performance evaluation process.
The investors use financial statement analysis to determine what to do by through their
investments in the company, So depending on how the company is doing, the investors will
either hold onto their shares, sell them or buy more.
• Creditors - Creditors are interested in knowing if a company will be able to
pay its debts or loans as they become due.
The creditors use analysis of the company‘s accounting records to measure the company‘s
liquidity, or its ability to make short-term payments.
• Government - Governing and regulating bodies of the state look at financial
statement analysis to determine how the economy is performing in general
so they can plan their financial and industrial policies.
Tax authorities also analyze a company‘s statements to calculate the tax burden that
the company has to pay.
• Employees- Employees need to know if their employment is secure and if
there is a possibility to increase their salaries.
The employees want to be abreast of their company‘s profitability and stability.
Employees may also be interested in knowing the company‘s financial position to
see whether there may be plans for expansion and hence, career prospects for
them.
Interpretation of Financial Statements
• Interpretation of financial statements is the mental process of
understanding the terms or the simple elements resulting from the
analysis of the compounded financial statements and forming
opinions or inferences or conclusions about the various aspect of a
business enterprise , such as solvency , profitability , efficiency etc .
• It aims to explain the meaning and significance of the data
simplified by analysis.
Tools for Financial Statement Analysis
There are 05 main tools of financial statement analysis
1. Comparative statement analysis
2. Common size statement analysis
3. Trend analysis
4. Ratio analysis
5. Cash flow analysis
Comparative analysis
• These are the statements showing the profitability and financial
position of a firm for different periods of time in a comparative
form to give an idea about the position of two or more periods.
• It usually applies to the two important financial statements,
namely, Statement of financial performance and financial
position prepared in a comparative form with columns for the
figures for both the current year as well as for the previous year
and for the changes during the year, both in absolute and relative
terms.
• The financial data will be comparative only when same accounting
principles are used in preparing these statements.
• If this is not the case, the deviation in the use of accounting
principles should be mentioned as a footnote.
• Comparative figures indicate the trend and direction of financial
position and operating results. This analysis is also known as
horizontal analysis.
• The figures in the comparative statements can be used for
identifying the direction of changes and also the trends in
different indicators of performance of an organization.
The following steps may be followed to prepare the comparative
statements
– Step 1 : List out absolute figures in rupees relating to two points of time
– Step 2 : Find out change in absolute figures by subtracting the first year
(previous year) from the second year (current year) and indicate the
change as increase (+) or decrease (–) and put it in a new column .
– Step 3 : Preferably, also calculate the percentage change and put it in
another column .
Percentage change = (Absolute increase or decrease / Previous year Figure) * 100
Common size statements
• These are the statements which indicate the relationship of different
items of a financial statement with a common item by expressing each
item as a percentage of that common item.
• The percentage thus calculated can be easily compared with the results
of corresponding percentages of the previous year or of some other
firms, as the numbers are brought to common base.
• Such statements also allow an analyst to compare the operating and
financing characteristics of two companies of different sizes in the same
industry.
• Thus, common size statements are useful, both, in intra-firm
comparisons over different years and also in making inter-firm
comparisons for the same year or for several years. This analysis is also
known as ‘Vertical analysis’.
• The figures of financial statements are converted to percentages.
The balance sheet items are expressed as the ratio of each asset to
total assets and the ratio of each liability to total liabilities.
• The following procedure may be adopted for preparing the
common size statements.
1. List out absolute figures in rupees at two points of time, say year 1, and
year 2
2. Choose a common base (as 100). For example, revenue from operations
may be taken as base (100) in case of statement of profit and loss and
total assets or total liabilities (100) in case of financial position.
Trend analysis
• It is a technique of studying the operational results and financial
position over a series of years.
• Using the previous years’ data of a business enterprise, trend
analysis can be done to observe the percentage changes over time
in the selected data.
• The trend percentage is the percentage relationship, in which each
item of different years bear to the same item in the base year.
• Trend analysis is important because, with its long run view, it may
point to basic changes in the nature of the business.
• By looking at a trend in a particular ratio, one may find whether
the ratio is falling, rising or remaining relatively constant.
• From this observation, a problem is detected or the sign of good
or poor management is detected.

Financial Statement Analysis presentation

  • 1.
  • 2.
    What is financialstatement analysis? • Financial Statement Analysis is a method of reviewing and analyzing a organization‘s accounting reports (financial statements) in order to gauge its past, present or projected future performance. • It is an important means of assessing past performance and in forecasting and planning future performance. • Financial statement analysis is a systematic and specialized arrangement of information for the purpose of its interpretation • This process of reviewing the financial statements allows for better economic decision making
  • 3.
    Users of financialstatement analysis • Management - The managers of the company use their financial statement analysis to make intelligent decisions about their performance. For instance, they may gauge cost per distribution channel, or how much cash they have left, from their accounting reports and make decisions from these analysis results. • Owners - Small business owners need financial information from their operations to determine whether the business is profitable. It helps in making decisions like whether to continue operating the business, whether to improve business strategies or whether to give up on the business altogether • Investors - Investors who have purchased shares in a company need financial information to known the method which used by the company in performance evaluation process. The investors use financial statement analysis to determine what to do by through their investments in the company, So depending on how the company is doing, the investors will either hold onto their shares, sell them or buy more.
  • 4.
    • Creditors -Creditors are interested in knowing if a company will be able to pay its debts or loans as they become due. The creditors use analysis of the company‘s accounting records to measure the company‘s liquidity, or its ability to make short-term payments. • Government - Governing and regulating bodies of the state look at financial statement analysis to determine how the economy is performing in general so they can plan their financial and industrial policies. Tax authorities also analyze a company‘s statements to calculate the tax burden that the company has to pay. • Employees- Employees need to know if their employment is secure and if there is a possibility to increase their salaries. The employees want to be abreast of their company‘s profitability and stability. Employees may also be interested in knowing the company‘s financial position to see whether there may be plans for expansion and hence, career prospects for them.
  • 5.
    Interpretation of FinancialStatements • Interpretation of financial statements is the mental process of understanding the terms or the simple elements resulting from the analysis of the compounded financial statements and forming opinions or inferences or conclusions about the various aspect of a business enterprise , such as solvency , profitability , efficiency etc . • It aims to explain the meaning and significance of the data simplified by analysis.
  • 6.
    Tools for FinancialStatement Analysis There are 05 main tools of financial statement analysis 1. Comparative statement analysis 2. Common size statement analysis 3. Trend analysis 4. Ratio analysis 5. Cash flow analysis
  • 7.
    Comparative analysis • Theseare the statements showing the profitability and financial position of a firm for different periods of time in a comparative form to give an idea about the position of two or more periods. • It usually applies to the two important financial statements, namely, Statement of financial performance and financial position prepared in a comparative form with columns for the figures for both the current year as well as for the previous year and for the changes during the year, both in absolute and relative terms. • The financial data will be comparative only when same accounting principles are used in preparing these statements.
  • 8.
    • If thisis not the case, the deviation in the use of accounting principles should be mentioned as a footnote. • Comparative figures indicate the trend and direction of financial position and operating results. This analysis is also known as horizontal analysis. • The figures in the comparative statements can be used for identifying the direction of changes and also the trends in different indicators of performance of an organization.
  • 9.
    The following stepsmay be followed to prepare the comparative statements – Step 1 : List out absolute figures in rupees relating to two points of time – Step 2 : Find out change in absolute figures by subtracting the first year (previous year) from the second year (current year) and indicate the change as increase (+) or decrease (–) and put it in a new column . – Step 3 : Preferably, also calculate the percentage change and put it in another column . Percentage change = (Absolute increase or decrease / Previous year Figure) * 100
  • 10.
    Common size statements •These are the statements which indicate the relationship of different items of a financial statement with a common item by expressing each item as a percentage of that common item. • The percentage thus calculated can be easily compared with the results of corresponding percentages of the previous year or of some other firms, as the numbers are brought to common base. • Such statements also allow an analyst to compare the operating and financing characteristics of two companies of different sizes in the same industry. • Thus, common size statements are useful, both, in intra-firm comparisons over different years and also in making inter-firm comparisons for the same year or for several years. This analysis is also known as ‘Vertical analysis’.
  • 11.
    • The figuresof financial statements are converted to percentages. The balance sheet items are expressed as the ratio of each asset to total assets and the ratio of each liability to total liabilities. • The following procedure may be adopted for preparing the common size statements. 1. List out absolute figures in rupees at two points of time, say year 1, and year 2 2. Choose a common base (as 100). For example, revenue from operations may be taken as base (100) in case of statement of profit and loss and total assets or total liabilities (100) in case of financial position.
  • 12.
    Trend analysis • Itis a technique of studying the operational results and financial position over a series of years. • Using the previous years’ data of a business enterprise, trend analysis can be done to observe the percentage changes over time in the selected data. • The trend percentage is the percentage relationship, in which each item of different years bear to the same item in the base year. • Trend analysis is important because, with its long run view, it may point to basic changes in the nature of the business.
  • 13.
    • By lookingat a trend in a particular ratio, one may find whether the ratio is falling, rising or remaining relatively constant. • From this observation, a problem is detected or the sign of good or poor management is detected.