Downloaded 143 times

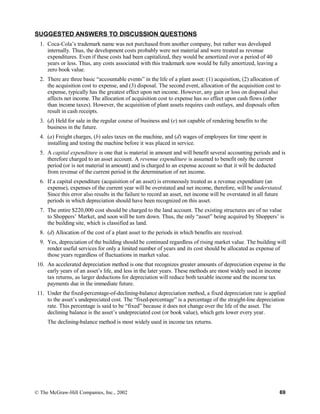


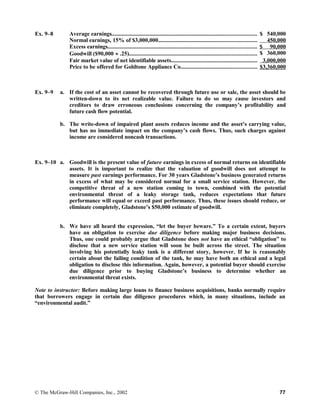
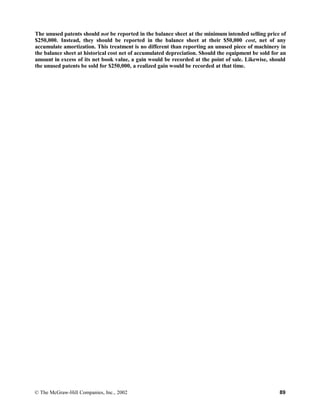
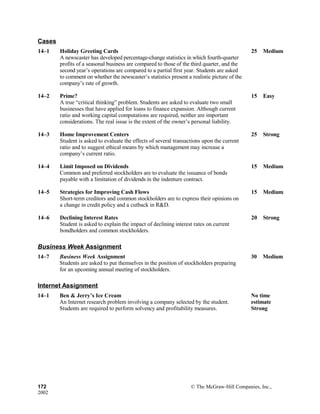
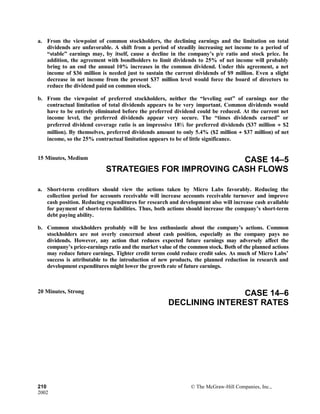
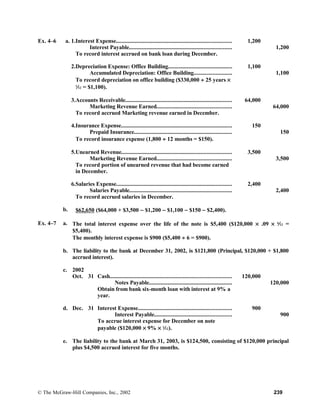
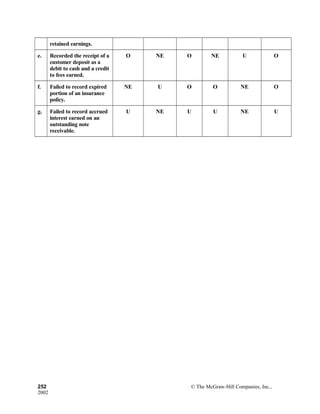
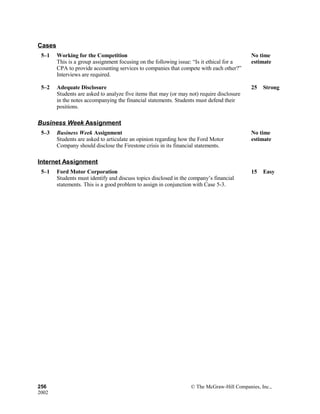
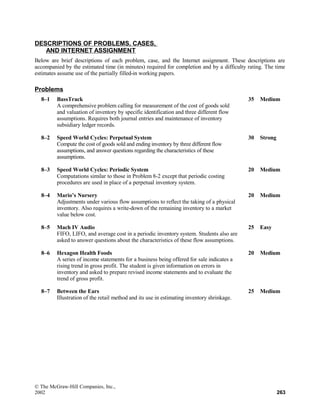
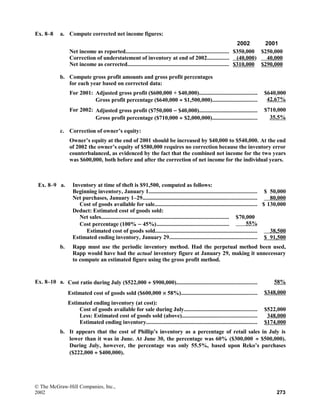
![Ex. 9–11 a. Inventory.................................................................................... 400,000
Accumulated Depletion: Northern Tier Mine............... 400,000
To record depletion on the Northern Tier Mine: 50,000 tons
mined × $8 per ton [($21,000,000 − $1,000,000) ÷ 2,500,000
tons = $8 per ton].
b. Property, plant, & equipment:
Mining property: Northern Tier Mine................................. $21,000,000
Less: Accumulated depletion................................................. 400,000 $20,600,000
c. No; the $400,000 of depletion of the mine should not all be deducted from revenue during
the first year of operations. Since only 40,000 of the 50,000 tons of ore mined were sold,
only 80% of the depletion cost ($320,000) should be deducted from revenue as part of the
cost of goods sold. The remaining 20% of this amount ($80,000) relates to the 10,000 tons
of ore still on hand and remains in the inventory account.
d. The journal entry in part a increases the current ratio, because it reclassifies an amount
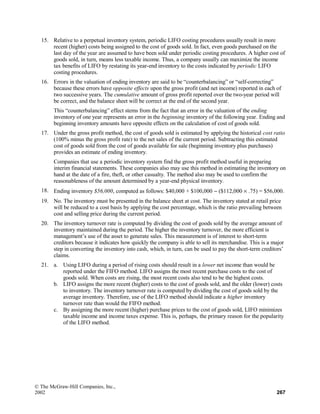
of plant assets as inventory, which is a current asset. Thus, current assets are increased.
Extracting ore from the ground does make the company more liquid. Mined ore is a more
liquid asset than ore that is still in the ground.
Ex. 9–12 The purpose of this exercise is to: (1) show students that gains and losses on disposals can be
very material in amount, (2) demonstrate that such gains and losses do not directly involve
cash flows and, therefore, are typically shown as adjustments to income in the statement of
cash flows, and (3) illustrate that the reasons for disposing of fixed assets may include
restructuring activities, damage caused by natural disasters, the need to upgrade
manufacturing processes, etc.
Ex. 9–13 a. $13,000 − $4,000 $9,000
= $0.18 per mile50,000 miles = 50,000 miles
b. 1,650,000 miles × $0.18 per mile = $297,000
c. Yes. The units-of-output method recognizes more depreciation in periods in which the
cars are driven more—which means that the cars are generating more revenue. The
straight-line method would recognize the same amount of depreciation expense regardless
of how much the automobiles were used (driven).
78 © The McGraw-Hill Companies, Inc., 2002](https://image.slidesharecdn.com/financialaccountingsolutionmanual-150513151151-lva1-app6891/85/Financial-accounting-solution-manual-14-320.jpg)

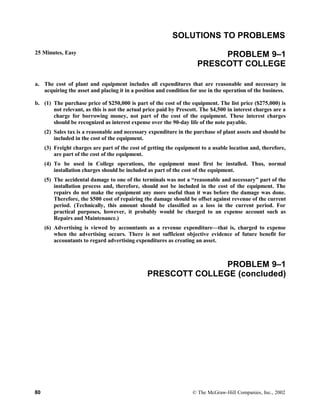


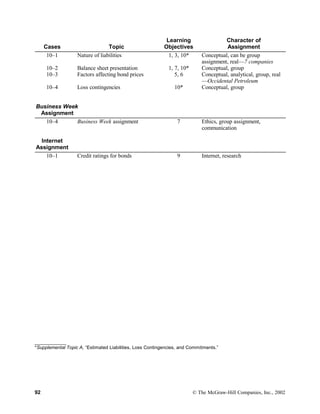


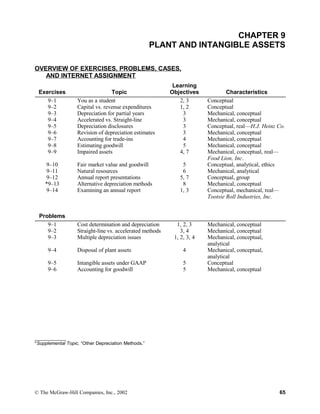
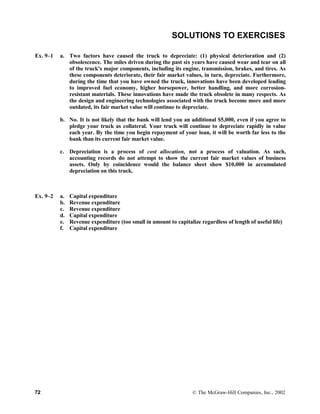
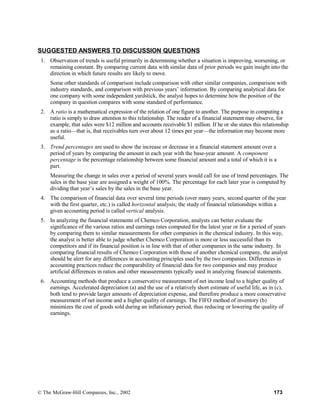
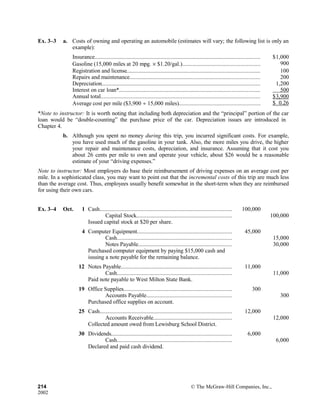
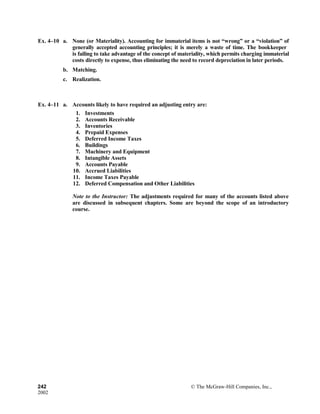
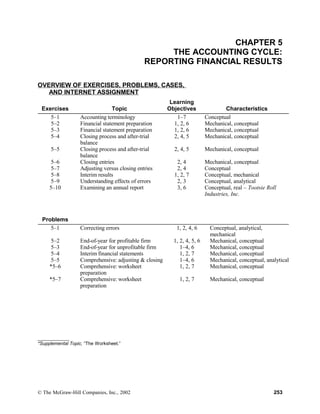
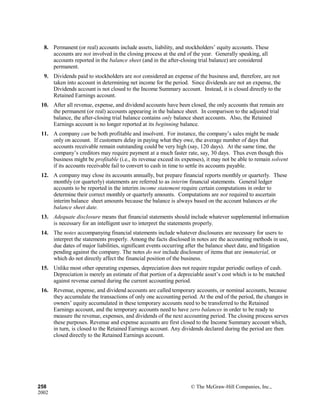
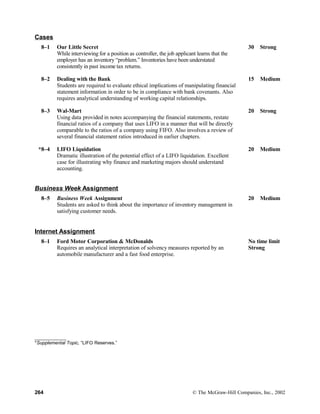
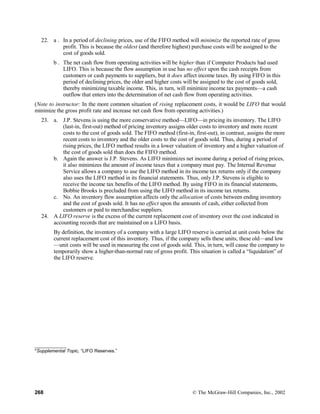
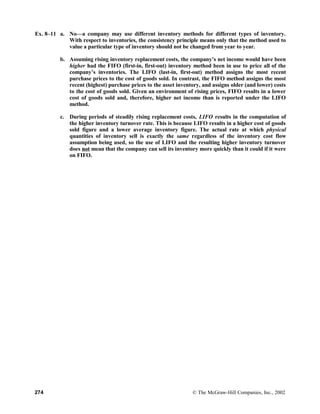
![SUGGESTED ANSWERS TO DISCUSSION QUESTIONS
1. Liabilities are debts or obligations arising from past transactions or events, and which require
settlement at a future date. Liabilities and owners’ equity are the two primary means by which a
business finances ownership of its assets and its business operations.
The feature which most distinguishes liabilities from equity is that liabilities mature, whereas owners’
equity does not. In the event of liquidation of the business, the claims of creditors (liabilities) have
priority over the claims of owners (equity). Also, interest paid to creditors is deductible in the
determination of taxable income, whereas dividends paid to stockholders are not deductible.
2. In the event of liquidation of a business, the claims of creditors (liabilities) have priority over the
claims of owners (equity). The relative priorities of individual creditors, however, vary greatly.
Secured creditors have top priority with respect to proceeds stemming from the sale of the specific
assets that have been pledged as collateral securing their loans. The priority of unsecured creditors is
determined by legal statutes and indenture contracts.
3. Current liabilities are those maturing within one year or the company’s operating cycle (whichever is
longer) and expected to be paid from current assets. Liabilities classified as long-term include
obligations maturing more than one year in the future, and also shorter term obligations that will be
refinanced or paid from noncurrent assets.
A 10-year bond issue would be classified as a current liability once it comes within 12 months of the
maturity date, assuming that the issue will be paid from current assets.
A note payable maturing in 30 days would be classified as a long-term liability if (a) management had
both the intent and the ability to refinance this obligation on a long-term basis, or (b) the liability will
be paid from noncurrent assets.
4. Accounts Payable (Smith Supply Company)................................................... 8,000
Notes Payable..................................................................................... 8,000
Issued a 12%, 90-day note payable to replace an account payable to Smith
Supply Company.
Notes Payable.................................................................................................
Interest Expense..............................................................................................
8,000
240
Cash.................................................................................................... 8,240
Paid 12%, 90-day note to Smith Supply Company.
5. All employers are required by law to pay the following payroll taxes and insurance premiums: Social
Security and Medicare taxes, unemployment taxes, and workers’ compensation insurance premiums.
In addition, many employers include the following as part of the “compensation package” provided to
employees: group health insurance premiums, contributions to employee pension plans, and
postretirement benefits (such as health insurance). Both mandated and discretionary costs are
included as part of total payroll cost in addition to the wages and salaries earned by employees.
6. Workers’ compensation premiums are a mandated payroll cost—the cost of providing insurance
coverage to employees in case of job-related injury. The dollar amount of the premiums varies by
state and by employees’ occupation. The employer pays workers’ compensation premiums. Social
Security and Medicare taxes are paid half by the employer and half by the employee.
7. $62,537 [$63,210 balance at the beginning of the period, less $673 of the payment that applies to
principal ($1,200 − $527 representing interest)].
© The McGraw-Hill Companies, Inc., 2002 95](https://image.slidesharecdn.com/financialaccountingsolutionmanual-150513151151-lva1-app6891/85/Financial-accounting-solution-manual-31-320.jpg)


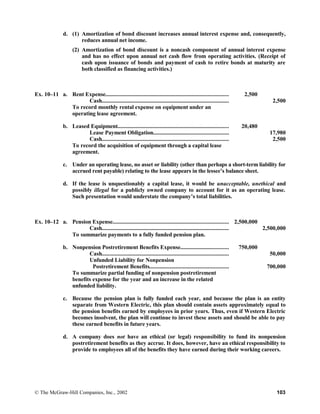


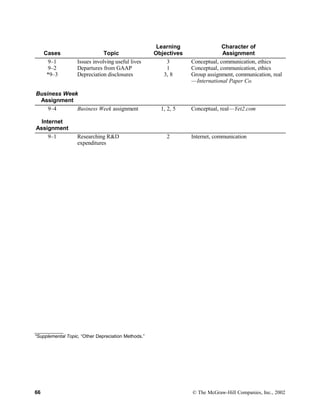
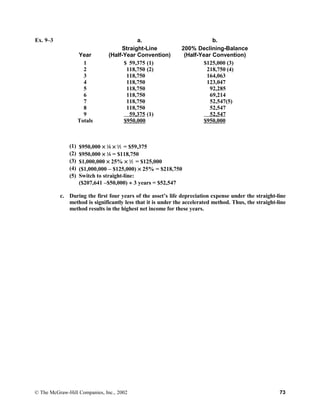
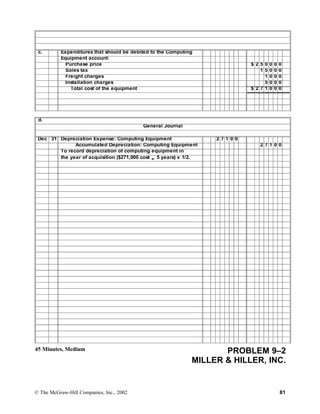
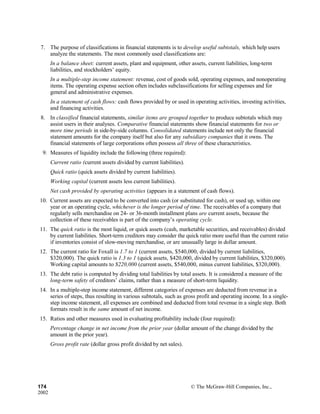
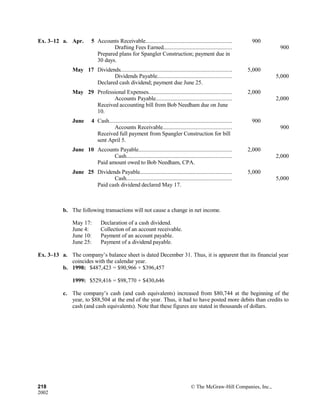
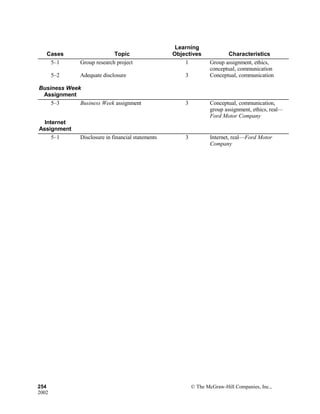
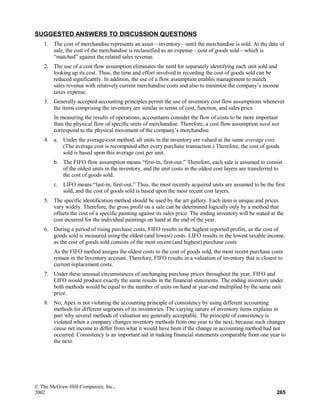
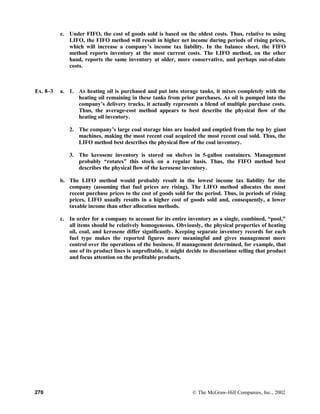
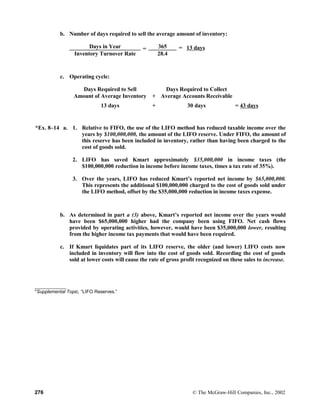
![Ex. 11–3 a. Stockholders’ equity:
8% cumulative preferred stock, $100 par value, callable at $106,
5,000 shares authorized, 2,500 shares issued................................................. $ 250,000
Common stock, $2 stated value, 100,000 shares authorized,
70,000 shares issued........................................................................................ 140,000
Additional paid-in capital:
Preferred stock.............................................................................................. 7,500
Common stock............................................................................................... 770,000
Total paid-in capital.......................................................................................... $1,167,500
Retained earnings.............................................................................................. 297,000
Total stockholders’ equity............................................................................. $1,464,500
b. No. The market value of a corporation’s stock has no effect on the amount in the
financial statements. Capital stock is recorded at the amount for which it was originally
issued.
Ex. 11–4 a. Total dividends paid in third year......................................................................
Dividends on 9% cumulative preferred stock:
$
736,000
Dividends ($50 × .09 × 40,000 × 2 years).................................... $
360,000
Current year’s dividend ($50 × .09 × 40,000)............................. 180,000
Total paid on 9% cumulative preferred stock........................ $
540,000
Dividends on 12% noncumulative preferred stock:
Current year’s dividend ($100 × .12 × 8,000)............................. 96,000 636,000
Dividends on common stock in third year.......................................................... $
100,000
b. Dividends per share:
Preferred stock, 9% cumulative ($540,000 ÷ 40,000 shares)............. $13.50 per share
Preferred stock, 12% noncumulative ($96,000 ÷ 8,000 shares)......... $12.00 per share
Common stock ($100,000 ÷ 400,000 shares)....................................... $ 0.25 per share
c. The stockholders’ equity section of the balance sheet reports no additional paid-in capital.
Thus, the preferred shares must have been issued at their respective par values ($50 per
share for the 9% cumulative preferred stock, and $100 per share for the noncumulative
preferred stock).
Ex. 11–5 a. 150,000 shares ($15,000,000 total par value, divided by $100 par value per share)
b. $1,050,000 ($15,000,000 total par value × 7% or 150,000 × $100 × 7%)
c. $16 [($20 million par value + $44 million additional paid-in capital) ÷ 4,000,000 shares
issued]
d. $35,000,000 legal capital ($15,000,000 preferred, plus $20,000,000 common)
$79,300,000 total paid-in capital ($35,000,000 legal capital, plus $44,300,000 additional
paid-in capital)
150 © The McGraw-Hill Companies, Inc., 2002](https://image.slidesharecdn.com/financialaccountingsolutionmanual-150513151151-lva1-app6891/85/Financial-accounting-solution-manual-67-320.jpg)


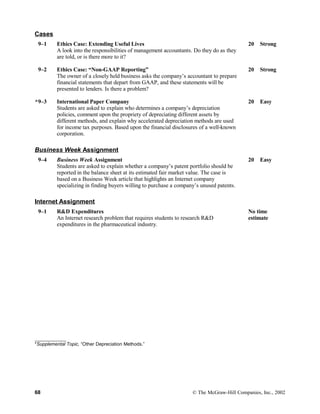
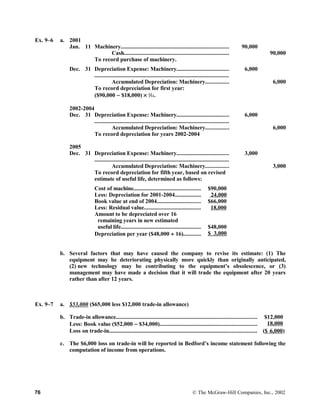
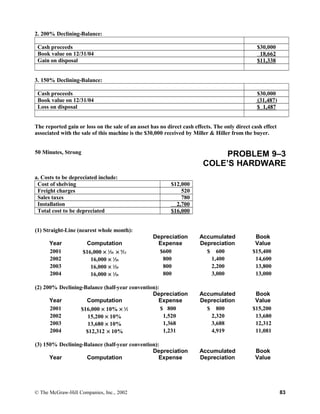
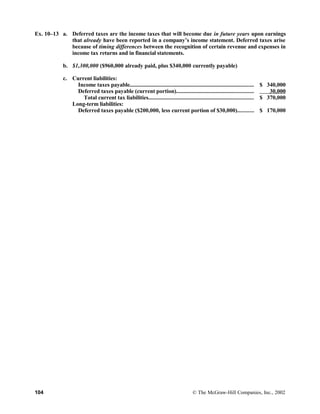
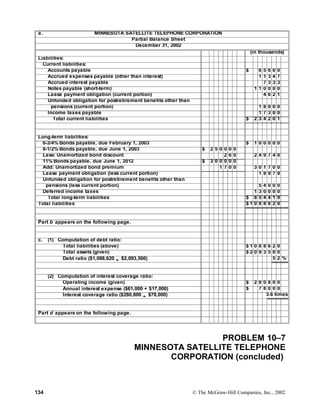
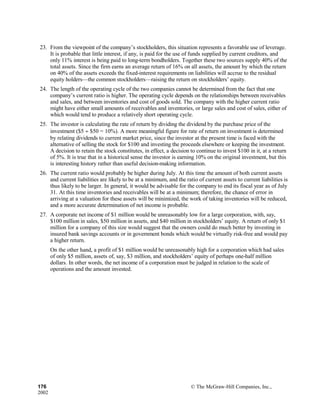
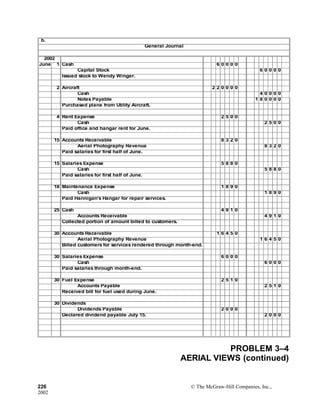
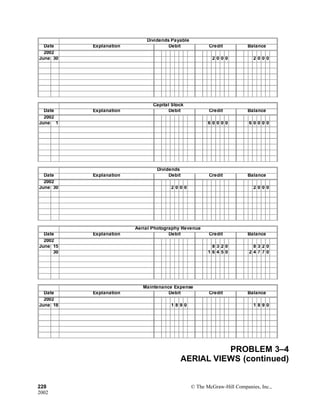
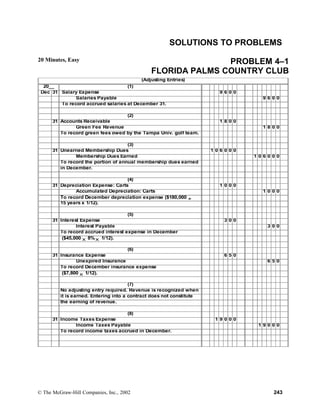
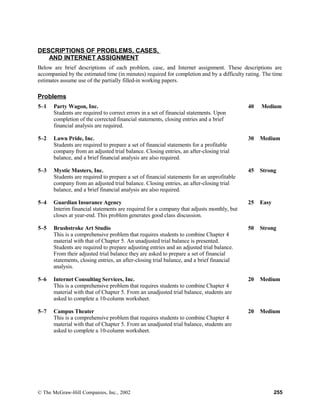
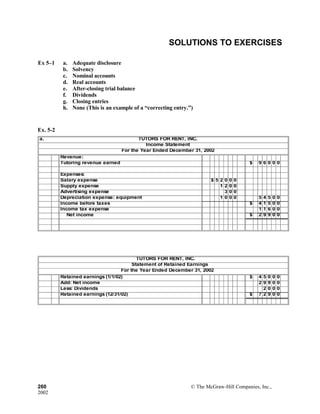
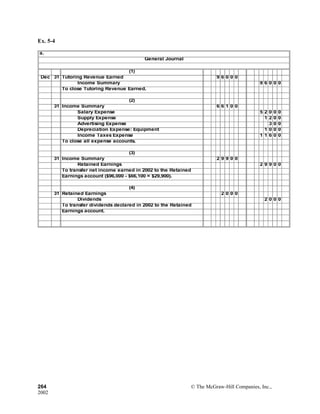
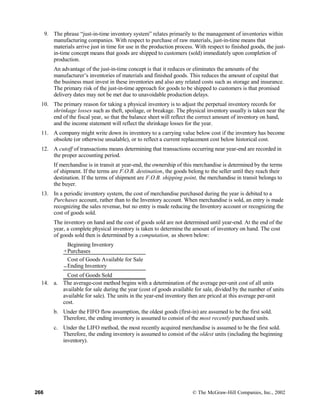
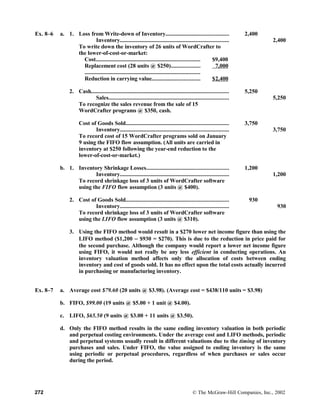
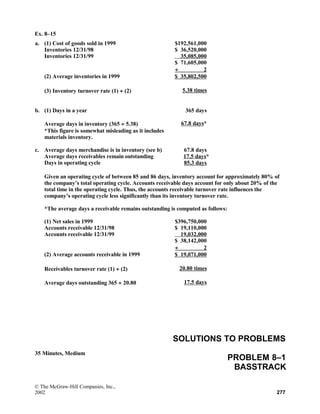
![a. Par value of all preferred stock outstanding $ 2 4 0 0 0 0 0
Par value per share of preferred stock $ 1 0 0
Number of shares of preferred stock outstanding ($2,400,000 ÷ $100) 2 4 0 0 0
b. Dividend requirement per share of preferred stock (7 1/2% x $100) $ 7 50
Number of shares of preferred stock outstanding (a) 2 4 0 0 0
Annual preferred stock dividend requirement ($7.50 x 24,000 shares) $ 1 8 0 0 0 0
c. Par value of all common stock outstanding $ 9 0 0 0 0 0
Par value per share of common stock $ 2
Number of shares of common stock outstanding ($900,000 ÷ $2 per share) 4 5 0 0 0 0
d. Par value of all common stock issued $ 9 0 0 0 0 0
Paid-in capital in excess of par: Common 8 3 2 5 0 0 0
Total issuance price of all common stock $ 9 2 2 5 0 0 0
Number of shares of common stock issued (c) 4 5 0 0 0 0
Average issuance price per share of common ($9,225,000 ÷ 450,000 shares) $ 2 0 50
e. Par value of preferred stock $ 2 4 0 0 0 0 0
Par value of common stock 9 0 0 0 0 0
Total legal capital $ 3 3 0 0 0 0 0
f. Total legal capital (e) $ 3 3 0 0 0 0 0
Add: Additional paid-in capital: Common stock 8 3 2 5 0 0 0
Donated capital 7 2 0 0 0 0
Total paid-in capital $12 3 4 5 0 0 0
g. Total stockholders’ equity $14 9 4 0 0 0 0
Less: Call price of preferred stock [24,000 shares (a) x $105 per share] 2 5 2 0 0 0 0
Equity of common stockholders $12 4 2 0 0 0 0
Number of shares of common stock outstanding (c) 4 5 0 0 0 0
Book value per share ($12,420,000 ÷ 450,000 shares) $ 2 7 60
h. Retained earnings, beginning of the year $ 7 1 7 5 0 0
Add: Net income for the year 3 9 7 0 0 0 0
Subtotal $ 4 6 8 7 5 0 0
Less: Retained earnings, end of the year 2 5 9 5 0 0 0
Total dividends paid during the year $ 2 0 9 2 5 0 0
Less: Dividends on preferred stock (part b ) 1 8 0 0 0 0
Total dividends on common stock $ 1 9 1 2 5 0 0
Number of common shares outstanding 4 5 0 0 0 0
Dividends per share of common stock ($1,912,500 ÷ 450,000) $ 4 25
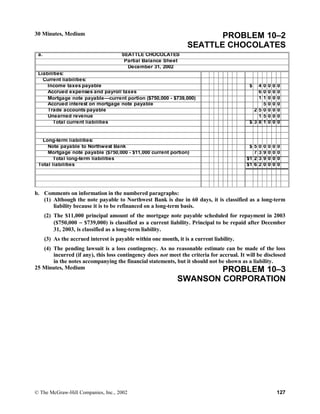
35 Minutes, Medium PROBLEM 11–6
QUANEX CORPORATION
© The McGraw-Hill Companies, Inc., 2002 159](https://image.slidesharecdn.com/financialaccountingsolutionmanual-150513151151-lva1-app6891/85/Financial-accounting-solution-manual-76-320.jpg)

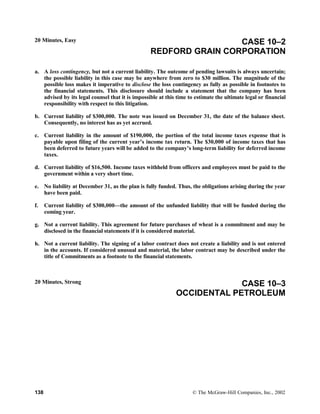
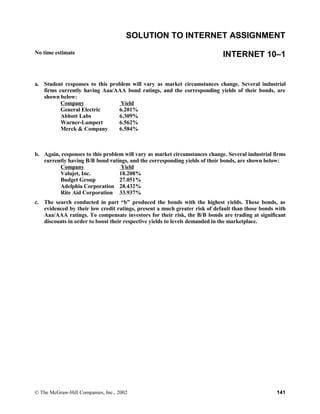
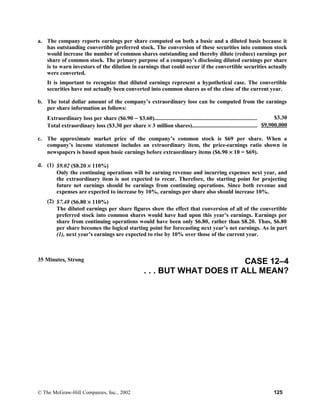
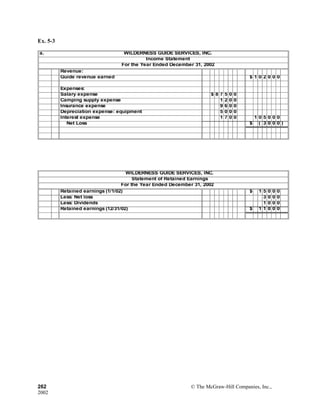
![e. The basic advantage of being publicly owned is that the corporation has the opportunity to raise
large amounts of equity capital from many investors. Some publicly owned corporations have
millions of stockholders, including pension funds, mutual funds, and other corporations. Closely
held corporations are usually unable to raise the large amounts of capital available to publicly
owned corporations.
A major advantage to the stockholders of a publicly owned corporation is that their equity
investments are highly liquid assets, immediately salable at quoted market prices.
The primary disadvantages of being publicly owned are the increased governmental regulations and
financial reporting requirements.
f. The term convertible means that at the option of the preferred stockholder, each preferred share can
be converted into a specified number of common shares. To evaluate the value of this conversion
feature, the stockholder must know into how many shares of common each preferred share can be
converted. This information is disclosed in the notes accompanying the corporation’s financial
statements.
g. At $248 per share, Quanex’s preferred has a dividend yield of 6.9% ($17.20 ÷ $248). In comparison,
an 8%, $50 par preferred selling at $57 has a dividend yield of 7% [(8% × $50 par) ÷ $57].
The dividend yield on preferred stock indicates how much investors value certain features of the
stock. The lower the yield, the more investors favor the stock. A higher yield means that investors
demand a higher return to induce them to purchase the stock.
The two principal factors that cause one preferred to yield less than another are: (1) the appearance
of greater ability to pay the preferred dividends each year, and (2) special features that appeal to
investors, such as Quanex’s conversion feature, cumulative dividends, or a high call price.
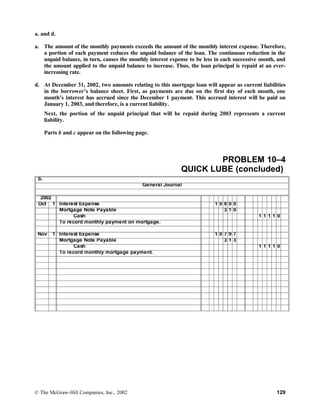
15 Minutes, Easy PROBLEM 11–7
COMPUWIZ
© The McGraw-Hill Companies, Inc., 2002 161](https://image.slidesharecdn.com/financialaccountingsolutionmanual-150513151151-lva1-app6891/85/Financial-accounting-solution-manual-78-320.jpg)


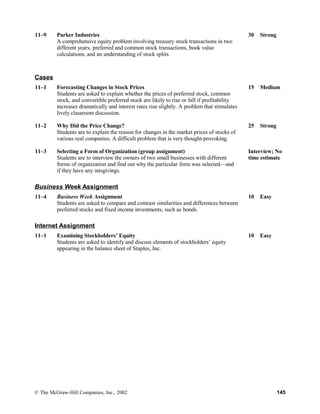
![14. A stock split occurs when there is an increase in the number of shares issued without any change in the
total amount of stated capital (because the par value per share is reduced proportionately to the increase
in the number of shares).
A stock dividend occurs when there is an increase in the number of shares issued, with no change in the
net assets of the company but a transfer from retained earnings to the paid-in capital section of the
balance sheet. The par value of stock remains the same.
The distinction in the accounting treatment of a stock dividend and a stock split stems directly from the
difference in the effect on stated (legal) capital and retained earnings. There is no difference in the
probable effect on per-share market price of a stock dividend and a stock split of equal size.
15. Prior period adjustments are entries made in the accounting records to correct material errors in the net
income reported in prior years.
In the year in which a prior period adjustment is recorded, it should appear in the statement of retained
earnings (or statement of stockholders’ equity) as an adjustment to the balance of retained earnings at
the beginning of the year.
16. Three items that may be shown in a statement of retained earnings as causing changes in the balance of
retained earnings are:
(1) Net income or net loss for the period
(2) Dividends declared (both cash dividends and stock dividends)
(3) Prior period adjustments
17. If the price of the stock declines in proportion to the distribution of shares in a stock dividend, at the time
of that distribution the stockholder does not benefit. He/she holds exactly the same percentage of the
outstanding shares, and the value per share has declined in proportion to the increased number of shares.
Often, however, the value does not drop in proportion to the increased number of shares, meaning that
the recipient of the shares has an immediate benefit. For example, if an investor who held 2,000 shares
of stock that had a market value of $10 each received a 10% stock dividend, and the market price only
declined 5%, the following would result:
Market value before stock dividend:
2,000 shares @ $10............................................................................................................ $20,000
Market value after stock dividend:
(2,000 shares × 110%) × ($10 × 95%)............................................................................... $20,900
The investor has benefited by $900. He/she could sell about 95 shares [$900/($10 × 95%)] at $9.50 and
still have a stock investment equal to the value before the stock dividend, although the investor would
own a smaller percentage of the company after the sale.
18. A liquidating dividend is a return of the investment made in the company to the investor, in contrast to a
non-liquidating dividend which is a return on the investment in the company. A liquidating dividend
occurs when dividends are distributed in excess of a company’s retained earnings.
176 © The McGraw-Hill Companies, Inc., 2002](https://image.slidesharecdn.com/financialaccountingsolutionmanual-150513151151-lva1-app6891/85/Financial-accounting-solution-manual-93-320.jpg)
![SOLUTIONS TO EXERCISES
Ex. 12–1 a. 1,440 shares = [(200 × 2) × 120%] × 3
$14,400 = 1,440 × $10.
b. Since Willis is a small and growing corporation, the board of directors probably decided
that cash from operations was needed to finance the company’s expanding operations.
c. You are probably better off because of the board’s decision not to declare cash
dividends. Willis was obviously able to invest the funds to earn a high rate of return, as
evidenced by the value of your investment, which has grown from $1,000 to $14,400.
Ex. 12–2 a. Extraordinary item
b. None (Treasury stock is not an asset; it represents shares that have been reacquired by
the company, not shares that have not yet been issued.)
c. Stock dividend
d. Stock subscription
e. Prior period adjustment
f. P/e ratio (Market price divided by earnings per share.)
g. Discontinued operations (Showing the discontinued operations in a separate section of
the income statement permits presentation of the subtotal, Income from Continuing
Operations.)
h. Diluted earnings per share
i. Comprehensive income
Ex. 12–3 a. SUNSPORTS, INC.
Income Statement
For the Year Ended December 31, 20__
Net sales...........................................................................................................$10,800,000
Costs and expenses (including applicable income taxes)................................ 8,600,000
Income from continuing operations................................................................$ 2,200,000
Discontinued operations:
Operating loss from tennis shops (net of income tax
benefit).................................................................................... $192,000
Loss on sale of tennis shops (net of income tax benefit).......... 348,000 (540,000)
Net income....................................................................................................... $1,660,000
Earnings per share:
Earnings from continuing operations ($2,200,000 ÷ 175,000 shares)....... $12.57
Loss from discontinued operations ($540,000 ÷ 175,000)......................... (3.09)
Net earnings ($1,660,000 ÷ 175,000 shares)............................................... $9.48
178 © The McGraw-Hill Companies, Inc., 2002](https://image.slidesharecdn.com/financialaccountingsolutionmanual-150513151151-lva1-app6891/85/Financial-accounting-solution-manual-95-320.jpg)


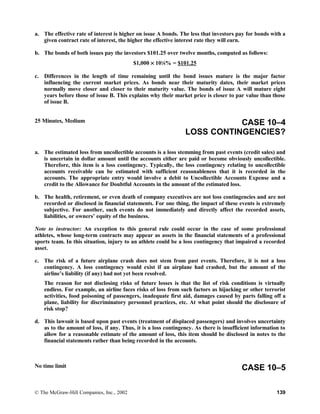
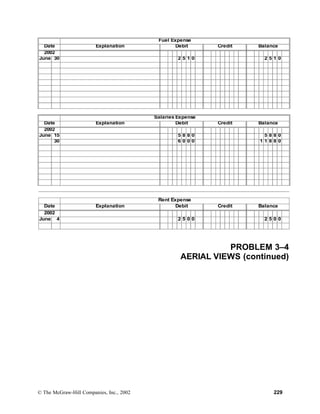
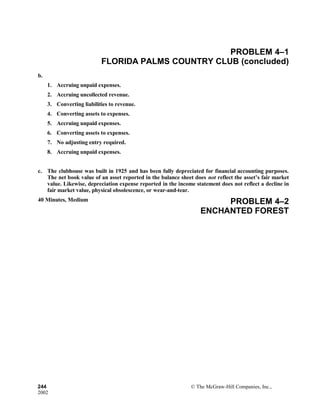
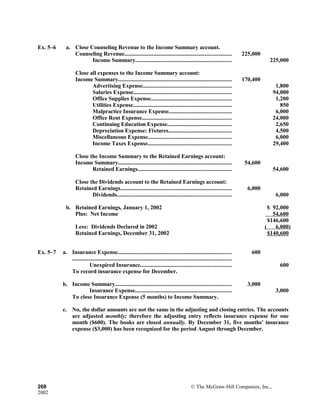
![a. ASHTON SOFTWARE, INC.
Condensed Income Statement
For the Year Ended December 31, 2002
Net sales $19 8 5 0 0 0 0
Costs and expenses (including applicable income taxes) 16 9 0 0 0 0 0
Income from continuing operations $ 2 9 5 0 0 0 0
Discontinued operations:
Operating income (net of income taxes) $ 1 4 0 0 0 0
Loss on disposal (net of income tax benefit) ( 5 5 0 0 0 0 ) ( 4 1 0 0 0 0 )
Income before extraordinary items and cumulative effect of
accounting change $ 2 5 4 0 0 0 0
Extraordinary loss (net of income tax benefit) $ ( 9 0 0 0 0 0 )
Cumulative effect of accounting change (net of income taxes) 1 0 0 0 0 0 ( 8 0 0 0 0 0 )
Net income $ 1 7 4 0 0 0 0
Earnings per share:
Earnings from continuing operations
[($2,950,000 - $500,000*) ÷ 200,000 shares] $ 1 2 25
Loss from discontinued operations ($410,000 ÷ 200,000 shares) ( 2 05)
Earnings before extraordinary items and cumulative effect of
accounting change [($2,540,000 - $500,000 preferred dividends) ÷
200,000 shares] $ 1 0 20
Extraordinary loss ($900,000 ÷ 200,000 shares) ( 4 50)
Cumulative effect of accounting change ($100,000 ÷ 200,000 shares) 50
Net earnings
[($1,740,000 - $500,000 preferred dividends) ÷ 200,000 shares] $ 6 20
*Preferred dividends: 80,000 shares x $6.25 = $500,000
PROBLEM 12–2
ASHTON SOFTWARE, INC. (concluded)
© The McGraw-Hill Companies, Inc., 2002 185](https://image.slidesharecdn.com/financialaccountingsolutionmanual-150513151151-lva1-app6891/85/Financial-accounting-solution-manual-102-320.jpg)


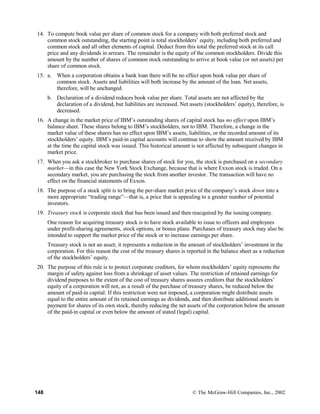
![a. Ending cash balances:
Week 2: $20 [$(20) + $100 − $30 − $20 − $10]
Week 3: $60 ($20 + $100 − $30 − $20 − $10)
Week 4: $100 ($60 + $100 − $30 − $20 − $10)
b. In Week 1 you have two problems. The first is that you do not have enough cash to pay your rent on
Wednesday. But you will by Friday, so your payment may be a couple of days late. (But what’s
going to happen next month? Is there some “handwriting on the wall”?)
Your second problem is that if you spend in your normal pattern, you will overdraw your bank
account by $20 (which may trigger a service charge of another $10 or more). This problem can be
solved by your foregoing any expenditures on entertainment this week—annoying, but hardly a cash
crisis.
You have a bigger problem coming up in February. You will have more difficulty paying February’s
rent than you did January’s. The sad fact is that you cannot afford rent of $200 per month. You are
earning $400 per month and spending $240 on things other than rent. Thus, you can afford only
about $160 per month for rent unless you reduce other expenses.
To solve this problem, you might find a roommate to share the rent, move into less expensive
housing, or somehow increase your monthly cash receipts. (It does not appear practical to trim $40
per month from your other expenses.)
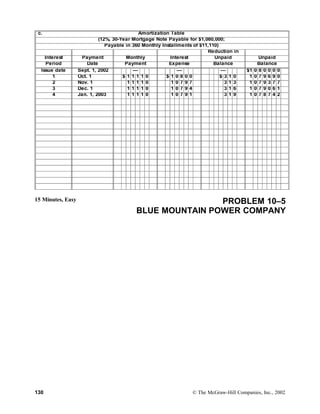
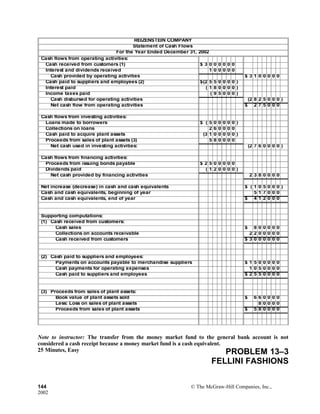
45 Minutes, Medium CASE 13–3
NATIONAL MOTORS
160 © The McGraw-Hill Companies, Inc.,
2002](https://image.slidesharecdn.com/financialaccountingsolutionmanual-150513151151-lva1-app6891/85/Financial-accounting-solution-manual-150-320.jpg)


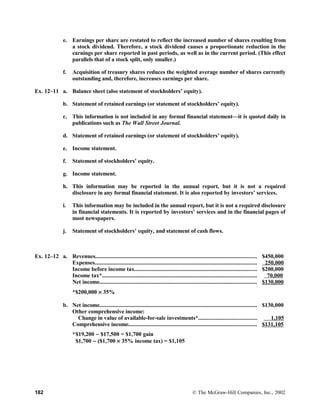
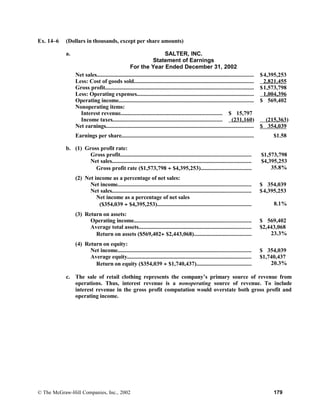
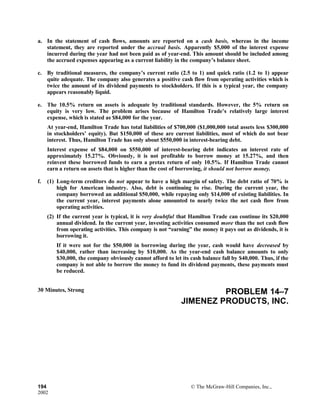
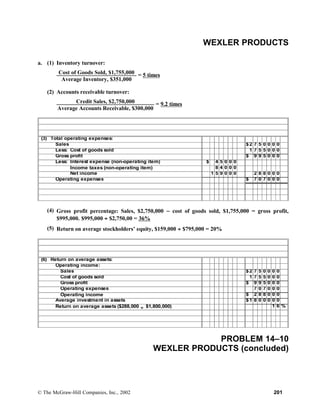
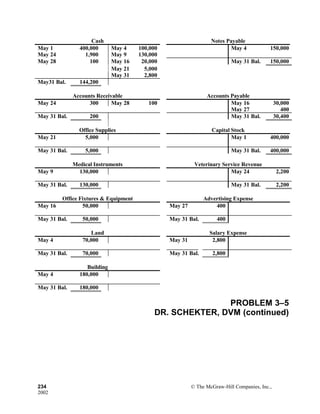
![Ex. 14–4 a. Earnings per share.
b. Operating activities.
c. Debt ratio.
d. P/e ratio.
e. None. (The statement describes return on assets.)
f. Parent company.
g. Operating income.
h. Current ratio.
i. None. (The statement describes an unincorporated business, such as a sole
proprietorship or a partnership.)
j. None. (The statement describes classified financial statements.)
Ex. 14–5 (Dollars in
Millions)
a. (1) Quick assets:
Cash and short-term investments............................................................. $ 47.3
Receivables................................................................................................ 159.7
Total quick assets.................................................................................. $207.0
(2) Current assets:
Quick assets [part a (1)]............................................................................ $207.0
Inventories................................................................................................. 72.3
Prepaid expenses and other current assets............................................... 32.0
Total current assets............................................................................... $311.3
b. (1) Quick ratio:
Total quick assets (part a)......................................................................... $207.0
Current liabilities...................................................................................... 130.1
Quick ratio ($207 ÷ $130.1).................................................................. 1.6 to 1
(2) Current ratio:
Total current assets (part a)..................................................................... $311.3
Current liabilities...................................................................................... 130.1
Current ratio ($311.3 ÷ $130.1)............................................................ 2.4 to 1
(3) Working capital:
Total current assets (part a)..................................................................... $311.3
Less: Current liabilities............................................................................. 130.1
Working capital..................................................................................... $181.2
c. By traditional standards, Tyco Toys seems to be quite solvent. Both its quick ratio and
current ratio are well above rule-of-thumb levels, and its working capital balance is
substantial. As a large and well-established company, it is quite possible that Tyco Toys
might be able to remain solvent even if its liquidity measures became lower than normal.
178 © The McGraw-Hill Companies, Inc.,
2002](https://image.slidesharecdn.com/financialaccountingsolutionmanual-150513151151-lva1-app6891/85/Financial-accounting-solution-manual-168-320.jpg)
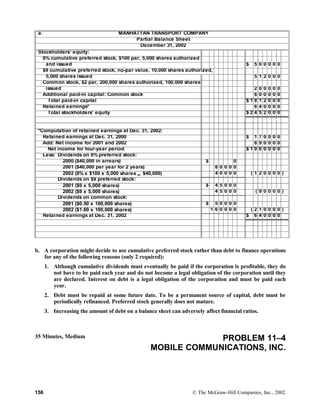
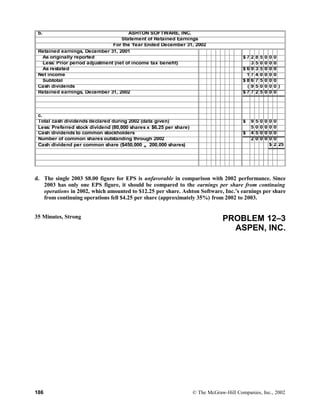
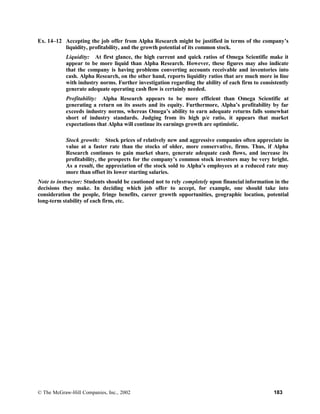
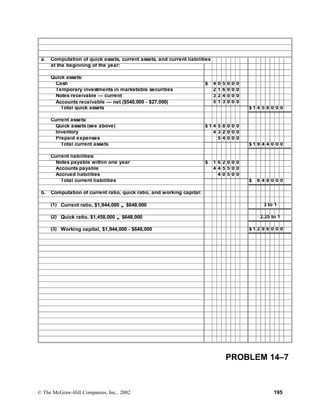
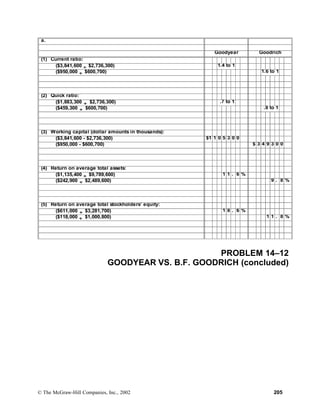
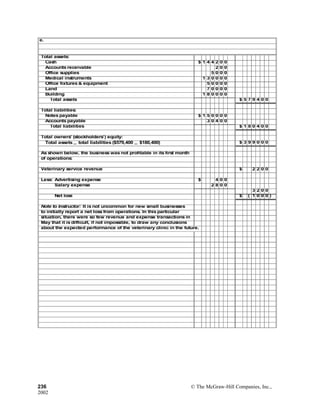
![Ex. 14–7 a. Percentage change in basic EPS for each year, 1991-2000:
Year Computation
1991 ($.54 - $1.00)/$1.00 = -46%
1992 ($.58 - $.54)/$.54 = +7%
1993 ($.60 - $.58)/$.58 = +3%
1994 ($.48 - $.60)/$.60 = -20%
1995 ($1.97 - $.48)/$.48 = +310%
1996 ($2.15 - $1.97)/$1.97 = +9%
1997 ($2.46 - $2.15)/$2.15 = +14%
1998 ($2.91 - $2.46)/$2.46 = +18%
1999 ($2.85 - $2.91)/$2.91 = -2%
2000 ($3.34 - $2.85)/$2.85 = +17%
Following are some conclusions that may be reached about the pattern of basic EPS over this period of
time:
• The amounts and direction of change indicate significant volatility, with percentages of change
ranging from a positive 310% (1995) to a negative 46% (1991).
• The general direction of change is positive, with EPS going from $1.00 in 1990 to $3.34 in 2000, an
increase of 234% [($3.34 – 1.00)/$1.00].
• While the percentage changes accurately reflect the year-to-year change, care should be taken in
using these percentages. For example, the very high 310% change in 1995 is due, in part, to the fact
that 1994 EPS were low, making the base for computing the increase in 1995 low. In general, the
lower the base (previous year), the higher the percentage change for a given amount of EPS.
Similarly, the higher the base (previous year), the lower the percentage change for a given EPS
amount.
b. Because basic EPS has change so much from year to year, while the number of shares of common
stock outstanding has been relatively constant, net income must have included a lot of volatility
roughly equivalent to the volatility in EPS. In fact, this is the case. For example, net income ranged
from a low of $11,218,000 in 1992 (a relatively low basic EPS year) to a high of $368,232,000 (the
highest basic EPS year).
c. The risk to common stockholders of conversion of other securities into common stock is relatively
low. While the fact that diluted EPS is lower than basic EPS indicates that there is some potential
for conversion of other securities into common stock, the amount is relatively small – an average of
between $.01 to $.02 per share each year.
180 © The McGraw-Hill Companies, Inc.,
2002](https://image.slidesharecdn.com/financialaccountingsolutionmanual-150513151151-lva1-app6891/85/Financial-accounting-solution-manual-170-320.jpg)
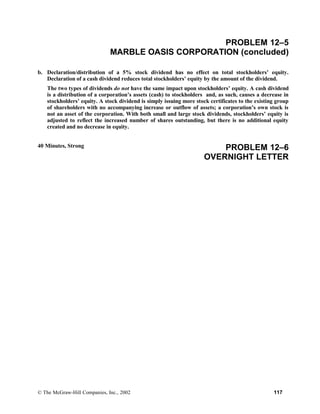
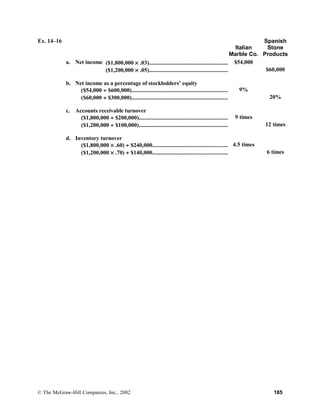
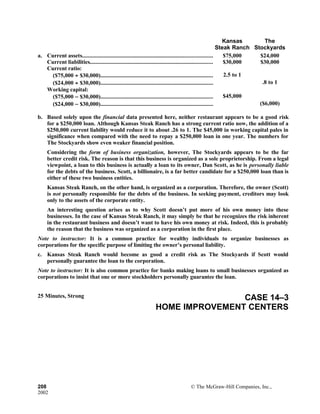
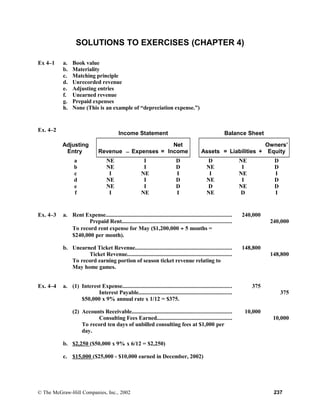
![Ex. 14–8 a. Return on assets = Operating income
Average total assets
=
$2,422 = $2,422
= 16.3%
[($14,548 + $15,196) ÷ 2] $14,872
Return on equity = Net incomeb.
Average total stockholders’ equity
= $349 $349 = 7.6%
[($4,562 + $4,674) ÷ 2]
=
$4,618
c. Stockholders’ equity figures shown in the balance sheet are reported at book value, not
market value. Thus, the increase in Sprint’s total stockholders’ equity for the year did
not result from an increase in the market value of the company’s stock.
Ex. 14–9 a. Computation of percentage changes:
(1) Net sales increased 10% ($200,000 increase ÷ $2,000,000 = 10% increase).
(2) Total expenses increased 11% ($198,000 increase ÷ $1,800,000 = 11% increase).
b. (1) Total expenses grew faster than net sales. Net income cannot also have grown faster
than net sales, or the sum of the parts would exceed the size of the whole.
(2) Net income must represent a smaller percentage of net sales in 2002 than it did in
2001. Again, the reason is that total expenses have grown at a faster rate than net
sales. Thus, total expenses represent a larger percentage of total sales in 2002 than
in 2001, and net income must represent a smaller percentage.
Ex. 14–10 a. The financial measures computed by the students will vary depending upon the
companies they select. Industry norm figures may also vary depending upon the
investment services available in the library. It is important for students to realize that
industry norms represent benchmark averages that should always be used with caution
when evaluating the performance and financial condition of a business.
b. Based on their findings, students should comment on the price volatility of their stocks
during the past 52 weeks, and attempt to assess investor expectations as reflected by the
p/e ratio of the companies they select.
c. Investment recommendations will vary depending upon the companies students select.
Students should be cautioned that investment recommendations should never be based
solely upon annual report data. The prudent investor must take into account industry
characteristics, the potential effects of current economic trends, and the opportunities
and threats facing the firm being analyzed.
© The McGraw-Hill Companies, Inc., 2002 181](https://image.slidesharecdn.com/financialaccountingsolutionmanual-150513151151-lva1-app6891/85/Financial-accounting-solution-manual-171-320.jpg)

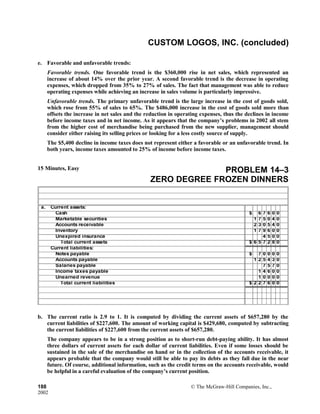
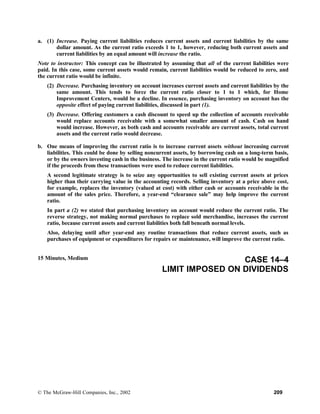
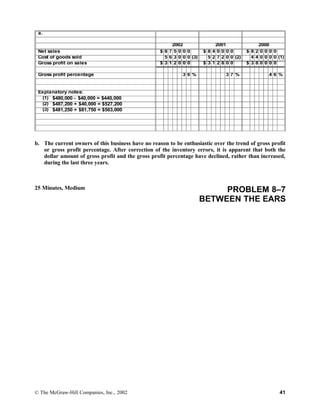
![Ex. 14–13 a. (1) Gross profit percentage:
2001: 33% [($610,000 − $408,000) ÷ $610,000]
2002: 34% [($750,000 − $495,000) ÷ $750,000]
(2) Inventory turnover:
2001: 4 times ($408,000 ÷ $102,000 average inventory)
2002: 4.5 times ($495,000 ÷ $110,000 average inventory)
(3) Accounts receivable turnover:
2001: 6 times ($610,000 ÷ $100,000 average accounts receivable)
2002: 5 times ($750,000 ÷ $150,000 average accounts receivable)
b. There are three favorable trends. First, the growth in net sales from $610,000 to
$750,000. This represents an increase of 23% ($140,000 increase, divided by $610,000 in
the prior year). Next, the gross profit rate increased from 33% in 2001 to 34% in 2002.
Not only is Fowler’s selling more, but it is selling its merchandise at a higher profit
margin. Finally, the inventory turnover has increased, indicating that the company has
increased its sales without having to proportionately increase its investment in
inventories.
There is only one negative trend. The accounts receivable turnover rate has declined.
One question immediately should come to mind: Has Fowler’s liberalized its credit
policies as part of its strategy to increase sales? If so, the “slowdown” in the receivables
turnover may have been expected and be no cause for concern. On the other hand, if the
company has not changed its credit policies, it apparently is encountering more difficulty
in collecting its accounts receivable on a timely basis.
Ex. 14–14 a. Current ratio: 3.7 to 1 ($550,000 ÷ $150,000)
b. Quick ratio: 1.5 to 1 ($220,000 ÷ $150,000)
c. Working capital: $400,000 ($550,000 − $150,000)
d. Debt ratio: 40% ($480,000 ÷ $1,210,000)
e. Accounts receivable turnover: 18 times ($2,790,000 ÷ $155,000)
f. Inventory turnover: 6.2 times ($1,674,000 ÷ $270,000)
g. Book value per share of capital stock: $12.17 ($730,000 ÷ 60,000 shares)
Ex. 14–15 2002 2001
a. Current ratio: 2.0 to 1 ($160,000 ÷ $80,000) 1.3 to 1 ($130,000 ÷ $100,000)
b. Debt ratio: 45% ($180,000 ÷ $400,000) 46% ($150,000 ÷ $325,000)
c. Earnings per share: $3.55
[($45,000 increase in retained earnings + $26,000 dividends) ÷ 20,000 shares]
184 © The McGraw-Hill Companies, Inc.,
2002](https://image.slidesharecdn.com/financialaccountingsolutionmanual-150513151151-lva1-app6891/85/Financial-accounting-solution-manual-174-320.jpg)


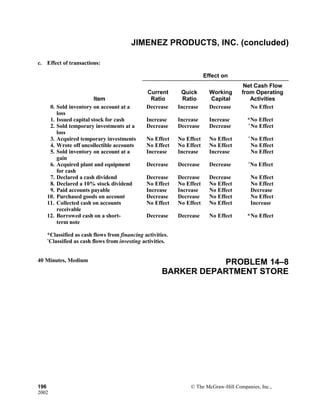
![Parts a, c, e, and f appear on the following page.
b. (1) Current ratio:
Current assets:
Cash $ 3 0 0 0 0
Accounts receivable 1 5 0 0 0 0
Inventory 2 0 0 0 0 0
Total current assets $ 3 8 0 0 0 0
Current liabilities $ 1 5 0 0 0 0
Current ratio ($380,000 ÷ $150,000) 2.5 to 1
(2) Quick ratio:
Quick assets:
Cash $ 3 0 0 0 0
Accounts receivable 1 5 0 0 0 0
Total quick assets $ 1 8 0 0 0 0
Current liabilities $ 1 5 0 0 0 0
Quick ratio ($180,000 ÷ $150,000) 1.2 to 1
(3) Working capital:
Current assets [part b (1)] $ 3 8 0 0 0 0
Less: Current liabilities 1 5 0 0 0 0
Working capital $ 2 3 0 0 0 0
(4) Debt ratio:
Total liabilities:
Total assets $1 0 0 0 0 0 0
Less: Total stockholders’ equity 3 0 0 0 0 0
Total liabilities $ 7 0 0 0 0 0
Total assets $1 0 0 0 0 0 0
Debt ratio ($700,000 ÷ $1,000,000) 7 0 %
d. (1) Return on assets:
Operating income:
Net sales $1 5 0 0 0 0 0
Less: Cost of goods sold (1 0 8 0 0 0 0 )
Operating expenses ( 3 1 5 0 0 0 )
Operating income $ 1 0 5 0 0 0
Total assets (at year-end) $1 0 0 0 0 0 0
Return on assets ($105,000 ÷ $1,000,000) 1 0 . 5 %
(2) Return on equity:
Net income $ 1 5 0 0 0
Total stockholders’ equity (at year-end) $ 3 0 0 0 0 0
Return on equity ($15,000 ÷ $300,000) 5 %
PROBLEM 14–6
HAMILTON TRADE (concluded)
© The McGraw-Hill Companies, Inc., 2002 193](https://image.slidesharecdn.com/financialaccountingsolutionmanual-150513151151-lva1-app6891/85/Financial-accounting-solution-manual-183-320.jpg)

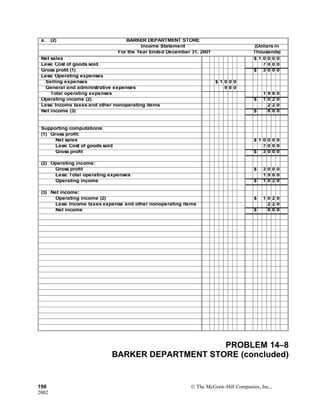

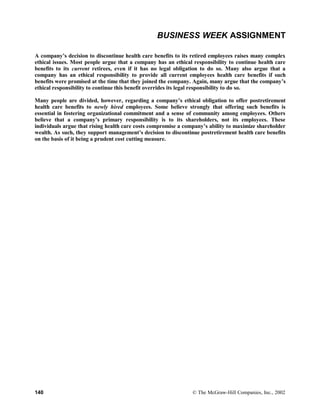
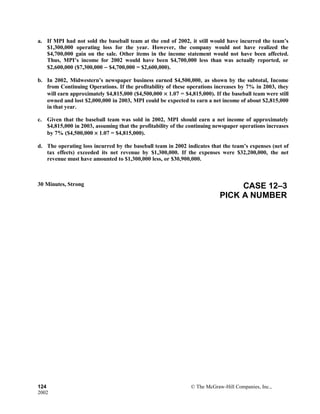
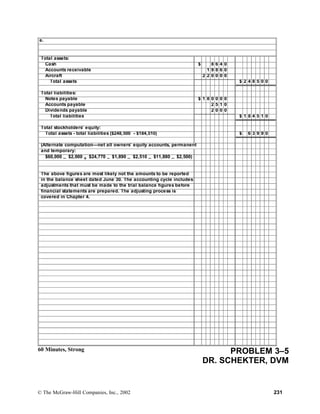
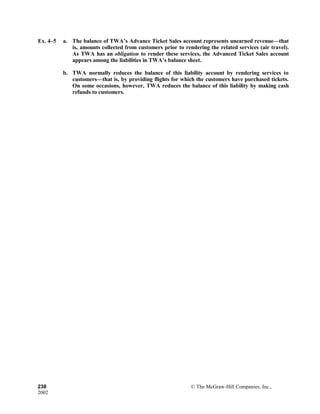
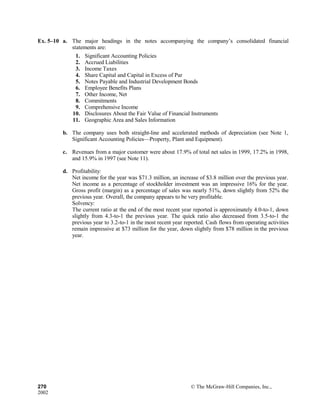
![(Dollar Amounts
in Thousands)
a. Current ratio:
(1) Beginning of year ($54,130 ÷ $63,481) .85 to 1
(2) End of year ($92,592 ÷ $83,357) 1.11 to 1
b. Working capital:
(1) Beginning of year ($54,130 - $63,481) $ ( 9 3 5 1 )
(2) End of year ($92,592 - $83,357) $ 9 2 3 5
d. (1) Return on average total assets:
Operating income $ 7 6 1 4 1
Average total assets [($234,698 + $417,413) ÷ 2] $ 3 2 6 0 5 6
Return on average total assets ($76,141 ÷ $326,056) 2 3 %
(2) Return on average stockholders’ equity:
Net income $ 4 4 1 5 2
Average stockholders’ equity [($124,058 + $208,189) ÷ 2] $ 1 6 6 1 2 4
Return on average stockholders’ equity
($44,152 ÷ $166,124) 2 7 %
c. and e.
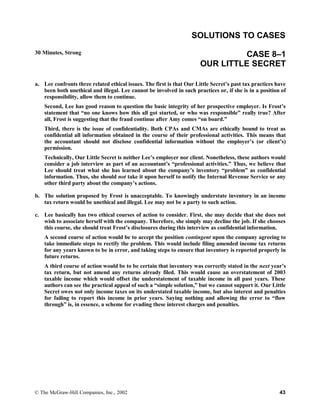
c. Blockbuster Video’s short-term debt-paying ability appears to be improving. In the course of the year,
the company’s current ratio has improved, and its working capital has increased from a negative
amount of more than $9 million to a positive amount of more than $9 million (an $18 million
turnaround).
While Blockbuster’s solvency has been increasing and its current ratio at year-end exceeds that of
BellSouth, Blockbuster is not as good a credit risk. Blockbuster and BellSouth are both service
companies. As a regional telephone company, however, BellSouth has an extremely reliable source
of monthly earnings and cash flows. Blockbuster, in contrast, offers a less essential service and
operates in a more competitive marketplace. As mentioned in this chapter, major telephone
companies often operate with current ratios of less than 1 to 1. Therefore, a current ratio of .9 to 1
does not indicate any specific financial difficulties for BellSouth. Unless BellSouth were to encounter
some very unusual financial problems, it will always be viewed as a better credit risk than
(relatively) small companies engaging in highly competitive business activities.
e. Blockbuster’s management appears to be utilizing the company’s resources in more than a
“reasonably efficient” manner. The company’s return on assets and return on equity both are well
above the company’s cost of borrowing money, the “norms” in many industries, and the rates of
return that investors can safely achieve from, say, putting their money in a bank.
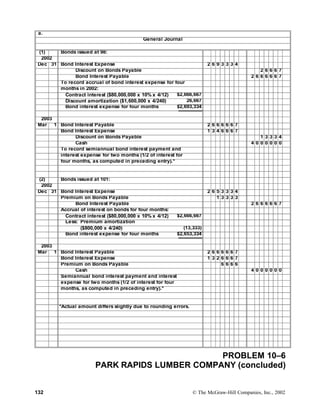
25 Minutes, Medium PROBLEM 14–10
200 © The McGraw-Hill Companies, Inc.,
2002](https://image.slidesharecdn.com/financialaccountingsolutionmanual-150513151151-lva1-app6891/85/Financial-accounting-solution-manual-190-320.jpg)


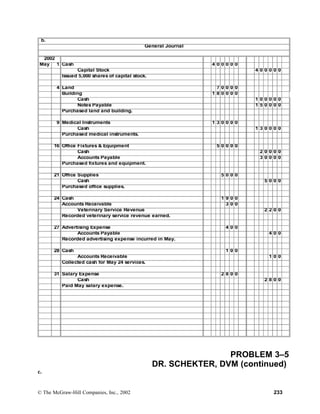


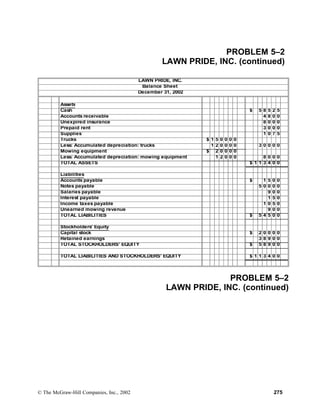


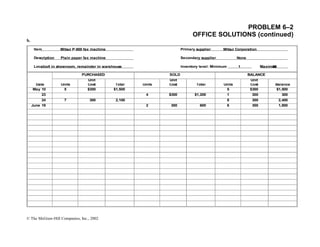
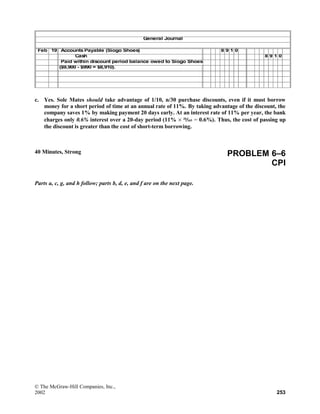
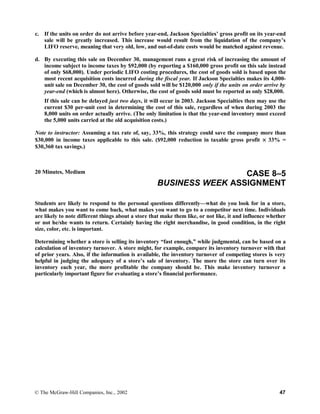
![PROBLEM 6–2
OFFICE SOLUTIONS (concluded)
c. Eight. The quantity of units on hand at any date may be determined from the inventory subsidiary
ledger.
d. An inventory subsidiary ledger indicates the quantities, unit costs, and total costs of the units of
product purchased, sold, and currently on hand. In addition, the subsidiary ledger accounts usually
indicate the location of units in stock, the minimum and maximum quantities desired in inventory,
and the names of the major suppliers. Management uses this information to determine which
products are selling quickly and which are selling slowly and in setting sales prices. Accounting
personnel use the unit cost data in recording the cost of goods sold. Sales personnel refer to this
ledger to determine the quantities and location of goods on hand. Employees responsible for
purchasing merchandise use the data in this ledger to determine when specific products should be
reordered, the quantities to order, and the names of the principal suppliers.
20 Minutes, Medium PROBLEM 6–3
KNAUSS SUPERMARKETS
2001–2002 2000–2001
a. 1.
2.
3.
Change in net sales.....................................................
Change in net sales per square foot...........................
Change in comparable store sales..............................
6% (1)
(1%) (3)
(1.8%) (5)
8% (2)
(2.7%) (4)
(3.5%) (6)
(1) ($5,495 − $5,194) ÷ $5,184 = 6%
(2) ($5,184 − $4,800) ÷ $4,800 = 8%
(3) [($5,495 ÷ 11.9) − ($5,184 ÷ 11.1)] ÷ ($5,184 ÷ 11.1) = (1%)
(4) [($5,184 ÷ 11.1) − ($4,800 ÷ 10.0)] ÷ ($4,800 ÷ 10.0) = (2.7%)
(5) ($10.8 − $11.0) ÷ $11.0 = (1.8%)
(6) ($11.0 − $11.4) ÷ $11.4 = (3.5%)
b. While Knauss has increased its overall revenue from sales, several of the statistics indicate
problems. Both sales per square foot of selling space and comparable store sales have declined for
the last two years. This indicates a downward trend in sales at existing stores. It is apparent that the
increase in overall net sales must have resulted from adding new stores. As a result, management
should reevaluate its marketing strategies.
30 Minutes, Medium PROBLEM 6–4
LAMPRINO APPLIANCE
© The McGraw-Hill Companies, Inc.,
2002 249](https://image.slidesharecdn.com/financialaccountingsolutionmanual-150513151151-lva1-app6891/85/Financial-accounting-solution-manual-303-320.jpg)


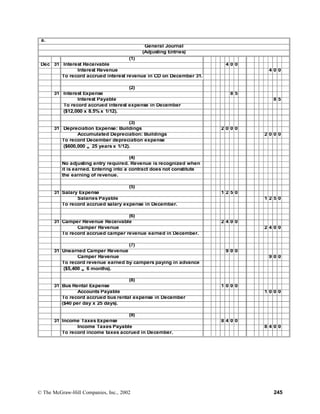
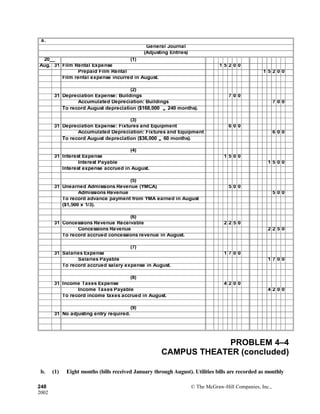
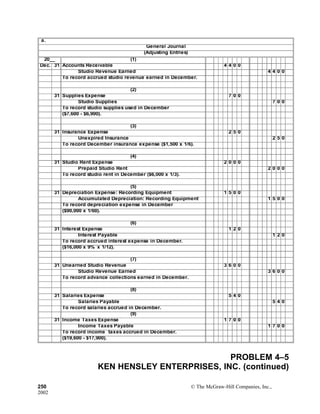
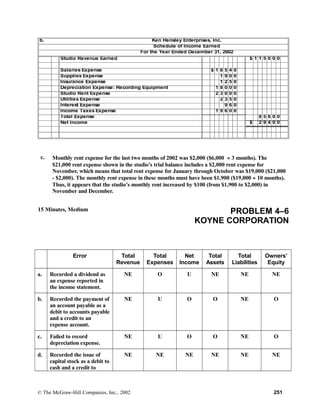
This document provides an overview of the exercises, problems, cases, and internet assignment in Chapter 9 of the textbook. It includes a table that lists each exercise/problem/case topic, the relevant learning objectives, and characteristics. It also provides brief descriptions of each problem, case, and the internet assignment, including estimated completion times and difficulty ratings. The chapter covers topics like capital vs. revenue expenditures, depreciation methods, accounting for plant and intangible assets, natural resources, and annual report presentations.