Downloaded 14 times


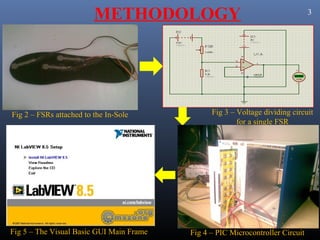
![PREPARATION 2
The overview of this project was taken from the work done by the
Chinese scientists Daniel Tik-Pui Fong et al[2].
The sensors used by us are Force Sensing Resistors (FSR),
manufactured by Interlink Electronics. The work done by Indian
scientist Dr. N.K. Rana of RGIT[1] helped us to work with the
sensors.
A thorough study of FSR[4]was done that helped us to narrow down
to a voltage-divider circuit using LM 324.
The manual of National Instruments on Lab VIEW Analysis
Concepts[8] gave us the basic idea of signal processing and analysis
in Lab VIEW.
Introduction to Data AcQuisition[9] is the tutorial of National
Instruments that gives the overview of the DAQ and its functions.](https://image.slidesharecdn.com/finalpr-121231004752-phpapp02/85/Measurement-of-Ankle-Supination-Torque-3-320.jpg)
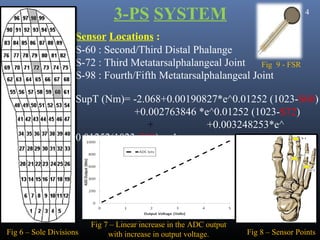
![VOLTAGE DIVIDER CIRCUIT 6
a b
Fig 12 – (a)The theoretical design and (b) the practical output of Voltage Divider Circuit
Vout = Vin * [1 / (1 + Rfsr / Rm ) ]
To convert the pressure of the foot into voltage a voltage divider
circuit was implemented. The above given formula was used.
5V was used as the Vin.](https://image.slidesharecdn.com/finalpr-121231004752-phpapp02/85/Measurement-of-Ankle-Supination-Torque-7-320.jpg)


![REFERENCES 16
[1] Application of Force Sensing Resistor (FSR) in Design of Pressure Scanning System for
Plantar Pressure Measurement
By: Dr. N. K. Rana, Department of Instrumentation Engineering, Rajiv Gandhi Institute of
Technology
[2] A three-pressure-sensor (3PS) system for monitoring ankle supination torque during sport
motions
By: Daniel Tik-Pui Fong, Yue-Yan Chan, Youlian Hong, Patrick Shu-Hang Yung, Kwai-Yau
Fung, Kai-Ming Chan
[3] LM 324 Datasheet
By- Phillips Electronics
[4] FSR an Overview of the technology
By- Tech Storm Inc
[5] MAX 232 Datasheet
By- Texas Instruments
[6] PIC 16F873 Datasheet
By- Microchip
[7] 3-Terminal 1A Positive Voltage Regulator
By- FAIRCHILD SEMICONDUCTORS
[8] Lab VIEW Analysis and Concepts
By- National Instruments
[9] Introduction to Data Acquisition
By- National Instruments](https://image.slidesharecdn.com/finalpr-121231004752-phpapp02/85/Measurement-of-Ankle-Supination-Torque-17-320.jpg)


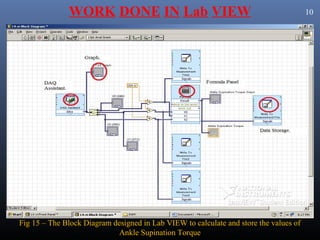
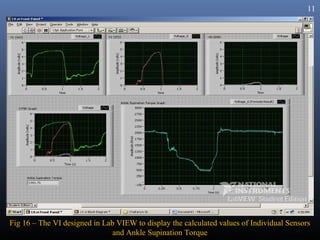
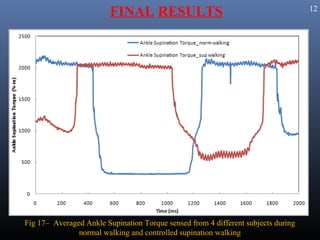
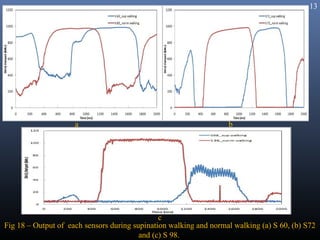
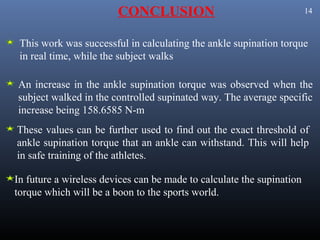
This document describes a project to measure ankle supination torque. Force sensing resistors were attached to an insole and a voltage divider circuit was used to convert pressure readings to electrical signals. The signals were acquired using a data acquisition system and analyzed in LabVIEW. Testing on 4 subjects found increased ankle supination torque when walking in a controlled supinated manner compared to normal walking. The system provides a way to monitor ankle supination torque and help with athlete training.


