Download to read offline
![International Research Journal of Engineering and Technology (IRJET) e-ISSN: 2395-0056
Volume: 05 Issue: 01 | Jan-2018 www.irjet.net p-ISSN: 2395-0072
© 2018, IRJET | Impact Factor value: 6.171 | ISO 9001:2008 Certified Journal | Page 284
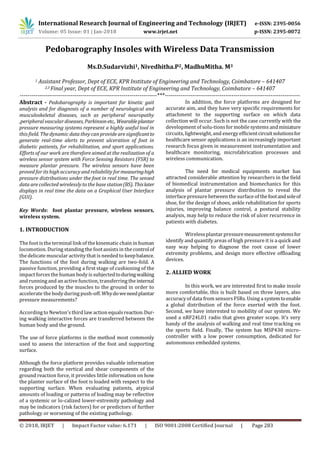
3. SYSTEM DEPICTION
Fig. 1. Block diagram
The depicted system architecture shown in figure 1
consists of two blocks: One embedded in the shoe, and the
other outside the body. In order to connect the system tothe
base Station, The first considered as transmitter, contains
sensors which used to obtain data then transmitting via
radio frequency RF. The second is used as a receiver for
receiving informations and displays it on PC. Further, it will
be used by the doctor afterwards for analysis and diagnosis.
4. MECHANISM DEPICTION
4.1. Pressure acquisition system
In order to measure the pressure of the foot, we
have developed a sole. This later is equipped with pressure
sensors(FSRs in our case). It consists of threemainlayers,as
described in the following steps:
1) Pressure area :
To find pressure areasin high foot with contact with thesoil.
We have conducted an experiment using a plastertotakethe
impression of bare foot.
The data area was cropped to a rectangle according to the
measured length and width the foot of the person. As
presented in [6], the rectangle was partitioned into medial
and lateral halves by the longitudinal foot axisandintoequal
thirds along the longitudinal axis to indicate the forefoot,
midfoot, and heel sections. The medial and lateral heel
sections were treated as a single section. Thus,fivesegments
for the entire foot were determined: heel, medial mid-foot
(MM), medial forefoot (MF), lateral mid-foot (LM), and
lateral forefoot (LF) (Fig. 2)
Fig. 2. Five-segment foot model. MM: medial midfoot; MF:
medial forefoot; LM: lateral midfoot; LF: lateral forefoot.
2) Layers of the insole:
After detecting the pressure areas, we implemented our
pressure sensors on a sole that considered the first layer. A
cylindrical shape is disposed on the FSR, is aimed to have a
global distribution of the force exerted by foot. Then, a
second layer is added to protect the sensors and its
connection. Finally, the final layer is a very thin insole for
foot to comfort and avoid problemsof directcontactwiththe
sensors.
Fig. 3. Layers of the insole
3) Sensing element:
Here FSR 402 model is used, It has a single-zone Force
Sensing Resistor, with interesting characteristics[7],[8]well
light weight, small size and low cost, optimized for use in
human touch control of electronic devices such as
automotive electronics, medical systems, and in industrial
and roboticsapplications [9]. They are robust polymer thick
film (PTF) sensors that exhibit a decrease in resistance with
increase in force applied to the surface of the sensor. It has a
14.7mm diameter active area, we have placed an epoxy
dome over the sensing area for directing all of the applied
force through the effective sensing area as showninFigure4
Fig. 4. Modified force sensing resistor](https://image.slidesharecdn.com/irjet-v5i159-180310080728/85/IRJET-Pedobarography-Insoles-with-Wireless-Data-Transmission-2-320.jpg)
![International Research Journal of Engineering and Technology (IRJET) e-ISSN: 2395-0056
Volume: 05 Issue: 01 | Jan-2018 www.irjet.net p-ISSN: 2395-0072
© 2018, IRJET | Impact Factor value: 6.171 | ISO 9001:2008 Certified Journal | Page 285
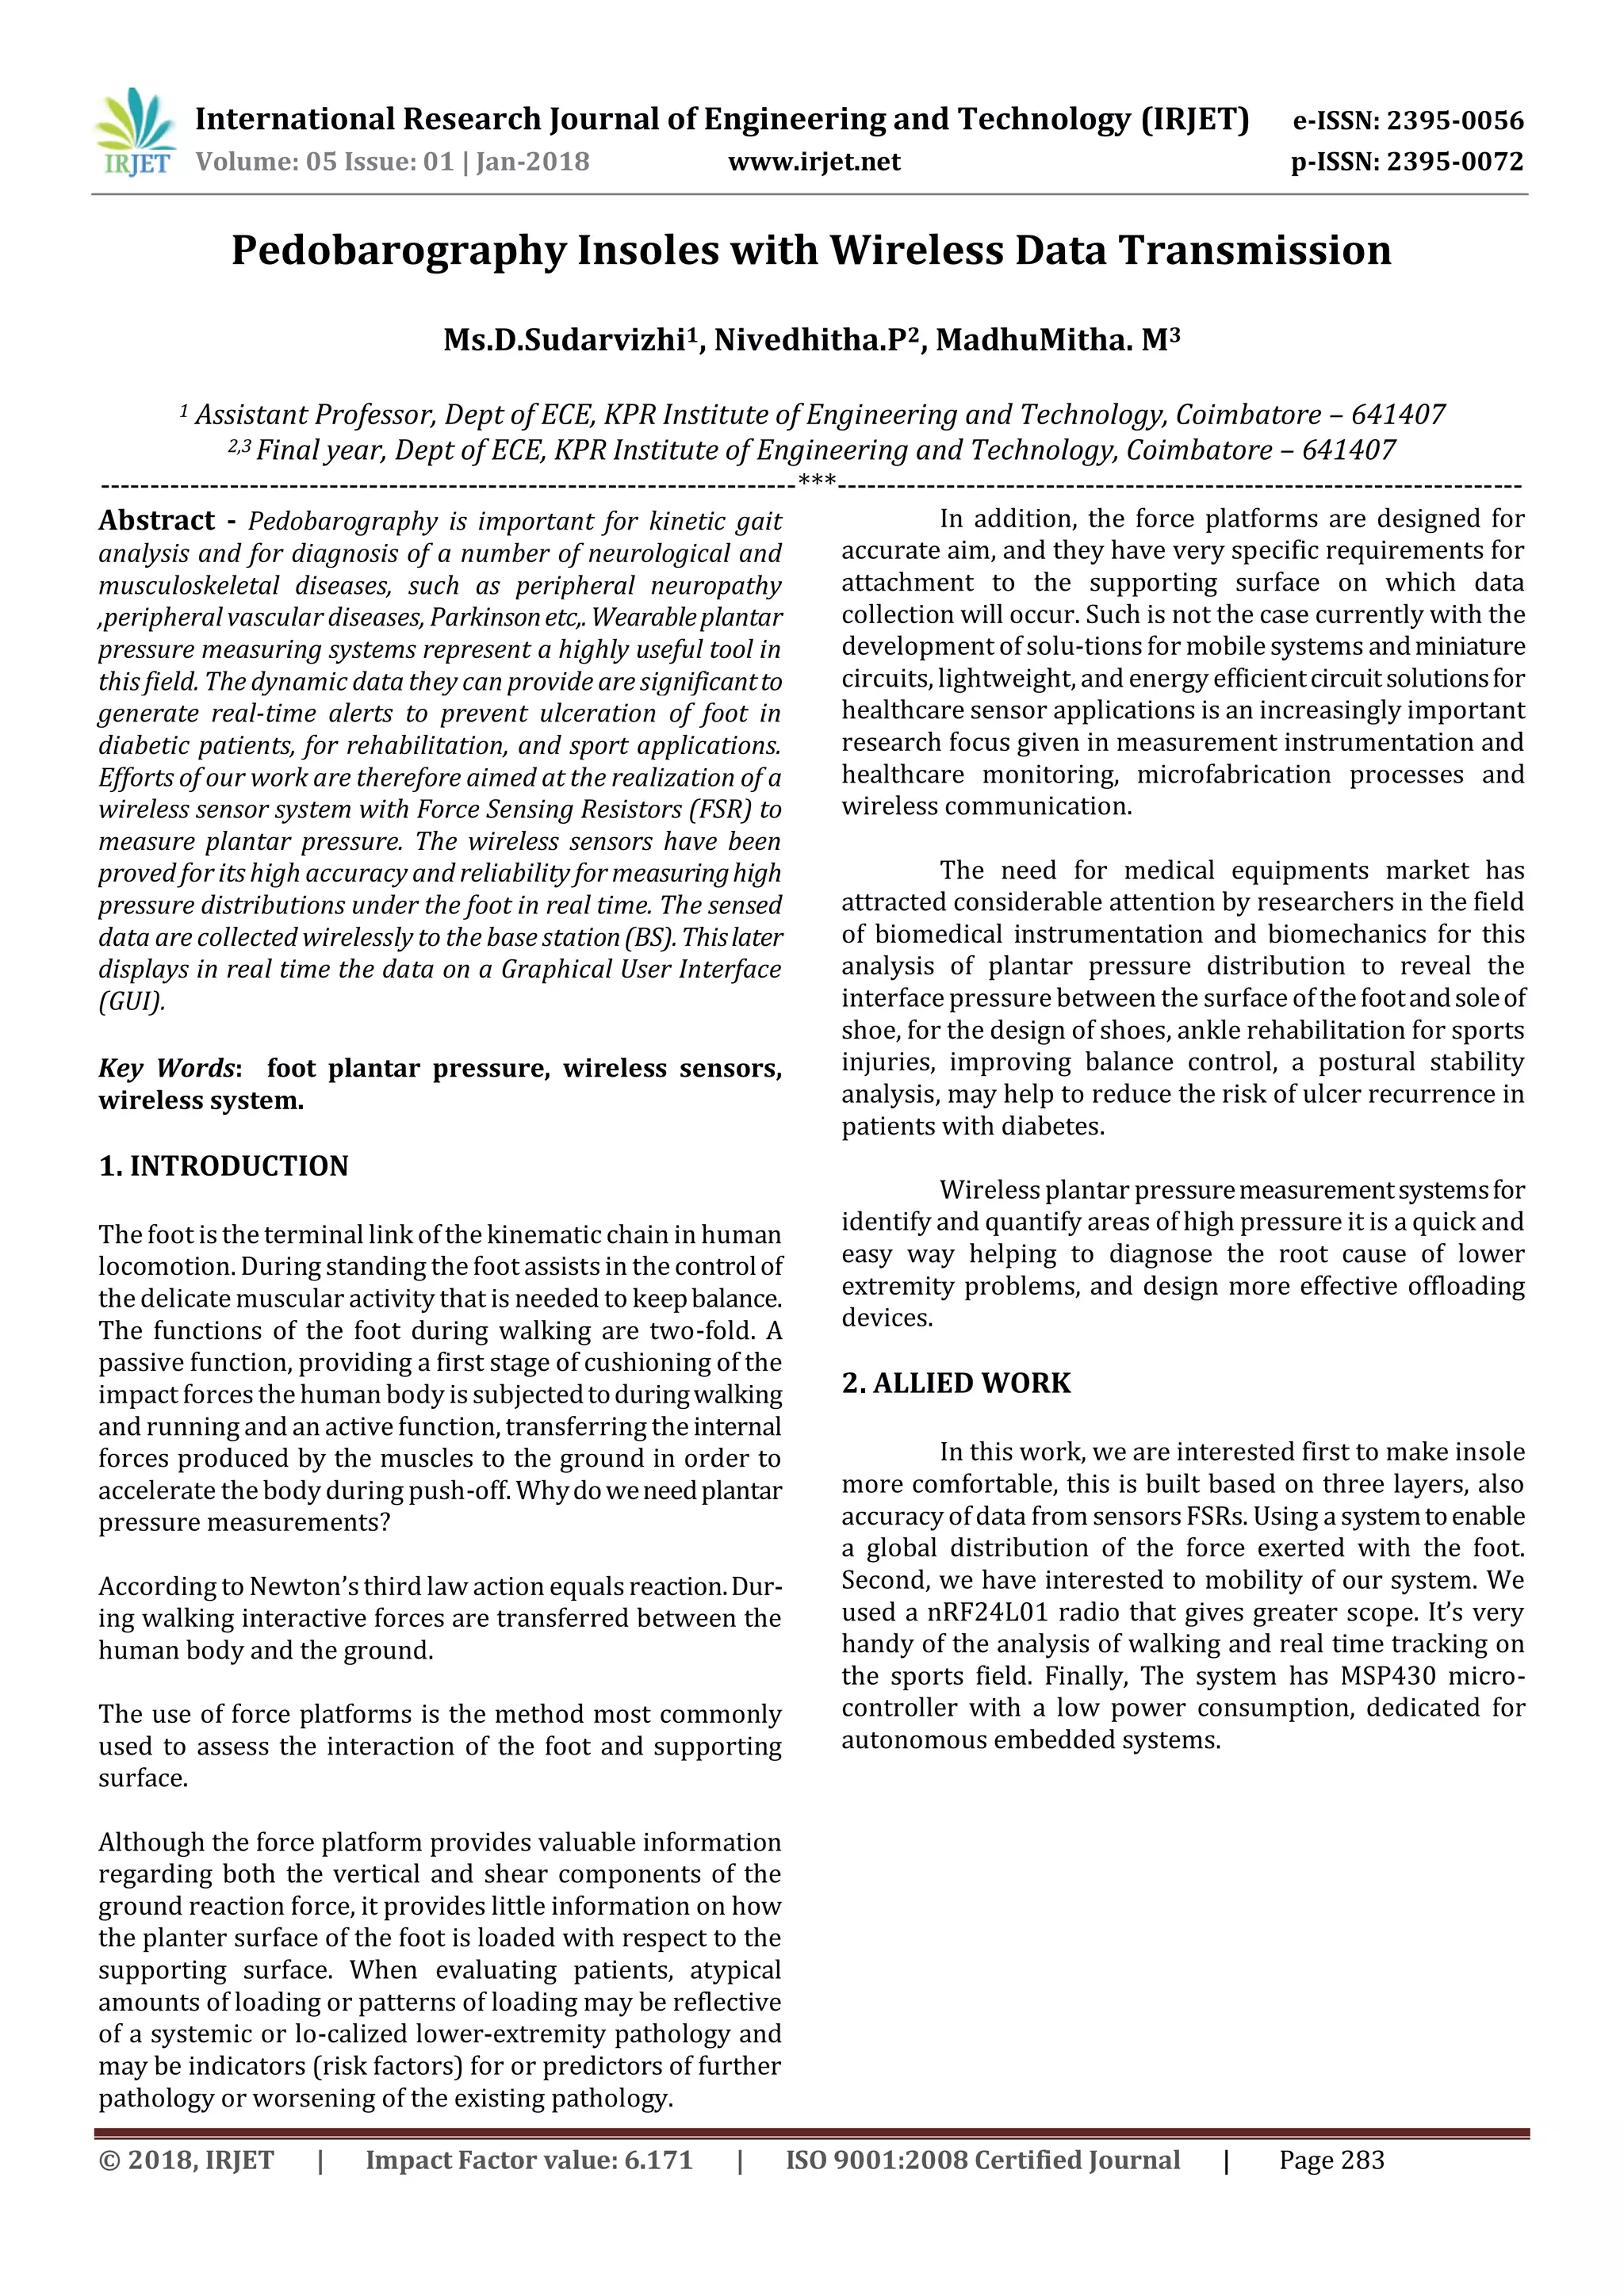
4) Conditioning circuit for the FSRs sensors:
A simple circuit of conditioning was realized , each sensor is
mounted in a voltage divider to adjust the measuring range
and is followed by a voltage follower made with TL081 op-
amp for the impedance matching. The conditioning circuit
illustrated in the figure 5.
5) Sensor calibration:
The new sensing element that has been realizedhasneedthe
calibration for determine the range of variation of the force,
in this case we made a direct etalonnage on the insole to get
the real values pressure from each sensor. The conditioning
circuit was equipped with a potentiometers to adjust the
measuring range.
Fig. 5. The conditioning circuit for the sensor element
4.2. Processing unit
After conditioning the signal from sensors FSRs, the analog
to digital conversion can be made using the ADC module of
MSP microcontroller (MCUs) from Texas Instruments (TI)
This Micro-controller has 16-bit, RISC-based, mixed-signal,
and clock system has the ability to enable and disable
various clocks and oscillatorswhich allowthedevicetoenter
several low-power modes (LPMs). The flexible clock-ing
system optimizes overall current consumption by only
enabling the required clocks when appropriate. This means
that MSP430 MCUs can operate for decades on a single coin
cell battery.
Fig. 6. The Sensor board: Micro-controller, conditioning,
Radio, with the dimensions of 55x45mm.
5. WIRELESS OUTSENDING MODULE
This emerging technology can take some physical data
collected from an environment and transmit themtoremote
collection points[]. In this work two moreWirelesswasused,
a sender and a receiver:
The sender node will read a data from the ADC each 10 ms,
which is equivalent to a frequency of 100Hz, then send them
with the nRF24L01 radio.
The reception is achieved by a receiver node using the same
micro-controller and also connected to a nRF24L01 radio.
Thus, the receiver receives the data and vehicle to a PC
through a USB connection. These data will thenbeprocessed
and then displayed on GUI.
6. USER INTERFACE
An interactive graphical user interface (GUI) isimplemented
to display in real time the results and implanted medical
instrument information. The GUI display the areas of high
pressure based a clear color-coded, whichwillallowtheuser
to follow the variations in pressure, see figure 7. In the same
time we have another window, to display the measurement
value in N/Kg for each sensor.
Fig.7. User Interface
7. RESULTS
From instrument that has been designed to measure the
pressure affecting different region of the foot , we have
canned to make the different between each types of feet,
There are three different types of feet, pes planus, pes cavus
and normal foot, which could influence the pressure loading
on the feet. A relationship exists between foot type and foot
pressure, the FSR sensor placed in the MF area indicates a
higher foot pressure for people with pesplanuscomparedto
pes cavus.
The instrument plantar pressure measurement system pin-
point areas of high pressure in a clear color-coded display.
We can after use these accurate, high resolution images to
aid in development of better treatments, so the patients feel
better faster. The images also make it easier to explain
diagnoses and treatments to patients and other providers.](https://image.slidesharecdn.com/irjet-v5i159-180310080728/85/IRJET-Pedobarography-Insoles-with-Wireless-Data-Transmission-3-320.jpg)
![International Research Journal of Engineering and Technology (IRJET) e-ISSN: 2395-0056
Volume: 05 Issue: 01 | Jan-2018 www.irjet.net p-ISSN: 2395-0072
© 2018, IRJET | Impact Factor value: 6.171 | ISO 9001:2008 Certified Journal | Page 286
8. CONCLUSION
We have presented in this paper, a system to
wirelessly record and analyse foot pressure distribution,
From the experimental results, it can conclude that purpose
of measuring the pressure of the foot is to quantify the
degree of deformation of the foot and foot dynamically
evaluate and define areas of high pressure.
REFERENCES
[1] D. Rosenbaum and H.-P. Becker, “Plantar pressure
distribution measure-ments. Technical background and
clinical applications,” Foot and Ankle Surgery, vol. 3, no. 1,
pp. 1 – 14, 1997.
[2] S. Boukhenous, M. Attari, and Y. Remram, “An Easy
Platform for Postural Balance Analysis by the Evaluation of
Instantaneous Center of Gravity,” fAPCBEEg Procedia, vol.7,
no. 0, pp. 11–15, 2013, the 3rd International Conference on
Biomedical Engineering and Technology - fICBETg 2013
[3] S. Boukhenous and M. Attari, “A postural stability
analysis by using plantar pressure measurements,” in
Systems, Signals and Devices (SSD), 2011 8th International
Multi-Conference on, March 2011, pp. 1–6.
[4] K. Maluf, M. Mueller, M. Strube, J. Engsberg, and J.
Johnson, “Tendon achilles lengthening for the treatment of
neuropathic ulcers causesa temporary reduction inforefoot
pressure associated with changes in plantar flexor power
rather than ankle motion during gait,” Journal of
Biomechanics, vol. 37, no. 6, pp. 897 – 906, 2004.
[5] Y. Lai, H. Lin, H. Pan, W. Chang, C. Hsu, and J. Renn,
“Impact of foot progression angle on the distribution of
plantar pressure in normal children,” Clinical biomechanics
(Bristol, Avon), vol. 29, no. 2, p. 196200, February 2014.
[6] T. Jensen, A conductive polymer sensor for measuring
external finger forces. University of Wisconsin–Madison,
1990. [Online]. Available:
http://books.google.dz/books?id=HxtZAAAAMAAJ
[7]“Interlink Electronics”,
http://www.interlinkelectronics.com/FSR402.php, 2014,
[Online; accessed 19-Mai-2014].
[8] J. Coronado, A. Ulloa-Perez, F. Garcia-Cordova, and J.
Villalba-Fernandez, “Experimental developmentfor thumb-
index pinch force measurementsduringobjectmanipulation
with application to robotic hands,” in Systems, Man, and
Cybernetics, 1999. IEEE SMC ’99 Conference Proceedings.
1999 IEEE International Conference on, vol. 6, 1999, pp.
786–791 vol.6.
[9] “Msp430g2553 datasheet
http://www.ti.com/lit/sg/slab034x/slab034x.pdf.”
[10] O. A. M. O. A. R. Y. B. S. Zizoua, C. Chouana and N.
Meziane, “Wirelesssensor network dedicated to monitoring
ecg,” in Biomedical Engineering International Conference,
BIOMEIC’12. University of Tlemcen, October 2012, pp. 1–5.](https://image.slidesharecdn.com/irjet-v5i159-180310080728/85/IRJET-Pedobarography-Insoles-with-Wireless-Data-Transmission-4-320.jpg)

This document describes the development of a wireless plantar pressure measurement system using force sensing resistors (FSRs). The system includes an insole with embedded FSR sensors to measure pressure distribution under the foot. Sensor data is transmitted wirelessly via nRF24L01 radios from a transmitter in the insole to a receiver connected to a PC. The PC displays the pressure data in real-time on a graphical user interface. The system aims to provide accurate, wireless plantar pressure measurements to help diagnose foot and gait issues.


