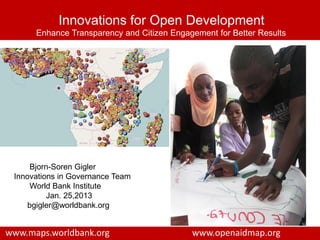
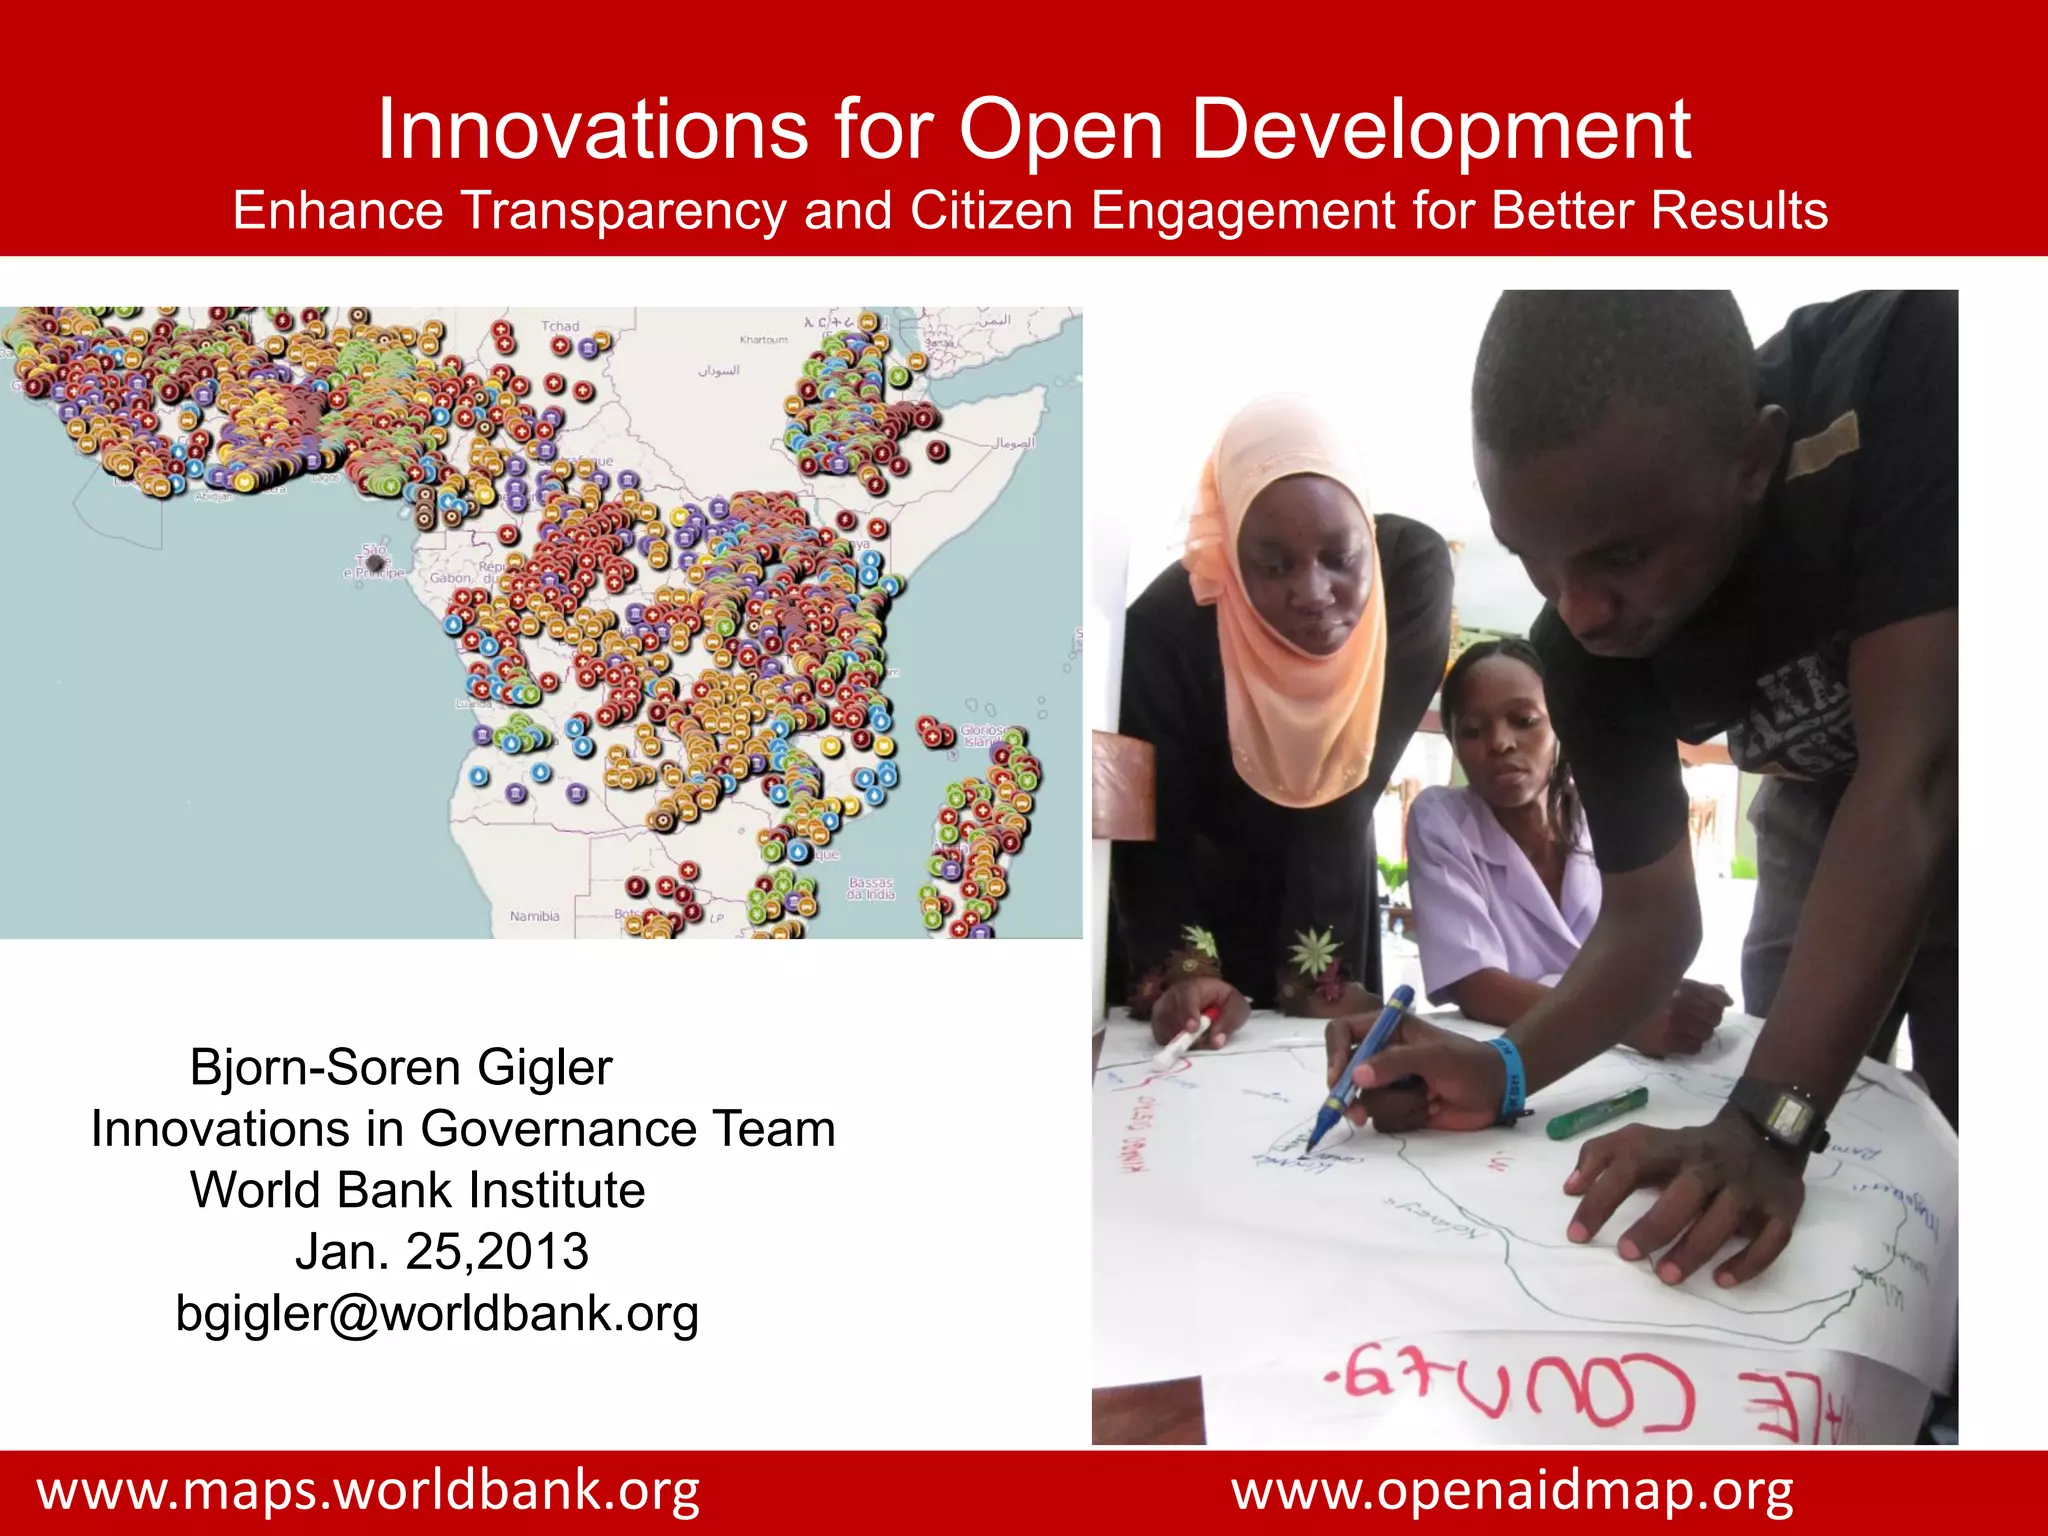
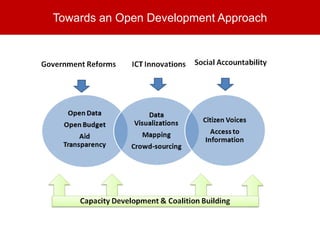
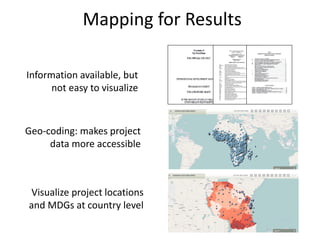
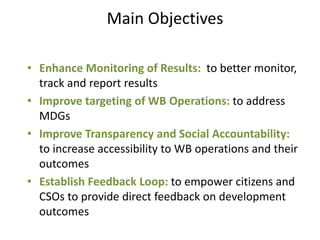
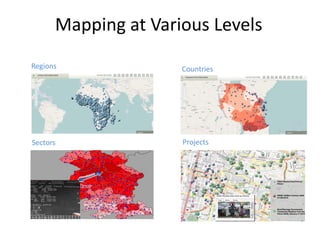
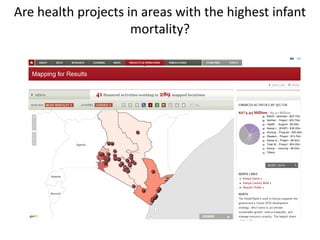
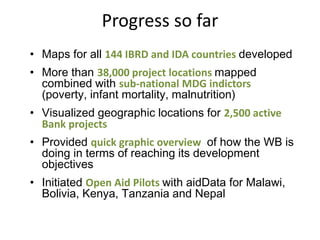
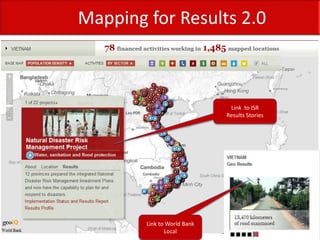
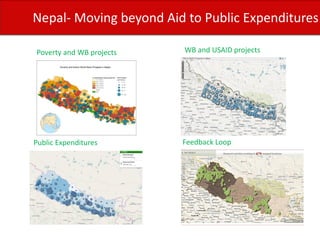
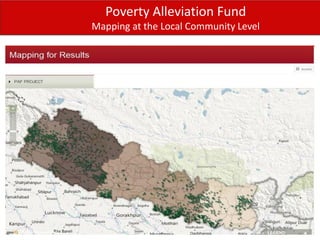
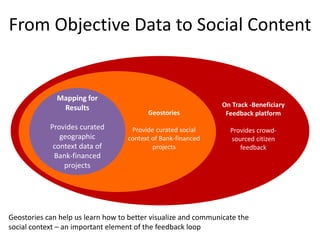
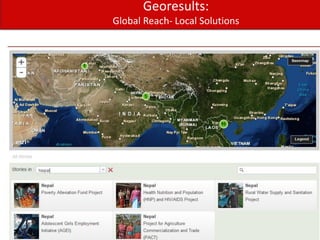
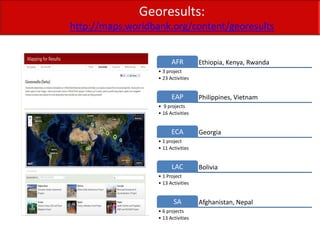
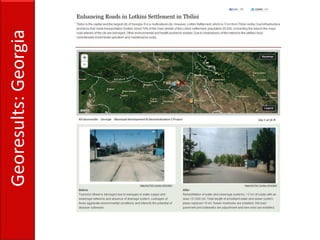
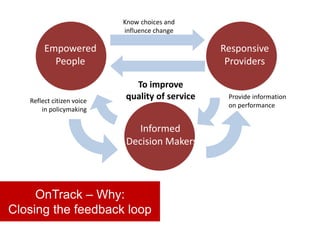
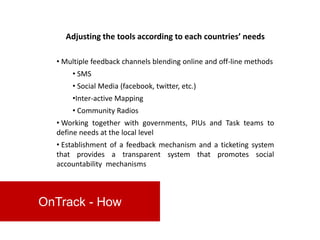
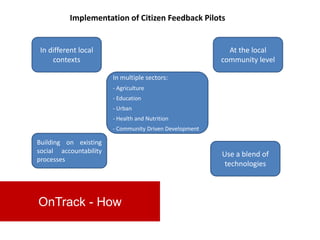
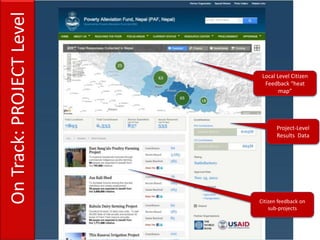
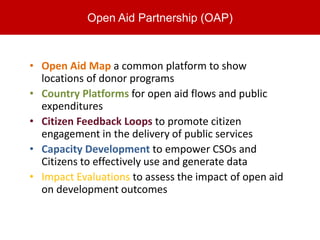
Innovations for Open Development
      Enhance Transparency and Citizen Engagement for Better Results


      Bjorn-Soren Gigler
 Innovations in Governance Team
      World Bank Institute
           Jan. 25,2013
     bgigler@worldbank.org


www.maps.worldbank.org                      www.openaidmap.org
Participatory, Collaborative, Results Focused
Towards an Open Development Approach
Mapping for Results

Information available, but
      not easy to visualize


Geo-coding: makes project
     data more accessible


 Visualize project locations
and MDGs at country level
Main Objectives

• Enhance Monitoring of Results: to better monitor,
  track and report results
• Improve targeting of WB Operations: to address
  MDGs
• Improve Transparency and Social Accountability:
  to increase accessibility to WB operations and their
  outcomes
• Establish Feedback Loop: to empower citizens and
  CSOs to provide direct feedback on development
  outcomes
Mapping at Various Levels
Regions                   Countries


Sectors                   Projects


                 maps.worldbank.org
Are health projects in areas with the highest infant
                     mortality?
Progress so far
• Maps for all 144 IBRD and IDA countries developed
• More than 38,000 project locations mapped
  combined with sub-national MDG indictors
  (poverty, infant mortality, malnutrition)
• Visualized geographic locations for 2,500 active
  Bank projects
• Provided quick graphic overview of how the WB is
  doing in terms of reaching its development
  objectives
• Initiated Open Aid Pilots with aidData for Malawi,
  Bolivia, Kenya, Tanzania and Nepal
Mapping for Results 2.0


                              Link to ISR
                             Results Stories


        Link to World Bank
               Local
Nepal- Moving beyond Aid to Public Expenditures

Poverty and WB projects   WB and USAID projects


Public Expenditures       Feedback Loop
Poverty Alleviation Fund
Mapping at the Local Community Level
From Objective Data to Social Content


              Mapping for
               Results                                         On Track -Beneficiary
                                         Geostories             Feedback platform
            Provides curated        Provide curated social        Provides crowd-
               geographic          context of Bank-financed       sourced citizen
             context data of               projects                  feedback
             Bank-financed
                projects


Geostories can help us learn how to better visualize and communicate the
social context – an important element of the feedback loop
Georesults:
Global Reach- Local Solutions
Georesults:
http://maps.worldbank.org/content/georesults


                         AFR         Ethiopia, Kenya, Rwanda
                   • 3 project
                   • 23 Activities


                         EAP         Philippines, Vietnam
                   • 9 projects
                   • 16 Activities


                         ECA         Georgia
                   • 1 project
                   • 11 Activities


                         LAC         Bolivia
                   • 1 Project
                   • 13 Activities


                          SA         Afghanistan, Nepal
                   • 6 projects
                   • 13 Activities
Georesults: Georgia
GeoResults: Bolivia
GeoResults: Nepal
On Track: Location Based
 Beneficiary Feedback
On Track is a program that facilitates direct feedback
   loops between citizens, governments and WB project
   teams. The platform uses innovative approaches of
   ICTs (SMS, Mapping and Social Media) to strengthen
   existing   social   accountability   mechanisms    by
   collecting, tracking and reporting citizens feedback
   about project-specific development outcomes.


OnTrack - Aim
Know choices and
                           influence change

        Empowered                               Responsive
          People                                 Providers

                             To improve
   Reflect citizen voice
                           quality of service    Provide information
                                                 on performance
       in policymaking

                              Informed
                           Decision Makers


     OnTrack – Why:
Closing the feedback loop
Adjusting the tools according to each countries’ needs

  • Multiple feedback channels blending online and off-line methods
      • SMS
      • Social Media (facebook, twitter, etc.)
      •Inter-active Mapping
      • Community Radios
  • Working together with governments, PIUs and Task teams to
  define needs at the local level
  • Establishment of a feedback mechanism and a ticketing system
  that provides a transparent system that promotes social
  accountability mechanisms


OnTrack - How
Implementation of Citizen Feedback Pilots


 In different local                                        At the local
     contexts                                            community level

                        In multiple sectors:
                        - Agriculture
                        - Education
                        - Urban
                        - Health and Nutrition
                        - Community Driven Development

Building on existing
social accountability                                    Use a blend of
processes
                                                          technologies


OnTrack - How
On Track: PROJECT Level

                           Local Level Citizen
                            Feedback “heat
                                  map”


                                 Project-Level
                                 Results Data


                          Citizen feedback on
                              sub-projects
On Track: ACTIVITY Level
                                 Map, activity
                                overview, local
                                   contacts


                             Multiple feedback
                            submission channels


                           Different feedback
                           types (Suggestions,
                            Problems, Stories)


                           Stories and Comments
                            from the community
BENEFICIARY   INDONESIA COMMUNITY-DRIVEN DEVELOPMENT
 FEEDBACK


                                                  25
Open Aid Partnership (OAP)


• Open Aid Map a common platform to show
  locations of donor programs
• Country Platforms for open aid flows and public
  expenditures
• Citizen Feedback Loops to promote citizen
  engagement in the delivery of public services
• Capacity Development to empower CSOs and
  Citizens to effectively use and generate data
• Impact Evaluations to assess the impact of open aid
  on development outcomes
Open Aid Partnership
• Geo-coding of
  donor-financed
  projects based on
  IATI standard
• Joint Open Aid Map
  for better aid
  coordination
  (AidData)
• Visualize projects of
  27 donors combined
  with poverty data


             www. openaidmap.org
Empowered Citizens

Innovations for Open Development

  • 1.
    Innovations for OpenDevelopment Enhance Transparency and Citizen Engagement for Better Results Bjorn-Soren Gigler Innovations in Governance Team World Bank Institute Jan. 25,2013 bgigler@worldbank.org www.maps.worldbank.org www.openaidmap.org
  • 2.
    Participatory, Collaborative, ResultsFocused Towards an Open Development Approach
  • 3.
    Mapping for Results Informationavailable, but not easy to visualize Geo-coding: makes project data more accessible Visualize project locations and MDGs at country level
  • 4.
    Main Objectives • EnhanceMonitoring of Results: to better monitor, track and report results • Improve targeting of WB Operations: to address MDGs • Improve Transparency and Social Accountability: to increase accessibility to WB operations and their outcomes • Establish Feedback Loop: to empower citizens and CSOs to provide direct feedback on development outcomes
  • 5.
    Mapping at VariousLevels Regions Countries Sectors Projects maps.worldbank.org
  • 6.
    Are health projectsin areas with the highest infant mortality?
  • 7.
    Progress so far •Maps for all 144 IBRD and IDA countries developed • More than 38,000 project locations mapped combined with sub-national MDG indictors (poverty, infant mortality, malnutrition) • Visualized geographic locations for 2,500 active Bank projects • Provided quick graphic overview of how the WB is doing in terms of reaching its development objectives • Initiated Open Aid Pilots with aidData for Malawi, Bolivia, Kenya, Tanzania and Nepal
  • 8.
    Mapping for Results2.0 Link to ISR Results Stories Link to World Bank Local
  • 9.
    Nepal- Moving beyondAid to Public Expenditures Poverty and WB projects WB and USAID projects Public Expenditures Feedback Loop
  • 10.
    Poverty Alleviation Fund Mappingat the Local Community Level
  • 11.
    From Objective Datato Social Content Mapping for Results On Track -Beneficiary Geostories Feedback platform Provides curated Provide curated social Provides crowd- geographic context of Bank-financed sourced citizen context data of projects feedback Bank-financed projects Geostories can help us learn how to better visualize and communicate the social context – an important element of the feedback loop
  • 12.
  • 13.
    Georesults: http://maps.worldbank.org/content/georesults AFR Ethiopia, Kenya, Rwanda • 3 project • 23 Activities EAP Philippines, Vietnam • 9 projects • 16 Activities ECA Georgia • 1 project • 11 Activities LAC Bolivia • 1 Project • 13 Activities SA Afghanistan, Nepal • 6 projects • 13 Activities
  • 14.
  • 15.
  • 16.
  • 17.
    On Track: LocationBased Beneficiary Feedback
  • 18.
    On Track isa program that facilitates direct feedback loops between citizens, governments and WB project teams. The platform uses innovative approaches of ICTs (SMS, Mapping and Social Media) to strengthen existing social accountability mechanisms by collecting, tracking and reporting citizens feedback about project-specific development outcomes. OnTrack - Aim
  • 19.
    Know choices and influence change Empowered Responsive People Providers To improve Reflect citizen voice quality of service Provide information on performance in policymaking Informed Decision Makers OnTrack – Why: Closing the feedback loop
  • 20.
    Adjusting the toolsaccording to each countries’ needs • Multiple feedback channels blending online and off-line methods • SMS • Social Media (facebook, twitter, etc.) •Inter-active Mapping • Community Radios • Working together with governments, PIUs and Task teams to define needs at the local level • Establishment of a feedback mechanism and a ticketing system that provides a transparent system that promotes social accountability mechanisms OnTrack - How
  • 21.
    Implementation of CitizenFeedback Pilots In different local At the local contexts community level In multiple sectors: - Agriculture - Education - Urban - Health and Nutrition - Community Driven Development Building on existing social accountability Use a blend of processes technologies OnTrack - How
  • 22.
    On Track: PROJECTLevel Local Level Citizen Feedback “heat map” Project-Level Results Data Citizen feedback on sub-projects
  • 23.
    On Track: ACTIVITYLevel Map, activity overview, local contacts Multiple feedback submission channels Different feedback types (Suggestions, Problems, Stories) Stories and Comments from the community
  • 25.
    BENEFICIARY INDONESIA COMMUNITY-DRIVEN DEVELOPMENT FEEDBACK 25
  • 26.
    Open Aid Partnership(OAP) • Open Aid Map a common platform to show locations of donor programs • Country Platforms for open aid flows and public expenditures • Citizen Feedback Loops to promote citizen engagement in the delivery of public services • Capacity Development to empower CSOs and Citizens to effectively use and generate data • Impact Evaluations to assess the impact of open aid on development outcomes
  • 27.
    Open Aid Partnership •Geo-coding of donor-financed projects based on IATI standard • Joint Open Aid Map for better aid coordination (AidData) • Visualize projects of 27 donors combined with poverty data www. openaidmap.org
  • 28.