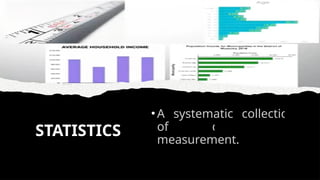
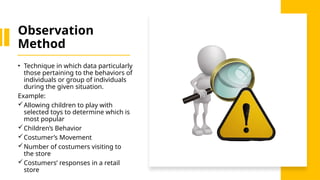
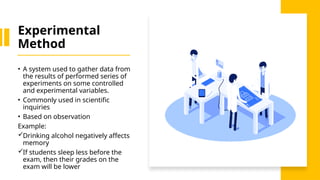
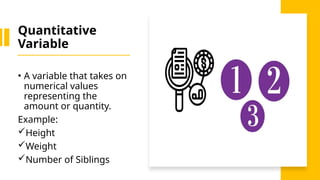
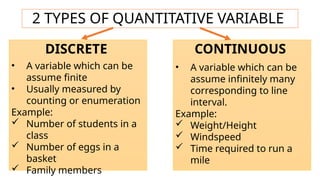
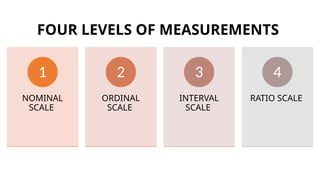
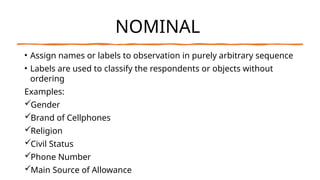
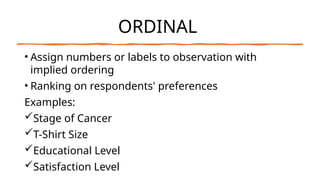
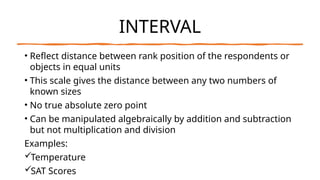
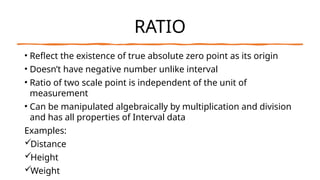
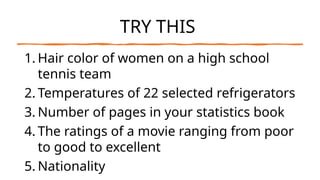
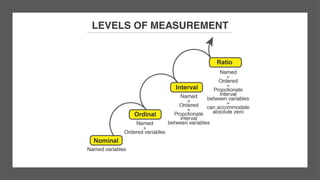
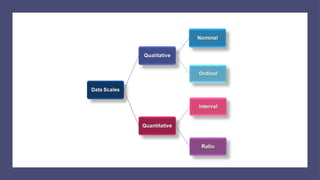
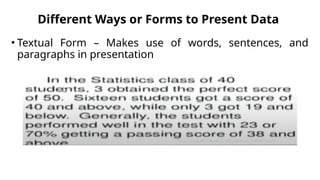
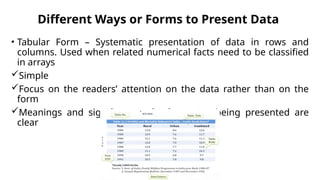
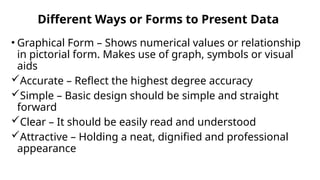
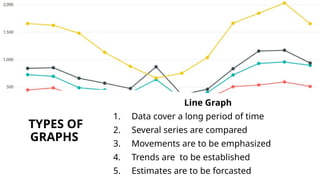
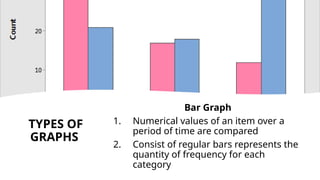
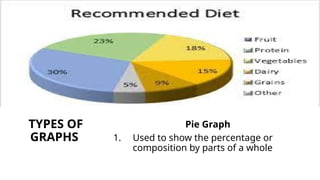
The document provides an overview of data management and statistics, including methods of data gathering such as interviews, questionnaires, registrations, observations, and experiments. It discusses types of variables (qualitative, quantitative, discrete, continuous) and levels of measurement (nominal, ordinal, interval, ratio) with examples. It also highlights different forms for presenting data, including textual, tabular, and graphical formats like line, bar, pie graphs, and pictographs.


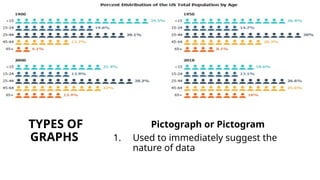


![FBS 719 and FBS 819 BIOSTATISTICS [Autosaved].pptx](https://cdn.slidesharecdn.com/ss_thumbnails/fbs719andfbs819biostatisticsautosaved-240713084256-92f19157-thumbnail.jpg?width=640&height=640&fit=bounds)


