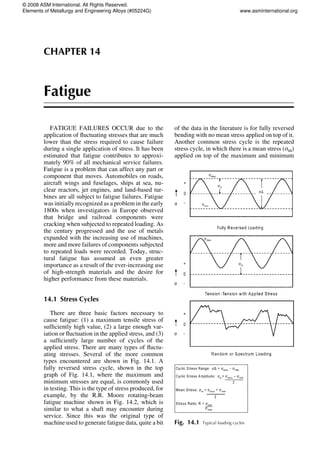
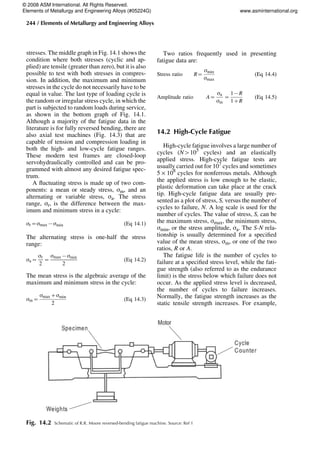
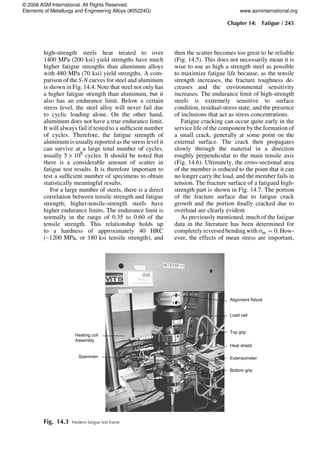
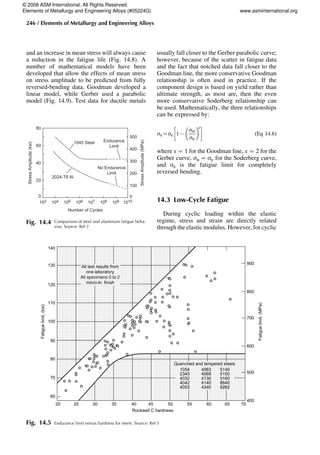
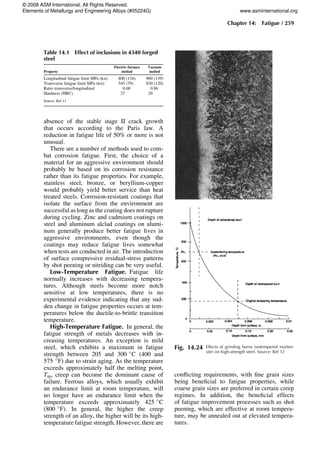
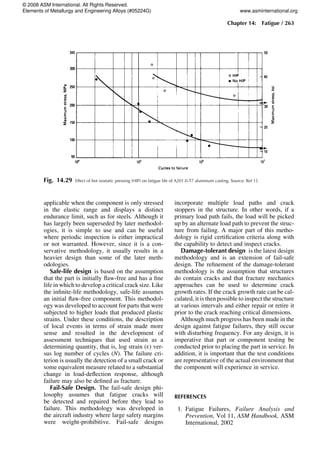
SlideShare a Scribd company logo
CHAPTER 14
Fatigue
FATIGUE FAILURES OCCUR due to the
application of fluctuating stresses that are much
lower than the stress required to cause failure
during a single application of stress. It has been
estimated that fatigue contributes to approxi-
mately 90% of all mechanical service failures.
Fatigue is a problem that can affect any part or
component that moves. Automobiles on roads,
aircraft wings and fuselages, ships at sea, nu-
clear reactors, jet engines, and land-based tur-
bines are all subject to fatigue failures. Fatigue
was initially recognized as a problem in the early
1800s when investigators in Europe observed
that bridge and railroad components were
cracking when subjected to repeated loading. As
the century progressed and the use of metals
expanded with the increasing use of machines,
more and more failures of components subjected
to repeated loads were recorded. Today, struc-
tural fatigue has assumed an even greater
importance as a result of the ever-increasing use
of high-strength materials and the desire for
higher performance from these materials.
14.1 Stress Cycles
There are three basic factors necessary to
cause fatigue: (1) a maximum tensile stress of
sufficiently high value, (2) a large enough var-
iation or fluctuation in the applied stress, and (3)
a sufficiently large number of cycles of the
applied stress. There are many types of fluctu-
ating stresses. Several of the more common
types encountered are shown in Fig. 14.1. A
fully reversed stress cycle, shown in the top
graph of Fig. 14.1, where the maximum and
minimum stresses are equal, is commonly used
in testing. This is the type of stress produced, for
example, by the R.R. Moore rotating-beam
fatigue machine shown in Fig. 14.2, which is
similar to what a shaft may encounter during
service. Since this was the original type of
machine used to generate fatigue data, quite a bit
of the data in the literature is for fully reversed
bending with no mean stress applied on top of it.
Another common stress cycle is the repeated
stress cycle, in which there is a mean stress (sm)
applied on top of the maximum and minimum
Fig. 14.1 Typical loading cycles
© 2008 ASM International. All Rights Reserved.
Elements of Metallurgy and Engineering Alloys (#05224G) www.asminternational.org
stresses. The middle graph in Fig. 14.1 shows the
condition where both stresses (cyclic and ap-
plied) are tensile (greater than zero), but it is also
possible to test with both stresses in compres-
sion. In addition, the maximum and minimum
stresses in the cycle do not necessarily have to be
equal in value. The last type of loading cycle is
the random or irregular stress cycle, in which the
part is subjected to random loads during service,
as shown in the bottom graph of Fig. 14.1.
Although a majority of the fatigue data in the
literature is for fully reversed bending, there are
also axial test machines (Fig. 14.3) that are
capable of tension and compression loading in
both the high- and low-cycle fatigue ranges.
These modern test frames are closed-loop
servohydraulically controlled and can be pro-
grammed with almost any desired fatigue spec-
trum.
A fluctuating stress is made up of two com-
ponents: a mean or steady stress, sm, and an
alternating or variable stress, sa. The stress
range, sr, is the difference between the max-
imum and minimum stress in a cycle:
sr=smax7smin (Eq 14.1)
The alternating stress is one-half the stress
range:
sa=
sr
2
=
smax7smin
2
(Eq 14.2)
The mean stress is the algebraic average of the
maximum and minimum stress in the cycle:
sm=
smax+smin
2
(Eq 14.3)
Two ratios frequently used in presenting
fatigue data are:
Stress ratio R=
smin
smax
(Eq 14.4)
Amplitude ratio A=
sa
sm
=
17R
1+R
(Eq 14.5)
14.2 High-Cycle Fatigue
High-cycle fatigue involves a large number of
cycles (N4105
cycles) and an elastically
applied stress. High-cycle fatigue tests are
usually carried out for 107
cycles and sometimes
5 · 108
cycles for nonferrous metals. Although
the applied stress is low enough to be elastic,
plastic deformation can take place at the crack
tip. High-cycle fatigue data are usually pre-
sented as a plot of stress, S, versus the number of
cycles to failure, N. A log scale is used for the
number of cycles. The value of stress, S, can be
the maximum stress, smax, the minimum stress,
smin, or the stress amplitude, sa. The S-N rela-
tionship is usually determined for a specified
value of the mean stress, sm, or one of the two
ratios, R or A.
The fatigue life is the number of cycles to
failure at a specified stress level, while the fati-
gue strength (also referred to as the endurance
limit) is the stress below which failure does not
occur. As the applied stress level is decreased,
the number of cycles to failure increases.
Normally, the fatigue strength increases as the
static tensile strength increases. For example,
Fig. 14.2 Schematic of R.R. Moore reversed-bending fatigue machine. Source: Ref 1
244 / Elements of Metallurgy and Engineering Alloys
© 2008 ASM International. All Rights Reserved.
Elements of Metallurgy and Engineering Alloys (#05224G) www.asminternational.org
high-strength steels heat treated to over
1400 MPa (200 ksi) yield strengths have much
higher fatigue strengths than aluminum alloys
with 480 MPa (70 ksi) yield strengths. A com-
parison of the S-N curves for steel and aluminum
is shown in Fig. 14.4. Note that steel not only has
a higher fatigue strength than aluminum, but it
also has an endurance limit. Below a certain
stress level, the steel alloy will never fail due
to cyclic loading alone. On the other hand,
aluminum does not have a true endurance limit.
It will always fail if tested to a sufficient number
of cycles. Therefore, the fatigue strength of
aluminum is usually reported as the stress level it
can survive at a large total number of cycles,
usually 5 · 108
cycles. It should be noted that
there is a considerable amount of scatter in
fatigue test results. It is therefore important to
test a sufficient number of specimens to obtain
statistically meaningful results.
For a large number of steels, there is a direct
correlation between tensile strength and fatigue
strength; higher-tensile-strength steels have
higher endurance limits. The endurance limit is
normally in the range of 0.35 to 0.60 of the
tensile strength. This relationship holds up
to a hardness of approximately 40 HRC
(~1200 MPa, or 180 ksi tensile strength), and
then the scatter becomes too great to be reliable
(Fig. 14.5). This does not necessarily mean it is
wise to use as high a strength steel as possible
to maximize fatigue life because, as the tensile
strength increases, the fracture toughness de-
creases and the environmental sensitivity
increases. The endurance limit of high-strength
steels is extremely sensitive to surface
condition, residual-stress state, and the presence
of inclusions that act as stress concentrations.
Fatigue cracking can occur quite early in the
service life of the component by the formation of
a small crack, generally at some point on the
external surface. The crack then propagates
slowly through the material in a direction
roughly perpendicular to the main tensile axis
(Fig. 14.6). Ultimately, the cross-sectional area
of the member is reduced to the point that it can
no longer carry the load, and the member fails in
tension. The fracture surface of a fatigued high-
strength part is shown in Fig. 14.7. The portion
of the fracture surface due to fatigue crack
growth and the portion finally cracked due to
overload are clearly evident.
As previously mentioned, much of the fatigue
data in the literature has been determined for
completely reversedbending with sm = 0.How-
ever, the effects of mean stress are important,
Alignment fixture
Load cell
Top grip
Heat shield
Extensometer
Bottom grip
Heating coil
Assembly
Specimen
Fig. 14.3 Modern fatigue test frame
Chapter 14: Fatigue / 245
© 2008 ASM International. All Rights Reserved.
Elements of Metallurgy and Engineering Alloys (#05224G) www.asminternational.org
and an increase in mean stress will always cause
a reduction in the fatigue life (Fig. 14.8). A
number of mathematical models have been
developed that allow the effects of mean stress
on stress amplitude to be predicted from fully
reversed-bending data. Goodman developed a
linear model, while Gerber used a parabolic
model (Fig. 14.9). Test data for ductile metals
usually fall closer to the Gerber parabolic curve;
however, because of the scatter in fatigue data
and the fact that notched data fall closer to the
Goodman line, the more conservative Goodman
relationship is often used in practice. If the
component design is based on yield rather than
ultimate strength, as most are, then the even
more conservative Soderberg relationship can
be used. Mathematically, the three relationships
can be expressed by:
sa=se 17
sm
su
 
x
 
(Eq 14.6)
where x = 1 for the Goodman line, x = 2 for the
Gerber curve, su = sy for the Soderberg curve,
and se is the fatigue limit for completely
reversed bending.
14.3 Low-Cycle Fatigue
During cyclic loading within the elastic
regime, stress and strain are directly related
through the elastic modulus. However, for cyclic
80
1045 Steel Endurance
Limit
No Endurance
Limit
2024-T6 Al
60
40
20
0
500
400
300
200
100
0
103 104 105 106 107 108 109 1010
Number of Cycles
Stress
Amplitude
(ksi)
Stress
Amplitude
(MPa)
Fig. 14.4 Comparison of steel and aluminum fatigue beha-
vior. Source: Ref 2
140
130
400
500
600
700
800
900
120
All test results from
one laboratory
All specimens 0 to 2
micro-in. finish
110
100
Fatigue
limit,
(ksi)
Fatigue
limit,
(MPa)
90
80
70
60
20 25 30 35 40 45
Rockwell C hardness
Quenched and tempered steels
1054
2340
4032
4042
4053
4063
4068
4130
4140
4340
5140
5150
5160
8640
9262
50 55 60 65 70
Fig. 14.5 Endurance limit versus hardness for steels. Source: Ref 3
246 / Elements of Metallurgy and Engineering Alloys
© 2008 ASM International. All Rights Reserved.
Elements of Metallurgy and Engineering Alloys (#05224G) www.asminternational.org
loading that produces plastic strains, the re-
sponses are more complex and form a hysteresis
loop (Fig. 14.10). From point O up to point A,
the component is in tension. On unloading,
the strain response of the specimen follows
the curve from A to D. At D, the component
is under no stress. As the component is subjected
to compressive stress, the strain response
follows the curve from D to B. Releasing the
compressive stress from B and reapplying
tensile stress, the component stress-strain con-
dition returns to point A along the curve de-
fined by B, C, and A. Points A and B represent the
cyclic stress and strain limits. The total strain,
De, consists of both elastic and plastic compo-
nents:
De=Dee+Dep (Eq 14.7)
where Dee is the elastic strain and Dee = Ds/E,
and Dep is the plastic strain and Dep is the width
of the loop at its center, that is, the distance CD
in Fig. 14.10. The area of the hysteresis loop is
equal to the work done or the energy loss per
cycle.
In cyclic strain-controlled fatigue, the strain
amplitude is held constant during cycling.
Since plastic deformation is not completely
Nucleation Crack Growth Final Failure
Fig. 14.6 Typical propagation of a fatigue crack. Source: Ref 4
Fig. 14.7 Fatigue crack growth in a high-strength steel part
Chapter 14: Fatigue / 247
© 2008 ASM International. All Rights Reserved.
Elements of Metallurgy and Engineering Alloys (#05224G) www.asminternational.org
reversible, the stress-strain response during
cycling can change, largely depending on the
initial condition of the metal. The metal
can either undergo cyclic strain hardening,
cyclic strain softening, or remain stable. Cyclic
strain hardening and softening are illustrated
schematically in Fig. 14.11. In both cases, the
hysteresis loops change with successive
cycles. Cyclic hardening leads to increasing
peak strain with increasing cycles, while cyclic
softening results in decreasing strain levels
with increasing cycles. In general, strong metals
tend to cyclically soften, and low-strength
metals tend to cyclically harden. However,
the hysteresis loop tends to stabilize after a
few hundred cycles, when the material
attains a stable condition for the imposed strain
level.
Stress
Amplitude
(σ
a
)
Increasing
Mean
Stress
σm = 240 MPa (35 ksi)
σm = 0 MPa (0 ksi)
σm = 480 (70 ksi)
Cycles to Failure (Nf)
Fig. 14.8 Effect of mean stress on fatigue life
σ
σ
σ σ
σ
σ
σ
σ
σ
(σm)
Fig. 14.9 Comparison of Goodman, Gerber, and Soderberg models for relating mean stress to stress amplitude
248 / Elements of Metallurgy and Engineering Alloys
© 2008 ASM International. All Rights Reserved.
Elements of Metallurgy and Engineering Alloys (#05224G) www.asminternational.org
Typically, metals harden if su=sy  1:4 and
soften if su=sy  1:2.
The reason for hardening or softening is
related to the dislocation microstructure of the
metal. When the metal is highly work hardened
and the dislocation density is high, cyclic strain
allows the rearrangement of dislocations into
more stable networks, thereby reducing the
stress at which plastic deformation occurs.
Conversely, when the initial dislocation density
is low, the cyclic strain increases the dislocation
density, increasing the amount of elastic strain
and stress on the material.
Low-cycle fatigue test data are often pre-
sented as a plot of the plastic strain range, Dep,
versus cycles to failure, N. When plotted on log-
log coordinates, a straight line is obtained that is
described by the Coffin-Manson relation:
Dep
2
=e0
f(2N)c
(Eq 14.8)
where Dep=2 is the plastic strain amplitude, and
e0
f is the fatigue ductility coefficient defined by
the strain intercept at 2N = 1. For many metals,
e0
f is approximately equal to the true fracture
strain, ef. 2N is the number of strain reversals to
failure, where one cycle is two reversals, and c is
the fatigue ductility exponent, which usually
varies between 0.5 and 0.7. A smaller value
of c results in longer fatigue lives.
The Basquin equation, which describes the
high-cycle, low-strain regime where the nominal
strains are elastic, is:
sa=
Dee
2
E=s0
f(2N)b
(Eq 14.9)
where sa is the alternating stress amplitude,
Dee=2 is the elastic strain amplitude, E is the
modulus of elasticity, and s0
f is the fatigue
strength coefficient, defined as the stress inter-
cept at 2N = 1. s0
f is approximately equal to the
true fracture stress, sf. 2N is the number of load
reversals to failure, and b is the fatigue strength
exponent, which varies for most metals between
0.05 and 0.12. A smaller b results in a longer
fatigue life.
Combining Basquin’s equation and the
Coffin-Manson equation gives an equation
∆σ/2E
∆ε
∆εp ∆εe = ∆σ/E
∆σ
O
Strain
Stress A
B
C D
∆σ/2E
σa = ∆σ/2
Fig. 14.10 Stress-strain hysteresis loop for cyclic loading
Chapter 14: Fatigue / 249
© 2008 ASM International. All Rights Reserved.
Elements of Metallurgy and Engineering Alloys (#05224G) www.asminternational.org
that can be used to estimate the entire range of
fatigue lives:
De
2
=
Dee
2
+
Dep
2
(Eq 14.10)
De
2
=
s0
f
E
(2N)b
+e0
f(2N)c
(Eq 14.11)
The fatigue strain-life curve tends toward the
plastic curve at large strain amplitudes and
Fig. 14.11 Cyclic hardening and cyclic softening
250 / Elements of Metallurgy and Engineering Alloys
© 2008 ASM International. All Rights Reserved.
Elements of Metallurgy and Engineering Alloys (#05224G) www.asminternational.org
toward the elastic curve at small strain am-
plitudes (Fig. 14.12). For high-cycle strain
conditions, ductile metals have the longest lives,
while at low-cycle strain conditions, strong
metals have the longest lives.
14.4 Cumulative Damage
Fatigue tests are often conducted under sim-
ple conditions, such as constant amplitude and
constant frequency. However, in real structures,
the loading conditions are rarely simple. Many
structures are subjected to a range of fluctuating
loads, mean stress levels, and variable fre-
quencies. Thus, it is important to be able to
predict the life of a component subjected to
variable amplitude loading using data generated
in constant amplitude laboratory tests. Cumula-
tive damage theories consider the fatigue pro-
cess to be one of damage accumulation until the
life of the component is exhausted. Consider the
fatigue life diagram in Fig. 14.13. At a constant
stress, s1, the life is 200 cycles, while at s2, the
life is 400 cycles. According to cumulative
damage theory, fatigue life is gradually exhau-
sted. That is, at points A and C, 100% of the life
is available, while at points B and D, the re-
spective lives are completely exhausted. If fati-
gue damage accumulates in a linear manner,
each cycle contributes the same amount of
damage at a given stress level. For example, at
s1, on cycling the metal from A to E, one-fourth
of the fatigue life is consumed (50 of 200
cycles). If the stress level is reduced to s2, the
percentage of life exhausted at s2 is equivalent
to the percentage of life exhausted at s1. That is,
if one-fourth of the fatigue life is consumed at
s1, the component still will have lost one-fourth
of its life even if the stress is reduced to s2.
For example, at point E, 50 cycles of 200 are
consumed. If, when the component reaches the
number of cycles defined by point E, the stress is
reduced to s2, the component will be in the
condition defined by point F, with 100 of its 400
cycles consumed. The same kind of change can
be described for a low-to-high stress traverse.
Cumulative damage during fatigue is often
determined using the Palmgren-Miner rule,
which assumes that the total life of a part can be
estimated by adding up the percentage of life
consumed by each stress level:
n1
N1
+
n2
N2
+        +
nk
Nk
=1 or
X
j=k
j=1
nj
Nj
=1
(Eq 14.12)
where n1, n2     nk represent the number of
cycles at a specific stress level, and N1,
N2      Nk represent the fatigue life in
cycles at the same stress level.
This rule should be used with caution. It is a
linear relationship that does not consider the
effects of understressing or overstressing.
Understressing, in which relatively low stress
levels are initially applied, can result in longer
fatigue lives at a higher stress level, due to
localized strain hardening. On the other hand,
overstressing, in which high stresses are initially
applied, can result in shorter fatigue lives at a
low stress level, due to damage induced by the
higher stress levels.
Fig. 14.12 Fatigue life in terms of total strain
Fig. 14.13 Cumulative damage during high-to-low loading
sequence. Source: Ref 5
Chapter 14: Fatigue / 251
© 2008 ASM International. All Rights Reserved.
Elements of Metallurgy and Engineering Alloys (#05224G) www.asminternational.org
14.5 Fatigue Crack Nucleation
and Growth
Fatigue cracks almost always initiate at free
surfaces, usually external surfaces but also
internal surfaces if the metal contains defects
such as voids and cracked second-phase parti-
cles. Common external surface defects include
geometric notches and surface roughness.
Fatigue crack nucleation and growth occurs
in the following stages.
Stage I. Crack initiation usually starts at
a notch or other surface discontinuity. Even in
the absence of a surface defect, crack initiation
will eventually occur due to the formation of
persistent slip bands (PSBs), so called because
traces of the bands persist even when the surface
damage is polished away. Slip bands are a result
of the systematic buildup of fine slip movements
on the order of only 1 nm. However, the plastic
strain within the PSB can be as much as 100
times greater than that in the surrounding
material. The back-and-forth movement of the
slip bands leads to the formation of intrusions
and extrusions at the surface, eventually leading
to the formation of a crack (Fig. 14.14). The
initial crack propagates parallel to the slip bands.
The crack propagation rate during stage I is very
low, on the order of 1 nm per cycle, and produces
a practically featureless fracture surface. The
crack initially follows the slip bands at
approximately 45 to the principal stress direc-
tion. When the crack length becomes sufficient
for the stress field at the tip to become dominant,
the overall crack plane changes and becomes
perpendicular to the principal stress, and the
crack enters stage II.
Stage II crack growth occurs when the stage I
crack changes direction and propagates in a
direction normal to the applied stress. Crack
growth proceeds by a continual process of crack
sharpening followed by blunting, as shown in
the Fig. 14.15 illustration. Crack propagation
during crack growth often produces a pattern of
fatigue striations (Fig. 14.16), with each striation
representing one cycle of fatigue. Although
striations are indicative of fatigue, fatigue fail-
ures can occur without the formation of stria-
tions. Striations are microstructural details that
are best examined with a scanning electron
microscope and are not visible to the naked eye.
Frequently, visible examination of a fatigued
surface will reveal a series of concentric mark-
ings on the surface, referred to as beach marks
(Fig. 14.6). These are present as a result of stress
changes during fatigue, for example, the starting
and stopping of a rotating shaft. Each of the
beach marks can contain thousands or even tens
of thousands of fatigue cycles.
Stage III. Ultimate failure occurs when the
fatigue crack becomes long enough that the
remaining cross section can no longer support
the applied load.
14.6 Fatigue Crack Propagation
Linear elastic fracture mechanics assumes
that all structures contain flaws. Cracks grow
from an initial size, ao, to a critical size, ac, cor-
responding to failure as a function of the number
of load cycles (Fig. 14.17). The crack growth
rate, da/dn, can be determined from the slope of
the curve. Initially, the crack growth rate is slow
but increases with increasing crack length. Of
course, the crack growth rate is also higher for
higher applied stresses. If one can characterize
the crack growth, it is then possible to estimate
Fig. 14.14 Development of extrusions and intrusions during fatigue. Source: Ref 4
252 / Elements of Metallurgy and Engineering Alloys
© 2008 ASM International. All Rights Reserved.
Elements of Metallurgy and Engineering Alloys (#05224G) www.asminternational.org
the service life or inspection intervals required
under specific loading conditions and service
environment. In the fracture mechanics ap-
proach to fatigue crack growth, the crack growth
rate, or the amount of crack extension per load-
ing cycle, is correlated with the stress-intensity
parameter, K. This approach makes it possible to
estimate the useful safe lifetime and to establish
inspection intervals. An idealized da/dn versus
DK curve is shown in Fig. 14.18. In region I,
DKth is the fatigue crack growth threshold,
which is at the lower end of the DK range, where
crack growth rates approach zero. In region II,
the crack growth rate is stable and essentially
linear and can be modeled by power law equa-
tions, such as the Paris equation:
da=dn=C(DK)m
(Eq 14.13)
where: a is the flaw or crack size in inches; n is
the number of cycles; C and m are constant
parameters and are related to material variables,
environment, temperature, and fatigue stress
conditions; and DK = DKmax DKmin is the
stress-intensity parameter range. The constants
C and m are material parameters that must be
determined experimentally. Typically, m is in
the range of 2 to 4 for metals and 4 to 100 for
ceramics and polymers.
During stage II growth in the linear crack
growth region, the Paris law can be used to
determine the number of cycles to failure. DK
can be expressed in terms of Ds:
DK=DKmax7DKmin=Ysmax
·
ffiffiffiffiffiffi
pa
p
7Ysmin
ffiffiffiffiffiffi
pa
p
=YDs
ffiffiffiffiffiffi
pa
p
(Eq 14.14)
1
2
3
4
5
6
Striation
Fig. 14.15 Fatigue crack propagation. Source: Ref 6
2 µm
Striation
Fig. 14.16 SEM image showing fatigue striations
Chapter 14: Fatigue / 253
© 2008 ASM International. All Rights Reserved.
Elements of Metallurgy and Engineering Alloys (#05224G) www.asminternational.org
where Y depends on the specific specimen geo-
metry. Thus, the Paris law becomes:
da
dn
=C(YDs
ffiffiffiffiffiffi
pa
p
)m
(Eq 14.15)
One of the goals of fatigue analysis is to be
able to predict the fatigue life of structures. The
fatigue life, n, can be solved for by rearranging
Eq 14.13:
dn=
da
C(DK)m (Eq 14.16)
which may then be integrated to give:
nf=
ð
nf
0
dn=
ð
ac
ao
da
C(DK)m (Eq 14.17)
Substitution of the expression for DK (Eq 14.14)
gives:
nf=
ð
ac
ao
da
C(YDs
ffiffiffiffiffiffi
pa
p
)m=
1
Cp m=2(Ds)m
ð
ac
ao
da
Yma m=2
(Eq 14.18)
It is assumed that Ds (or smax smin) is
constant and that Y depends on the crack length
and therefore cannot be removed from within
the integral. For cases where Y depends on crack
length, these integrations will generally be
performed using numerical techniques. During
stage II crack growth, some metals are sensitive
to the load ratio, R, as shown in Fig. 14.19 for
7075-T651 aluminum plate. Since the Paris
equation does not account for the load ratio,
there are other expressions that do account for
the sensitivity of crack growth rate to the load
ratio. One of the most utilized is the one devel-
oped by Foreman and his associates:
da
dn
=
C(DK)m
(17R)Kc7DK
(Eq 14.19)
In these expressions, it is necessary to deter-
mine the initial crack length, ao, and the final
or critical crack length, ac. Crack lengths can
be detected using a number of nondestructive
testing techniques. If no cracks are detected, it
must be assumed that a crack exists below the
resolution of the detection system being used. A
subcritical crack will eventually grow to a length
at which the metal immediately fails, that is:
Kmax?Kc (Eq 14.20)
or
Ysmax
ffiffiffiffiffiffiffiffi
paf
p
! Kc (Eq 14.21)
Solving for ac gives:
ac=
K2
c
pY2s2
max
(Eq 14.22)
ac
ao
ao
nf
ac
Crack
Length
a
Fatigue Life
da
dn
Inspection Retirement
Number of Cycles
Fig. 14.17 Crack length as a function of cycles. Source:
Ref 5 Fig. 14.18 Crack propagation curve for fatigue loading
254 / Elements of Metallurgy and Engineering Alloys
© 2008 ASM International. All Rights Reserved.
Elements of Metallurgy and Engineering Alloys (#05224G) www.asminternational.org
Note that even if a component contains a
detectable crack, it can remain in service,
provided that it is periodically inspected. This
philosophy forms the basis for what is known as
the damage-tolerance design approach.
Finally, in region III, the crack growth rate
accelerates, since the fracture toughness of the
material is approached, and there is a local ten-
sile overload failure.
14.7 Crack Closure
During fatigue cycling, the crack growth rate
can slow due to crack closure. For example, if the
structure is subjected to a series of high-tensile
overloads that are followed by loads at lower
tensile stress levels, the crack may temporarily
stop propagating, leading to a decrease in the
crack growth rate, da/dn, and consequently have
a longer fatigue life than would normally be
expected. Crack closure mechanisms effectively
reduce the DK during fatigue cycling, thus
retarding the crack growth. Since DK is equal to
Kmax Kmin and the actual DK is reduced be-
cause crack closure is hindered, DK is effectively
smaller, and crack growth rate is then reduced.
Four mechanisms that can cause crack closure
are shown in Fig. 14.20. Plasticity-induced
closure results from compressive residual stres-
ses developing in the plastic wake. Roughness-
induced closure is due to crack meandering, in
which the crack deviates from mode I dis-
placements and is subject to mode II shear dis-
placements. These displacements cause a
mismatch between the upper and lower crack
faces, which results in contact between the crack
faces during cycling. Oxide debris-induced
closure results from corrosion products becom-
ing wedged in the crack interface. Finally, fluid
1 10 (12) 100 (120)
R = 0.1
R = +0.5
R = –0.5
R = σmin/σmax
10–2
10–3
10–4
10–5
10–6
3×10⁻²
3×10⁻³
3×10⁻⁴
3×10⁻⁵
3×10⁻⁶
da
/
dN
(in./cycle)
da
/
dN
(cm/cycle)
Center cracked panels, L-T Direction
7075-T651, 0.6 cm (0.25 in.) Thickness
∆K, ksi·√in. (MPa √m)
Fig. 14.19 Stress ratio effects on an aluminum alloy
Chapter 14: Fatigue / 255
© 2008 ASM International. All Rights Reserved.
Elements of Metallurgy and Engineering Alloys (#05224G) www.asminternational.org
pressure can act as a wedge, preventing total
crack closure.
14.8 Geometrical Stress Concentrations
In most structures, fatigue cracking usually
initiates at a stress concentration. The stress
concentration may by inherent in the design,
such as a fillet, hole, thread, or other geometrical
feature, or the stress concentration can result
from a manufacturing process, such as a rough
surface finish or residual tensile stresses intro-
duced by heat treatment.
The effect of geometrical stress concentra-
tions on fatigue is often studied by testing not-
ched specimens. When a notch is present in a
specimen under uniaxial loading, three effects
are present: (1) there is an increase or con-
centration of stress at the root of the notch, (2)
there is a stress gradient from the notch toward
the center of the specimen, and (3) a triaxial state
of stress exists. The dramatic reduction in
fatigue life of normalized 4340 steel sheet con-
taining different types of stress concentrations is
shown in Fig. 14.21.
The effect of notches on fatigue strength is
determined by comparing the S-N curves of
notched and unnotched specimens. The data for
the notched specimens are usually plotted in
terms of nominal stress based on the net cross
section of the specimen. The effect of the notch
in decreasing the fatigue strength is reported as
the fatigue strength reduction factor, or the
fatigue notch factor, Kf:
Kf=
Fatigue limit unnotched
Fatigue limit notched
(Eq 14.23)
For metals that do not have a definite fatigue
limit, the fatigue notch factor is based on the
fatigue strength at a specified number of cycles.
Values of the fatigue notch factor vary with the
severity of the notch, the type of notch, the
material, the type of loading, and the applied
stress level.
Plasticity-Induced Closure Roughness-Induced Closure
Mode II Displacement
Oxide-Induced Closure Fluid-Induced Closure
Corrosion Product
Fluid
Fig. 14.20 Fatigue crack closure mechanisms in metals. Source: Ref 7
256 / Elements of Metallurgy and Engineering Alloys
© 2008 ASM International. All Rights Reserved.
Elements of Metallurgy and Engineering Alloys (#05224G) www.asminternational.org
Notched fatigue data are also reported using a
notch sensitivity factor, q:
q=
Kf71
Kt71
(Eq 14.24)
This relationship compares the theoretical
stress-concentration factor, Kt, to the fatigue
notch factor, Kf. In this relationship, a material
that experiences no reduction in fatigue due to a
notch will have a notch sensitivity factor of
q = 0, while one that experiences a reduction in
fatigue up to the full theoretical value will have a
notch sensitivity factor of q = 1. The value of q
is dependent on the material and the radius
of the notch root, as illustrated by the plots
shown in Fig. 14.22 for steels. The notch sensi-
tivity factor, q, significantly decreases with
smaller notch radii. Although this seems coun-
terintuitive, it occurs because Kf increases more
slowly than Kt with decreasing notch radius.
For notches with large radii, Kf is almost equal
to Kt. For materials with small notches, Kf is
less than Kt. In addition, lower-strength metals
are less affected than high-strength metals by
geometric discontinuities that reduce the fatigue
resistance, because high-strength metals have a
limited capacity for deformation and crack tip
blunting.
14.9 Manufacturing Stress
Concentrations
Because almost all fatigue failures start on a
surface, the surface finish and residual-stress
state near the surface can have a profound effect
on the fatigue strength. Since the early days
of fatigue investigations, it was recognized
that the fatigue life of a component is very
dependent on the surface finish produced by
machining or grinding operations. As shown
in Fig. 14.23, highly polished steel specimens
perform much better in fatigue than even care-
fully machined surfaces. Further degradation
in fatigue strength occurs for hot rolled and
forged surfaces. Finally, when corrosion is
introduced, the fatigue life can be seriously
degraded.
Parts that are formed at room temperature will
contain residual stresses. For example, the sur-
face of a part that was formed in tension will
contain residual compressive stresses, and a
surface that was in compression during forming
will contain residual tensile stresses. Since fati-
gue always occurs under tensile loading, the
surface with the residual tensile stresses will be
the most prone to fatigue cracking. Similar to
forming, some quenching operations during heat
treatment can result in a tensile residual-stress
pattern on the surface that will adversely affect
fatigue strength.
The fatigue data shown in Table 14.1 for 4340
steel forgings tested in fully reversed bending
illustrate two important points. First, vacuum
melting, which removes inclusions, improves
both the longitudinal and transverse endurance
limits. Second, since forging tends to elongate
inclusions in the longitudinal or working direc-
tion, the fatigue endurance limit is higher in the
longitudinal direction. The lower transverse
endurance limit in steels containing inclusions is
attributed to stress concentrations at the inclu-
sions, which can be quite high when an elon-
gated stringer is oriented transverse to the tensile
stress. For the case of the vacuum-melted steel,
the transverse limit is still somewhat lower than
Unnotched
Hole, Kt = 2
Fillet, Kt = 4
Edge Notch, Kt = 4
104 105 106 107 108 109
0
20
40
60
80
100
200
300
400
500
Cycles to Failure
Stress
Amplitude
(ksi)
Stress
Amplitude
(MPa)
4340 Steel Normalized
Fig. 14.21 Effect of geometrical stress concentrations on
fatigue life. Source: Ref 8
Fig. 14.22 Notch sensitivity versus notch radius for steels.
Source: Ref 9
Chapter 14: Fatigue / 257
© 2008 ASM International. All Rights Reserved.
Elements of Metallurgy and Engineering Alloys (#05224G) www.asminternational.org
for the longitudinal direction, indicating the
extreme sensitivity of transverse fatigue prop-
erties to microstructure.
Due to their extreme strength and hardness,
high-strength steels are often finished by grind-
ing to provide precise dimensions, remove any
nicks or scratches, and provide smooth surfaces.
However, great care must be taken when
grinding these ultrahigh-strength steels. Impro-
per or abusive grinding can result in grinding
burns, in which the surface is heated above the
austenitizing temperature and the austenite
formed converts to untempered martensite on
cooling (Fig. 14.24). This untempered marten-
sitic surface layer is brittle and susceptible to
forming a network of fine cracks that can reduce
the fatigue strength by as much as 30%. Even if
the grinding temperature is not high enough to
produce austenite, it may cause the original
tempered martensite microstructure on the sur-
face to become overtempered, thereby reducing
the strength and hardness.
14.10 Environmental Effects
Corrosion Fatigue. The simultaneous action
of fatigue and corrosive attack is known as
corrosion fatigue. In the absence of fatigue
loading, corrosive attack can often cause pitting
of a metal surface. These pits can then act as
stress concentrations that will initiate fatigue
cracking. When corrosion and fatigue occur
simultaneously, the chemical attack greatly
accelerates fatigue crack growth. Materials such
as steels, which show a definite endurance limit
when tested in air, do not exhibit a definite
endurance limit when tested in a corrosive
environment (Fig. 14.25). Frequently, fatigue
will corrupt the protective films that would
normally slow the corrosive attack, allowing
continued and accelerated attack. Since corro-
sion is time dependent, slow cycling rates will
result in greater life reductions than accelerated
fatigue cycling. Another possible effect of a
corrosive environment on fatigue life is the
0.1
100 140 180 220
500
Ultimate Tensile Stress (MPa)
1000 1500
260
0
60
0.2
0.3
0.4
0.5
0.6
0.7
0.8
0.9
1.0
Ultimate Tensile Strength (ksi)
Surface
Retention
Factor
Mirror Polished
Fine Ground or
Commercially Polished
Machined
Hot Rolled
As-Forged
Corroded in
Tap Water
Corroded in Salt Water
Fig. 14.23 Effect of surface finish on fatigue of steels. Source: Ref 10
258 / Elements of Metallurgy and Engineering Alloys
© 2008 ASM International. All Rights Reserved.
Elements of Metallurgy and Engineering Alloys (#05224G) www.asminternational.org
absence of the stable stage II crack growth
that occurs according to the Paris law. A
reduction in fatigue life of 50% or more is not
unusual.
There are a number of methods used to com-
bat corrosion fatigue. First, the choice of a
material for an aggressive environment should
probably be based on its corrosion resistance
rather than its fatigue properties. For example,
stainless steel, bronze, or beryllium-copper
would probably yield better service than heat
treated steels. Corrosion-resistant coatings that
isolate the surface from the environment are
successful as long as the coating does not rupture
during cycling. Zinc and cadmium coatings on
steel and aluminum alclad coatings on alumi-
num generally produce better fatigue lives in
aggressive environments, even though the
coatings may reduce fatigue lives somewhat
when tests are conducted in air. The introduction
of surface compressive residual-stress patterns
by shot peening or nitriding can be very useful.
Low-Temperature Fatigue. Fatigue life
normally increases with decreasing tempera-
tures. Although steels become more notch
sensitive at low temperatures, there is no
experimental evidence indicating that any sud-
den change in fatigue properties occurs at tem-
peratures below the ductile-to-brittle transition
temperature.
High-Temperature Fatigue. In general, the
fatigue strength of metals decreases with in-
creasing temperatures. An exception is mild
steel, which exhibits a maximum in fatigue
strength between 205 and 300 C (400 and
575 F) due to strain aging. As the temperature
exceeds approximately half the melting point,
Tm, creep can become the dominant cause of
failure. Ferrous alloys, which usually exhibit
an endurance limit at room temperature, will
no longer have an endurance limit when the
temperature exceeds approximately 425 C
(800 F). In general, the higher the creep
strength of an alloy, the higher will be its high-
temperature fatigue strength. However, there are
conflicting requirements, with fine grain sizes
being beneficial to fatigue properties, while
coarse grain sizes are preferred in certain creep
regimes. In addition, the beneficial effects
of fatigue improvement processes such as shot
peening, which are effective at room tempera-
ture, may be annealed out at elevated tempera-
tures.
Table 14.1 Effect of inclusions in 4340 forged
steel
Property
Electric furnace
melted
Vacuum
melted
Longitudinal fatigue limit MPa (ksi) 800 (116) 960 (139)
Transverse fatigue limit MPa (ksi) 545 (79) 830 (120)
Ratio transverse/longitudinal 0.68 0.86
Hardness (HRC) 27 29
Source: Ref 11
Fig. 14.24 Effects of grinding burns (untempered marten-
site) on high-strength steel. Source: Ref 12
Chapter 14: Fatigue / 259
© 2008 ASM International. All Rights Reserved.
Elements of Metallurgy and Engineering Alloys (#05224G) www.asminternational.org
Thermal Fatigue. Thermal stresses result
when dimensional changes in response to tem-
perature changes are restricted by some type of
constraint imposed on the component. For the
case of a simple bar constrained rigidly at both
ends, the thermal stress, s, developed by a
temperature change, DT, is:
s=aEDT (Eq 14.25)
where a is the linear coefficient of thermal ex-
pansion, and E is the modulus of elasticity.
If failure occurs during one cycle of thermal
stress because of a rapid temperature change, the
phenomenon is known as thermal shock, while
failures occurring after multiple thermal stress
cycles caused by a cyclic temperature change are
referred to as thermal fatigue. An example of
thermal fatigue occurs in ceramic thermal bar-
rier coatings that are applied to nickel-base
superalloys used in jet engines. The large dif-
ferences in the coefficients of thermal expansion
of the ceramic coating and the underlying nickel
blade result in cracking and spalling of the
coating. Another example of thermal fatigue
occurs in electronics. Heat generated during
operation of electronic devices can cause fatigue
of the soldered joints.
The tendency for thermal fatigue has been
related to the parameter:
sfk=Ea (Eq 14.26)
where sf is the mean fatigue strength, and k is the
thermal conductivity. A high value of this
parameter indicates good resistance to thermal
fatigue.
14.11 Fatigue Life Improvement
One of the most effective methods of
improving fatigue life is to induce residual
compressive stresses on the surface of the part.
This is often accomplished by shot peening or by
surface rolling with contoured rollers. Shot
peening involves propelling fine steel or cast
iron shot into the surface at high velocities. The
severity of the stress produced by shot peening is
monitored by measuring the residual deforma-
tion of shot-peened specimens called Almen
strips. In addition to inducing compressive stress
on the surface, the surface layers are also
strengthened by the cold working that occurs
during shot peening. Important variables in shot
peening include the hardness of the shot, the
size, the shape, and the velocity. Shot peening
must be carefully controlled so as not to intro-
duce surface damage to the part. Shot peening
Fig. 14.25 Effect of corrosion on fatigue performance
Fatigue Technology, Inc.
Zone of compressive residual
stress extends one radius from
edge of hole
Surface surrounding hole is
yielded beyond elastic limit
Tension zone beyond
compression zone
Fig. 14.26 Residual-stress state around cold-worked hole
260 / Elements of Metallurgy and Engineering Alloys
© 2008 ASM International. All Rights Reserved.
Elements of Metallurgy and Engineering Alloys (#05224G) www.asminternational.org
imparts greater fatigue life during high-cycle
fatigue than it does for higher-stress low-cycle
fatigue. In low-cycle fatigue, large stresses in
the plastic range cause “fading” of the residual-
stress pattern.
Steel parts subjected to wear conditions are
often carburized or nitrided to harden the surface
for greater wear resistance. Since both of these
processes also introduce residual compressive
stresses on the surface, there is an improvement
in fatigue life. The greatest improvement occurs
where a high stress gradient occurs, as in bend-
ing or torsion, with less improvement in axial
loading. Nitriding is extremely effective in
improving the fatigue strength of notched spec-
imens. Other surface-hardening methods, such
as flame or induction hardening, produce similar
effects. Case hardening is more effective for
components that have a stress gradient, as in
bending, or where there is a notch. For axially
loaded components, fatigue cracks can form
under the case in the softer, weaker core at the
boundary between the surface and bulk.
Many large structures are assembled with
mechanical fasteners. In the aerospace industry,
fatigue life improvement of aluminum structures
is often accomplished with cold working of
fastener holes and/or installing interference fit
fasteners. Since fatigue cracks often initiate at
fastener holes in metallic structures, methods
such as cold working fastener holes and
interference fit fasteners have been developed
to improve fatigue life. Both cold working and
interference fit fasteners set up residual com-
pressive stress fields in the metal immediately
adjacent to the hole (Fig. 14.26). The applied
tension stress during fatigue loading must then
overcome the residual compressive stress field
before the hole becomes loaded in tension. The
fatigue improvement due to cold working in
2024-T851 aluminum is shown in Fig. 14.27.
Cold working of holes is usually conducted
using either the split-sleeve or split-mandrel
method. Both methods involve pulling a man-
drel through the hole that expands the hole dia-
meter, creating plastic deformation of material
around the hole and a resulting residual com-
pressive stress field. The residual-stress field,
depending on the material and the amount of
expansion, will extend approximately one radius
from the edge of the hole. In the split-sleeve
process (Fig. 14.28), a stainless steel split sleeve
is placed over a tapered mandrel and inserted
into the hole. The hole is cold worked when the
largest part of the mandrel is drawn back through
the sleeve. After cold working, the sleeve is
removed and discarded. In the split-mandrel
process, a collapsible mandrel is placed in the
20
25
30
35
40
45
150
200
250
300
Metal With
No Hole
Cold Worked
Open Hole
Tight Fit Fastener in
Cold Worked Hole
Reamed
Open Hole
Tight Fit Fastener in
Reamed Hole
104 105 106 107
Cycles to Failure
Maximum
Net
Stress
(ksi)
Maximum
Net
Stress
(MPa)
2024-T851 Al
Fig. 14.27 Fatigue life improvement with cold working. Source: Ref 13
Chapter 14: Fatigue / 261
© 2008 ASM International. All Rights Reserved.
Elements of Metallurgy and Engineering Alloys (#05224G) www.asminternational.org
hole, and as the mandrel is withdrawn, it
expands to cold work the hole.
Interference fit fasteners can also be used in
metallic structures to improve fatigue life. When
an interference fit fastener is installed in metal, it
also plastically deforms a small zone around the
hole, setting up a compressive stress field, which
again is beneficial when fatigue loading is pri-
marily tensile. The amount of interference can
vary, depending on structural requirements, but
it is usually in the range of 0.07 to 0.10 mm
(0.003 to 0.004 in.). In some highly loaded holes,
both cold working and interference fit fasteners
are used. While cold working and the use of
interference fit fasteners are proven methods of
improving fatigue resistance, both increase
assembly costs and should only be specified
when they are really needed.
Castings can be hot isostatic pressed (HIP) to
help reduce internal porosity. The HIP of alu-
minum castings is usually conducted using
argon pressure at 105 MPa (15 ksi) and tem-
peratures in the range of 480 to 525 C (900 to
980 F). The use of HIP usually results in
improved mechanical properties, especially
fatigue strength, but, of course, it adds to the cost
and cycle time. The improvement in fatigue life
for the aluminum casting alloy A201.0-T7 as a
result of HIP is shown in Fig. 14.29.
14.12 Fatigue Design Methodologies
Since the 1800s, a number of design philo-
sophies or methodologies have evolved to deal
with design against fatigue failures.
Infinite-Life Design. This is the oldest of the
design philosophies and is based on maintaining
the stresses at some fraction below the fatigue
strength of the metal. The initial material is
assumed to be free of flaws. This methodology is
based on the classic S-N curve. It is most
Fig. 14.28 Split-sleeve cold working process. Reprinted with permission from SAE Paper # 982145 # 1998 SAE International.
Source: Ref 14
262 / Elements of Metallurgy and Engineering Alloys
© 2008 ASM International. All Rights Reserved.
Elements of Metallurgy and Engineering Alloys (#05224G) www.asminternational.org
applicable when the component is only stressed
in the elastic range and displays a distinct
endurance limit, such as for steels. Although it
has largely been superseded by later methodol-
ogies, it is simple to use and can be useful
where periodic inspection is either impractical
or not warranted. However, since it is a con-
servative methodology, it usually results in a
heavier design than some of the later meth-
odologies.
Safe-life design is based on the assumption
that the part is initially flaw-free and has a fine
life in which to develop a critical crack size. Like
the infinite-life methodology, safe-life assumes
an initial flaw-free component. This methodol-
ogy was developed to account for parts that were
subjected to higher loads that produced plastic
strains. Under these conditions, the description
of local events in terms of strain made more
sense and resulted in the development of
assessment techniques that used strain as a
determining quantity, that is, log strain (e) ver-
sus log number of cycles (N). The failure cri-
terion is usually the detection of a small crack or
some equivalent measure related to a substantial
change in load-deflection response, although
failure may also be defined as fracture.
Fail-Safe Design. The fail-safe design phi-
losophy assumes that fatigue cracks will
be detected and repaired before they lead to
failure. This methodology was developed in
the aircraft industry where large safety margins
were weight-prohibitive. Fail-safe designs
incorporate multiple load paths and crack
stoppers in the structure. In other words, if a
primary load path fails, the load will be picked
up by an alternate load path to prevent the struc-
ture from failing. A major part of this metho-
dology is rigid certification criteria along with
the capability to detect and inspect cracks.
Damage-tolerant design is the latest design
methodology and is an extension of fail-safe
design. The refinement of the damage-tolerant
methodology is the assumption that structures
do contain cracks and that fracture mechanics
approaches can be used to determine crack
growth rates. If the crack growth rate can be cal-
culated, it is then possible to inspect the structure
at various intervals and either repair or retire it
prior to the crack reaching critical dimensions.
Although much progress has been made in the
design against fatigue failures, they still occur
with disturbing frequency. For any design, it is
imperative that part or component testing be
conducted prior to placing the part in service. In
addition, it is important that the test conditions
are representative of the actual environment that
the component will experience in service.
REFERENCES
1. Fatigue Failures, Failure Analysis and
Prevention, Vol 11, ASM Handbook, ASM
International, 2002
Fig. 14.29 Effect of hot isostatic pressing (HIP) on fatigue life of A201.0-T7 aluminum casting. Source: Ref 15
Chapter 14: Fatigue / 263
© 2008 ASM International. All Rights Reserved.
Elements of Metallurgy and Engineering Alloys (#05224G) www.asminternational.org
2. S. Kalpakjian, Manufacturing Engineering
and Technology, 3rd ed. Addison-Wesley
Publishing Co., 1995
3. Properties and Selection of Metals, Vol 1,
Metals Handbook, 8th ed., American
Society for Metals, 1961
4. R.A. Higgins, Engineering Metallurgy—
Applied Physical Metallurgy, 6th ed.,
Arnold, 1993
5. M.A. Meyers and K.K. Chawla, Mechanical
Metallurgy—Principles and Applications,
Prentice-Hall Inc., 1984
6. C.M. Laird, STP 415, American Society for
Testing and Materials, 1966, p 130
7. T.L. Anderson, Fracture Mechanics: Fun-
damentals and Applications, 3rd ed., Taylor
 Francis, 2005
8. J. Collins and S. Daniewicz, Failure
Considerations, Mechanical Engineers
Handbook, John Wiley  Sons, Inc.,
1998
9. M.R. Mitchell, Fundamentals of Modern
Fatigue Analysis for Design, Fatigue and
Fracture, Vol 19, ASM Handbook, ASM
International, 1996
10. R.C. Juvinall, Stress, Strain, and Strength,
McGraw-Hill Book Co., 1967
11. G.E. Dieter, Mechanical Metallurgy,
3rd ed., McGraw-Hill Book Co., 1986,
p. 375–431
12. G.E. Toten, et al., Factors Relating to Heat
Treating Operations, Failure Analysis and
Prevention, Vol 11, ASM Handbook, ASM
International, 2002
13. F.C. Campbell, Manufacturing Technology
for Aerospace Structural Materials, Else-
vier Scientific, 2006
14. A. Leon, “Developments in Advanced
Coldworking,” SAE 982145, Society of
Automotive Engineers, 1998
15. J.R. Davis, ASM Specialty Handbook:
Aluminum and Aluminum Alloys, ASM
International, 1993
SELECTED REFERENCES
 M.F. Ashby and D.R.H. Jones, Engineering
Materials 1 — An Introduction to Their
Properties and Applications, 2nd ed., But-
terworth Heinemann, 1996
 T.H. Courtney, Mechanical Behavior of
Materials, 2nd ed., McGraw-Hill Book Co.,
2000, p 566–629
 H.W. Hayden, W.G. Moffatt, and J. Wulf,
The Structure and Properties of Materials,
Vol III, John Wiley, 1965
 M.P. Kaplan and T.A. Wolff, Fatigue-Life
Assessment, Failure Analysis and Preven-
tion, Vol 11, ASM Handbook, ASM Inter-
national, 2002
 E. Krempl, Design for Fatigue Resistance,
Materials Selection and Design, Vol 20,
ASM Handbook, ASM International, 1997
 R.A. Lund and S. Sheybany, Fatigue Frac-
ture Appearances, Failure Analysis and
Prevention, Vol 11, ASM Handbook, ASM
International, 2002
264 / Elements of Metallurgy and Engineering Alloys
© 2008 ASM International. All Rights Reserved.
Elements of Metallurgy and Engineering Alloys (#05224G) www.asminternational.org
ASM International is the society for materials
engineers and scientists, a worldwide network
dedicated to advancing industry, technology, and
applications of metals and materials.
ASM International, Materials Park, Ohio, USA
www.asminternational.org
This publication is copyright © ASM International®
. All rights reserved.
Publication title Product code
Elements of Metallurgy and Engineering Alloys 05224G
To order products from ASM International:
Online Visit www.asminternational.org/bookstore
Telephone 1-800-336-5152 (US) or 1-440-338-5151 (Outside US)
Fax 1-440-338-4634
Mail
Customer Service, ASM International
9639 Kinsman Rd, Materials Park, Ohio 44073-0002, USA
Email CustomerService@asminternational.org
In Europe
American Technical Publishers Ltd.
27-29 Knowl Piece, Wilbury Way, Hitchin Hertfordshire SG4 0SX,
United Kingdom
Telephone: 01462 437933 (account holders), 01462 431525 (credit card)
www.ameritech.co.uk
In Japan
Neutrino Inc.
Takahashi Bldg., 44-3 Fuda 1-chome, Chofu-Shi, Tokyo 182 Japan
Telephone: 81 (0) 424 84 5550
Terms of Use. This publication is being made available in PDF format as a benefit to members and
customers of ASM International. You may download and print a copy of this publication for your
personal use only. Other use and distribution is prohibited without the express written permission of
ASM International.
No warranties, express or implied, including, without limitation, warranties of merchantability or
fitness for a particular purpose, are given in connection with this publication. Although this
information is believed to be accurate by ASM, ASM cannot guarantee that favorable results will be
obtained from the use of this publication alone. This publication is intended for use by persons having
technical skill, at their sole discretion and risk. Since the conditions of product or material use are
outside of ASM's control, ASM assumes no liability or obligation in connection with any use of this
information. As with any material, evaluation of the material under end-use conditions prior to
specification is essential. Therefore, specific testing under actual conditions is recommended.
Nothing contained in this publication shall be construed as a grant of any right of manufacture, sale,
use, or reproduction, in connection with any method, process, apparatus, product, composition, or
system, whether or not covered by letters patent, copyright, or trademark, and nothing contained in this
publication shall be construed as a defense against any alleged infringement of letters patent,
copyright, or trademark, or as a defense against liability for such infringement.

More Related Content

Similar to FATIGUE.pdf

Fluctuating loads notes
Fluctuating loads notesFluctuating loads notes
Fluctuating loads notes
manoj kininge
 
CHAPTER 1.ppt
CHAPTER 1.pptCHAPTER 1.ppt
CHAPTER 1.ppt
Jani Jai
 
Chap02-A.pdf
Chap02-A.pdfChap02-A.pdf
Chap02-A.pdf
JeancarlosPatalasanc
 
TALAT Lecture 1253: Creep
TALAT Lecture 1253: CreepTALAT Lecture 1253: Creep
TALAT Lecture 1253: Creep
CORE-Materials
 
Fatigue Life Prediction of Leaf Spring used in the Suspension System of Light...
Fatigue Life Prediction of Leaf Spring used in the Suspension System of Light...Fatigue Life Prediction of Leaf Spring used in the Suspension System of Light...
Fatigue Life Prediction of Leaf Spring used in the Suspension System of Light...
ijtsrd
 
Mechanical properties
Mechanical propertiesMechanical properties
Mechanical properties
Yatin Singh
 
Unit 3 Design of Fluctuating Loads
Unit 3 Design of Fluctuating LoadsUnit 3 Design of Fluctuating Loads
Unit 3 Design of Fluctuating Loads
Mahesh Shinde
 
STRENGTH OF REINFORCED CONCRETE CORBELS – A PARAMETRIC STUDY
STRENGTH OF REINFORCED CONCRETE CORBELS – A PARAMETRIC STUDYSTRENGTH OF REINFORCED CONCRETE CORBELS – A PARAMETRIC STUDY
STRENGTH OF REINFORCED CONCRETE CORBELS – A PARAMETRIC STUDY
ALI KIFAH KADHUM
 
STRENGTH OF REINFORCED CONCRETE CORBELS – A PARAMETRIC STUDY
STRENGTH OF REINFORCED CONCRETE CORBELS – A PARAMETRIC STUDYSTRENGTH OF REINFORCED CONCRETE CORBELS – A PARAMETRIC STUDY
STRENGTH OF REINFORCED CONCRETE CORBELS – A PARAMETRIC STUDY
IAEME Publication
 
5-Bending.pdf
5-Bending.pdf5-Bending.pdf
5-Bending.pdf
ssuserf48c97
 
Finite Element Analysis of Mercury III Hyperloop Scale Model Pod Frame
Finite Element Analysis of Mercury III Hyperloop Scale Model Pod FrameFinite Element Analysis of Mercury III Hyperloop Scale Model Pod Frame
Finite Element Analysis of Mercury III Hyperloop Scale Model Pod FrameWilliam Steppe
 
Prediction Models for Sliding Wear of AA3003/Al2O3 Composites
Prediction Models for Sliding Wear of AA3003/Al2O3 CompositesPrediction Models for Sliding Wear of AA3003/Al2O3 Composites
Prediction Models for Sliding Wear of AA3003/Al2O3 Composites
IJERA Editor
 
DESIGN AGAINST FLUCTUATING LOAD
DESIGN AGAINST FLUCTUATING LOADDESIGN AGAINST FLUCTUATING LOAD
DESIGN AGAINST FLUCTUATING LOAD
Priyank Gandhi
 
A simulation study of stress induced in pressure vessels during plate rolling...
A simulation study of stress induced in pressure vessels during plate rolling...A simulation study of stress induced in pressure vessels during plate rolling...
A simulation study of stress induced in pressure vessels during plate rolling...
IRJET Journal
 
Slip Line Field Method
Slip Line Field MethodSlip Line Field Method
Slip Line Field Method
Santosh Verma
 
Fatigue Life Prediction of Aluminum Alloy welding spot based on the workbench
Fatigue Life Prediction of Aluminum Alloy welding spot based on the workbenchFatigue Life Prediction of Aluminum Alloy welding spot based on the workbench
Fatigue Life Prediction of Aluminum Alloy welding spot based on the workbench
IJRES Journal
 
Thesis - Design a Planar Simple Shear Test for Characterizing Large Strange B...
Thesis - Design a Planar Simple Shear Test for Characterizing Large Strange B...Thesis - Design a Planar Simple Shear Test for Characterizing Large Strange B...
Thesis - Design a Planar Simple Shear Test for Characterizing Large Strange B...Marshal Fulford
 
C04702028039
C04702028039C04702028039
C04702028039
ijceronline
 
Metal fatigue ppt
Metal fatigue pptMetal fatigue ppt
Metal fatigue ppt
Flt Lt Dinesh Gupta
 
Tensile
TensileTensile
Tensile
Ammour Omrane
 

Similar to FATIGUE.pdf (20)

Fluctuating loads notes
Fluctuating loads notesFluctuating loads notes
Fluctuating loads notes
 
CHAPTER 1.ppt
CHAPTER 1.pptCHAPTER 1.ppt
CHAPTER 1.ppt
 
Chap02-A.pdf
Chap02-A.pdfChap02-A.pdf
Chap02-A.pdf
 
TALAT Lecture 1253: Creep
TALAT Lecture 1253: CreepTALAT Lecture 1253: Creep
TALAT Lecture 1253: Creep
 
Fatigue Life Prediction of Leaf Spring used in the Suspension System of Light...
Fatigue Life Prediction of Leaf Spring used in the Suspension System of Light...Fatigue Life Prediction of Leaf Spring used in the Suspension System of Light...
Fatigue Life Prediction of Leaf Spring used in the Suspension System of Light...
 
Mechanical properties
Mechanical propertiesMechanical properties
Mechanical properties
 
Unit 3 Design of Fluctuating Loads
Unit 3 Design of Fluctuating LoadsUnit 3 Design of Fluctuating Loads
Unit 3 Design of Fluctuating Loads
 
STRENGTH OF REINFORCED CONCRETE CORBELS – A PARAMETRIC STUDY
STRENGTH OF REINFORCED CONCRETE CORBELS – A PARAMETRIC STUDYSTRENGTH OF REINFORCED CONCRETE CORBELS – A PARAMETRIC STUDY
STRENGTH OF REINFORCED CONCRETE CORBELS – A PARAMETRIC STUDY
 
STRENGTH OF REINFORCED CONCRETE CORBELS – A PARAMETRIC STUDY
STRENGTH OF REINFORCED CONCRETE CORBELS – A PARAMETRIC STUDYSTRENGTH OF REINFORCED CONCRETE CORBELS – A PARAMETRIC STUDY
STRENGTH OF REINFORCED CONCRETE CORBELS – A PARAMETRIC STUDY
 
5-Bending.pdf
5-Bending.pdf5-Bending.pdf
5-Bending.pdf
 
Finite Element Analysis of Mercury III Hyperloop Scale Model Pod Frame
Finite Element Analysis of Mercury III Hyperloop Scale Model Pod FrameFinite Element Analysis of Mercury III Hyperloop Scale Model Pod Frame
Finite Element Analysis of Mercury III Hyperloop Scale Model Pod Frame
 
Prediction Models for Sliding Wear of AA3003/Al2O3 Composites
Prediction Models for Sliding Wear of AA3003/Al2O3 CompositesPrediction Models for Sliding Wear of AA3003/Al2O3 Composites
Prediction Models for Sliding Wear of AA3003/Al2O3 Composites
 
DESIGN AGAINST FLUCTUATING LOAD
DESIGN AGAINST FLUCTUATING LOADDESIGN AGAINST FLUCTUATING LOAD
DESIGN AGAINST FLUCTUATING LOAD
 
A simulation study of stress induced in pressure vessels during plate rolling...
A simulation study of stress induced in pressure vessels during plate rolling...A simulation study of stress induced in pressure vessels during plate rolling...
A simulation study of stress induced in pressure vessels during plate rolling...
 
Slip Line Field Method
Slip Line Field MethodSlip Line Field Method
Slip Line Field Method
 
Fatigue Life Prediction of Aluminum Alloy welding spot based on the workbench
Fatigue Life Prediction of Aluminum Alloy welding spot based on the workbenchFatigue Life Prediction of Aluminum Alloy welding spot based on the workbench
Fatigue Life Prediction of Aluminum Alloy welding spot based on the workbench
 
Thesis - Design a Planar Simple Shear Test for Characterizing Large Strange B...
Thesis - Design a Planar Simple Shear Test for Characterizing Large Strange B...Thesis - Design a Planar Simple Shear Test for Characterizing Large Strange B...
Thesis - Design a Planar Simple Shear Test for Characterizing Large Strange B...
 
C04702028039
C04702028039C04702028039
C04702028039
 
Metal fatigue ppt
Metal fatigue pptMetal fatigue ppt
Metal fatigue ppt
 
Tensile
TensileTensile
Tensile
 

More from sudhakargeruganti

postive practices to prevent psychological illness.docx
postive practices to prevent psychological illness.docxpostive practices to prevent psychological illness.docx
postive practices to prevent psychological illness.docx
sudhakargeruganti
 
postive practices to prevent psychological illness in adulthood.docx
postive practices to prevent psychological illness in adulthood.docxpostive practices to prevent psychological illness in adulthood.docx
postive practices to prevent psychological illness in adulthood.docx
sudhakargeruganti
 
NOVEL RENAL THERAPY PROMISES TO CONTROL BP.docx
NOVEL RENAL THERAPY PROMISES TO CONTROL BP.docxNOVEL RENAL THERAPY PROMISES TO CONTROL BP.docx
NOVEL RENAL THERAPY PROMISES TO CONTROL BP.docx
sudhakargeruganti
 
CUTTING-EDGE INNOVATION TO REVEAL INNER DANGERS.docx
CUTTING-EDGE INNOVATION TO REVEAL INNER DANGERS.docxCUTTING-EDGE INNOVATION TO REVEAL INNER DANGERS.docx
CUTTING-EDGE INNOVATION TO REVEAL INNER DANGERS.docx
sudhakargeruganti
 
TAKING CARE OF LIVER,HEART,KIDNEY.docx
TAKING CARE OF LIVER,HEART,KIDNEY.docxTAKING CARE OF LIVER,HEART,KIDNEY.docx
TAKING CARE OF LIVER,HEART,KIDNEY.docx
sudhakargeruganti
 
AI HELPS PARALYSED MAN TO WALK NATURALLY.pdf
AI HELPS PARALYSED MAN TO WALK NATURALLY.pdfAI HELPS PARALYSED MAN TO WALK NATURALLY.pdf
AI HELPS PARALYSED MAN TO WALK NATURALLY.pdf
sudhakargeruganti
 
JOMINY END-QUENCH HARDENABILITY TEST.docx
JOMINY END-QUENCH HARDENABILITY TEST.docxJOMINY END-QUENCH HARDENABILITY TEST.docx
JOMINY END-QUENCH HARDENABILITY TEST.docx
sudhakargeruganti
 
DISPERSION STRENGTHING AND AGING PHENOMENON.docx
DISPERSION STRENGTHING AND AGING PHENOMENON.docxDISPERSION STRENGTHING AND AGING PHENOMENON.docx
DISPERSION STRENGTHING AND AGING PHENOMENON.docx
sudhakargeruganti
 
STRUCTURE OF GRAIN BOUNDARIES LOW AND HIGH ANGLE BOUNDARIES.docx
STRUCTURE OF GRAIN BOUNDARIES LOW AND HIGH ANGLE  BOUNDARIES.docxSTRUCTURE OF GRAIN BOUNDARIES LOW AND HIGH ANGLE  BOUNDARIES.docx
STRUCTURE OF GRAIN BOUNDARIES LOW AND HIGH ANGLE BOUNDARIES.docx
sudhakargeruganti
 
THREE BASIC ORIENTATION RELATIONSHIPS IN LATTICES OF IRON.docx
THREE BASIC ORIENTATION RELATIONSHIPS IN LATTICES OF IRON.docxTHREE BASIC ORIENTATION RELATIONSHIPS IN LATTICES OF IRON.docx
THREE BASIC ORIENTATION RELATIONSHIPS IN LATTICES OF IRON.docx
sudhakargeruganti
 
DIMENSION OF PEARLITE COLONY AND SPHERIODISATION ON STRENGTH OF PEARLITE.docx
DIMENSION OF PEARLITE COLONY AND SPHERIODISATION ON STRENGTH OF PEARLITE.docxDIMENSION OF PEARLITE COLONY AND SPHERIODISATION ON STRENGTH OF PEARLITE.docx
DIMENSION OF PEARLITE COLONY AND SPHERIODISATION ON STRENGTH OF PEARLITE.docx
sudhakargeruganti
 
HEATING AND COOLING CURVES OF PURE IRON.docx
HEATING AND COOLING CURVES OF PURE IRON.docxHEATING AND COOLING CURVES OF PURE IRON.docx
HEATING AND COOLING CURVES OF PURE IRON.docx
sudhakargeruganti
 
MODELLING OF PHASE TRANSFORMATIONS IN STEEL IN RESPONSE TO THERMO-MECHANICAL...
MODELLING OF PHASE TRANSFORMATIONS IN  STEEL IN RESPONSE TO THERMO-MECHANICAL...MODELLING OF PHASE TRANSFORMATIONS IN  STEEL IN RESPONSE TO THERMO-MECHANICAL...
MODELLING OF PHASE TRANSFORMATIONS IN STEEL IN RESPONSE TO THERMO-MECHANICAL...
sudhakargeruganti
 
KINETICS OF MARTENSITIC TRANSFORMATION.docx
KINETICS OF MARTENSITIC TRANSFORMATION.docxKINETICS OF MARTENSITIC TRANSFORMATION.docx
KINETICS OF MARTENSITIC TRANSFORMATION.docx
sudhakargeruganti
 
TWINNED AND SLIPPED MARTENSITE ; C to A RATIO.docx
TWINNED AND SLIPPED MARTENSITE ; C to A RATIO.docxTWINNED AND SLIPPED MARTENSITE ; C to A RATIO.docx
TWINNED AND SLIPPED MARTENSITE ; C to A RATIO.docx
sudhakargeruganti
 
STEELS,ALLOYING ELEMENTS,CLASSIFICATION.docx
STEELS,ALLOYING ELEMENTS,CLASSIFICATION.docxSTEELS,ALLOYING ELEMENTS,CLASSIFICATION.docx
STEELS,ALLOYING ELEMENTS,CLASSIFICATION.docx
sudhakargeruganti
 
UPSC CIVILS AND ART OF THINKING.docx
UPSC CIVILS AND ART OF THINKING.docxUPSC CIVILS AND ART OF THINKING.docx
UPSC CIVILS AND ART OF THINKING.docx
sudhakargeruganti
 
Timeline_Indian_History.pdf
Timeline_Indian_History.pdfTimeline_Indian_History.pdf
Timeline_Indian_History.pdf
sudhakargeruganti
 
PRODUCTION OF METALLIC SINGLE CRYSTALS AND DS OF SUPER ALLOYS.docx
PRODUCTION OF METALLIC SINGLE CRYSTALS AND DS OF SUPER ALLOYS.docxPRODUCTION OF METALLIC SINGLE CRYSTALS AND DS OF SUPER ALLOYS.docx
PRODUCTION OF METALLIC SINGLE CRYSTALS AND DS OF SUPER ALLOYS.docx
sudhakargeruganti
 
ODF's and POLE FIGURES EASY UNDERSTANDING.docx
ODF's and POLE FIGURES EASY UNDERSTANDING.docxODF's and POLE FIGURES EASY UNDERSTANDING.docx
ODF's and POLE FIGURES EASY UNDERSTANDING.docx
sudhakargeruganti
 

More from sudhakargeruganti (20)

postive practices to prevent psychological illness.docx
postive practices to prevent psychological illness.docxpostive practices to prevent psychological illness.docx
postive practices to prevent psychological illness.docx
 
postive practices to prevent psychological illness in adulthood.docx
postive practices to prevent psychological illness in adulthood.docxpostive practices to prevent psychological illness in adulthood.docx
postive practices to prevent psychological illness in adulthood.docx
 
NOVEL RENAL THERAPY PROMISES TO CONTROL BP.docx
NOVEL RENAL THERAPY PROMISES TO CONTROL BP.docxNOVEL RENAL THERAPY PROMISES TO CONTROL BP.docx
NOVEL RENAL THERAPY PROMISES TO CONTROL BP.docx
 
CUTTING-EDGE INNOVATION TO REVEAL INNER DANGERS.docx
CUTTING-EDGE INNOVATION TO REVEAL INNER DANGERS.docxCUTTING-EDGE INNOVATION TO REVEAL INNER DANGERS.docx
CUTTING-EDGE INNOVATION TO REVEAL INNER DANGERS.docx
 
TAKING CARE OF LIVER,HEART,KIDNEY.docx
TAKING CARE OF LIVER,HEART,KIDNEY.docxTAKING CARE OF LIVER,HEART,KIDNEY.docx
TAKING CARE OF LIVER,HEART,KIDNEY.docx
 
AI HELPS PARALYSED MAN TO WALK NATURALLY.pdf
AI HELPS PARALYSED MAN TO WALK NATURALLY.pdfAI HELPS PARALYSED MAN TO WALK NATURALLY.pdf
AI HELPS PARALYSED MAN TO WALK NATURALLY.pdf
 
JOMINY END-QUENCH HARDENABILITY TEST.docx
JOMINY END-QUENCH HARDENABILITY TEST.docxJOMINY END-QUENCH HARDENABILITY TEST.docx
JOMINY END-QUENCH HARDENABILITY TEST.docx
 
DISPERSION STRENGTHING AND AGING PHENOMENON.docx
DISPERSION STRENGTHING AND AGING PHENOMENON.docxDISPERSION STRENGTHING AND AGING PHENOMENON.docx
DISPERSION STRENGTHING AND AGING PHENOMENON.docx
 
STRUCTURE OF GRAIN BOUNDARIES LOW AND HIGH ANGLE BOUNDARIES.docx
STRUCTURE OF GRAIN BOUNDARIES LOW AND HIGH ANGLE  BOUNDARIES.docxSTRUCTURE OF GRAIN BOUNDARIES LOW AND HIGH ANGLE  BOUNDARIES.docx
STRUCTURE OF GRAIN BOUNDARIES LOW AND HIGH ANGLE BOUNDARIES.docx
 
THREE BASIC ORIENTATION RELATIONSHIPS IN LATTICES OF IRON.docx
THREE BASIC ORIENTATION RELATIONSHIPS IN LATTICES OF IRON.docxTHREE BASIC ORIENTATION RELATIONSHIPS IN LATTICES OF IRON.docx
THREE BASIC ORIENTATION RELATIONSHIPS IN LATTICES OF IRON.docx
 
DIMENSION OF PEARLITE COLONY AND SPHERIODISATION ON STRENGTH OF PEARLITE.docx
DIMENSION OF PEARLITE COLONY AND SPHERIODISATION ON STRENGTH OF PEARLITE.docxDIMENSION OF PEARLITE COLONY AND SPHERIODISATION ON STRENGTH OF PEARLITE.docx
DIMENSION OF PEARLITE COLONY AND SPHERIODISATION ON STRENGTH OF PEARLITE.docx
 
HEATING AND COOLING CURVES OF PURE IRON.docx
HEATING AND COOLING CURVES OF PURE IRON.docxHEATING AND COOLING CURVES OF PURE IRON.docx
HEATING AND COOLING CURVES OF PURE IRON.docx
 
MODELLING OF PHASE TRANSFORMATIONS IN STEEL IN RESPONSE TO THERMO-MECHANICAL...
MODELLING OF PHASE TRANSFORMATIONS IN  STEEL IN RESPONSE TO THERMO-MECHANICAL...MODELLING OF PHASE TRANSFORMATIONS IN  STEEL IN RESPONSE TO THERMO-MECHANICAL...
MODELLING OF PHASE TRANSFORMATIONS IN STEEL IN RESPONSE TO THERMO-MECHANICAL...
 
KINETICS OF MARTENSITIC TRANSFORMATION.docx
KINETICS OF MARTENSITIC TRANSFORMATION.docxKINETICS OF MARTENSITIC TRANSFORMATION.docx
KINETICS OF MARTENSITIC TRANSFORMATION.docx
 
TWINNED AND SLIPPED MARTENSITE ; C to A RATIO.docx
TWINNED AND SLIPPED MARTENSITE ; C to A RATIO.docxTWINNED AND SLIPPED MARTENSITE ; C to A RATIO.docx
TWINNED AND SLIPPED MARTENSITE ; C to A RATIO.docx
 
STEELS,ALLOYING ELEMENTS,CLASSIFICATION.docx
STEELS,ALLOYING ELEMENTS,CLASSIFICATION.docxSTEELS,ALLOYING ELEMENTS,CLASSIFICATION.docx
STEELS,ALLOYING ELEMENTS,CLASSIFICATION.docx
 
UPSC CIVILS AND ART OF THINKING.docx
UPSC CIVILS AND ART OF THINKING.docxUPSC CIVILS AND ART OF THINKING.docx
UPSC CIVILS AND ART OF THINKING.docx
 
Timeline_Indian_History.pdf
Timeline_Indian_History.pdfTimeline_Indian_History.pdf
Timeline_Indian_History.pdf
 
PRODUCTION OF METALLIC SINGLE CRYSTALS AND DS OF SUPER ALLOYS.docx
PRODUCTION OF METALLIC SINGLE CRYSTALS AND DS OF SUPER ALLOYS.docxPRODUCTION OF METALLIC SINGLE CRYSTALS AND DS OF SUPER ALLOYS.docx
PRODUCTION OF METALLIC SINGLE CRYSTALS AND DS OF SUPER ALLOYS.docx
 
ODF's and POLE FIGURES EASY UNDERSTANDING.docx
ODF's and POLE FIGURES EASY UNDERSTANDING.docxODF's and POLE FIGURES EASY UNDERSTANDING.docx
ODF's and POLE FIGURES EASY UNDERSTANDING.docx
 

Recently uploaded

一比一原版(UofT毕业证)多伦多大学毕业证成绩单如何办理
一比一原版(UofT毕业证)多伦多大学毕业证成绩单如何办理一比一原版(UofT毕业证)多伦多大学毕业证成绩单如何办理
一比一原版(UofT毕业证)多伦多大学毕业证成绩单如何办理
ydteq
 
Final project report on grocery store management system..pdf
Final project report on grocery store management system..pdfFinal project report on grocery store management system..pdf
Final project report on grocery store management system..pdf
Kamal Acharya
 
Gen AI Study Jams _ For the GDSC Leads in India.pdf
Gen AI Study Jams _ For the GDSC Leads in India.pdfGen AI Study Jams _ For the GDSC Leads in India.pdf
Gen AI Study Jams _ For the GDSC Leads in India.pdf
gdsczhcet
 
Standard Reomte Control Interface - Neometrix
Standard Reomte Control Interface - NeometrixStandard Reomte Control Interface - Neometrix
Standard Reomte Control Interface - Neometrix
Neometrix_Engineering_Pvt_Ltd
 
Basic Industrial Engineering terms for apparel
Basic Industrial Engineering terms for apparelBasic Industrial Engineering terms for apparel
Basic Industrial Engineering terms for apparel
top1002
 
ML for identifying fraud using open blockchain data.pptx
ML for identifying fraud using open blockchain data.pptxML for identifying fraud using open blockchain data.pptx
ML for identifying fraud using open blockchain data.pptx
Vijay Dialani, PhD
 
CW RADAR, FMCW RADAR, FMCW ALTIMETER, AND THEIR PARAMETERS
CW RADAR, FMCW RADAR, FMCW ALTIMETER, AND THEIR PARAMETERSCW RADAR, FMCW RADAR, FMCW ALTIMETER, AND THEIR PARAMETERS
CW RADAR, FMCW RADAR, FMCW ALTIMETER, AND THEIR PARAMETERS
veerababupersonal22
 
Unbalanced Three Phase Systems and circuits.pptx
Unbalanced Three Phase Systems and circuits.pptxUnbalanced Three Phase Systems and circuits.pptx
Unbalanced Three Phase Systems and circuits.pptx
ChristineTorrepenida1
 
Nuclear Power Economics and Structuring 2024
Nuclear Power Economics and Structuring 2024Nuclear Power Economics and Structuring 2024
Nuclear Power Economics and Structuring 2024
Massimo Talia
 
Sachpazis:Terzaghi Bearing Capacity Estimation in simple terms with Calculati...
Sachpazis:Terzaghi Bearing Capacity Estimation in simple terms with Calculati...Sachpazis:Terzaghi Bearing Capacity Estimation in simple terms with Calculati...
Sachpazis:Terzaghi Bearing Capacity Estimation in simple terms with Calculati...
Dr.Costas Sachpazis
 
Hierarchical Digital Twin of a Naval Power System
Hierarchical Digital Twin of a Naval Power SystemHierarchical Digital Twin of a Naval Power System
Hierarchical Digital Twin of a Naval Power System
Kerry Sado
 
RAT: Retrieval Augmented Thoughts Elicit Context-Aware Reasoning in Long-Hori...
RAT: Retrieval Augmented Thoughts Elicit Context-Aware Reasoning in Long-Hori...RAT: Retrieval Augmented Thoughts Elicit Context-Aware Reasoning in Long-Hori...
RAT: Retrieval Augmented Thoughts Elicit Context-Aware Reasoning in Long-Hori...
thanhdowork
 
space technology lecture notes on satellite
space technology lecture notes on satellitespace technology lecture notes on satellite
space technology lecture notes on satellite
ongomchris
 
Forklift Classes Overview by Intella Parts
Forklift Classes Overview by Intella PartsForklift Classes Overview by Intella Parts
Forklift Classes Overview by Intella Parts
Intella Parts
 
一比一原版(SFU毕业证)西蒙菲莎大学毕业证成绩单如何办理
一比一原版(SFU毕业证)西蒙菲莎大学毕业证成绩单如何办理一比一原版(SFU毕业证)西蒙菲莎大学毕业证成绩单如何办理
一比一原版(SFU毕业证)西蒙菲莎大学毕业证成绩单如何办理
bakpo1
 
Tutorial for 16S rRNA Gene Analysis with QIIME2.pdf
Tutorial for 16S rRNA Gene Analysis with QIIME2.pdfTutorial for 16S rRNA Gene Analysis with QIIME2.pdf
Tutorial for 16S rRNA Gene Analysis with QIIME2.pdf
aqil azizi
 
Student information management system project report ii.pdf
Student information management system project report ii.pdfStudent information management system project report ii.pdf
Student information management system project report ii.pdf
Kamal Acharya
 
14 Template Contractual Notice - EOT Application
14 Template Contractual Notice - EOT Application14 Template Contractual Notice - EOT Application
14 Template Contractual Notice - EOT Application
SyedAbiiAzazi1
 
NO1 Uk best vashikaran specialist in delhi vashikaran baba near me online vas...
NO1 Uk best vashikaran specialist in delhi vashikaran baba near me online vas...NO1 Uk best vashikaran specialist in delhi vashikaran baba near me online vas...
NO1 Uk best vashikaran specialist in delhi vashikaran baba near me online vas...
Amil Baba Dawood bangali
 
Design and Analysis of Algorithms-DP,Backtracking,Graphs,B&B
Design and Analysis of Algorithms-DP,Backtracking,Graphs,B&BDesign and Analysis of Algorithms-DP,Backtracking,Graphs,B&B
Design and Analysis of Algorithms-DP,Backtracking,Graphs,B&B
Sreedhar Chowdam
 

Recently uploaded (20)

一比一原版(UofT毕业证)多伦多大学毕业证成绩单如何办理
一比一原版(UofT毕业证)多伦多大学毕业证成绩单如何办理一比一原版(UofT毕业证)多伦多大学毕业证成绩单如何办理
一比一原版(UofT毕业证)多伦多大学毕业证成绩单如何办理
 
Final project report on grocery store management system..pdf
Final project report on grocery store management system..pdfFinal project report on grocery store management system..pdf
Final project report on grocery store management system..pdf
 
Gen AI Study Jams _ For the GDSC Leads in India.pdf
Gen AI Study Jams _ For the GDSC Leads in India.pdfGen AI Study Jams _ For the GDSC Leads in India.pdf
Gen AI Study Jams _ For the GDSC Leads in India.pdf
 
Standard Reomte Control Interface - Neometrix
Standard Reomte Control Interface - NeometrixStandard Reomte Control Interface - Neometrix
Standard Reomte Control Interface - Neometrix
 
Basic Industrial Engineering terms for apparel
Basic Industrial Engineering terms for apparelBasic Industrial Engineering terms for apparel
Basic Industrial Engineering terms for apparel
 
ML for identifying fraud using open blockchain data.pptx
ML for identifying fraud using open blockchain data.pptxML for identifying fraud using open blockchain data.pptx
ML for identifying fraud using open blockchain data.pptx
 
CW RADAR, FMCW RADAR, FMCW ALTIMETER, AND THEIR PARAMETERS
CW RADAR, FMCW RADAR, FMCW ALTIMETER, AND THEIR PARAMETERSCW RADAR, FMCW RADAR, FMCW ALTIMETER, AND THEIR PARAMETERS
CW RADAR, FMCW RADAR, FMCW ALTIMETER, AND THEIR PARAMETERS
 
Unbalanced Three Phase Systems and circuits.pptx
Unbalanced Three Phase Systems and circuits.pptxUnbalanced Three Phase Systems and circuits.pptx
Unbalanced Three Phase Systems and circuits.pptx
 
Nuclear Power Economics and Structuring 2024
Nuclear Power Economics and Structuring 2024Nuclear Power Economics and Structuring 2024
Nuclear Power Economics and Structuring 2024
 
Sachpazis:Terzaghi Bearing Capacity Estimation in simple terms with Calculati...
Sachpazis:Terzaghi Bearing Capacity Estimation in simple terms with Calculati...Sachpazis:Terzaghi Bearing Capacity Estimation in simple terms with Calculati...
Sachpazis:Terzaghi Bearing Capacity Estimation in simple terms with Calculati...
 
Hierarchical Digital Twin of a Naval Power System
Hierarchical Digital Twin of a Naval Power SystemHierarchical Digital Twin of a Naval Power System
Hierarchical Digital Twin of a Naval Power System
 
RAT: Retrieval Augmented Thoughts Elicit Context-Aware Reasoning in Long-Hori...
RAT: Retrieval Augmented Thoughts Elicit Context-Aware Reasoning in Long-Hori...RAT: Retrieval Augmented Thoughts Elicit Context-Aware Reasoning in Long-Hori...
RAT: Retrieval Augmented Thoughts Elicit Context-Aware Reasoning in Long-Hori...
 
space technology lecture notes on satellite
space technology lecture notes on satellitespace technology lecture notes on satellite
space technology lecture notes on satellite
 
Forklift Classes Overview by Intella Parts
Forklift Classes Overview by Intella PartsForklift Classes Overview by Intella Parts
Forklift Classes Overview by Intella Parts
 
一比一原版(SFU毕业证)西蒙菲莎大学毕业证成绩单如何办理
一比一原版(SFU毕业证)西蒙菲莎大学毕业证成绩单如何办理一比一原版(SFU毕业证)西蒙菲莎大学毕业证成绩单如何办理
一比一原版(SFU毕业证)西蒙菲莎大学毕业证成绩单如何办理
 
Tutorial for 16S rRNA Gene Analysis with QIIME2.pdf
Tutorial for 16S rRNA Gene Analysis with QIIME2.pdfTutorial for 16S rRNA Gene Analysis with QIIME2.pdf
Tutorial for 16S rRNA Gene Analysis with QIIME2.pdf
 
Student information management system project report ii.pdf
Student information management system project report ii.pdfStudent information management system project report ii.pdf
Student information management system project report ii.pdf
 
14 Template Contractual Notice - EOT Application
14 Template Contractual Notice - EOT Application14 Template Contractual Notice - EOT Application
14 Template Contractual Notice - EOT Application
 
NO1 Uk best vashikaran specialist in delhi vashikaran baba near me online vas...
NO1 Uk best vashikaran specialist in delhi vashikaran baba near me online vas...NO1 Uk best vashikaran specialist in delhi vashikaran baba near me online vas...
NO1 Uk best vashikaran specialist in delhi vashikaran baba near me online vas...
 
Design and Analysis of Algorithms-DP,Backtracking,Graphs,B&B
Design and Analysis of Algorithms-DP,Backtracking,Graphs,B&BDesign and Analysis of Algorithms-DP,Backtracking,Graphs,B&B
Design and Analysis of Algorithms-DP,Backtracking,Graphs,B&B
 

FATIGUE.pdf

  • 1. CHAPTER 14 Fatigue FATIGUE FAILURES OCCUR due to the application of fluctuating stresses that are much lower than the stress required to cause failure during a single application of stress. It has been estimated that fatigue contributes to approxi- mately 90% of all mechanical service failures. Fatigue is a problem that can affect any part or component that moves. Automobiles on roads, aircraft wings and fuselages, ships at sea, nu- clear reactors, jet engines, and land-based tur- bines are all subject to fatigue failures. Fatigue was initially recognized as a problem in the early 1800s when investigators in Europe observed that bridge and railroad components were cracking when subjected to repeated loading. As the century progressed and the use of metals expanded with the increasing use of machines, more and more failures of components subjected to repeated loads were recorded. Today, struc- tural fatigue has assumed an even greater importance as a result of the ever-increasing use of high-strength materials and the desire for higher performance from these materials. 14.1 Stress Cycles There are three basic factors necessary to cause fatigue: (1) a maximum tensile stress of sufficiently high value, (2) a large enough var- iation or fluctuation in the applied stress, and (3) a sufficiently large number of cycles of the applied stress. There are many types of fluctu- ating stresses. Several of the more common types encountered are shown in Fig. 14.1. A fully reversed stress cycle, shown in the top graph of Fig. 14.1, where the maximum and minimum stresses are equal, is commonly used in testing. This is the type of stress produced, for example, by the R.R. Moore rotating-beam fatigue machine shown in Fig. 14.2, which is similar to what a shaft may encounter during service. Since this was the original type of machine used to generate fatigue data, quite a bit of the data in the literature is for fully reversed bending with no mean stress applied on top of it. Another common stress cycle is the repeated stress cycle, in which there is a mean stress (sm) applied on top of the maximum and minimum Fig. 14.1 Typical loading cycles © 2008 ASM International. All Rights Reserved. Elements of Metallurgy and Engineering Alloys (#05224G) www.asminternational.org
  • 2. stresses. The middle graph in Fig. 14.1 shows the condition where both stresses (cyclic and ap- plied) are tensile (greater than zero), but it is also possible to test with both stresses in compres- sion. In addition, the maximum and minimum stresses in the cycle do not necessarily have to be equal in value. The last type of loading cycle is the random or irregular stress cycle, in which the part is subjected to random loads during service, as shown in the bottom graph of Fig. 14.1. Although a majority of the fatigue data in the literature is for fully reversed bending, there are also axial test machines (Fig. 14.3) that are capable of tension and compression loading in both the high- and low-cycle fatigue ranges. These modern test frames are closed-loop servohydraulically controlled and can be pro- grammed with almost any desired fatigue spec- trum. A fluctuating stress is made up of two com- ponents: a mean or steady stress, sm, and an alternating or variable stress, sa. The stress range, sr, is the difference between the max- imum and minimum stress in a cycle: sr=smax7smin (Eq 14.1) The alternating stress is one-half the stress range: sa= sr 2 = smax7smin 2 (Eq 14.2) The mean stress is the algebraic average of the maximum and minimum stress in the cycle: sm= smax+smin 2 (Eq 14.3) Two ratios frequently used in presenting fatigue data are: Stress ratio R= smin smax (Eq 14.4) Amplitude ratio A= sa sm = 17R 1+R (Eq 14.5) 14.2 High-Cycle Fatigue High-cycle fatigue involves a large number of cycles (N4105 cycles) and an elastically applied stress. High-cycle fatigue tests are usually carried out for 107 cycles and sometimes 5 · 108 cycles for nonferrous metals. Although the applied stress is low enough to be elastic, plastic deformation can take place at the crack tip. High-cycle fatigue data are usually pre- sented as a plot of stress, S, versus the number of cycles to failure, N. A log scale is used for the number of cycles. The value of stress, S, can be the maximum stress, smax, the minimum stress, smin, or the stress amplitude, sa. The S-N rela- tionship is usually determined for a specified value of the mean stress, sm, or one of the two ratios, R or A. The fatigue life is the number of cycles to failure at a specified stress level, while the fati- gue strength (also referred to as the endurance limit) is the stress below which failure does not occur. As the applied stress level is decreased, the number of cycles to failure increases. Normally, the fatigue strength increases as the static tensile strength increases. For example, Fig. 14.2 Schematic of R.R. Moore reversed-bending fatigue machine. Source: Ref 1 244 / Elements of Metallurgy and Engineering Alloys © 2008 ASM International. All Rights Reserved. Elements of Metallurgy and Engineering Alloys (#05224G) www.asminternational.org
  • 3. high-strength steels heat treated to over 1400 MPa (200 ksi) yield strengths have much higher fatigue strengths than aluminum alloys with 480 MPa (70 ksi) yield strengths. A com- parison of the S-N curves for steel and aluminum is shown in Fig. 14.4. Note that steel not only has a higher fatigue strength than aluminum, but it also has an endurance limit. Below a certain stress level, the steel alloy will never fail due to cyclic loading alone. On the other hand, aluminum does not have a true endurance limit. It will always fail if tested to a sufficient number of cycles. Therefore, the fatigue strength of aluminum is usually reported as the stress level it can survive at a large total number of cycles, usually 5 · 108 cycles. It should be noted that there is a considerable amount of scatter in fatigue test results. It is therefore important to test a sufficient number of specimens to obtain statistically meaningful results. For a large number of steels, there is a direct correlation between tensile strength and fatigue strength; higher-tensile-strength steels have higher endurance limits. The endurance limit is normally in the range of 0.35 to 0.60 of the tensile strength. This relationship holds up to a hardness of approximately 40 HRC (~1200 MPa, or 180 ksi tensile strength), and then the scatter becomes too great to be reliable (Fig. 14.5). This does not necessarily mean it is wise to use as high a strength steel as possible to maximize fatigue life because, as the tensile strength increases, the fracture toughness de- creases and the environmental sensitivity increases. The endurance limit of high-strength steels is extremely sensitive to surface condition, residual-stress state, and the presence of inclusions that act as stress concentrations. Fatigue cracking can occur quite early in the service life of the component by the formation of a small crack, generally at some point on the external surface. The crack then propagates slowly through the material in a direction roughly perpendicular to the main tensile axis (Fig. 14.6). Ultimately, the cross-sectional area of the member is reduced to the point that it can no longer carry the load, and the member fails in tension. The fracture surface of a fatigued high- strength part is shown in Fig. 14.7. The portion of the fracture surface due to fatigue crack growth and the portion finally cracked due to overload are clearly evident. As previously mentioned, much of the fatigue data in the literature has been determined for completely reversedbending with sm = 0.How- ever, the effects of mean stress are important, Alignment fixture Load cell Top grip Heat shield Extensometer Bottom grip Heating coil Assembly Specimen Fig. 14.3 Modern fatigue test frame Chapter 14: Fatigue / 245 © 2008 ASM International. All Rights Reserved. Elements of Metallurgy and Engineering Alloys (#05224G) www.asminternational.org
  • 4. and an increase in mean stress will always cause a reduction in the fatigue life (Fig. 14.8). A number of mathematical models have been developed that allow the effects of mean stress on stress amplitude to be predicted from fully reversed-bending data. Goodman developed a linear model, while Gerber used a parabolic model (Fig. 14.9). Test data for ductile metals usually fall closer to the Gerber parabolic curve; however, because of the scatter in fatigue data and the fact that notched data fall closer to the Goodman line, the more conservative Goodman relationship is often used in practice. If the component design is based on yield rather than ultimate strength, as most are, then the even more conservative Soderberg relationship can be used. Mathematically, the three relationships can be expressed by: sa=se 17 sm su x (Eq 14.6) where x = 1 for the Goodman line, x = 2 for the Gerber curve, su = sy for the Soderberg curve, and se is the fatigue limit for completely reversed bending. 14.3 Low-Cycle Fatigue During cyclic loading within the elastic regime, stress and strain are directly related through the elastic modulus. However, for cyclic 80 1045 Steel Endurance Limit No Endurance Limit 2024-T6 Al 60 40 20 0 500 400 300 200 100 0 103 104 105 106 107 108 109 1010 Number of Cycles Stress Amplitude (ksi) Stress Amplitude (MPa) Fig. 14.4 Comparison of steel and aluminum fatigue beha- vior. Source: Ref 2 140 130 400 500 600 700 800 900 120 All test results from one laboratory All specimens 0 to 2 micro-in. finish 110 100 Fatigue limit, (ksi) Fatigue limit, (MPa) 90 80 70 60 20 25 30 35 40 45 Rockwell C hardness Quenched and tempered steels 1054 2340 4032 4042 4053 4063 4068 4130 4140 4340 5140 5150 5160 8640 9262 50 55 60 65 70 Fig. 14.5 Endurance limit versus hardness for steels. Source: Ref 3 246 / Elements of Metallurgy and Engineering Alloys © 2008 ASM International. All Rights Reserved. Elements of Metallurgy and Engineering Alloys (#05224G) www.asminternational.org
  • 5. loading that produces plastic strains, the re- sponses are more complex and form a hysteresis loop (Fig. 14.10). From point O up to point A, the component is in tension. On unloading, the strain response of the specimen follows the curve from A to D. At D, the component is under no stress. As the component is subjected to compressive stress, the strain response follows the curve from D to B. Releasing the compressive stress from B and reapplying tensile stress, the component stress-strain con- dition returns to point A along the curve de- fined by B, C, and A. Points A and B represent the cyclic stress and strain limits. The total strain, De, consists of both elastic and plastic compo- nents: De=Dee+Dep (Eq 14.7) where Dee is the elastic strain and Dee = Ds/E, and Dep is the plastic strain and Dep is the width of the loop at its center, that is, the distance CD in Fig. 14.10. The area of the hysteresis loop is equal to the work done or the energy loss per cycle. In cyclic strain-controlled fatigue, the strain amplitude is held constant during cycling. Since plastic deformation is not completely Nucleation Crack Growth Final Failure Fig. 14.6 Typical propagation of a fatigue crack. Source: Ref 4 Fig. 14.7 Fatigue crack growth in a high-strength steel part Chapter 14: Fatigue / 247 © 2008 ASM International. All Rights Reserved. Elements of Metallurgy and Engineering Alloys (#05224G) www.asminternational.org
  • 6. reversible, the stress-strain response during cycling can change, largely depending on the initial condition of the metal. The metal can either undergo cyclic strain hardening, cyclic strain softening, or remain stable. Cyclic strain hardening and softening are illustrated schematically in Fig. 14.11. In both cases, the hysteresis loops change with successive cycles. Cyclic hardening leads to increasing peak strain with increasing cycles, while cyclic softening results in decreasing strain levels with increasing cycles. In general, strong metals tend to cyclically soften, and low-strength metals tend to cyclically harden. However, the hysteresis loop tends to stabilize after a few hundred cycles, when the material attains a stable condition for the imposed strain level. Stress Amplitude (σ a ) Increasing Mean Stress σm = 240 MPa (35 ksi) σm = 0 MPa (0 ksi) σm = 480 (70 ksi) Cycles to Failure (Nf) Fig. 14.8 Effect of mean stress on fatigue life σ σ σ σ σ σ σ σ σ (σm) Fig. 14.9 Comparison of Goodman, Gerber, and Soderberg models for relating mean stress to stress amplitude 248 / Elements of Metallurgy and Engineering Alloys © 2008 ASM International. All Rights Reserved. Elements of Metallurgy and Engineering Alloys (#05224G) www.asminternational.org
  • 7. Typically, metals harden if su=sy 1:4 and soften if su=sy 1:2. The reason for hardening or softening is related to the dislocation microstructure of the metal. When the metal is highly work hardened and the dislocation density is high, cyclic strain allows the rearrangement of dislocations into more stable networks, thereby reducing the stress at which plastic deformation occurs. Conversely, when the initial dislocation density is low, the cyclic strain increases the dislocation density, increasing the amount of elastic strain and stress on the material. Low-cycle fatigue test data are often pre- sented as a plot of the plastic strain range, Dep, versus cycles to failure, N. When plotted on log- log coordinates, a straight line is obtained that is described by the Coffin-Manson relation: Dep 2 =e0 f(2N)c (Eq 14.8) where Dep=2 is the plastic strain amplitude, and e0 f is the fatigue ductility coefficient defined by the strain intercept at 2N = 1. For many metals, e0 f is approximately equal to the true fracture strain, ef. 2N is the number of strain reversals to failure, where one cycle is two reversals, and c is the fatigue ductility exponent, which usually varies between 0.5 and 0.7. A smaller value of c results in longer fatigue lives. The Basquin equation, which describes the high-cycle, low-strain regime where the nominal strains are elastic, is: sa= Dee 2 E=s0 f(2N)b (Eq 14.9) where sa is the alternating stress amplitude, Dee=2 is the elastic strain amplitude, E is the modulus of elasticity, and s0 f is the fatigue strength coefficient, defined as the stress inter- cept at 2N = 1. s0 f is approximately equal to the true fracture stress, sf. 2N is the number of load reversals to failure, and b is the fatigue strength exponent, which varies for most metals between 0.05 and 0.12. A smaller b results in a longer fatigue life. Combining Basquin’s equation and the Coffin-Manson equation gives an equation ∆σ/2E ∆ε ∆εp ∆εe = ∆σ/E ∆σ O Strain Stress A B C D ∆σ/2E σa = ∆σ/2 Fig. 14.10 Stress-strain hysteresis loop for cyclic loading Chapter 14: Fatigue / 249 © 2008 ASM International. All Rights Reserved. Elements of Metallurgy and Engineering Alloys (#05224G) www.asminternational.org
  • 8. that can be used to estimate the entire range of fatigue lives: De 2 = Dee 2 + Dep 2 (Eq 14.10) De 2 = s0 f E (2N)b +e0 f(2N)c (Eq 14.11) The fatigue strain-life curve tends toward the plastic curve at large strain amplitudes and Fig. 14.11 Cyclic hardening and cyclic softening 250 / Elements of Metallurgy and Engineering Alloys © 2008 ASM International. All Rights Reserved. Elements of Metallurgy and Engineering Alloys (#05224G) www.asminternational.org
  • 9. toward the elastic curve at small strain am- plitudes (Fig. 14.12). For high-cycle strain conditions, ductile metals have the longest lives, while at low-cycle strain conditions, strong metals have the longest lives. 14.4 Cumulative Damage Fatigue tests are often conducted under sim- ple conditions, such as constant amplitude and constant frequency. However, in real structures, the loading conditions are rarely simple. Many structures are subjected to a range of fluctuating loads, mean stress levels, and variable fre- quencies. Thus, it is important to be able to predict the life of a component subjected to variable amplitude loading using data generated in constant amplitude laboratory tests. Cumula- tive damage theories consider the fatigue pro- cess to be one of damage accumulation until the life of the component is exhausted. Consider the fatigue life diagram in Fig. 14.13. At a constant stress, s1, the life is 200 cycles, while at s2, the life is 400 cycles. According to cumulative damage theory, fatigue life is gradually exhau- sted. That is, at points A and C, 100% of the life is available, while at points B and D, the re- spective lives are completely exhausted. If fati- gue damage accumulates in a linear manner, each cycle contributes the same amount of damage at a given stress level. For example, at s1, on cycling the metal from A to E, one-fourth of the fatigue life is consumed (50 of 200 cycles). If the stress level is reduced to s2, the percentage of life exhausted at s2 is equivalent to the percentage of life exhausted at s1. That is, if one-fourth of the fatigue life is consumed at s1, the component still will have lost one-fourth of its life even if the stress is reduced to s2. For example, at point E, 50 cycles of 200 are consumed. If, when the component reaches the number of cycles defined by point E, the stress is reduced to s2, the component will be in the condition defined by point F, with 100 of its 400 cycles consumed. The same kind of change can be described for a low-to-high stress traverse. Cumulative damage during fatigue is often determined using the Palmgren-Miner rule, which assumes that the total life of a part can be estimated by adding up the percentage of life consumed by each stress level: n1 N1 + n2 N2 + + nk Nk =1 or X j=k j=1 nj Nj =1 (Eq 14.12) where n1, n2 nk represent the number of cycles at a specific stress level, and N1, N2 Nk represent the fatigue life in cycles at the same stress level. This rule should be used with caution. It is a linear relationship that does not consider the effects of understressing or overstressing. Understressing, in which relatively low stress levels are initially applied, can result in longer fatigue lives at a higher stress level, due to localized strain hardening. On the other hand, overstressing, in which high stresses are initially applied, can result in shorter fatigue lives at a low stress level, due to damage induced by the higher stress levels. Fig. 14.12 Fatigue life in terms of total strain Fig. 14.13 Cumulative damage during high-to-low loading sequence. Source: Ref 5 Chapter 14: Fatigue / 251 © 2008 ASM International. All Rights Reserved. Elements of Metallurgy and Engineering Alloys (#05224G) www.asminternational.org
  • 10. 14.5 Fatigue Crack Nucleation and Growth Fatigue cracks almost always initiate at free surfaces, usually external surfaces but also internal surfaces if the metal contains defects such as voids and cracked second-phase parti- cles. Common external surface defects include geometric notches and surface roughness. Fatigue crack nucleation and growth occurs in the following stages. Stage I. Crack initiation usually starts at a notch or other surface discontinuity. Even in the absence of a surface defect, crack initiation will eventually occur due to the formation of persistent slip bands (PSBs), so called because traces of the bands persist even when the surface damage is polished away. Slip bands are a result of the systematic buildup of fine slip movements on the order of only 1 nm. However, the plastic strain within the PSB can be as much as 100 times greater than that in the surrounding material. The back-and-forth movement of the slip bands leads to the formation of intrusions and extrusions at the surface, eventually leading to the formation of a crack (Fig. 14.14). The initial crack propagates parallel to the slip bands. The crack propagation rate during stage I is very low, on the order of 1 nm per cycle, and produces a practically featureless fracture surface. The crack initially follows the slip bands at approximately 45 to the principal stress direc- tion. When the crack length becomes sufficient for the stress field at the tip to become dominant, the overall crack plane changes and becomes perpendicular to the principal stress, and the crack enters stage II. Stage II crack growth occurs when the stage I crack changes direction and propagates in a direction normal to the applied stress. Crack growth proceeds by a continual process of crack sharpening followed by blunting, as shown in the Fig. 14.15 illustration. Crack propagation during crack growth often produces a pattern of fatigue striations (Fig. 14.16), with each striation representing one cycle of fatigue. Although striations are indicative of fatigue, fatigue fail- ures can occur without the formation of stria- tions. Striations are microstructural details that are best examined with a scanning electron microscope and are not visible to the naked eye. Frequently, visible examination of a fatigued surface will reveal a series of concentric mark- ings on the surface, referred to as beach marks (Fig. 14.6). These are present as a result of stress changes during fatigue, for example, the starting and stopping of a rotating shaft. Each of the beach marks can contain thousands or even tens of thousands of fatigue cycles. Stage III. Ultimate failure occurs when the fatigue crack becomes long enough that the remaining cross section can no longer support the applied load. 14.6 Fatigue Crack Propagation Linear elastic fracture mechanics assumes that all structures contain flaws. Cracks grow from an initial size, ao, to a critical size, ac, cor- responding to failure as a function of the number of load cycles (Fig. 14.17). The crack growth rate, da/dn, can be determined from the slope of the curve. Initially, the crack growth rate is slow but increases with increasing crack length. Of course, the crack growth rate is also higher for higher applied stresses. If one can characterize the crack growth, it is then possible to estimate Fig. 14.14 Development of extrusions and intrusions during fatigue. Source: Ref 4 252 / Elements of Metallurgy and Engineering Alloys © 2008 ASM International. All Rights Reserved. Elements of Metallurgy and Engineering Alloys (#05224G) www.asminternational.org
  • 11. the service life or inspection intervals required under specific loading conditions and service environment. In the fracture mechanics ap- proach to fatigue crack growth, the crack growth rate, or the amount of crack extension per load- ing cycle, is correlated with the stress-intensity parameter, K. This approach makes it possible to estimate the useful safe lifetime and to establish inspection intervals. An idealized da/dn versus DK curve is shown in Fig. 14.18. In region I, DKth is the fatigue crack growth threshold, which is at the lower end of the DK range, where crack growth rates approach zero. In region II, the crack growth rate is stable and essentially linear and can be modeled by power law equa- tions, such as the Paris equation: da=dn=C(DK)m (Eq 14.13) where: a is the flaw or crack size in inches; n is the number of cycles; C and m are constant parameters and are related to material variables, environment, temperature, and fatigue stress conditions; and DK = DKmax DKmin is the stress-intensity parameter range. The constants C and m are material parameters that must be determined experimentally. Typically, m is in the range of 2 to 4 for metals and 4 to 100 for ceramics and polymers. During stage II growth in the linear crack growth region, the Paris law can be used to determine the number of cycles to failure. DK can be expressed in terms of Ds: DK=DKmax7DKmin=Ysmax · ffiffiffiffiffiffi pa p 7Ysmin ffiffiffiffiffiffi pa p =YDs ffiffiffiffiffiffi pa p (Eq 14.14) 1 2 3 4 5 6 Striation Fig. 14.15 Fatigue crack propagation. Source: Ref 6 2 µm Striation Fig. 14.16 SEM image showing fatigue striations Chapter 14: Fatigue / 253 © 2008 ASM International. All Rights Reserved. Elements of Metallurgy and Engineering Alloys (#05224G) www.asminternational.org
  • 12. where Y depends on the specific specimen geo- metry. Thus, the Paris law becomes: da dn =C(YDs ffiffiffiffiffiffi pa p )m (Eq 14.15) One of the goals of fatigue analysis is to be able to predict the fatigue life of structures. The fatigue life, n, can be solved for by rearranging Eq 14.13: dn= da C(DK)m (Eq 14.16) which may then be integrated to give: nf= ð nf 0 dn= ð ac ao da C(DK)m (Eq 14.17) Substitution of the expression for DK (Eq 14.14) gives: nf= ð ac ao da C(YDs ffiffiffiffiffiffi pa p )m= 1 Cp m=2(Ds)m ð ac ao da Yma m=2 (Eq 14.18) It is assumed that Ds (or smax smin) is constant and that Y depends on the crack length and therefore cannot be removed from within the integral. For cases where Y depends on crack length, these integrations will generally be performed using numerical techniques. During stage II crack growth, some metals are sensitive to the load ratio, R, as shown in Fig. 14.19 for 7075-T651 aluminum plate. Since the Paris equation does not account for the load ratio, there are other expressions that do account for the sensitivity of crack growth rate to the load ratio. One of the most utilized is the one devel- oped by Foreman and his associates: da dn = C(DK)m (17R)Kc7DK (Eq 14.19) In these expressions, it is necessary to deter- mine the initial crack length, ao, and the final or critical crack length, ac. Crack lengths can be detected using a number of nondestructive testing techniques. If no cracks are detected, it must be assumed that a crack exists below the resolution of the detection system being used. A subcritical crack will eventually grow to a length at which the metal immediately fails, that is: Kmax?Kc (Eq 14.20) or Ysmax ffiffiffiffiffiffiffiffi paf p ! Kc (Eq 14.21) Solving for ac gives: ac= K2 c pY2s2 max (Eq 14.22) ac ao ao nf ac Crack Length a Fatigue Life da dn Inspection Retirement Number of Cycles Fig. 14.17 Crack length as a function of cycles. Source: Ref 5 Fig. 14.18 Crack propagation curve for fatigue loading 254 / Elements of Metallurgy and Engineering Alloys © 2008 ASM International. All Rights Reserved. Elements of Metallurgy and Engineering Alloys (#05224G) www.asminternational.org
  • 13. Note that even if a component contains a detectable crack, it can remain in service, provided that it is periodically inspected. This philosophy forms the basis for what is known as the damage-tolerance design approach. Finally, in region III, the crack growth rate accelerates, since the fracture toughness of the material is approached, and there is a local ten- sile overload failure. 14.7 Crack Closure During fatigue cycling, the crack growth rate can slow due to crack closure. For example, if the structure is subjected to a series of high-tensile overloads that are followed by loads at lower tensile stress levels, the crack may temporarily stop propagating, leading to a decrease in the crack growth rate, da/dn, and consequently have a longer fatigue life than would normally be expected. Crack closure mechanisms effectively reduce the DK during fatigue cycling, thus retarding the crack growth. Since DK is equal to Kmax Kmin and the actual DK is reduced be- cause crack closure is hindered, DK is effectively smaller, and crack growth rate is then reduced. Four mechanisms that can cause crack closure are shown in Fig. 14.20. Plasticity-induced closure results from compressive residual stres- ses developing in the plastic wake. Roughness- induced closure is due to crack meandering, in which the crack deviates from mode I dis- placements and is subject to mode II shear dis- placements. These displacements cause a mismatch between the upper and lower crack faces, which results in contact between the crack faces during cycling. Oxide debris-induced closure results from corrosion products becom- ing wedged in the crack interface. Finally, fluid 1 10 (12) 100 (120) R = 0.1 R = +0.5 R = –0.5 R = σmin/σmax 10–2 10–3 10–4 10–5 10–6 3×10⁻² 3×10⁻³ 3×10⁻⁴ 3×10⁻⁵ 3×10⁻⁶ da / dN (in./cycle) da / dN (cm/cycle) Center cracked panels, L-T Direction 7075-T651, 0.6 cm (0.25 in.) Thickness ∆K, ksi·√in. (MPa √m) Fig. 14.19 Stress ratio effects on an aluminum alloy Chapter 14: Fatigue / 255 © 2008 ASM International. All Rights Reserved. Elements of Metallurgy and Engineering Alloys (#05224G) www.asminternational.org
  • 14. pressure can act as a wedge, preventing total crack closure. 14.8 Geometrical Stress Concentrations In most structures, fatigue cracking usually initiates at a stress concentration. The stress concentration may by inherent in the design, such as a fillet, hole, thread, or other geometrical feature, or the stress concentration can result from a manufacturing process, such as a rough surface finish or residual tensile stresses intro- duced by heat treatment. The effect of geometrical stress concentra- tions on fatigue is often studied by testing not- ched specimens. When a notch is present in a specimen under uniaxial loading, three effects are present: (1) there is an increase or con- centration of stress at the root of the notch, (2) there is a stress gradient from the notch toward the center of the specimen, and (3) a triaxial state of stress exists. The dramatic reduction in fatigue life of normalized 4340 steel sheet con- taining different types of stress concentrations is shown in Fig. 14.21. The effect of notches on fatigue strength is determined by comparing the S-N curves of notched and unnotched specimens. The data for the notched specimens are usually plotted in terms of nominal stress based on the net cross section of the specimen. The effect of the notch in decreasing the fatigue strength is reported as the fatigue strength reduction factor, or the fatigue notch factor, Kf: Kf= Fatigue limit unnotched Fatigue limit notched (Eq 14.23) For metals that do not have a definite fatigue limit, the fatigue notch factor is based on the fatigue strength at a specified number of cycles. Values of the fatigue notch factor vary with the severity of the notch, the type of notch, the material, the type of loading, and the applied stress level. Plasticity-Induced Closure Roughness-Induced Closure Mode II Displacement Oxide-Induced Closure Fluid-Induced Closure Corrosion Product Fluid Fig. 14.20 Fatigue crack closure mechanisms in metals. Source: Ref 7 256 / Elements of Metallurgy and Engineering Alloys © 2008 ASM International. All Rights Reserved. Elements of Metallurgy and Engineering Alloys (#05224G) www.asminternational.org
  • 15. Notched fatigue data are also reported using a notch sensitivity factor, q: q= Kf71 Kt71 (Eq 14.24) This relationship compares the theoretical stress-concentration factor, Kt, to the fatigue notch factor, Kf. In this relationship, a material that experiences no reduction in fatigue due to a notch will have a notch sensitivity factor of q = 0, while one that experiences a reduction in fatigue up to the full theoretical value will have a notch sensitivity factor of q = 1. The value of q is dependent on the material and the radius of the notch root, as illustrated by the plots shown in Fig. 14.22 for steels. The notch sensi- tivity factor, q, significantly decreases with smaller notch radii. Although this seems coun- terintuitive, it occurs because Kf increases more slowly than Kt with decreasing notch radius. For notches with large radii, Kf is almost equal to Kt. For materials with small notches, Kf is less than Kt. In addition, lower-strength metals are less affected than high-strength metals by geometric discontinuities that reduce the fatigue resistance, because high-strength metals have a limited capacity for deformation and crack tip blunting. 14.9 Manufacturing Stress Concentrations Because almost all fatigue failures start on a surface, the surface finish and residual-stress state near the surface can have a profound effect on the fatigue strength. Since the early days of fatigue investigations, it was recognized that the fatigue life of a component is very dependent on the surface finish produced by machining or grinding operations. As shown in Fig. 14.23, highly polished steel specimens perform much better in fatigue than even care- fully machined surfaces. Further degradation in fatigue strength occurs for hot rolled and forged surfaces. Finally, when corrosion is introduced, the fatigue life can be seriously degraded. Parts that are formed at room temperature will contain residual stresses. For example, the sur- face of a part that was formed in tension will contain residual compressive stresses, and a surface that was in compression during forming will contain residual tensile stresses. Since fati- gue always occurs under tensile loading, the surface with the residual tensile stresses will be the most prone to fatigue cracking. Similar to forming, some quenching operations during heat treatment can result in a tensile residual-stress pattern on the surface that will adversely affect fatigue strength. The fatigue data shown in Table 14.1 for 4340 steel forgings tested in fully reversed bending illustrate two important points. First, vacuum melting, which removes inclusions, improves both the longitudinal and transverse endurance limits. Second, since forging tends to elongate inclusions in the longitudinal or working direc- tion, the fatigue endurance limit is higher in the longitudinal direction. The lower transverse endurance limit in steels containing inclusions is attributed to stress concentrations at the inclu- sions, which can be quite high when an elon- gated stringer is oriented transverse to the tensile stress. For the case of the vacuum-melted steel, the transverse limit is still somewhat lower than Unnotched Hole, Kt = 2 Fillet, Kt = 4 Edge Notch, Kt = 4 104 105 106 107 108 109 0 20 40 60 80 100 200 300 400 500 Cycles to Failure Stress Amplitude (ksi) Stress Amplitude (MPa) 4340 Steel Normalized Fig. 14.21 Effect of geometrical stress concentrations on fatigue life. Source: Ref 8 Fig. 14.22 Notch sensitivity versus notch radius for steels. Source: Ref 9 Chapter 14: Fatigue / 257 © 2008 ASM International. All Rights Reserved. Elements of Metallurgy and Engineering Alloys (#05224G) www.asminternational.org
  • 16. for the longitudinal direction, indicating the extreme sensitivity of transverse fatigue prop- erties to microstructure. Due to their extreme strength and hardness, high-strength steels are often finished by grind- ing to provide precise dimensions, remove any nicks or scratches, and provide smooth surfaces. However, great care must be taken when grinding these ultrahigh-strength steels. Impro- per or abusive grinding can result in grinding burns, in which the surface is heated above the austenitizing temperature and the austenite formed converts to untempered martensite on cooling (Fig. 14.24). This untempered marten- sitic surface layer is brittle and susceptible to forming a network of fine cracks that can reduce the fatigue strength by as much as 30%. Even if the grinding temperature is not high enough to produce austenite, it may cause the original tempered martensite microstructure on the sur- face to become overtempered, thereby reducing the strength and hardness. 14.10 Environmental Effects Corrosion Fatigue. The simultaneous action of fatigue and corrosive attack is known as corrosion fatigue. In the absence of fatigue loading, corrosive attack can often cause pitting of a metal surface. These pits can then act as stress concentrations that will initiate fatigue cracking. When corrosion and fatigue occur simultaneously, the chemical attack greatly accelerates fatigue crack growth. Materials such as steels, which show a definite endurance limit when tested in air, do not exhibit a definite endurance limit when tested in a corrosive environment (Fig. 14.25). Frequently, fatigue will corrupt the protective films that would normally slow the corrosive attack, allowing continued and accelerated attack. Since corro- sion is time dependent, slow cycling rates will result in greater life reductions than accelerated fatigue cycling. Another possible effect of a corrosive environment on fatigue life is the 0.1 100 140 180 220 500 Ultimate Tensile Stress (MPa) 1000 1500 260 0 60 0.2 0.3 0.4 0.5 0.6 0.7 0.8 0.9 1.0 Ultimate Tensile Strength (ksi) Surface Retention Factor Mirror Polished Fine Ground or Commercially Polished Machined Hot Rolled As-Forged Corroded in Tap Water Corroded in Salt Water Fig. 14.23 Effect of surface finish on fatigue of steels. Source: Ref 10 258 / Elements of Metallurgy and Engineering Alloys © 2008 ASM International. All Rights Reserved. Elements of Metallurgy and Engineering Alloys (#05224G) www.asminternational.org
  • 17. absence of the stable stage II crack growth that occurs according to the Paris law. A reduction in fatigue life of 50% or more is not unusual. There are a number of methods used to com- bat corrosion fatigue. First, the choice of a material for an aggressive environment should probably be based on its corrosion resistance rather than its fatigue properties. For example, stainless steel, bronze, or beryllium-copper would probably yield better service than heat treated steels. Corrosion-resistant coatings that isolate the surface from the environment are successful as long as the coating does not rupture during cycling. Zinc and cadmium coatings on steel and aluminum alclad coatings on alumi- num generally produce better fatigue lives in aggressive environments, even though the coatings may reduce fatigue lives somewhat when tests are conducted in air. The introduction of surface compressive residual-stress patterns by shot peening or nitriding can be very useful. Low-Temperature Fatigue. Fatigue life normally increases with decreasing tempera- tures. Although steels become more notch sensitive at low temperatures, there is no experimental evidence indicating that any sud- den change in fatigue properties occurs at tem- peratures below the ductile-to-brittle transition temperature. High-Temperature Fatigue. In general, the fatigue strength of metals decreases with in- creasing temperatures. An exception is mild steel, which exhibits a maximum in fatigue strength between 205 and 300 C (400 and 575 F) due to strain aging. As the temperature exceeds approximately half the melting point, Tm, creep can become the dominant cause of failure. Ferrous alloys, which usually exhibit an endurance limit at room temperature, will no longer have an endurance limit when the temperature exceeds approximately 425 C (800 F). In general, the higher the creep strength of an alloy, the higher will be its high- temperature fatigue strength. However, there are conflicting requirements, with fine grain sizes being beneficial to fatigue properties, while coarse grain sizes are preferred in certain creep regimes. In addition, the beneficial effects of fatigue improvement processes such as shot peening, which are effective at room tempera- ture, may be annealed out at elevated tempera- tures. Table 14.1 Effect of inclusions in 4340 forged steel Property Electric furnace melted Vacuum melted Longitudinal fatigue limit MPa (ksi) 800 (116) 960 (139) Transverse fatigue limit MPa (ksi) 545 (79) 830 (120) Ratio transverse/longitudinal 0.68 0.86 Hardness (HRC) 27 29 Source: Ref 11 Fig. 14.24 Effects of grinding burns (untempered marten- site) on high-strength steel. Source: Ref 12 Chapter 14: Fatigue / 259 © 2008 ASM International. All Rights Reserved. Elements of Metallurgy and Engineering Alloys (#05224G) www.asminternational.org
  • 18. Thermal Fatigue. Thermal stresses result when dimensional changes in response to tem- perature changes are restricted by some type of constraint imposed on the component. For the case of a simple bar constrained rigidly at both ends, the thermal stress, s, developed by a temperature change, DT, is: s=aEDT (Eq 14.25) where a is the linear coefficient of thermal ex- pansion, and E is the modulus of elasticity. If failure occurs during one cycle of thermal stress because of a rapid temperature change, the phenomenon is known as thermal shock, while failures occurring after multiple thermal stress cycles caused by a cyclic temperature change are referred to as thermal fatigue. An example of thermal fatigue occurs in ceramic thermal bar- rier coatings that are applied to nickel-base superalloys used in jet engines. The large dif- ferences in the coefficients of thermal expansion of the ceramic coating and the underlying nickel blade result in cracking and spalling of the coating. Another example of thermal fatigue occurs in electronics. Heat generated during operation of electronic devices can cause fatigue of the soldered joints. The tendency for thermal fatigue has been related to the parameter: sfk=Ea (Eq 14.26) where sf is the mean fatigue strength, and k is the thermal conductivity. A high value of this parameter indicates good resistance to thermal fatigue. 14.11 Fatigue Life Improvement One of the most effective methods of improving fatigue life is to induce residual compressive stresses on the surface of the part. This is often accomplished by shot peening or by surface rolling with contoured rollers. Shot peening involves propelling fine steel or cast iron shot into the surface at high velocities. The severity of the stress produced by shot peening is monitored by measuring the residual deforma- tion of shot-peened specimens called Almen strips. In addition to inducing compressive stress on the surface, the surface layers are also strengthened by the cold working that occurs during shot peening. Important variables in shot peening include the hardness of the shot, the size, the shape, and the velocity. Shot peening must be carefully controlled so as not to intro- duce surface damage to the part. Shot peening Fig. 14.25 Effect of corrosion on fatigue performance Fatigue Technology, Inc. Zone of compressive residual stress extends one radius from edge of hole Surface surrounding hole is yielded beyond elastic limit Tension zone beyond compression zone Fig. 14.26 Residual-stress state around cold-worked hole 260 / Elements of Metallurgy and Engineering Alloys © 2008 ASM International. All Rights Reserved. Elements of Metallurgy and Engineering Alloys (#05224G) www.asminternational.org
  • 19. imparts greater fatigue life during high-cycle fatigue than it does for higher-stress low-cycle fatigue. In low-cycle fatigue, large stresses in the plastic range cause “fading” of the residual- stress pattern. Steel parts subjected to wear conditions are often carburized or nitrided to harden the surface for greater wear resistance. Since both of these processes also introduce residual compressive stresses on the surface, there is an improvement in fatigue life. The greatest improvement occurs where a high stress gradient occurs, as in bend- ing or torsion, with less improvement in axial loading. Nitriding is extremely effective in improving the fatigue strength of notched spec- imens. Other surface-hardening methods, such as flame or induction hardening, produce similar effects. Case hardening is more effective for components that have a stress gradient, as in bending, or where there is a notch. For axially loaded components, fatigue cracks can form under the case in the softer, weaker core at the boundary between the surface and bulk. Many large structures are assembled with mechanical fasteners. In the aerospace industry, fatigue life improvement of aluminum structures is often accomplished with cold working of fastener holes and/or installing interference fit fasteners. Since fatigue cracks often initiate at fastener holes in metallic structures, methods such as cold working fastener holes and interference fit fasteners have been developed to improve fatigue life. Both cold working and interference fit fasteners set up residual com- pressive stress fields in the metal immediately adjacent to the hole (Fig. 14.26). The applied tension stress during fatigue loading must then overcome the residual compressive stress field before the hole becomes loaded in tension. The fatigue improvement due to cold working in 2024-T851 aluminum is shown in Fig. 14.27. Cold working of holes is usually conducted using either the split-sleeve or split-mandrel method. Both methods involve pulling a man- drel through the hole that expands the hole dia- meter, creating plastic deformation of material around the hole and a resulting residual com- pressive stress field. The residual-stress field, depending on the material and the amount of expansion, will extend approximately one radius from the edge of the hole. In the split-sleeve process (Fig. 14.28), a stainless steel split sleeve is placed over a tapered mandrel and inserted into the hole. The hole is cold worked when the largest part of the mandrel is drawn back through the sleeve. After cold working, the sleeve is removed and discarded. In the split-mandrel process, a collapsible mandrel is placed in the 20 25 30 35 40 45 150 200 250 300 Metal With No Hole Cold Worked Open Hole Tight Fit Fastener in Cold Worked Hole Reamed Open Hole Tight Fit Fastener in Reamed Hole 104 105 106 107 Cycles to Failure Maximum Net Stress (ksi) Maximum Net Stress (MPa) 2024-T851 Al Fig. 14.27 Fatigue life improvement with cold working. Source: Ref 13 Chapter 14: Fatigue / 261 © 2008 ASM International. All Rights Reserved. Elements of Metallurgy and Engineering Alloys (#05224G) www.asminternational.org
  • 20. hole, and as the mandrel is withdrawn, it expands to cold work the hole. Interference fit fasteners can also be used in metallic structures to improve fatigue life. When an interference fit fastener is installed in metal, it also plastically deforms a small zone around the hole, setting up a compressive stress field, which again is beneficial when fatigue loading is pri- marily tensile. The amount of interference can vary, depending on structural requirements, but it is usually in the range of 0.07 to 0.10 mm (0.003 to 0.004 in.). In some highly loaded holes, both cold working and interference fit fasteners are used. While cold working and the use of interference fit fasteners are proven methods of improving fatigue resistance, both increase assembly costs and should only be specified when they are really needed. Castings can be hot isostatic pressed (HIP) to help reduce internal porosity. The HIP of alu- minum castings is usually conducted using argon pressure at 105 MPa (15 ksi) and tem- peratures in the range of 480 to 525 C (900 to 980 F). The use of HIP usually results in improved mechanical properties, especially fatigue strength, but, of course, it adds to the cost and cycle time. The improvement in fatigue life for the aluminum casting alloy A201.0-T7 as a result of HIP is shown in Fig. 14.29. 14.12 Fatigue Design Methodologies Since the 1800s, a number of design philo- sophies or methodologies have evolved to deal with design against fatigue failures. Infinite-Life Design. This is the oldest of the design philosophies and is based on maintaining the stresses at some fraction below the fatigue strength of the metal. The initial material is assumed to be free of flaws. This methodology is based on the classic S-N curve. It is most Fig. 14.28 Split-sleeve cold working process. Reprinted with permission from SAE Paper # 982145 # 1998 SAE International. Source: Ref 14 262 / Elements of Metallurgy and Engineering Alloys © 2008 ASM International. All Rights Reserved. Elements of Metallurgy and Engineering Alloys (#05224G) www.asminternational.org
  • 21. applicable when the component is only stressed in the elastic range and displays a distinct endurance limit, such as for steels. Although it has largely been superseded by later methodol- ogies, it is simple to use and can be useful where periodic inspection is either impractical or not warranted. However, since it is a con- servative methodology, it usually results in a heavier design than some of the later meth- odologies. Safe-life design is based on the assumption that the part is initially flaw-free and has a fine life in which to develop a critical crack size. Like the infinite-life methodology, safe-life assumes an initial flaw-free component. This methodol- ogy was developed to account for parts that were subjected to higher loads that produced plastic strains. Under these conditions, the description of local events in terms of strain made more sense and resulted in the development of assessment techniques that used strain as a determining quantity, that is, log strain (e) ver- sus log number of cycles (N). The failure cri- terion is usually the detection of a small crack or some equivalent measure related to a substantial change in load-deflection response, although failure may also be defined as fracture. Fail-Safe Design. The fail-safe design phi- losophy assumes that fatigue cracks will be detected and repaired before they lead to failure. This methodology was developed in the aircraft industry where large safety margins were weight-prohibitive. Fail-safe designs incorporate multiple load paths and crack stoppers in the structure. In other words, if a primary load path fails, the load will be picked up by an alternate load path to prevent the struc- ture from failing. A major part of this metho- dology is rigid certification criteria along with the capability to detect and inspect cracks. Damage-tolerant design is the latest design methodology and is an extension of fail-safe design. The refinement of the damage-tolerant methodology is the assumption that structures do contain cracks and that fracture mechanics approaches can be used to determine crack growth rates. If the crack growth rate can be cal- culated, it is then possible to inspect the structure at various intervals and either repair or retire it prior to the crack reaching critical dimensions. Although much progress has been made in the design against fatigue failures, they still occur with disturbing frequency. For any design, it is imperative that part or component testing be conducted prior to placing the part in service. In addition, it is important that the test conditions are representative of the actual environment that the component will experience in service. REFERENCES 1. Fatigue Failures, Failure Analysis and Prevention, Vol 11, ASM Handbook, ASM International, 2002 Fig. 14.29 Effect of hot isostatic pressing (HIP) on fatigue life of A201.0-T7 aluminum casting. Source: Ref 15 Chapter 14: Fatigue / 263 © 2008 ASM International. All Rights Reserved. Elements of Metallurgy and Engineering Alloys (#05224G) www.asminternational.org
  • 22. 2. S. Kalpakjian, Manufacturing Engineering and Technology, 3rd ed. Addison-Wesley Publishing Co., 1995 3. Properties and Selection of Metals, Vol 1, Metals Handbook, 8th ed., American Society for Metals, 1961 4. R.A. Higgins, Engineering Metallurgy— Applied Physical Metallurgy, 6th ed., Arnold, 1993 5. M.A. Meyers and K.K. Chawla, Mechanical Metallurgy—Principles and Applications, Prentice-Hall Inc., 1984 6. C.M. Laird, STP 415, American Society for Testing and Materials, 1966, p 130 7. T.L. Anderson, Fracture Mechanics: Fun- damentals and Applications, 3rd ed., Taylor Francis, 2005 8. J. Collins and S. Daniewicz, Failure Considerations, Mechanical Engineers Handbook, John Wiley Sons, Inc., 1998 9. M.R. Mitchell, Fundamentals of Modern Fatigue Analysis for Design, Fatigue and Fracture, Vol 19, ASM Handbook, ASM International, 1996 10. R.C. Juvinall, Stress, Strain, and Strength, McGraw-Hill Book Co., 1967 11. G.E. Dieter, Mechanical Metallurgy, 3rd ed., McGraw-Hill Book Co., 1986, p. 375–431 12. G.E. Toten, et al., Factors Relating to Heat Treating Operations, Failure Analysis and Prevention, Vol 11, ASM Handbook, ASM International, 2002 13. F.C. Campbell, Manufacturing Technology for Aerospace Structural Materials, Else- vier Scientific, 2006 14. A. Leon, “Developments in Advanced Coldworking,” SAE 982145, Society of Automotive Engineers, 1998 15. J.R. Davis, ASM Specialty Handbook: Aluminum and Aluminum Alloys, ASM International, 1993 SELECTED REFERENCES M.F. Ashby and D.R.H. Jones, Engineering Materials 1 — An Introduction to Their Properties and Applications, 2nd ed., But- terworth Heinemann, 1996 T.H. Courtney, Mechanical Behavior of Materials, 2nd ed., McGraw-Hill Book Co., 2000, p 566–629 H.W. Hayden, W.G. Moffatt, and J. Wulf, The Structure and Properties of Materials, Vol III, John Wiley, 1965 M.P. Kaplan and T.A. Wolff, Fatigue-Life Assessment, Failure Analysis and Preven- tion, Vol 11, ASM Handbook, ASM Inter- national, 2002 E. Krempl, Design for Fatigue Resistance, Materials Selection and Design, Vol 20, ASM Handbook, ASM International, 1997 R.A. Lund and S. Sheybany, Fatigue Frac- ture Appearances, Failure Analysis and Prevention, Vol 11, ASM Handbook, ASM International, 2002 264 / Elements of Metallurgy and Engineering Alloys © 2008 ASM International. All Rights Reserved. Elements of Metallurgy and Engineering Alloys (#05224G) www.asminternational.org
  • 23. ASM International is the society for materials engineers and scientists, a worldwide network dedicated to advancing industry, technology, and applications of metals and materials. ASM International, Materials Park, Ohio, USA www.asminternational.org This publication is copyright © ASM International® . All rights reserved. Publication title Product code Elements of Metallurgy and Engineering Alloys 05224G To order products from ASM International: Online Visit www.asminternational.org/bookstore Telephone 1-800-336-5152 (US) or 1-440-338-5151 (Outside US) Fax 1-440-338-4634 Mail Customer Service, ASM International 9639 Kinsman Rd, Materials Park, Ohio 44073-0002, USA Email CustomerService@asminternational.org In Europe American Technical Publishers Ltd. 27-29 Knowl Piece, Wilbury Way, Hitchin Hertfordshire SG4 0SX, United Kingdom Telephone: 01462 437933 (account holders), 01462 431525 (credit card) www.ameritech.co.uk In Japan Neutrino Inc. Takahashi Bldg., 44-3 Fuda 1-chome, Chofu-Shi, Tokyo 182 Japan Telephone: 81 (0) 424 84 5550 Terms of Use. This publication is being made available in PDF format as a benefit to members and customers of ASM International. You may download and print a copy of this publication for your personal use only. Other use and distribution is prohibited without the express written permission of ASM International. No warranties, express or implied, including, without limitation, warranties of merchantability or fitness for a particular purpose, are given in connection with this publication. Although this information is believed to be accurate by ASM, ASM cannot guarantee that favorable results will be obtained from the use of this publication alone. This publication is intended for use by persons having technical skill, at their sole discretion and risk. Since the conditions of product or material use are outside of ASM's control, ASM assumes no liability or obligation in connection with any use of this information. As with any material, evaluation of the material under end-use conditions prior to specification is essential. Therefore, specific testing under actual conditions is recommended. Nothing contained in this publication shall be construed as a grant of any right of manufacture, sale, use, or reproduction, in connection with any method, process, apparatus, product, composition, or system, whether or not covered by letters patent, copyright, or trademark, and nothing contained in this publication shall be construed as a defense against any alleged infringement of letters patent, copyright, or trademark, or as a defense against liability for such infringement.