Download to read offline


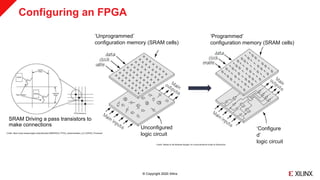
![© Copyright 2020 Xilinx
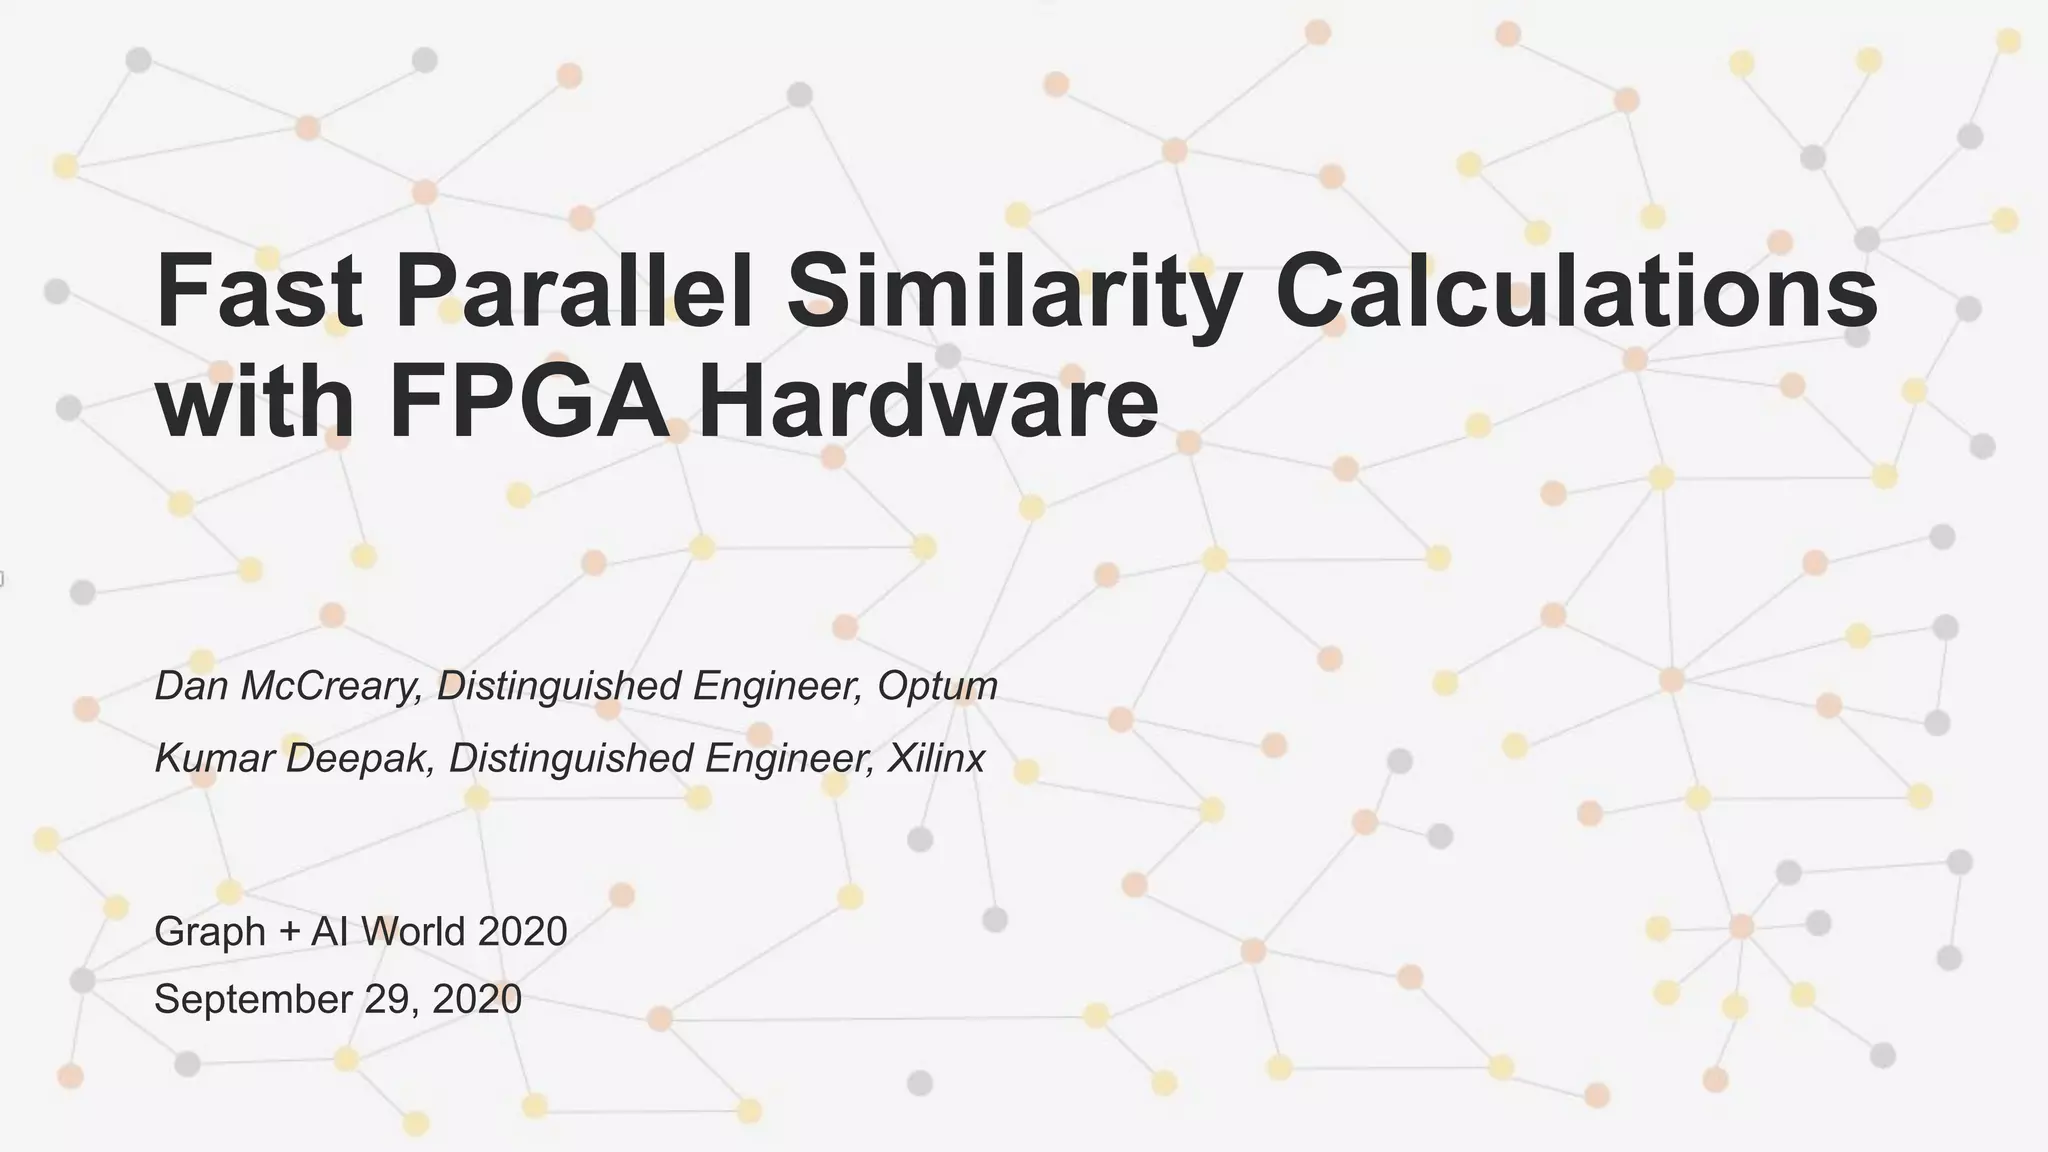
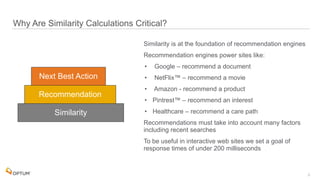
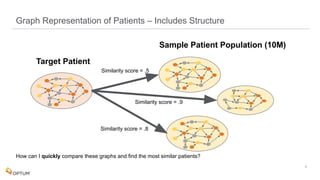
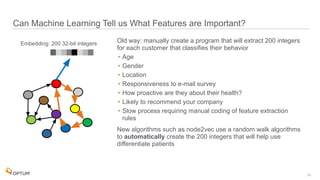
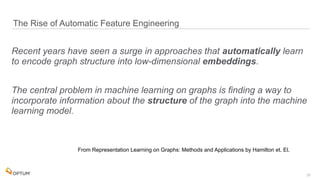
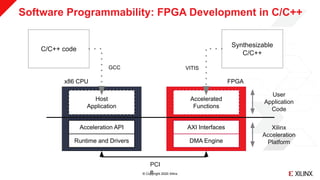
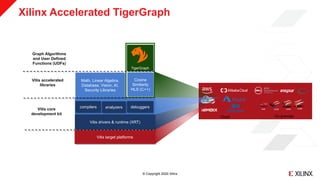
Using C, C++ or OpenCL to Program FPGAs
˃ Xilinx pioneered C to FPGA compilation technology (aka “HLS”) in 2011
˃ No need for low-level hardware description languages
˃ FPGAs are “Software Programmable”
loop_main:for(int j=0;j<NUM_SIMGROUPS;j+=2) {
loop_share:for(uint k=0;k<NUM_SIMS;k++) {
loop_parallel:for(int i=0;i<NUM_RNGS;i++) {
mt_rng[i].BOX_MULLER(&num1[i][k],&num2[i][k],ratio4,ratio3);
float payoff1 = expf(num1[i][k])-1.0f;
float payoff2 = expf(num2[i][k])-1.0f;
if(num1[i][k]>0.0f)
pCall1[i][k]+= payoff1;
else
pPut1[i][k]-=payoff1;
if(num2[i][k]>0.0f)
pCall2[i][k]+=payoff2;
else
pPut2[i][k]-=payoff2;
}
}
}
FPGAVitis Compiler (v++)](https://image.slidesharecdn.com/graph-ai-fpga-201210011141/85/Fast-Parallel-Similarity-Calculations-with-FPGA-Hardware-30-320.jpg)
![© Copyright 2020 Xilinx
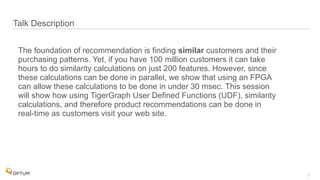
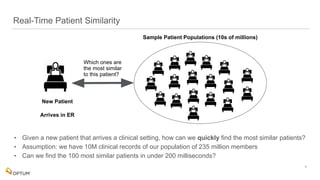
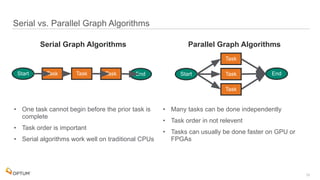
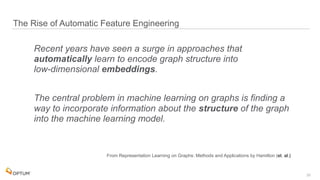
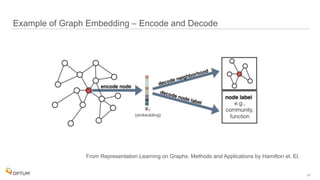
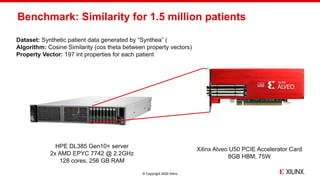
Cosine Similarity: Accelerated Function
extern "C" void topKCosSim(uint32_t p_n, …, KVResType* p_res) {
…
for (int i = 0; i < SPATIAL_numChannels; i++) {
#pragma HLS UNROLL
patientInfoParse<>(p_n, p_m, l_strXs[i], l_dataX[i], l_normX[i]);
patientInfoParse<>(p_n, p_m, l_strY[i], l_dataY[i], l_id[i], l_normY[i]);
cos<SPATIAL_logParEntries, SPATIAL_macDataType,
SPATIAL_indexType>(p_n, p_m, l_dataX[i], l_dataY[i], l_normX[i], l_normY[i],
l_dis[i]);
addKey<>(p_m, l_id[i], l_dis[i], l_pair[i]);
}
mergeStream<SPATIAL_numChannels>(p_m, l_pair, l_merge);
maxK<SPATIAL_maxK>(p_m * SPATIAL_numChannels, p_k, l_merge, l_res);
stream2mem<>(p_k, l_res, p_res);
}
v++ similarity.xclbin](https://image.slidesharecdn.com/graph-ai-fpga-201210011141/85/Fast-Parallel-Similarity-Calculations-with-FPGA-Hardware-34-320.jpg)
![© Copyright 2020 Xilinx
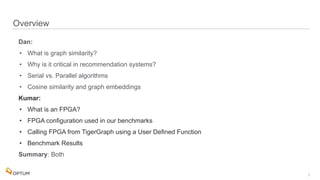
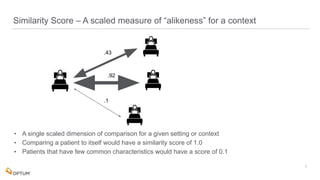
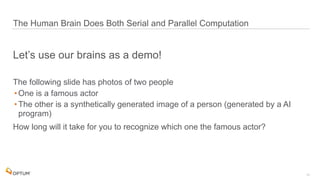
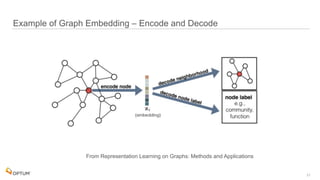
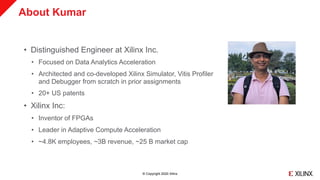
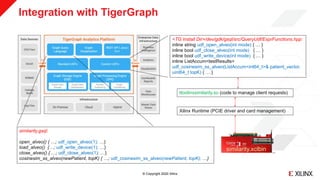
Cosine Similarity: Host Application
…
for (unsigned int di = 0;di<deviceCount; di++){
KVResType* l_res0_tmp;
KVResType* l_res1_tmp;
posix_memalign((void**)&l_res0_tmp, 4096, l_k * sizeof(KVResType));
memset(l_res0_tmp, 0, l_k * sizeof(KVResType));
posix_memalign((void**)&l_res1_tmp, 4096, l_k * sizeof(KVResType));
memset(l_res1_tmp, 0, l_k * sizeof(KVResType));
l_res0[di]=l_res0_tmp;
l_res1[di]=l_res1_tmp;
xfspatialSendMat(l_res0[di], l_k * sizeof(KVResType), 35, 1, di);
xfspatialSendMat(l_res1[di], l_k * sizeof(KVResType), 32, 0, di);
xfspatialTopKCosSim(appContext->m_vecX0, l_res0[di], l_n, l_m, l_k, 1, di);
xfspatialTopKCosSim(appContext->m_vecX1, l_res1[di], l_n, l_m, l_k, 0, di);
}
xfspatialExecuteKernelAsync(2, deviceCount);
…
Compile (g++) libxilinxsimilarity.so](https://image.slidesharecdn.com/graph-ai-fpga-201210011141/85/Fast-Parallel-Similarity-Calculations-with-FPGA-Hardware-35-320.jpg)
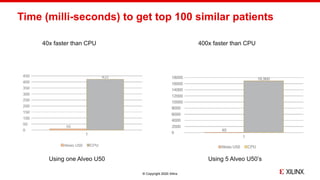

The document discusses the implementation of fast parallel similarity calculations using FPGA hardware to enhance recommendation systems. It highlights how using FPGA can significantly reduce the calculation time to under 30 milliseconds, allowing real-time recommendations for millions of customers. The session covers comparison methods, the importance of similarity in various applications, and the architecture of FPGA in optimizing data analytics.


![제 23회 보아즈(BOAZ) 빅데이터 컨퍼런스 - [MBOAX] : ABSA를 활용한 소비자 반응 분석 기반 운영 효율화 대시보드 설계](https://cdn.slidesharecdn.com/ss_thumbnails/3-1boaz23rdconferencemboax-260203102709-9d519923-thumbnail.jpg?width=640&height=640&fit=bounds)


