Downloaded 18 times


![© 2020. ALL RIGHTS RESERVED. | TIGERGRAPH.COM | CONFIDENTIAL INFORMATION |
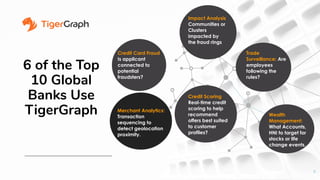
Detecting Fraud Rings with TigerGraph
17
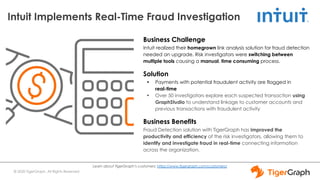
Business Challenge
A leading U.S. bank wanted a better way to detect and remove
fraudsters from their credit-card network. Prototypes had shown
that a combination of advanced graph algorithms gave significant
gains – big-data tools and other graph technologies either couldn’t
scale to the full customer base or gave inconsistent results.
Solution
• Implementing PageRank and Louvain [fraud] community
detection in an MPP native-parallel database.
• Leveraging deep analytics to find hidden connections across
20TB+ of data.
Business Benefits
• Able to expose fraud rings, shut down connected cards, and
combat fraudulent activity on a massive scale –35% uplift
and $50M incremental fraud avoidance. >$1.5 million through
cost savings on false positives, infrastructure and TCO
Tier 1 U.S. Bank
10TB
Card applications
data
6 weeks
PoC elapsed time
3 months
Time to build and fully deploy
platform to production
+$50M
1st
year ROI with 35%
uplift in fraud detection
CLV Impact > $200M](https://image.slidesharecdn.com/graphaiforfin-201210022042/85/Graph-AI-for-Fin-Services-17-320.jpg)


The document presents the advancements in graph analytics for financial services, highlighting the use of TigerGraph technology by major banks to combat fraud and improve operational efficiency. Key challenges involve integrating diverse data sources and addressing issues of speed and scale, with real-time solutions demonstrating significant ROI. Case studies show how graph technology aids in fraud detection, risk assessment, and customer credit evaluations across various financial institutions.


![Tiger graph 2021 corporate overview [read only]](https://cdn.slidesharecdn.com/ss_thumbnails/tigergraph2021corporateoverviewread-only-211014093106-thumbnail.jpg?width=640&height=640&fit=bounds)


![[DSC DACH 23] Connecting the Dots: Graph Analytics for Economic Sustainabilit...](https://cdn.slidesharecdn.com/ss_thumbnails/diogobraga-dscdach23-connectingthedots-230424081719-834d5b69-thumbnail.jpg?width=640&height=640&fit=bounds)