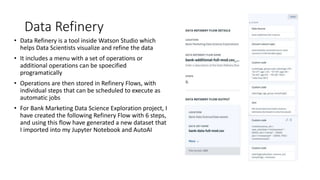
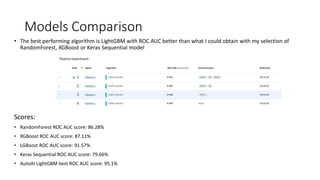
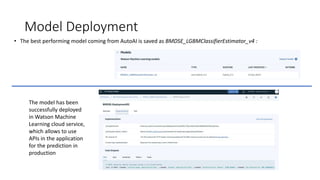
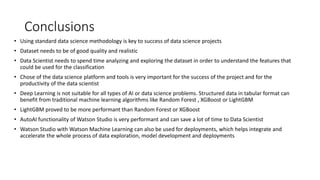
Bank Marketing Data Science Exploration
Advanced Data Science Course - Capstone Project
Sasha Lazarevic, Dec 2019
https://www.linkedin.com/in/LZRVC/
Data Scientist‘s Deck
Problem Statement
• A Bank would like to understand which customers will accept the
bank‘s offer for a loan. A realistic dataset has been gathered as
presented with 21 columns and 41188 rows, which can be used to
train our model.
• Some customers have accepted the offer, but majority not. What
features are important ? Can we generate or imagine to add some
new features that will imrove the quality of our prediction? What
algorithm would be the best?
Methodology
• My data science project will follow a
standard data science project
methodology with phases like
• Initial data exploration
• Exrtact, Transform, Load
• Feature Creation
• Model definition
• Model training
• Model evaluation
• Model deployment
Toolset
• I will use Watson Studio as Data Science platform with the following tools:
• Data Refinery, with which I will explore my data set and try to combine data and add some features
• Jupyter Notebook , which which I will explore the data, and develop machine learning models
• Watson Machine Learning, which will allow me to train and deploy the models
• AutoAI, which will allow me to automatically train the models and optimize the hyperparameters
Dataset
• Dataset is in csv format, uploaded in my Watson Studio Project. Here is the description of the columns
• 1 - age (numeric)
2 - job : type of job (categorical: 'admin.','blue-collar','entrepreneur','housemaid','management','retired','self-
employed','services','student','technician','unemployed','unknown')
3 - marital : marital status (categorical: 'divorced','married','single','unknown'; note: 'divorced' means divorced or widowed)
4 - education (categorical: basic.4y','basic.6y','basic.9y','high.school','illiterate','professional.course','university.degree','unknown')
5 - default: has credit in default? (categorical: 'no','yes','unknown')
6 - housing: has housing loan? (categorical: 'no','yes','unknown')
7 - loan: has personal loan? (categorical: 'no','yes','unknown')
• related with the last contact of the current campaign:
8 - contact: contact communication type (categorical: 'cellular','telephone')
9 - month: last contact month of year (categorical: 'jan', 'feb', 'mar', ..., 'nov', 'dec')
10 - day_of_week: last contact day of the week (categorical: 'mon','tue','wed','thu','fri')
11 - duration: last contact duration, in seconds (numeric). Important note: this attribute highly affects the output target (e.g., if
duration=0 then y='no'). Yet, the duration is not known before a call is performed. Also, after the end of the call y is obviously known.
Thus, this input should only be included for benchmark purposes and should be discarded if the intention is to have a realistic
predictive model.
• other attributes:
12 - campaign: number of contacts performed during this campaign and for this client (numeric, includes last contact)
13 - pdays: number of days that passed by after the client was last contacted from a previous campaign (numeric; 999 means client
was not previously contacted)
14 - previous: number of contacts performed before this campaign and for this client (numeric)
15 - poutcome: outcome of the previous marketing campaign (categorical: 'failure','nonexistent','success')
• social and economic context attributes
16 - emp.var.rate: employment variation rate - quarterly indicator (numeric)
17 - cons.price.idx: consumer price index - monthly indicator (numeric)
18 - cons.conf.idx: consumer confidence index - monthly indicator (numeric)
19 - euribor3m: euribor 3 month rate - daily indicator (numeric)
20 - nr.employed: number of employees - quarterly indicator (numeric)
• Output variable (desired target):
21 - y - has the client subscribed a term deposit? (binary: 'yes','no')
bank-additional-full-mod.csv is the main dataset
bank-data-full-mod.csv is the dataset augmented
artificially with an experimental estimate about the
clients‘ revenues
Data Exploration
• Exploration of the data , shape, number and types of columns
• Exploration of output labels, categories and counts per category
• Exploration of some features and if we can gather any intuition about their influence on the prediction outcome
• Visualization of different features in the context of outcomes
One of the graphics describing the features
Data Refinery
• Data Refinery is a tool inside Watson Studio which
helps Data Scientists visualize and refine the data
• It includes a menu with a set of operations or
additional operations can be spoecified
programatically
• Operations are then stored in Refinery Flows, with
individual steps that can be scheduled to execute as
automatic jobs
• For Bank Marketing Data Science Exploration project, I
have created the following Refinery Flow with 6 steps,
and using this flow have generated a new dataset that
I imported into my Jupyter Notebook and AutoAI
Feature Generation
• First, I have created an additional column: AGE_BINNED
• I have also added revenues_est
Feature Generation
• But these two new features were not so efficient as the artificially generated features that I got with AutoAI
Model Selection
• As the data is structured, I have used ensemble of learners and
compared them with deep learning:
• Random Forest
• XGBoost
• LightGBM
• Keras-based deep neural network (Sequential model)
Model Training
• I have converted categorical data into numeric and scaled the data from 0 to 1.
• I have splitted the dataset into training (70% ) and test (30% )
• RandomForest has a method to display the importances which is quite useful to see what features contribute the
most to the predictions
• Later I have trained XGBoost and LightGBM, and Keras sequential model with two layers and 344 parameters
Model Training
Metrics
• I’ve used ROC and Area Under Curve for the performance metrics
AutoAI
• AutoAI is the latest functionality of Watson Studio , which allows automatic machine learning of a set of models,
automatic selection of the best performing model, automatic hyperparameter tuning and feature generation
Models Comparison
• The best performing algorithm is LightGBM with ROC AUC better than what I could obtain with my selection of
RandomForest, XGBoost or Keras Sequential model
Scores:
• RandomForest ROC AUC score: 86.28%
• XGBoost ROC AUC score: 87.11%
• LGBoost ROC AUC score: 91.57%
• Keras Sequential ROC AUC score: 79.66%
• AutoAI LightGBM best ROC AUC score: 95.1%
Model Deployment
• The best performing model coming from AutoAI is saved as BMDSE_LGBMClassifierEstimator_v4 :
The model has been
successfully deployed
in Watson Machine
Learning cloud service,
which allows to use
APIs in the application
for the prediction in
production
Conclusions
• Using standard data science methodology is key to success of data science projects
• Dataset needs to be of good quality and realistic
• Data Scientist needs to spend time analyzing and exploring the dataset in order to understand the features that
could be used for the classification
• Chose of the data science platform and tools is very important for the success of the project and for the
productivity of the data scientist
• Deep Learning is not suitable for all types of AI or data science problems. Structured data in tabular format can
benefit from traditional machine learning algorithms like Random Forest , XGBoost or LightGBM
• LightGBM proved to be more performant than Random Forest or XGBoost
• AutoAI functionality of Watson Studio is very performant and can save a lot of time to Data Scientist
• Watson Studio with Watson Machine Learning can also be used for deployments, which helps integrate and
accelerate the whole process of data exploration, model development and deployments
18
Sasha Lazarevic, IBM Switzerland
https://www.linkedin.com/in/LZRVC/
LZRVC.com
ХВАЛА !
MERCI
THANK YOU
DANKE
СПАСИБО
Grazie

BMDSE v1 - Data Scientist Deck

  • 1.
    Bank Marketing DataScience Exploration Advanced Data Science Course - Capstone Project Sasha Lazarevic, Dec 2019 https://www.linkedin.com/in/LZRVC/ Data Scientist‘s Deck
  • 2.
    Problem Statement • ABank would like to understand which customers will accept the bank‘s offer for a loan. A realistic dataset has been gathered as presented with 21 columns and 41188 rows, which can be used to train our model. • Some customers have accepted the offer, but majority not. What features are important ? Can we generate or imagine to add some new features that will imrove the quality of our prediction? What algorithm would be the best?
  • 3.
    Methodology • My datascience project will follow a standard data science project methodology with phases like • Initial data exploration • Exrtact, Transform, Load • Feature Creation • Model definition • Model training • Model evaluation • Model deployment
  • 4.
    Toolset • I willuse Watson Studio as Data Science platform with the following tools: • Data Refinery, with which I will explore my data set and try to combine data and add some features • Jupyter Notebook , which which I will explore the data, and develop machine learning models • Watson Machine Learning, which will allow me to train and deploy the models • AutoAI, which will allow me to automatically train the models and optimize the hyperparameters
  • 5.
    Dataset • Dataset isin csv format, uploaded in my Watson Studio Project. Here is the description of the columns • 1 - age (numeric) 2 - job : type of job (categorical: 'admin.','blue-collar','entrepreneur','housemaid','management','retired','self- employed','services','student','technician','unemployed','unknown') 3 - marital : marital status (categorical: 'divorced','married','single','unknown'; note: 'divorced' means divorced or widowed) 4 - education (categorical: basic.4y','basic.6y','basic.9y','high.school','illiterate','professional.course','university.degree','unknown') 5 - default: has credit in default? (categorical: 'no','yes','unknown') 6 - housing: has housing loan? (categorical: 'no','yes','unknown') 7 - loan: has personal loan? (categorical: 'no','yes','unknown') • related with the last contact of the current campaign: 8 - contact: contact communication type (categorical: 'cellular','telephone') 9 - month: last contact month of year (categorical: 'jan', 'feb', 'mar', ..., 'nov', 'dec') 10 - day_of_week: last contact day of the week (categorical: 'mon','tue','wed','thu','fri') 11 - duration: last contact duration, in seconds (numeric). Important note: this attribute highly affects the output target (e.g., if duration=0 then y='no'). Yet, the duration is not known before a call is performed. Also, after the end of the call y is obviously known. Thus, this input should only be included for benchmark purposes and should be discarded if the intention is to have a realistic predictive model. • other attributes: 12 - campaign: number of contacts performed during this campaign and for this client (numeric, includes last contact) 13 - pdays: number of days that passed by after the client was last contacted from a previous campaign (numeric; 999 means client was not previously contacted) 14 - previous: number of contacts performed before this campaign and for this client (numeric) 15 - poutcome: outcome of the previous marketing campaign (categorical: 'failure','nonexistent','success') • social and economic context attributes 16 - emp.var.rate: employment variation rate - quarterly indicator (numeric) 17 - cons.price.idx: consumer price index - monthly indicator (numeric) 18 - cons.conf.idx: consumer confidence index - monthly indicator (numeric) 19 - euribor3m: euribor 3 month rate - daily indicator (numeric) 20 - nr.employed: number of employees - quarterly indicator (numeric) • Output variable (desired target): 21 - y - has the client subscribed a term deposit? (binary: 'yes','no') bank-additional-full-mod.csv is the main dataset bank-data-full-mod.csv is the dataset augmented artificially with an experimental estimate about the clients‘ revenues
  • 6.
    Data Exploration • Explorationof the data , shape, number and types of columns • Exploration of output labels, categories and counts per category • Exploration of some features and if we can gather any intuition about their influence on the prediction outcome • Visualization of different features in the context of outcomes One of the graphics describing the features
  • 7.
    Data Refinery • DataRefinery is a tool inside Watson Studio which helps Data Scientists visualize and refine the data • It includes a menu with a set of operations or additional operations can be spoecified programatically • Operations are then stored in Refinery Flows, with individual steps that can be scheduled to execute as automatic jobs • For Bank Marketing Data Science Exploration project, I have created the following Refinery Flow with 6 steps, and using this flow have generated a new dataset that I imported into my Jupyter Notebook and AutoAI
  • 8.
    Feature Generation • First,I have created an additional column: AGE_BINNED • I have also added revenues_est
  • 9.
    Feature Generation • Butthese two new features were not so efficient as the artificially generated features that I got with AutoAI
  • 10.
    Model Selection • Asthe data is structured, I have used ensemble of learners and compared them with deep learning: • Random Forest • XGBoost • LightGBM • Keras-based deep neural network (Sequential model)
  • 11.
    Model Training • Ihave converted categorical data into numeric and scaled the data from 0 to 1. • I have splitted the dataset into training (70% ) and test (30% ) • RandomForest has a method to display the importances which is quite useful to see what features contribute the most to the predictions • Later I have trained XGBoost and LightGBM, and Keras sequential model with two layers and 344 parameters
  • 12.
  • 13.
    Metrics • I’ve usedROC and Area Under Curve for the performance metrics
  • 14.
    AutoAI • AutoAI isthe latest functionality of Watson Studio , which allows automatic machine learning of a set of models, automatic selection of the best performing model, automatic hyperparameter tuning and feature generation
  • 15.
    Models Comparison • Thebest performing algorithm is LightGBM with ROC AUC better than what I could obtain with my selection of RandomForest, XGBoost or Keras Sequential model Scores: • RandomForest ROC AUC score: 86.28% • XGBoost ROC AUC score: 87.11% • LGBoost ROC AUC score: 91.57% • Keras Sequential ROC AUC score: 79.66% • AutoAI LightGBM best ROC AUC score: 95.1%
  • 16.
    Model Deployment • Thebest performing model coming from AutoAI is saved as BMDSE_LGBMClassifierEstimator_v4 : The model has been successfully deployed in Watson Machine Learning cloud service, which allows to use APIs in the application for the prediction in production
  • 17.
    Conclusions • Using standarddata science methodology is key to success of data science projects • Dataset needs to be of good quality and realistic • Data Scientist needs to spend time analyzing and exploring the dataset in order to understand the features that could be used for the classification • Chose of the data science platform and tools is very important for the success of the project and for the productivity of the data scientist • Deep Learning is not suitable for all types of AI or data science problems. Structured data in tabular format can benefit from traditional machine learning algorithms like Random Forest , XGBoost or LightGBM • LightGBM proved to be more performant than Random Forest or XGBoost • AutoAI functionality of Watson Studio is very performant and can save a lot of time to Data Scientist • Watson Studio with Watson Machine Learning can also be used for deployments, which helps integrate and accelerate the whole process of data exploration, model development and deployments
  • 18.
    18 Sasha Lazarevic, IBMSwitzerland https://www.linkedin.com/in/LZRVC/ LZRVC.com ХВАЛА ! MERCI THANK YOU DANKE СПАСИБО Grazie