Download as PDF, PPTX


![| GRAPHAIWORLD.COM | #GRAPHAIWORLD |
Example
25
package intraprocedural.basic;
public class Basic1 {
public static void main(String[] args) {
int a = 3;
int b = 2;
int c = a + b;
}
}](https://image.slidesharecdn.com/fvsjlvgraphaiworldplumeslides-201210021347/75/Plume-A-Code-Property-Graph-Extraction-and-Analysis-Library-25-2048.jpg)
![| GRAPHAIWORLD.COM | #GRAPHAIWORLD |
Example
26
package intraprocedural.conditional;
public class Conditional1 {
public static void main(String[] args) {
int a = 1;
int b = 2;
if (a > b) {
a -= b;
b -= b;
} else {
b += a;
}
}
}](https://image.slidesharecdn.com/fvsjlvgraphaiworldplumeslides-201210021347/75/Plume-A-Code-Property-Graph-Extraction-and-Analysis-Library-26-2048.jpg)
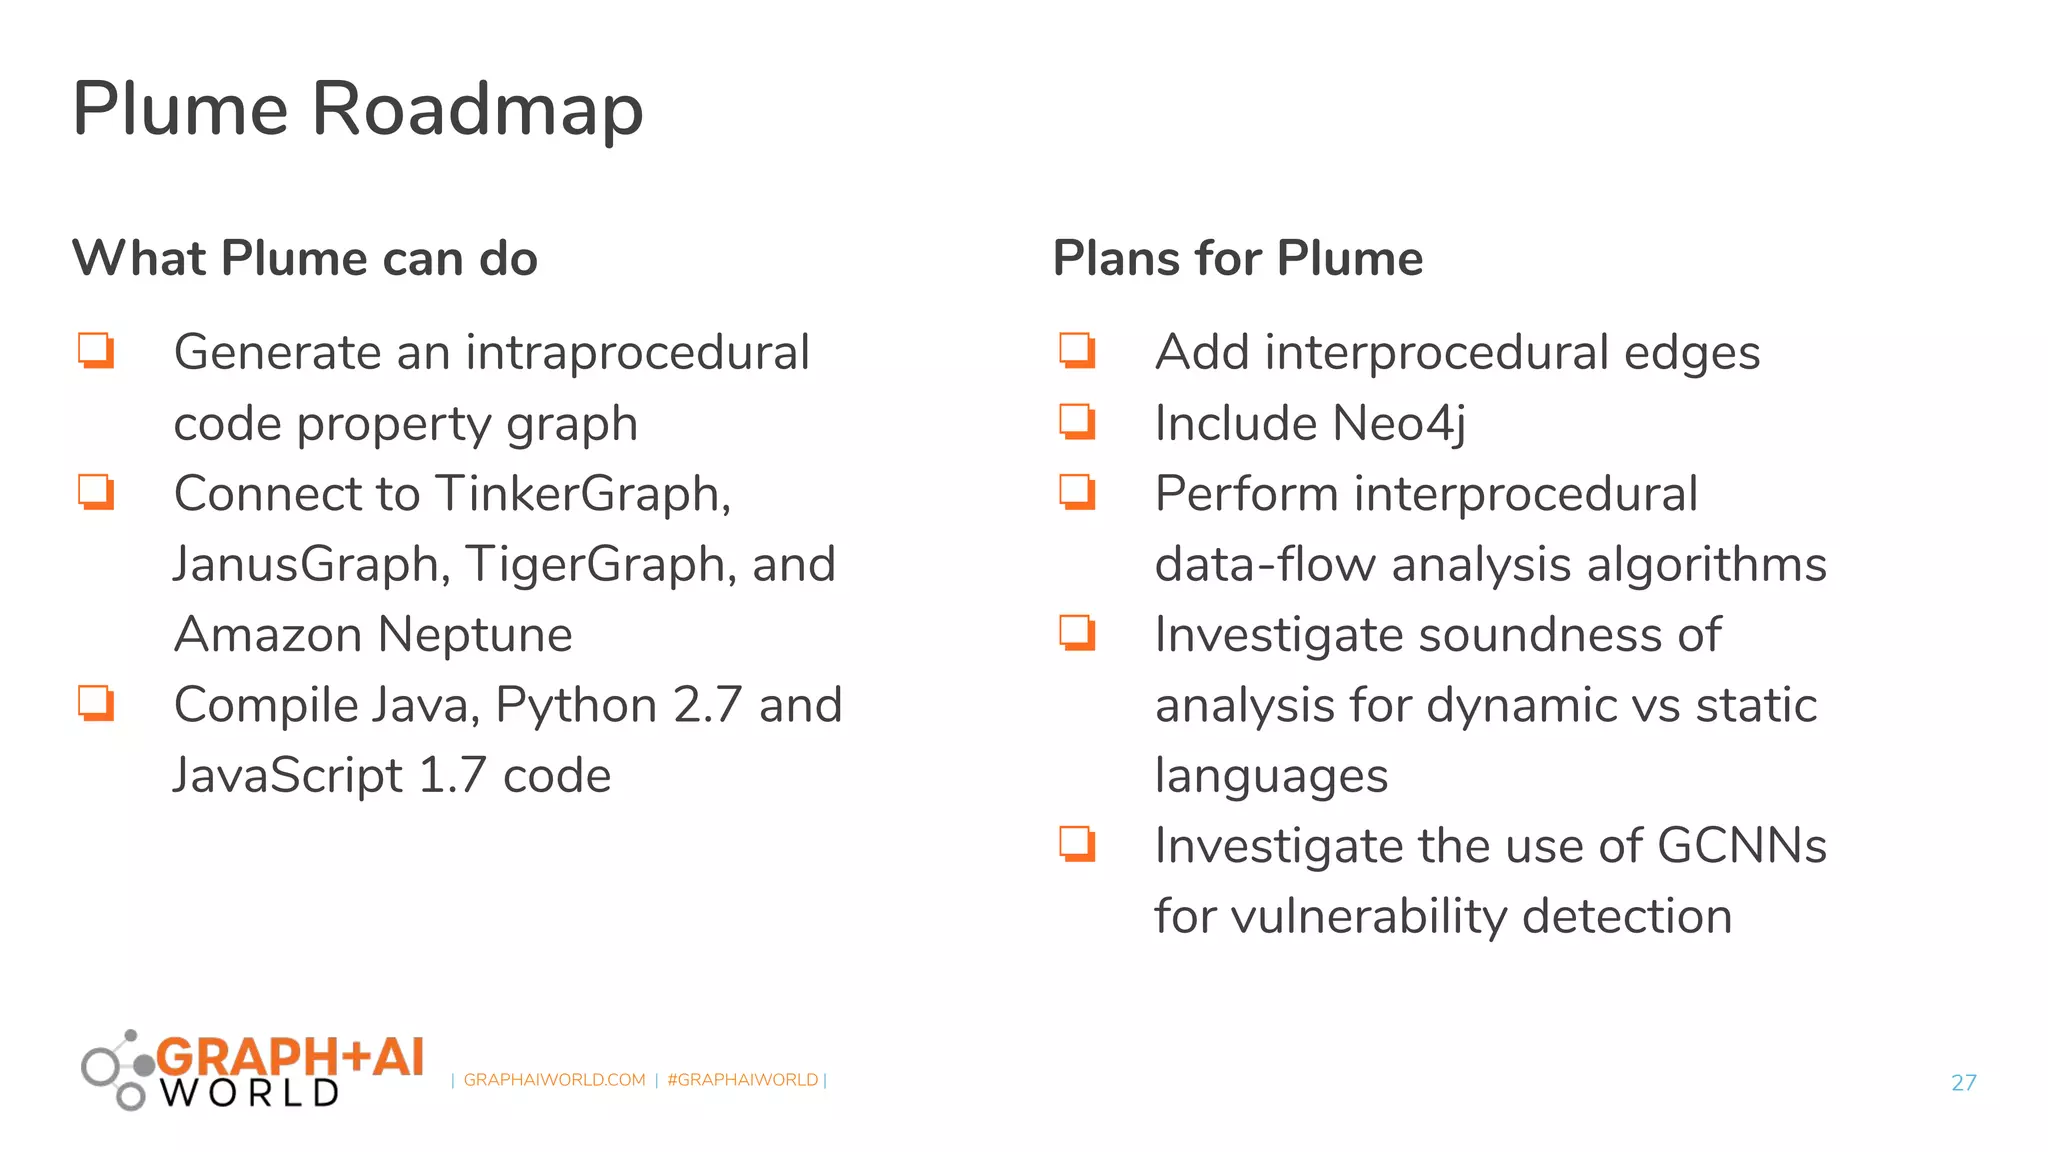

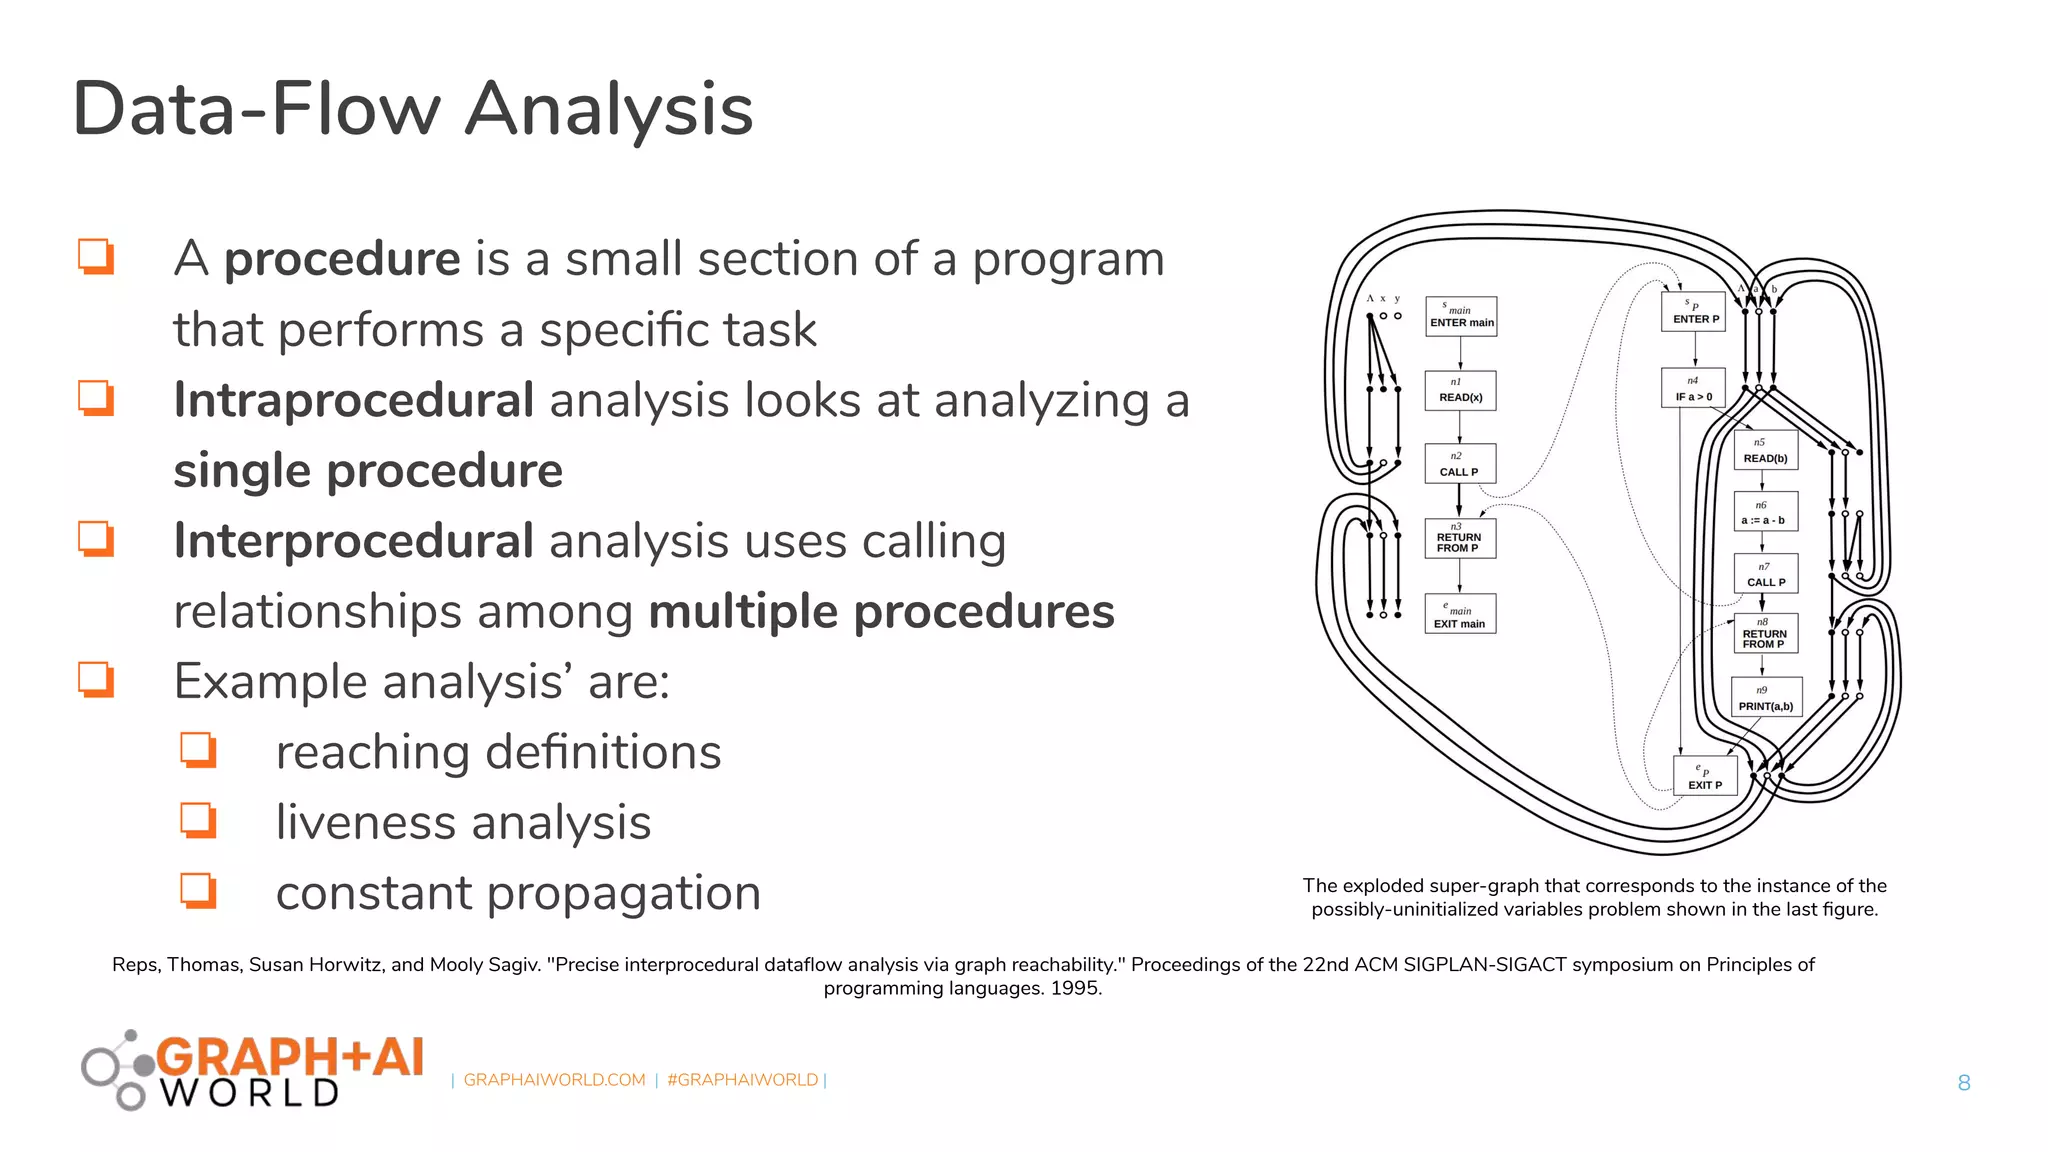
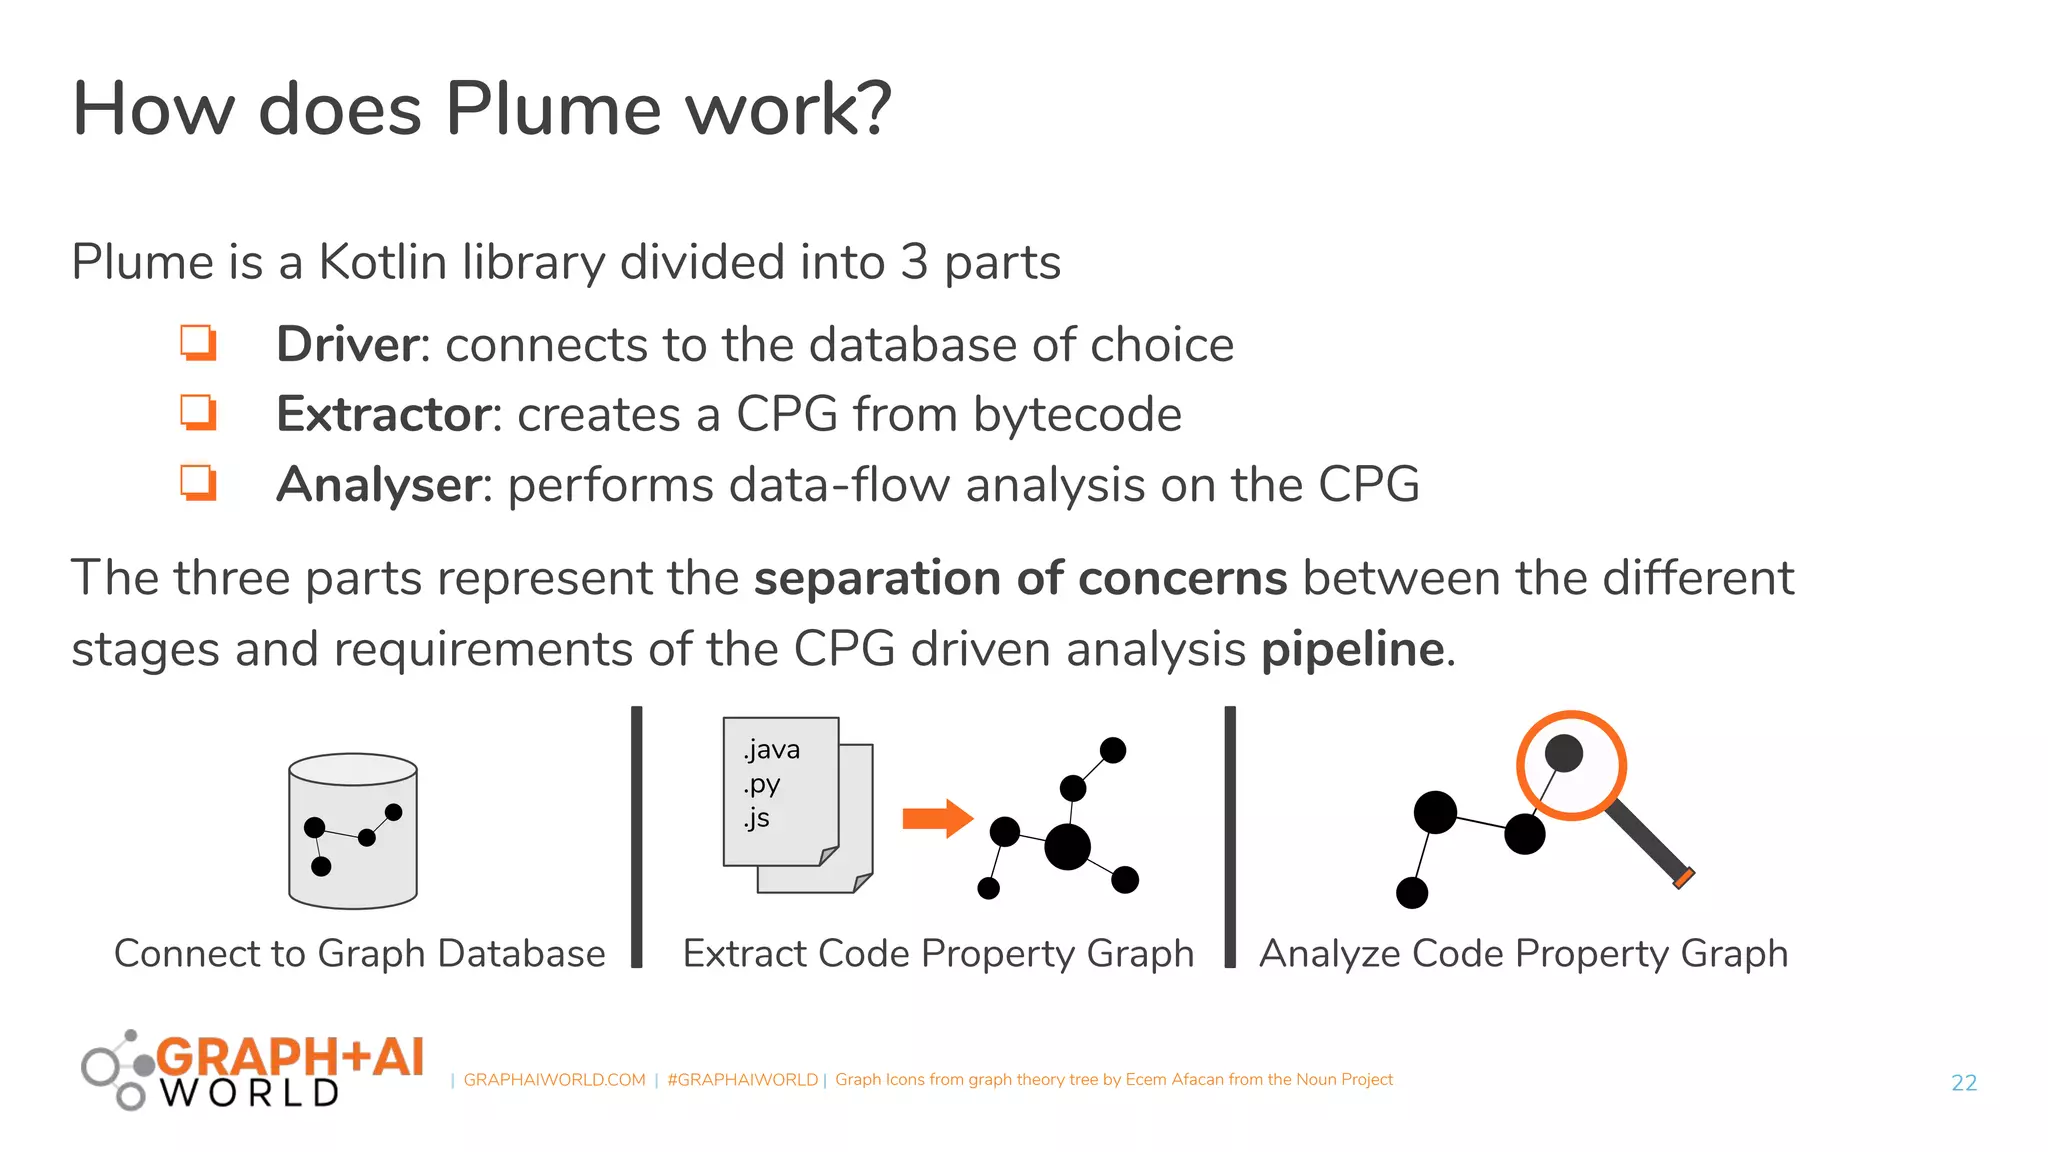
Plume is an open-source static analysis library that utilizes code property graphs (CPGs) extracted from JVM bytecode to enable data-flow analysis using graph databases. It incorporates synchronized pushdown systems for nuanced analysis, handling various programming languages while allowing for scalable and incremental updates. Plume aims to support multiple graph databases and provides a framework for implementing interprocedural edges and advanced analysis techniques.